Abstract
To understand the genetic relationships of Castanea species, 16 phenotypic traits were measured, simple sequence repeat (SSR) markers were analyzed, and molecular identity cards (IDs) were constructed for 118 Castanea materials using fluorescent capillary electrophoresis. The coefficient of variation values of the 16 morphological traits of the test materials ranged from 11.11% to 60.38%. A total of 58 alleles were detected using six pairs of SSR core primers, with an average number of 9.7 alleles per locus. The average number of valid alleles per locus was 3.9419 and the proportion of valid alleles was 40.78%. A total of 105 genotypes were detected, and the number of genotypic species that could be amplified per primer pair ranged from 8 to 26. The mean value of the observed heterozygosity was 0.4986. The variation in the He, H, and PIC values was similar; the size of I value was approximately 2.21 times larger, and its mean number of variations was 0.7390, 0.7359, 0.6985, and 1.6015, respectively. The classification of 118 Castanea species was performed using three analytical methods: structure analysis, neighbor-joining (NJ) cluster analysis, and principal coordinate analysis (PCoA), and the results of the three methods were in high agreement. Six pairs of SSR core primers with high polymorphism and strong discriminatory properties were used to identify 118 Castanea plants, and a unique molecular ID card was constructed for each material. These results provide insight into the genetic diversity and population structure of Castanea plants and a theoretical basis for improving the phenomenon of mixed varieties and substandard plants in the Castanea plant market.
1. Introduction
The Castanea, which is cross-pollinated, includes seven major species: Castanea mollissima Bl., Castanea henryi (Skam) Rehd. et Wils., Castanea seguinii Dode, Castanea crenata S. et Z., Castanea dentata (Marsh.) Brokh, Castanea sativa Mill., and Castanea pumila Mill. Among them, the Chinese chestnut (C. mollissima Bl.) exhibits superior disease resistance traits, such as exhibiting resistance to two major pathogens, Cryphonectria parasitica and Phytophthora cinnamomic [1]. Chinese chestnut has very high commercial economic value in terms of disease resistance and fruit quality. As a result, it may be a useful resource in the selection and breeding of resistant Castanea plants and has a crucial role. Castanea has comparatively high nutritional value due to its essential amino acids, fatty acids, vitamins, minerals, dietary fiber, and other nutrients. Additionally, cooked Castanea can strengthen the spleen, tone the kidneys, and nourish the stomach. It also has beneficial preventive and therapeutic effects on coronary heart disease, hypertension, and atherosclerosis [2,3]. However, there exist outstanding issues in the breeding, cultivation, and consumption of the Castanea, such as hybridization of varieties and homonyms; this has led to a rise in imitation and inferior varieties and caused losses to breeders, farmers, and consumers. Therefore, there is an urgent need to establish an accurate, rapid, and efficient method for breed identification.
With the rapid development of molecular biology, a variety of molecular marker technologies, such as randomly amplified polymorphic DNA (RAPD), amplified fragment length polymorphism (AFLP), simple sequence repeat (SSR) and single nucleotide polymorphism (SNP), have been widely used in the analysis of genetic diversity and plant variety identification. SSR molecular marker technology involves tandem repeat sequence consisting of 1–6 nucleotides as repeat units, which has excellent characteristics such as co-dominant inheritance, high polymorphism, good reproducibility, and stable and accurate results. It has emerged as a key molecular marker technology for plant genetic diversity analysis, population structure research, variety identification, and molecular ID construction [4,5,6,7,8].
The construction of various molecular ID cards is a highly efficient method for identifying germplasm resources and has been widely used for the identification and authentication of a variety of plants [9,10]. Molecular ID cards can not only digitize DNA molecular data but also combine molecular data with botanical taxonomic information, phenotypic trait information, selective breeding information, and other information. Molecular ID cards are also of great importance for germplasm resource management, which can carry out the fine-grained management of germplasm resources in a clear and systematic manner, and are conducive to organizing, conserving and managing germplasm resources. By generating QR code molecular ID cards, the molecular and phenotypic information of plants can be obtained through the act of scanning, which can contribute to more convenient, rapid, detailed, and comprehensive understanding of plant resources. The molecular ID cards are unique and can be identified by constructing unique ID cards for each species. Among the studies on Castanea plants, there are few reports on the construction of molecular ID cards for Castanea plants.
In this study, the genetic diversity and population structure of 118 materials from four species of Castanea were analyzed and systematically described using SSR molecular markers and fluorescence capillary electrophoresis; an exclusive molecular ID card was constructed for each material and used to identify the 118 distinct materials. The results of this study provide a molecular basis for understanding the genetic diversity and population structure of germplasm resources of Castanea and will serve as a reference for solving the problems of homonymy and synonymy.
2. Results
2.1. Phenotypic Traits and Morphological Analysis of Appearance
The coefficient of variation values of the 16 morphological traits of the test materials ranged from 11.11% to 60.38% (Table 1), among which the coefficient of variation values of the five traits, namely single cone weight, cone shell thickness, single nut weight, stigma length, and single kernel weight, were all higher than 30%. In addition, the coefficient of variation values of all morphological traits was in the range of 20%−30%, except for the minimum value of 11.11% for fruit shape index. Cluster analysis of phenotypic traits was performed based on the mean values of phenotypic trait data of the test materials (Table S1), and the results of the analysis divided 118 Castanea plant materials into four groups (Figure 1), namely Taxon I, Taxon II, Taxon III, and Taxon IV. Taxon i included 21 materials, Taxon II included 38 materials, Taxon III included 31 materials, and Taxon IV included 28 materials.

Table 1.
Descriptive statistical analysis of phenotypic traits used for characterization of the Castanea varieties.
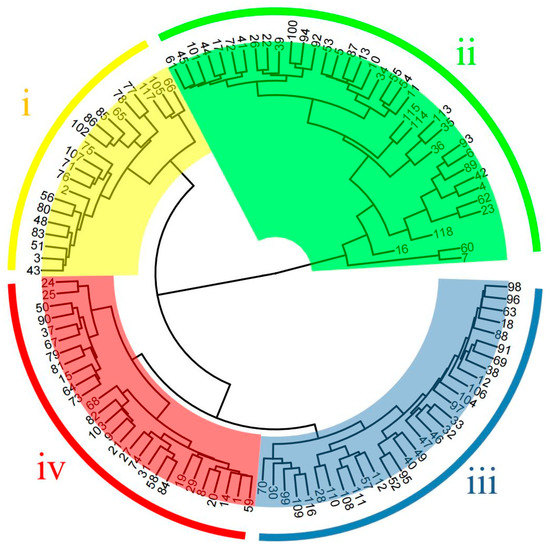
Figure 1.
Cluster analysis of phenotypic traits in 118 materials. The labels in the figure represent the material number (corresponding to Table S4).
The variation in morphological traits and appearance morphology of germplasm resources of different cultivars can be seen from the variogram of appearance morphology (Figure 2). For example, the size of cones and nuts of cultivar ‘Mao Pu’ was approximately twice as large as that of cultivar ‘Gui Hua Xiang’, and the length of spine of ‘Mao Pu’ was longer than that of ‘Gui Hua Xiang’. There are also differences in the color of the nut shells of different cultivars, the nut shell color of cultivar ‘Liu Yue Bao’ is black and more lusterless, the nut shell color of cultivar ‘Da Hong Pao’ is brownish red and the surface is smooth and shiny. It is worth noting that from the appearance of the nut shape, the cultivar ‘Jian Ding You Li’ has a teardrop-shaped nut, which is easier to distinguish from other varieties. However, due to the abundance of germplasm resources of the Castanea, it is difficult to distinguish all varieties from each other only in terms of phenotypic traits and morphological appearance. For example, both cultivar ‘Wang Zi Tou No.7’ and cultivar ‘Qing Zha’ were clustered into Taxon IV, with no major differences in phenotypic traits such as cone, nut and kernel size, nut shape and nut shell color; cultivar ‘Ba Yue Hong’ and ‘Kui Li’ were both clustered into Taxon II, with similar phenotypic traits and differing only in nut shell color. Comprehensive analysis shows that some of the varieties do not differ significantly in morphological traits and appearance, and it is difficult to identify all varieties accurately only from appearance characteristics and morphological traits.
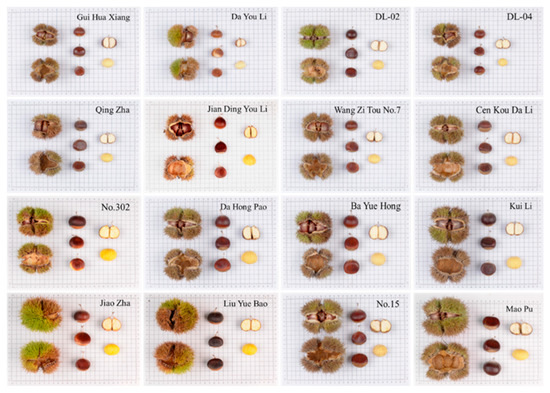
Figure 2.
Cone seed atlas of different cultivars of the Castanea germplasm resources.
2.2. Polymorphism and Genetic Diversity Analysis
The six SSR loci were tested for neutrality by Ewens–Watterson (neutrality) test, and the observed purity of each locus was determined to be within the 95% confidence interval of the respective expected purity (Table S2), which were all neutral loci. Moreover, the six pairs of selected chestnut SSR primers had 100% polymorphic loci in 112 Chinese chestnut cultivar resources with no deletion loci, which were suitable for genetic diversity analysis.
The genetic diversity of the 112 Chinese chestnut cultivars was analyzed and evaluated using six chestnut SSR markers (Table S3). A total of 51 alleles were detected, with an average number of 8.5 alleles per locus. The average number of valid alleles per locus was 3.7061 and the proportion of valid alleles was 43.60%. A total of 91 genotypes were detected, and an average of 15.1667 genotypes were amplified per primer pair. The mean value the of observed heterozygosity was 0.5134, the variances of He, H, and PIC values were similar, and the size of I value was approximately 2.15 times larger, with the smallest variation at primer P4 and the largest variation at primer P82, and the average number of variances were 0.7236, 0.7203, 0.6793 and 1.5203, respectively. The results indicated that 112 Chinese chestnut resources had high genetic diversity.
The genetic diversity of 118 Castanea variety resources was analyzed and evaluated by adding six resources of other Castanea species to 112 Chinese chestnut cultivar resources using six Chinese chestnut SSR markers (Table 2). A total of 58 alleles were detected, with a range of 5–13 alleles and an average number of 9.7 alleles per locus. The number of valid alleles ranged between 2.7602 and 5.4042, with an average of 3.9419 valid alleles per locus; the proportion of valid alleles was 40.78%. A total of 105 genotypes were detected, and the number of genotype species that could be amplified per primer pair ranged from 8 (P4) to 26 (P82), with an average of 17.5 genotypes amplified per primer pair. The observed variation in heterozygosity ranged from 0.1610 to 0.8898, with a mean value of 0.4986. The variances in He, H, and PIC values were similar, and the I values were approximately 2.21 times larger than previously measured, with the smallest variation at primer P4 (0.6404, 0.6377, 0.5909, 1.2316, respectively), the largest variation at primer P82 (0.8184, 0.8150, 0.7928, 2.0016, respectively), and the average variation numbers were 0.7390, 0.7359, 0.6985, and 1.6015, respectively. Genetic diversity analysis and evaluation of the 118 Castanea resources at the genomic level using six Chinese chestnut SSR markers were generally slightly higher than those containing only Chinese chestnut cultivars, indicating that the six Castanea resources of other species also displayed higher genetic diversity and were valuable resources in the Castanea.
Table 2.
Genetic diversity parameters of 118 Castanea plant materials.
2.3. Population Structure Analysis
Population structure analysis of 118 Castanea materials was performed using Structure software, and the optimal grouping was determined by ∆K based on the optimal grouping method. The results showed that ∆K reached its highest peak value when K = 3 (Figure 3a). Therefore, the optimal grouping number was 3. The 118 Castanea plant samples were divided into three groups (Figure 3b): Taxon A, Taxon B, and Taxon C (red in the figure represents Taxon A, green represents Taxon B, and blue represents Taxon C). Taxon A consisted of 41 Chinese chestnut species, Taxon B consisted of 39 species of Chinese chestnut, Japanese chestnut (Castanea crenata Sieb. et Zucc.), Henry chestnut (Castanea henryi (Skam) Rehd. et Wils.), and European chestnut (Castanea sativa Mill.), and Taxon C consisted of 38 Chinese chestnut species. According to the major color ratio (Q value) in each variety, a Q value ≥ 0.6 indicated that the test materials were relatively single in kinship and genetic background, and a Q value < 0.6 indicated that the test materials had mixed kinship origin and a more complex genetic background. Of the measured materials, 93.2% had a Q value ≥ 0.6, and most of the test materials exhibited a relatively single kinship and genetic background with less gene penetration; 6.8% of the materials with Q value < 0.6 were Chinese chestnut cultivars, namely ‘Xin Zhuang No. 2’, ‘Tai Shan Hong Li’, ‘Chui Zhi Li’, ‘Long An No. 1’, ‘Yue You No. 9’, ‘Qing Mao Ruan Zha’, ‘No. 6’, and ‘No. 15’, which each revealed more complex kinship and genetic background. Thus, we can conclude that these materials have complex kinship and genetic backgrounds, and there is some germplasm gene penetration.
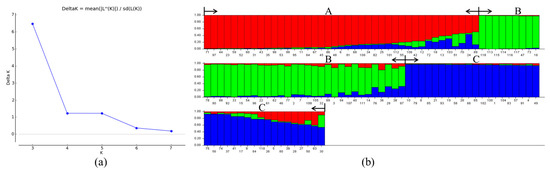
Figure 3.
Optimal K-value according to maximum Delta K (a) and population structure analysis of 118 Castanea plant materials (b). The optimum number of groups is 3, dividing the 118 ingredients into three groups (A, red; B, green; C, blue). The labels on the bottom of (b) represent the material number (corresponding to Table S4).
The PCoA can directly reflect the relationship between the Castanea and plant species. The distance between species is related to genetic similarity. Proximity refers to a high genetic similarity and close kinship. Distance indicates low genetic similarity, long kinship, and large genetic differences. A PCoA of 118 Castanea plant species was performed using the first and second principal components as the horizontal and vertical coordinates, respectively (Figure 4), on which 118 Castanea plant species were divided into three taxa, namely P1, P2, and P3. Taxa P1 included 49 chestnut plant materials of four species including Chinese chestnut, Japanese chestnut, Henry chestnut, and European chestnut; taxa P2 included 20 Chinese chestnut materials, and Taxon P3 included 49 Chinese chestnut materials. In addition, the distribution of the Chinese chestnut species taxa was scattered, indicating that the tested Chinese chestnut species resources have high diversity.
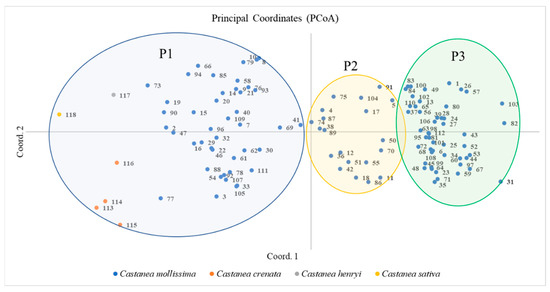
Figure 4.
PCoA of 118 Castanea plant materials. The labels in the figure represent the material number (corresponding to Table S4).
The NJ clustering diagram (Figure 5) was constructed based on the genetic distance of 118 Castanea materials, and it can be seen from the diagram that the 118 Castanea materials tested were divided into four taxa, which included Taxon I (yellow), Taxon II (green), Taxon III (blue), and Taxon IV (red). Taxon I included 13 materials, Taxon II included 26 materials, and Taxon III included 15 materials. All materials clustered into Taxon I, Taxon II, and Taxon III were Chinese chestnut species. Taxon IV included Chinese chestnut, Japanese chestnut, Henry chestnut, and European chestnut, with a total of 64 materials.
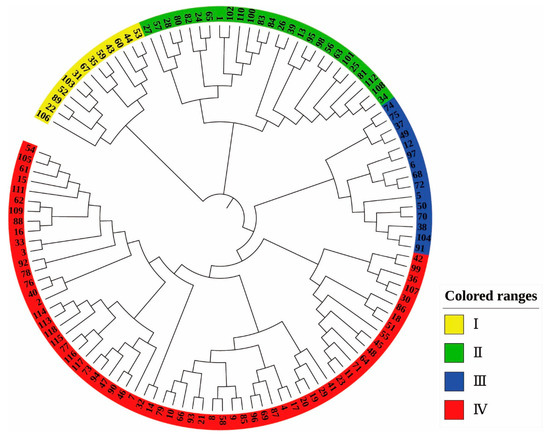
Figure 5.
NJ clustering analysis of 118 Castanea plant materials. The labels in the figure represent the material number (corresponding to Table S4).
2.4. Establishment of DNA Molecular Identity
It was difficult to identify all materials with a large number of primers in a single pair, and 118 Castanea plant materials were identified by combining multiple pairs of primers. By gradually increasing the number of primers, the purpose of identifying all materials was finally achieved. Primer P4 could only identify three parts of the material, but after adding primer P82, 35 parts of the material could be identified and gradually increasing the number of primers up to six pairs of highly polymorphic primers (P4 + P82 + P106 + P108 + P127 + P138) allowed all 118 materials to be distinguished (Table 3).
Table 3.
Materials distinguished using a gradually increasing number of primer pairs.
Complex molecular ID cards must be avoided to facilitate practical production and applications for breeders, producers, and consumers. Therefore, based on the principle of distinguishing the largest species with the least number of primers, for the 118 Castanea plant resources, Molecular Identification Card can be constructed using the six primer pairs shown in Table 1. For each pair of primers, each species amplified allele fragment sizes in descending order of 1, 2, 3…9, A, B, C, etc., and in primer order P4, P82, P106, P108, P127, and P138 to form a unique six-digit molecular signature of 118 Castanea species (Table 4), which distinguished all materials.
Table 4.
Six-digit molecular ID codes of 118 Castanea plant materials.
2.5. Combining Phenotypic Information with Molecular Information
On the basis of phenotypic trait data and molecular data, the online software forage QR code generator (http://cli.im/ (accessed on 26 February 2023)) was used to encode the desired variety with information such as variety name, germplasm type, botanical classification, phenotypic traits, and string molecular ID card, which well combines phenotypic traits and molecular information. Taking the Chinese chestnut variety ‘Jiu Jia Zhong’ as an example, Figure 6a shows the QR code molecular ID card coded for it. The information shown in Figure 6b,c can be obtained by scanning the QR code, which is very fast and convenient. Analogously, a QR code molecular ID card exclusive to each species can be constructed.
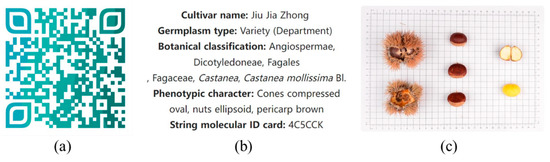
Figure 6.
Example of QR code molecular ID card. (a) QR code molecular ID card of Chinese chestnut variety ‘Jiu Jia Zhong’; (b,c) display of the contents of the scan code.
3. Discussion
3.1. Phenotypic Trait Analysis
In this study, 16 morphological traits were statistically analyzed, among which the coefficient of variation values of five traits, namely, single cone weight, cone shell thickness, single nut weight, stigma length, and single kernel weight, were higher than 30%, which were rich in genetic diversity and had great potential for further selection. The high level of variation in the single cone weight, single nut weight, and single kernel weight, as traits with obvious commercial value [11], will help in the selection of varieties with specific requirements. In addition, two traits with high coefficients of variation, cone shell thickness and stigma length, can be correlated with the development of pistils and the development and maturation of fruits in different varieties for in-depth studies to explore their possible correlation. Fruit shape index had the lowest coefficient of variation and was a relatively stable botanical morphological trait. The mean value of the fruit shape index was 0.81, indicating that the shape of the marginal fruits in the nuts was mostly suborbicular or round, and most of the fruits were square and symmetrical.
Except for the stable phenotypic trait fruit shape index and five phenotypic traits with high coefficients of variation, namely, single cone weight, cone shell thickness, single nut weight, stigma length, and single kernel weight, the values of coefficients of variation for the other 10 phenotypic traits were all in the range of 20% to 30%. Overall, the high values of the coefficients of variation were probably due to the richness of the participating species resources, including materials from four species of Castanea, and the large differences in the values of phenotypic traits among the materials of different species, resulting in relatively high overall coefficients of variation.
Phenotypic cluster analysis divided the test material into four groups, with the mean value of single cone weight of 36.01 g for cluster i, which is small and classified as small fruit; the mean value of single cone weight of 82.70 g for cluster ii, which is classified as very large fruit; the mean value of single cone weight of 58.29 g for cluster iii, which is classified as large fruit; and the mean value of single cone weight of 45.56 g for cluster iv, which is medium-sized and classified as medium fruits. The phenotypic traits of different varieties in the same taxon are not very different, and it was difficult to distinguish them from each other in terms of phenotypic traits. Not only were there no significant differences in phenotypic traits among some different varieties, but also the appearance characteristics were very similar, and coupled with the large influence of environmental and other factors on plant phenotypic traits [12], it was more difficult to distinguish and identify each variety by appearance and morphological traits alone.
3.2. Genetic Diversity Analysis
SSR molecular markers are among the most commonly used molecular marker technologies, with the advantages of co-dominant inheritance, high stability and polymorphism, and high reproducibility. It is widely used in genetic diversity analysis, kinship determination, variety identification, core germplasm screening, molecular identification, and the construction of various plants [13,14].
The genetic diversity of Castanea plants has been studied using SSR molecular markers. For example, Inoue et al. (2009) [15] reported, for the first time, the development of chestnut SSR markers, which achieved effective amplification across species in Japanese and European chestnut using 17 chestnut SSR primers screened for high genetic diversity in all three species of Castanea plants, Chinese chestnut, Japanese chestnut, and European chestnut. Nie et al. (2021) [16] screened 18 pairs of primers with high polymorphism from 330 SSR markers to analyze the genetic diversity of 146 Chinese chestnut species and other studies; they measured the mean values of MAF, Ho, and PIC as 0.420, 0.622, and 0.652, respectively, indicating that the 18 SSR markers were highly polymorphic. In this study, six pairs of highly polymorphic primers were screened from 153 pairs of SSR primers that were developed and designed based on the whole Chinese chestnut genome. In 112 Chinese chestnut cultivars, 51 alleles and 91 genotypes were detected, and the mean values of I, Ho, He, H, PIC, and MAF were 1.5203, 0.5134, 0.7236, 0.7203, 0.6793, and 0.4018, respectively, indicating high heterozygosity, polymorphism, and rich genetic diversity. An important reason for the high heterozygosity of Chinese chestnuts is that they are cross-pollinated plants [17]. The SSR molecular markers developed and screened in this study were highly polymorphic, and the rich genetic diversity of the participating cultivars of Chinese chestnut can be explained by the fact that the SSR molecular markers were developed based on high-quality whole-genome sequence data from Chinese chestnut, and that the genomic SSRs exhibited higher genetic diversity [18]. Another possibility is that the involved Chinese chestnut species possessed more resources and complex genetic information. To address the issue of low resolution while performing polyacrylamide gel electrophoresis, this study used fluorescent markers and capillary electrophoretic methods to read and record data, which greatly improved the accuracy of allelic discrimination of loci and the detection of target fragment sizes.
In addition, six resources of three Castanea species, Japanese chestnut, Henry chestnut, and European chestnut, were added to 112 Chinese chestnut species. The SSR molecular markers developed from the Chinese chestnut genome were successfully and efficiently amplified across species in Japanese chestnut, Henry chestnut, and European chestnut, indicating that the developed SSR molecular markers were highly versatile in the Castanea and can be used for genetic diversity analysis, species identification, and molecular ID construction of the Castanea.
3.3. Population Structure Analysis
Population structure, NJ cluster analysis, and principal coordinate analysis are effective means to study the genetic diversity, kinship, and genetic background of plant germplasm resources and are critical bases for protecting and utilizing plant germplasm resources. Many studies have been conducted on the population structure of plants [19,20,21,22,23,24], and related studies have also been reported in Castanea plants. For example, Jiang et al. (2017) [25] analyzed the genetic structure of 95 Chinese chestnut cultivars using 41 SSR loci and classified 95 Chinese chestnut cultivars into three taxa. Nishio et al. (2014) [26] classified 60 Japanese chestnut cultivars into two major clusters and three major clusters by hierarchical clustering and Bayesian clustering analysis, respectively, and the results of both analyses showed some similarity. Pereira-Lorenzo et al. (2017) [27] used 24 highly polymorphic SSRs to analyze the population structure of 132 European chestnut cultivars, identifying two major clusters corresponding to the Spanish and Italian cultivar taxa and showing higher genetic diversity. While the above studies only analyzed the resources of individual species of the Castanea for structural analysis, the present study involved Chinese chestnut, Japanese chestnut, Henry chestnut, and European chestnut.
In this study, six pairs of highly polymorphic SSR markers were used to analyze the structure of 118 Castanea. A total of 118 Castanea plants were classified using three analytical methods: structural analysis, NJ clustering analysis, and PCoA analysis. The classification results of the three methods were highly consistent. Taxon A of the structure analysis results contained all the materials in Taxon I of the NJ cluster analysis except for the Chinese chestnut cultivar ‘Shi Men Zao Shuo’. All the remaining 32 materials in Taxon A except for the nine materials of ‘Jiao Zha’, ‘Jian Ding You Li’, ‘Yue Yao No. 8’, ‘Jie Jie Hong’, ‘Long An No. 1’, ‘Mei Gui Hong’, ‘Qing Mao Ruan Zha’, ‘ZA’, and ‘No. 15′ were clustered into Taxon P3 of the PCoA analysis. The remaining 36 materials in the B Taxon of the structure analysis were clustered into the P1 Taxon of the PCoA analysis, except for ‘Mao Pu’, ‘Chui Zhi Li’, and ‘No. 6’; the remaining 48 materials in the P1 Taxon were clustered into the IV Taxon of the NJ clustering analysis, except for ‘Shi Men Zao Shuo’. The P3 Taxon of the PCoA analysis included all materials from Taxon II of the NJ clustering analysis; six materials, including Japanese chestnut, Henry chestnut, and European chestnut, were grouped into the same taxon by structure analysis, NJ cluster analysis, or PCoA analysis. Although there was a high degree of agreement and similarity in the classification results among structure analysis, NJ clustering analysis, and PCoA analysis, there were also differences, with different clusters on select branches. The structural analysis and PCoA analysis divided the 118 materials into three broad categories, and the NJ clustering analysis divided the 118 materials into four broad categories.
In the population structure analysis, 6.8% of the materials had a Q value of less than 0.6, indicating a certain frequency of gene exchange and infiltration among the participating material species. However, due to the lack of clarity regarding the origin and genetic background of certain resources, it was not possible to link taxonomy to geographic origin for analysis. In future studies, we will attempt to track the origin and genetic background information of each material to explore the genetic structure, genetic diversity, and affinity between different geographic resources.
3.4. Establishment of DNA Molecular Identity
Molecular identification is an effective method to solve the problems of species mixing, tautology, and synonyms and is an important guide for species identification. To date, many studies on molecular ID have been reported [28,29,30,31,32,33], but there are few reports on the molecular ID construction in Castanea plants. Currently, however, there are many substandard phenomena, which are not conducive to market development. As an example, consider the fried Chinese chestnut market in Nanjing, Jiangsu Province, the market survey revealed that most of Nanjing’s fried Chinese chestnuts are made from Yanshan Chinese chestnuts produced in Qianxi, Hebei Province, which are soft and sweet and liked by consumers. However, most operators and consumers of fried Chinese chestnut are not able to distinguish between Yanshan Chinese chestnut and other varieties. The presence of mixed varieties in the market and the phenomenon of using the substandard as a good is endangering the legitimate rights and interests of both operators and consumers. Therefore, it will be necessary and meaningful to construct molecular ID cards to standardize the management of Castanea plants.
Nie et al. (2021) [16] constructed fingerprint profiles of 146 Chinese chestnut materials using seven core markers selected, which enabled rapid and effective identification of different Chinese chestnut germplasm resources. Liu et al. (2017) [34] screened five pairs of primer combinations and used the core primer plus band type combination method to construct fingerprint profiles of 33 ancient Chinese chestnut trees from the Ming and Qing dynasties, which each made important contributions to the research and conservation of ancient Chinese chestnut trees. In this study, we constructed 118 exclusive molecular IDs of the Castanea plants using six pairs of SSR core primers, and were able to completely distinguish 118 materials, which not only provided a reference for the identification and authentication of the Castanea plants, but will also contribute to the development of the Castanea plant market.
3.5. Phenotype and Molecular Binding Analysis
Fruit phenotypic morphological traits have significant economic value and discriminatory ability, and are widely used in the identification of different plant varieties. However, due to environmental factors and plant growth cycles, phenotypic traits are somewhat unstable, and some varieties have very similar phenotypic traits. Therefore, it is difficult to identify all varieties using phenotypic traits alone. At present, rapid development and increasing sophistication of molecular marker technologies will help overcome the limitations of phenotypic traits. The combination of phenotypic and molecular-based methods will help to identify varieties more accurately and comprehensively [35,36,37,38]. In this study, the phenotypic cluster analysis divided 118 materials into four groups, and the phenotypic traits of the varieties differed significantly among the groups; however, the phenotypic traits of the varieties within each group did not differ significantly. Therefore, it was difficult to identify all materials using only phenotypic traits. In this study, the two-dimensional molecular identity of Chinese chestnut cultivar ‘Jiu Jia Zhong’ was constructed as an example, which contains both phenotypic trait information and DNA molecular information, and the construction of the two-dimensional molecular identity will help to identify Castanea plant resources in detail and comprehensively.
In addition, phenotypic trait clustering analysis and genetic distance clustering analysis showed that although the 118 materials were grouped into four groups by the two methods, the clustering results were different between the two methods. Genetic distance of varieties with similar phenotypic traits may be distant, for example, the cultivar ‘Duan Zha’ and the cultivar ‘Gui Hua Xiang’; phenotypic traits of varieties with similar genetic distance may have large differences, for example, the cultivar ‘Shi Men Zao Shuo’ and the cultivar ‘Cen Kou Da Li’. However, some of the materials were grouped together in both phenotypic and genetic distance clusters, for example, the cultivar ‘Chu Shu Hong’ and the cultivar ‘Bo Ke Chi Li’, the cultivar ‘Shu He No.1′ and the cultivar ‘Shu He No.7’, indicating that their genes and relatives may be very similar.
4. Materials and Methods
4.1. Plant Materials
From April to October 2021, 118 materials (Table S4) from 4 species of the Castanea were collected from Jiangsu Province, China. We collected 10–15 young leaves, marked them, placed them in self-sealing bags, brought back to the laboratory in ice boxes, and stored at −20 °C in a refrigerator.
4.2. Phenotype Data Measurement
The phenotypic traits of different varieties of the Castanea germplasm resources were measured for three consecutive years from 2020 to 2022, and the appearance characteristics were photographed in a varietal box plot. A vernier caliper was used to measure the phenotypic data of 16 traits, including Single cone weight, Cone diameter, Cone length, Cone thickness, Spine length, Cone shell thickness, Single nut weight, Nut diameter, Nut length, Nut thickness, Fruit shape index, Stigma length, Single kernel weight, Kernel diameter, Kernel length, Kernel thickness. Each species has at least 3 replications. The maximum, minimum, mean, standard deviation and coefficient of variation were calculated for each trait. Cluster analysis of phenotypic traits was performed using RStudio software.
4.3. DNA Extraction and PCR Amplification
Leaf genomic DNA was extracted using a modified cetyltrimethylammonium bromide (CTAB) method [39]. Two percent mercaptoethanol was added prior to use of the extract, and DNA quality and concentration were detected by Nano-100 instrument, diluted to 50 ng/μL, and stored at −20 °C for rescue.
Six pairs of primers with high polymorphism (PIC > 0.5) were selected from 153 pairs of primers developed and synthesized based on published chestnut genome sequence data [40] (Table 5). The fluorescence modification was performed at the 5′ end of the upstream primer of each pair.
Table 5.
Primer Information.
Fluorescent SSR-PCR amplification was performed using a 15 μL reaction system: 7.5 μL 2 × TSINGKE Master Mix (Tsingke, Nianjing, China), 1 μL template DNA (50 ng/μL), 0.3 μL of 10 μM fluorescence-modified upstream primer, 0.3 μL of 10 μM downstream primer, and 5.9 μL ddH2O to produce 15 μL reaction solution for PCR.
The PCR amplification reaction procedure was as follows: pre-denaturation at 94 °C for 3 min; denaturation at 94 °C for 30 s, annealing at 57 °C for 30 s, extension at 72 °C for 45 s and a total of 35 cycles; full extension at 72 °C for 10 min; and storage at −20 °C protected from light. Capillary electrophoresis detection was performed using an ABI 3730 XL DNA Sequencer (Applied Biosystems, Foster City, CA, USA), and Gene Mapper 4.1 software was used for data collation and image analysis.
4.4. Data Analysis
The data format was converted using DataFormater software [41], and POPGENE software version 1.32 [42,43] was used to calculate the number of alleles (Na), the number of effective alleles (Ne), Shannon’s information index (I), observed heterozygosity (Ho), expected heterozygosity (He), Nei’s genetic diversity index (H) [44], and Ewens–Watterson (neutrality) test. Polymorphism information content (PIC), Number of genotypes (NG) and master allele frequency (MAF) were calculated using PowerMarker V3.25 [45]. Additionally, calculating allele frequencies and genetic distances, performing NJ clustering analysis, and the NJ clustering analysis data were embellished with iTOL website (https://itol.embl.de/ accessed on 26 February 2023).
Population genetic structure analysis was performed using Structure software [46,47,48], and 15 replicate runs were performed with K values ranging from 2 to 8. The length of the burn-in period was set at 10,000, and the number of Markov chain Monte Carlo (MCMC) repeats after burn-in was set at 100,000 to estimate individual admixture proportions (Q). Evanno’s method [49] and the online software Structure Harvester [50] were used to determine the optimal grouping K values [51,52,53]. Principal coordinate analysis (PCoA) was performed using GenAlex 6.41 software [54,55].
The allelic genotypic fragments amplified by each primer pair were ranked from smallest to largest and numbered 1, 2, 3…9, A, B, C, etc., and the primer pair used P4, P82, P106, P108, P127, and P138. The sequence was arranged to construct fingerprint feature codes to obtain the molecular information of each material. The botanical taxonomic information of the materials was combined with molecular information using 2D code online generation technology (https://cli.im/ accessed on 26 February 2023) to generate a two-dimensional code molecular identity card.
5. Conclusions
In this study, 16 phenotypic traits were measured and analyzed; among them, the coefficient of variation of five phenotypic traits such as single cone weight was greater than 30%, and the coefficient of variation of fruit shape index was the smallest, which was a relatively stable trait. The genetic diversity and population structure of 118 Castanea plants were analyzed using SSR molecular markers; the results showed that the test materials had rich genetic diversity. The molecular ID cards of 118 Castanea plant materials were successfully constructed using six pairs of core SSR primers, which can completely differentiate all participating materials and have important implications for the conservation, utilization, and management of Castanea plant resources.
Supplementary Materials
The following supporting information can be downloaded at: https://www.mdpi.com/article/10.3390/plants12071438/s1, Table S1: Average of phenotypic data for 118 materials; Table S2: Ewens-Watterson Neutral Test; Table S3: Genetic diversity parameters of 112 Chinese chestnut materials; Table S4: List of 118 material numbers.
Author Contributions
Material collection and preparation, X.B., S.Z., W.W., Y.C., Y.Z., F.S. and C.Z.; methodology, X.B., Y.C., Y.Z. and F.S.; software, X.B., S.Z. and W.W.; data curation, X.B., S.Z. and W.W.; writing—original draft preparation, X.B.; writing—review and editing, C.Z.; supervision, C.Z. All authors have read and agreed to the published version of the manuscript.
Funding
This work was supported by the National Natural Science Foundation of China under grant 31500514, Forestry Technology Innovation and Promotion Project of Jiangsu Province (LYKJ [2022]18) and the Special Fund of the Chestnut Germplasm Resources Repositories in Jiangsu Province (SLBZ [2018]4).
Institutional Review Board Statement
Not applicable.
Informed Consent Statement
Not applicable.
Data Availability Statement
The data that support the findings of this study are available from the corresponding author upon reasonable request.
Acknowledgments
We are thankful to all the institutions and people who helped with this study.
Conflicts of Interest
The authors declare no conflict of interest.
References
- Anagnostakis, S.L. Chestnut Breeding in the United States for Disease and Insect Resistance. Plant Dis. 2012, 96, 1392–1403. [Google Scholar] [CrossRef] [PubMed]
- Shi, L.; Wang, J.; Liu, Y.; Ma, C.; Guo, S.; Lin, S.; Wang, J. Transcriptome analysis of genes involved in starch biosynthesis in developing Chinese chestnut (Castanea mollissima Blume) seed kernels. Sci. Rep. 2021, 11, 3570. [Google Scholar] [CrossRef] [PubMed]
- Zhou, P.; Zhang, P.; Guo, M.; Li, M.; Wang, L.; Adeel, M.; Shakoor, N.; Rui, Y. Effects of age on mineral elements, amino acids and fatty acids in Chinese chestnut fruits. Eur. Food Res. Technol. 2021, 247, 2079–2086. [Google Scholar] [CrossRef]
- Li, B.; Liu, C.; Tang, J.; Xin, Y.; Dong, Z.; Bai, B.; Xin, P. Genetic diversity analysis of Camellia fascicularis H. T. Chang based on SSR markers. J. Appl. Res. Med. Aromat. Plants 2022, 31, 100404. [Google Scholar] [CrossRef]
- Makhadmeh, I.M.; Thabet, S.G.; Ali, M.; Alabbadi, B.; Albalasmeh, A.; Alqudah, A.M. Exploring genetic variation among Jordanian Solanum lycopersicon L. landraces and their performance under salt stress using SSR markers. J. Genet. Eng. Biotechnol. 2022, 20, 45. [Google Scholar] [CrossRef]
- Ozkan, G.; Haliloglu, K.; Turkoglu, A.; Ozturk, H.I.; Elkoca, E.; Poczai, P. Determining Genetic Diversity and Population Structure of Common Bean (Phaseolus vulgaris L.) Landraces from Turkiye Using SSR Markers. Genes 2022, 13, 1418. [Google Scholar] [CrossRef]
- Santos, C.; Zhebentyayeva, T.; Serrazina, S.; Nelson, C.D.; Costa, R. Development and characterization of EST-SSR markers for mapping reaction to Phytophthora cinnamomi in Castanea spp. Sci. Hortic. 2015, 194, 181–187. [Google Scholar] [CrossRef]
- Shahnazari, N.; Noormohammadi, Z.; Sheidai, M.; Koohdar, F. A new insight on genetic diversity of sweet oranges: CAPs-SSR and SSR markers. J. Genet. Eng. Biotechnol. 2022, 20, 105. [Google Scholar] [CrossRef]
- Uddin, N.; Ali, N.; Nisar, M.; Liu, M.J.; Liu, Z.G.; Muhammad, N.; Rahman, I.U. SSR-based population structure, molecular diversity and identity cards of Ziziphus species from Pakistan and China. Genet. Resour. Crop Evol. 2021, 68, 2391–2409. [Google Scholar] [CrossRef]
- Zheng, X.W.; Cheng, T.; Yang, L.B.; Xu, J.X.; Tang, J.P.; Xie, K.Q.; Huang, X.F.; Bao, Z.Z.; Zheng, X.F.; Diao, Y.; et al. Genetic Diversity and DNA Fingerprints of Three Important Aquatic Vegetables by EST-SSR Markers. Sci. Rep. 2019, 9, 14074. [Google Scholar] [CrossRef]
- Parashuram, S.; Singh, N.V.; Gaikwad, N.N.; Corrado, G.; Sowjanya, P.R.; Basile, B.; Devaraja, N.S.; Chandra, R.; Babu, K.D.; Patil, P.G.; et al. Morphological, Biochemical, and Molecular Diversity of an Indian Ex Situ Collection of Pomegranate (Punica granatum L.). Plants 2022, 11, 3518. [Google Scholar] [CrossRef]
- Smith, A.C.; Shima, J.S. Variation in the effects of larval history on juvenile performance of a temperate reef fish. Austral Ecol. 2011, 36, 830–838. [Google Scholar] [CrossRef]
- Fu, Z.Y.; Sa, K.J.; Park, H.; Jang, S.J.; Kim, Y.J.; Lee, J.K. Utilization of Novel Perilla SSR Markers to Assess the Genetic Diversity of Native Perilla Germplasm Accessions Collected from South Korea. Plants 2022, 11, 2974. [Google Scholar] [CrossRef] [PubMed]
- Cai, J.; Yang, X.; Yu, W.; Xiang, P.; Zhang, S.; Wang, G. The Diversity of Melia azedarach L. from China Based on Transcriptome-Developed SSR Marker. Forests 2022, 13, 1011. [Google Scholar] [CrossRef]
- Inoue, E.; Ning, L.; Hara, H.; Ruan, S.; Anzai, H. Development of Simple Sequence Repeat Markers in Chinese Chestnut and Their Characterization in Diverse Chestnut Cultivars. J. Am. Soc. Hortic. Sci. 2009, 134, 610–617. [Google Scholar] [CrossRef]
- Nie, X.H.; Wang, Z.H.; Liu, N.W.; Song, L.; Yan, B.Q.; Xing, Y.; Zhang, Q.; Fang, K.F.; Zhao, Y.L.; Chen, X.; et al. Fingerprinting 146 Chinese chestnut (Castanea mollissima Blume) accessions and selecting a core collection using SSR markers. J. Integr. Agric. 2021, 20, 1277–1286. [Google Scholar] [CrossRef]
- Xiong, H.; Zou, F.; Guo, S.; Yuan, D.; Niu, G. Self-sterility May Be Due to Prezygotic Late-acting Self-incompatibility and Early-acting Inbreeding Depression in Chinese Chestnut. J. Am. Soc. Hortic. Sci. 2019, 144, 172–181. [Google Scholar] [CrossRef]
- Luan, M.B.; Yang, Z.M.; Zhu, J.J.; Deng, X.; Liu, C.C.; Wang, X.F.; Xu, Y.; Sun, Z.M.; Chen, J.H. Identification, evaluation, and application of the genomic-SSR loci in ramie. Acta Soc. Bot. Pol. 2016, 85. [Google Scholar] [CrossRef]
- Kongjaimun, A.; Takahashi, Y.; Yoshioka, Y.; Tomooka, N.; Mongkol, R.; Somta, P. Molecular Analysis of Genetic Diversity and Structure of the Lablab (Lablab purpureus (L.) Sweet) Gene Pool Reveals Two Independent Routes of Domestication. Plants 2023, 12, 57. [Google Scholar] [CrossRef]
- Chen, X.; Min, D.; Yasir, T.A.; Hu, Y.G. Genetic Diversity, Population Structure and Linkage Disequilibrium in Elite Chinese Winter Wheat Investigated with SSR Markers. PLoS ONE 2012, 7, e44510. [Google Scholar] [CrossRef]
- Fu, Y.; Liu, F.; Li, S.; Tian, D.; Dong, L.; Chen, Y.; Su, Y. Genetic diversity of the wild Asian lotus (Nelumbo nucifera) from Northern China. Hortic. Plant J. 2021, 7, 488–500. [Google Scholar] [CrossRef]
- Guo, Q.; Cao, S.; Dong, L.; Li, X.; Zhang, J.; Zhang, Y.; Zhang, Z.; Sun, Y.; Long, C.; Fan, Y.; et al. Genetic diversity and population structure of Robinia pseudoacacia from six improved variety bases in China as revealed by simple sequence repeat markers. J. For. Res. 2022, 33, 611–621. [Google Scholar] [CrossRef]
- Laosatit, K.; Amkul, K.; Chankaew, S.; Somta, P. Molecular genetic diversity of winged bean gene pool in Thailand assessed by SSR markers. Hortic. Plant J. 2022, 8, 81–88. [Google Scholar] [CrossRef]
- Li, L.; Ou, W.; Wang, Y.; Peng, J.; Wang, D.; Xu, S. Comparison of genetic diversity between ancient and common populations of Docynia delavayi (Franch.) Schneid. Gene 2022, 829, 146498. [Google Scholar] [CrossRef] [PubMed]
- Jiang, X.; Tang, D.; Gong, B. Genetic diversity and association analysis of Chinese chestnut (Castanea mollissima Blume) cultivars based on SSR markers. Braz. J. Bot. 2017, 40, 235–246. [Google Scholar] [CrossRef]
- Nishio, S.; Iketani, H.; Fujii, H.; Yamamoto, T.; Terakami, S.; Takada, N.; Saito, T. Use of population structure and parentage analyses to elucidate the spread of native cultivars of Japanese chestnut. Tree Genet. Genomes 2014, 10, 1171–1180. [Google Scholar] [CrossRef]
- Pereira-Lorenzo, S.; Maria Ramos-Cabrer, A.; Barreneche, T.; Mattioni, C.; Villani, F.; Belen Diaz-Hernandez, M.; Miguel Martin, L.; Martin, A. Database of European chestnut cultivars and definition of a core collection using simple sequence repeats. Tree Genet. Genomes 2017, 13, 114. [Google Scholar] [CrossRef]
- Chen, L.; Ma, Q.; Chen, Y.; Wang, B.; Pei, D. Identification of major walnut cultivars grown in China based on nut phenotypes and SSR markers. Sci. Hortic. 2014, 168, 240–248. [Google Scholar] [CrossRef]
- Kumar, P.P.; Janakiram, T.; Bhat, K.V. Microsatellite based DNA fingerprinting and assessment of genetic diversity in bougainvillea cultivars. Gene 2020, 753, 144794. [Google Scholar] [CrossRef]
- Li, C.; Wu, J.; Li, Q.; Yang, Y.; Zhang, K. Development of Simple Sequence Repeat Markers from Functional Genes and Establishment of Molecular Identity for Tree Peony. J. Plant Biochem. Biotechnol. 2022, 31, 22–36. [Google Scholar] [CrossRef]
- Li, L.; Xu, X.; Wu, P.; Zhang, G.; Zhang, X. Establishment of Molecular Identity Cards for Cucumis melo Cultivars Using SSR Markers. Hortscience 2018, 53, 138–143. [Google Scholar] [CrossRef]
- Luan, M.B.; Chen, B.F.; Zou, Z.Z.; Zhu, J.J.; Wang, X.F.; Xu, Y.; Sun, Z.M.; Chen, J.H. Molecular identity of ramie germplasms using simple sequence repeat markers. Genet. Mol. Res. 2015, 14, 2302–2311. [Google Scholar] [CrossRef] [PubMed]
- Pan, Y.B. Development and Integration of an SSR-Based Molecular Identity Database into Sugarcane Breeding Program. Agronomy 2016, 6, 28. [Google Scholar] [CrossRef]
- Liu, G.; Cao, J.; Lan, Y.; Wang, J. Construction of SSR fingerprint on 33 ancient chestnut trees. Acta Agric. Univ. Jiangxiensis 2017, 39, 134–139. [Google Scholar]
- Savoia, M.A.; Del Faro, L.; Venerito, P.; Gaeta, L.; Palasciano, M.; Montemurro, C.; Sabetta, W. The Relevance of Discovering and Recovering the Biodiversity of Apulian Almond Germplasm by Means of Molecular and Phenotypic Markers. Plants 2022, 11, 574. [Google Scholar] [CrossRef]
- Stavridou, E.; Lagiotis, G.; Kalaitzidou, P.; Grigoriadis, I.; Bosmali, I.; Tsaliki, E.; Tsiotsiou, S.; Kalivas, A.; Ganopoulos, I.; Madesis, P. Characterization of the genetic diversity present in a diverse sesame landrace collection based on phenotypic traits and est-ssr markers coupled with an hrm analysis. Plants 2021, 10, 656. [Google Scholar] [CrossRef] [PubMed]
- Teklu, D.H.; Shimelis, H.; Tesfaye, A.; Mashilo, J.; Zhang, X.; Zhang, Y.; Dossa, K.; Shayanowako, A.I.T. Genetic Variability and Population Structure of Ethiopian Sesame (Sesamum indicum L.) Germplasm Assessed through Phenotypic Traits and Simple Sequence Repeats Markers. Plants 2021, 10, 1129. [Google Scholar] [CrossRef] [PubMed]
- Villano, C.; Corrado, G.; Basile, B.; Di Serio, E.; Mataffo, A.; Ferrara, E.; Aversano, R. Morphological and Genetic Clonal Diversity within the ‘Greco Bianco’Grapevine (Vitis vinifera L.) Variety. Plants 2023, 12, 515. [Google Scholar] [CrossRef]
- Benbouza, H.; Baudoin, J.-P.; Mergeai, G. Improvement of the genomic DNA extraction method with CTAB for cotton leaves. Biotechnol. Agron. Soc. Environ. 2006, 10, 73–76. [Google Scholar]
- Wang, J.; Tian, S.; Sun, X.; Cheng, X.; Duan, N.; Tao, J.; Shen, G. Construction of Pseudomolecules for the Chinese Chestnut (Castanea mollissima) Genome. G3 Genes Genomes Genet. 2020, 10, 3565–3574. [Google Scholar] [CrossRef]
- Fan, W.; Gai, H.; Sun, X.; Yang, A.; Zhang, Z.; Ren, M. DataFormater, a software for SSR data formatting to develop population genetics analysis. Mol. Plant Breed 2016, 14, 265–270. [Google Scholar]
- Quardokus, E. PopGene. Science 2000, 288, 458. [Google Scholar] [CrossRef]
- Yeh, F.C.; Boyle, T.J.B. Population genetic analysis of co-dominant and dominant markers and quantitative traits. Belg. J. Bot. 1997, 129, 157. [Google Scholar]
- Nei, M. Molecular Evolutionary Genetics; Columbia University Press: New York, NY, USA, 1987; p. 512. [Google Scholar]
- Liu, K.; Muse, S.V. PowerMarker: An integrated analysis environment for genetic marker analysis. Bioinformatics 2005, 21, 2128–2129. [Google Scholar] [CrossRef]
- Falush, D.; Stephens, M.; Pritchard, J.K. Inference of population structure using multilocus genotype data: Linked loci and correlated allele frequencies. Genetics 2003, 164, 1567–1587. [Google Scholar] [CrossRef]
- Falush, D.; Stephens, M.; Pritchard, J.K. Inference of population structure using multilocus genotype data: Dominant markers and null alleles. Mol. Ecol. Notes 2007, 7, 574–578. [Google Scholar] [CrossRef] [PubMed]
- Pritchard, J.K.; Stephens, M.; Donnelly, P. Inference of population structure using multilocus genotype data. Genetics 2000, 155, 945–959. [Google Scholar] [CrossRef] [PubMed]
- Evanno, G.; Regnaut, S.; Goudet, J. Detecting the number of clusters of individuals using the software STRUCTURE: A simulation study. Mol. Ecol. 2005, 14, 2611–2620. [Google Scholar] [CrossRef]
- Earl, D.A.; VonHoldt, B.M. Structure Harvester: A website and program for visualizing STRUCTURE output and implementing the Evanno method. Conserv. Genet. Resour. 2012, 4, 359–361. [Google Scholar] [CrossRef]
- Mathiang, E.A.; Sa, K.J.; Park, H.; Kim, Y.J.; Lee, J.K. Genetic Diversity and Population Structure of Normal Maize Germplasm Collected in South Sudan Revealed by SSR Markers. Plants 2022, 11, 7878. [Google Scholar] [CrossRef]
- Lu, J.; Zhang, Y.; Diao, X.; Yu, K.; Dai, X.; Qu, P.; Crabbe, M.J.C.; Zhang, T.; Qiao, Q. Evaluation of genetic diversity and population structure of Fragaria nilgerrensis using EST-SSR markers. Gene 2021, 796, 145791. [Google Scholar] [CrossRef] [PubMed]
- Samarina, L.S.; Kulyan, R.V.; Koninskaya, N.G.; Gorshkov, V.M.; Ryndin, A.V.; Hanke, M.V.; Flachowsky, H.; Reim, S. Genetic diversity and phylogenetic relationships among citrus germplasm in the Western Caucasus assessed with SSR and organelle DNA markers. Sci. Hortic. 2021, 288, 110355. [Google Scholar] [CrossRef]
- Peakall, R.; Smouse, P.E. GENALEX 6: Genetic analysis in Excel. Population genetic software for teaching and research. Mol. Ecol. Notes 2006, 6, 288–295. [Google Scholar] [CrossRef]
- Peakall, R.; Smouse, P.E. GenAlEx 6.5: Genetic analysis in Excel. Population genetic software for teaching and research-an update. Bioinformatics 2012, 28, 2537–2539. [Google Scholar] [CrossRef] [PubMed]
Disclaimer/Publisher’s Note: The statements, opinions and data contained in all publications are solely those of the individual author(s) and contributor(s) and not of MDPI and/or the editor(s). MDPI and/or the editor(s) disclaim responsibility for any injury to people or property resulting from any ideas, methods, instructions or products referred to in the content. |
© 2023 by the authors. Licensee MDPI, Basel, Switzerland. This article is an open access article distributed under the terms and conditions of the Creative Commons Attribution (CC BY) license (https://creativecommons.org/licenses/by/4.0/).