Article

Characterization, Antioxidant Potential, and Pharmacokinetics Properties of Phenolic Compounds from Native Australian Herbs and Fruits

1
School of Agriculture and Food, Faculty of Sciences, The University of Melbourne, Parkville, VIC 3010, Australia
2
Faculty of Biological Sciences, The University of Leeds, Leeds LS2 9JT, UK
*
Author to whom correspondence should be addressed.
Plants 2023, 12(5), 993; https://doi.org/10.3390/plants12050993
Submission received: 14 February 2023 / Revised: 17 February 2023 / Accepted: 20 February 2023 / Published: 21 February 2023

Abstract

:
In recent decades, plant bioactive phenolic compounds gained much attention due to their various health benefits. Therefore, this study aimed to analyze native Australian river mint (Mentha australis), bush mint (Mentha satureioides), sea parsley (Apium prostratum), and bush tomatoes (Solanum centrale) for their bioactive metabolites, antioxidant potential, and pharmacokinetics properties. LC-ESI-QTOF-MS/MS was applied to elucidate these plants’ composition, identification, and quantification of phenolic metabolites. This study tentatively identified 123 phenolic compounds (thirty-five phenolic acids, sixty-seven flavonoids, seven lignans, three stilbenes, and eleven other compounds). Bush mint was identified with the highest total phenolic content (TPC—57.70 ± 4.57 mg GAE/g), while sea parsley contained the lowest total phenolic content (13.44 ± 0.39 mg GAE/g). Moreover, bush mint was also identified with the highest antioxidant potential compared to other herbs. Thirty-seven phenolic metabolites were semi-quantified, including rosmarinic acid, chlorogenic acid, sagerinic acid, quinic acid, and caffeic acid, which were abundant in these selected plants. The most abundant compounds’ pharmacokinetics properties were also predicted. This study will develop further research to identify these plants’ nutraceutical and phytopharmaceutical potential.

1. Introduction

The growing interest in phytochemicals for general health to prevent chronic disease and aging fueled nutritionists and other scientists to explore the nature, composition, and presence of bioactive metabolites in plants [1]. It has been demonstrated that some of these bioactive metabolites have curative, preventive, nutritional, and antioxidant properties [2]. Phytochemicals from fruits, vegetables, herbs, spices, and medicinal plants have been extensively studied. Moreover, identifying bioactive metabolites from fruits, herbs, and spices provides the basis for these plants’ putative functionality. In addition to antioxidant functions, phytochemicals play roles in enzyme modulation, cell proliferation and apoptosis, cell transduction, and cell signaling [3].
Plants’ secondary metabolites, particularly polyphenols, have attracted much interest due to their beneficial health properties [4,5]. Australia is enriched with native flora, and possesses around 25,000 species of indigenous plants which have a commercial significance as a novel food source in the medicinal, pharmaceutical, and cosmetic industries due to their rich sources of antioxidant and antimicrobial constituents [6]. Australian herbs and medicinal plants provide novel antioxidant compounds in pharmaceutical, nutraceutical, and functional foods [7]. For decades, herbs and fruits have been used to treat aches, bone fractures, joint inflammation, sprains, and the healing of wounds [8]. Herbs, spices, and fruits are widely used for their health-promoting properties as antidiabetic, antioxidant, anti-inflammatory, antimicrobial, neuro- and cardioprotective, anti-HIV, antipyretic, antihypertensive, and antidepressant agents [9,10,11]. Phenolic metabolites have attracted much interest due to their wide range of proven biological properties. The role of phenolic metabolites in health promotion and disease prevention has been widely studied in recent decades. Phytochemicals, especially polyphenols, have different vital biological activities, including the inhibition of cellular inhibition, signal transduction pathways, enzyme activity, metal chelation, and free radical scavenging capacity in cells [8,11]. Oxidative stress occurs due to the excess of free radicals in the body, while natural antioxidants from native herbs and medicinal plants can inhibit this. Due to chronic oxidative stress, different pathological conditions such as the aging process, cancers, and cardiovascular diseases occur in the human body. Therefore, these native herbs and fruits could be utilized to inhibit the acceleration of these pathological conditions. Bush tomatoes, also known as desert raisin or bush sultana, have been widely grown in the central Australian desert for millennia. The dried bush tomatoes have a piquant and intense caramel flavor, imparting an attractive zest to food products or cuisines. Bush mint, river mint, and sea parsley are other widely used herbs as food flavoring.
Various studies have been conducted to explore the bioactive metabolites [12], but a comprehensive profiling of river mint, bush mint, sea parsley, and bush tomatoes is scarce due to their complex nature, unavailability of commercial standards, and the structure of phytochemicals. The prime purpose of this study was the in-depth profiling of selected plants for the presence of phenolic metabolites important for human health and animal feed. In this perspective, we employed LC-ESI-QTOF-MS/MS to identify and quantify bioactive metabolites from bush mint, river mint, bush tomatoes, and sea parsley. Furthermore, total phenolic content (TPC) and total flavonoid content (TFC) and their antioxidant activities including hydroxyl-radical scavenging activity (OH-RSA), ferric reducing antioxidant power (FRAP), 2,2′-azinobis-(3-ethylbenzothiazoline-6-sulfonic acid (ABTS), 2,2′-diphenyl-1-picrylhy-drazyl (DPPH), ferrous ion chelating assay (FICA), reducing power assay (RPA), and phosphomolybdate assay (PMA) were also quantified. LC-ESI-QTOF/MS-MS is a widely used cutting-edge analytical technique for the profiling of plant extracts due to improved peak resolution, greater authenticity, and high sensitivity. The oral bioavailability, Caco-2 cells, and gastrointestinal absorption, metabolism, distribution, and toxicity of phenolic bioactive metabolites were also evaluated in this study. This study will explore the use of Australian native herbs and fruits in the pharmaceutical, medicinal industry, food, and feed industry due to their potent antioxidant and favorable pharmacokinetics properties.

2. Results and Discussion

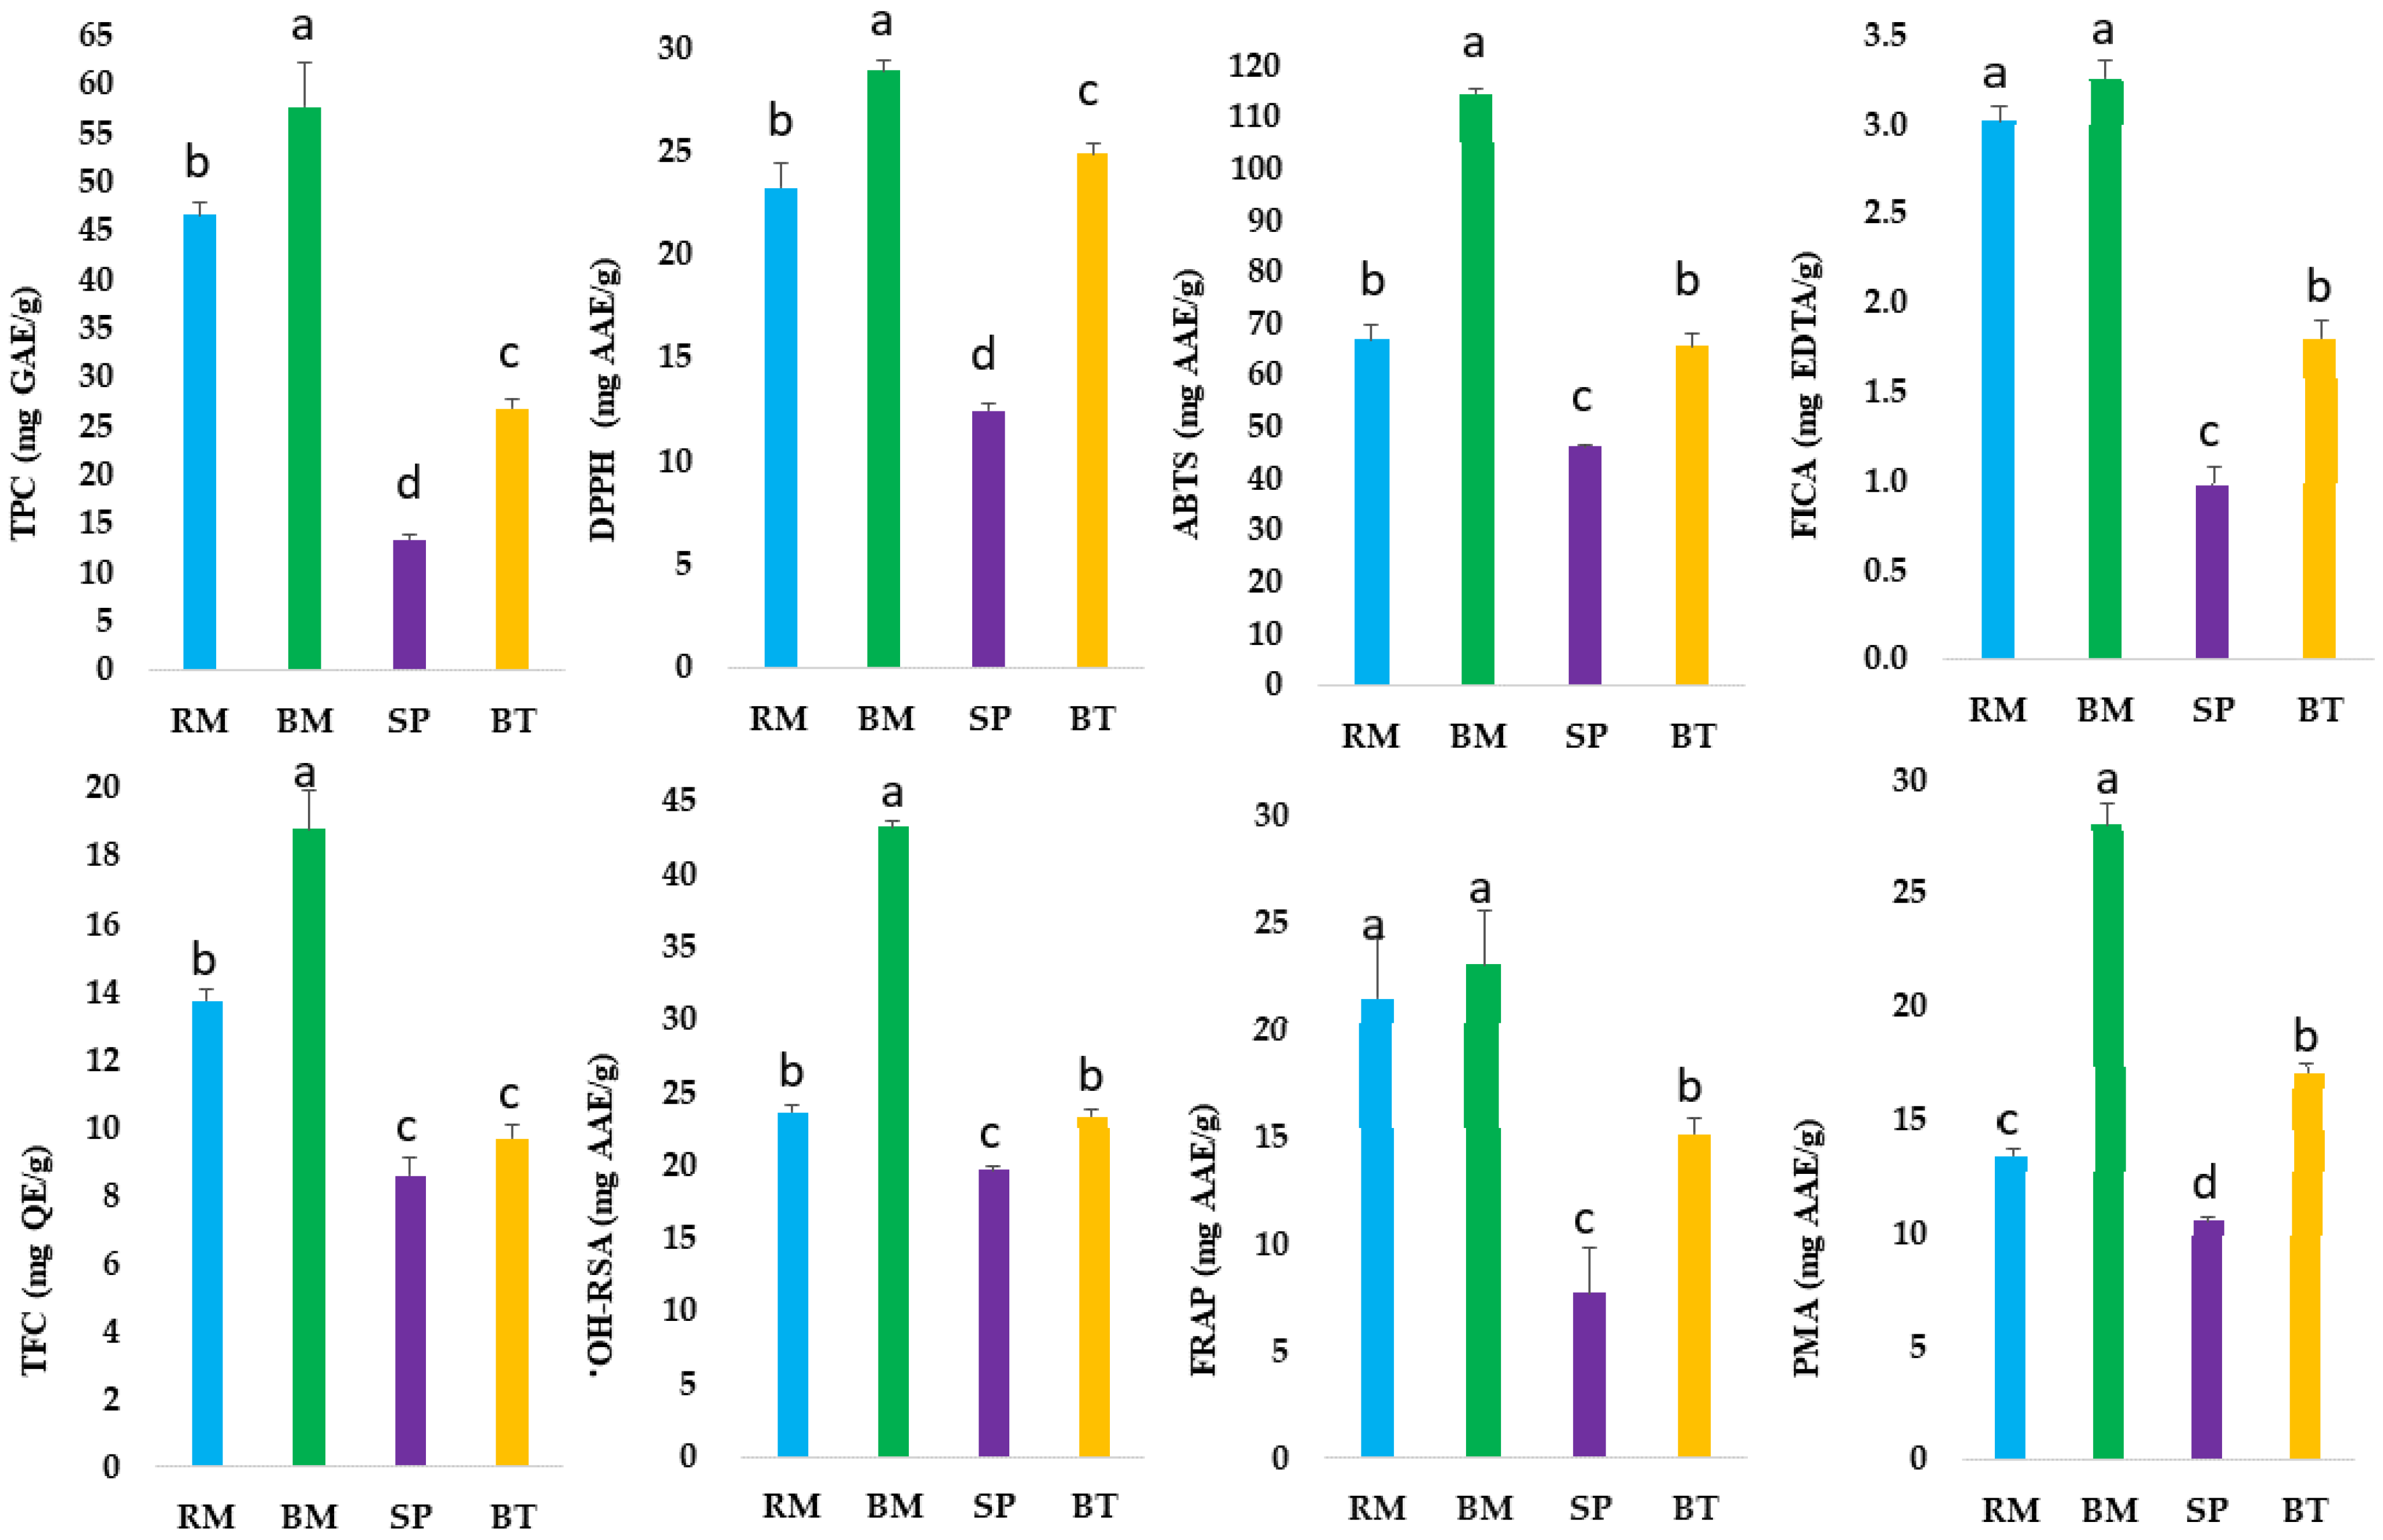
2.1. Estimation of Total Polyphenols and Total Flavonoids

The interest in improving human and animal health through dietary phytochemicals, especially polyphenols, has increased in recent years [13]. The use of herbs and fruits as sources of bioactive and nutraceutical compounds has attracted much attention from nutritionists and pharmacologists [3]. These bioactive compounds have protective and healing properties. Plant-derived bioactive compounds have various activities in the biological system. Phenolic compounds are the most extensively studied phytochemicals due to their wide range of biological functions and impact on human health [14]. Native Australian herbs and fruits are a rich source of phytochemicals, especially phenolic compounds [15]. In this study, we measured the total phenolic content (TPC) and total flavonoid content (TFC) and their antioxidant activities in river mint, bush mint, sea parsley, and bush tomatoes (Figure 1 and Table S1).
The TPC is usually used to measure the total phenolics including phenolic acids, flavonoids, stilbenes, lignans, and other polyphenols. The highest value of TPC (57.70 ± 4.57 mg GAE/g) was found in bush mint. Overall, native Australian herbs and fruits were observed with an average value of TPC (36.13 mg). The TPC values of bush tomatoes (26.78 ± 1.00 mg GAE/g) and sea parsley (13.44 ± 0.39 mg GAE/g) were also measured. In this study, the level of phenolic contents in bush mint was two- to three-fold higher than lemon myrtle and Tasmanian pepperberry, while the phenolic contents of bush tomatoes and sea parsley were comparable to Australian native Tasmanian pepperberry and lemon myrtle, respectively [15,16]. Furthermore, the phenolic contents in bush mint and river mint were also comparable with Chinese star anise (53.89 ± 1.51 mg GAE/g), citron fruit (46.22 ± 1.01 mg GAE/g), and villous amomum fruit (46.02 ± 1.12 mg GAE/g) [17], while Australian native bush tomatoes, bush mint, and river mint contained higher phenolic compounds than dark plum fruit (11.08 ± 0.19 mg GAE/g), perilla leaf (11.30 ± 0.16 mg GAE/g), peppermint (13.17 ± 0.04 mg GAE/g), black pepper (17.16 ± 0.11 mg GAE/g), and ginger (21.24 ± 0.09 mg GAE/g) [17].
The phenolic contents of native Australian sea parsley (13.44 ± 0.39 mg GAE/g) were comparable to cape jasmine fruit (13.77 ± 0.05 mg GAE/g), kudzu vine root (13.72 ± 0.65 mg GAE/g), and peppermint (13.17 ± 0.04 mg GAE/g), while the phenolic contents of native Australian bush tomatoes (26.78 + 1.00) mg GAE/g) were comparable with mulberry leaf (25.22 + 0.36 mg GAE/g) and Chinse raspberry (23.94 + 0.47 mg GAE/g) [17].
Previously, Sommano et al. [18] measured the total phenolic compounds in bush tomatoes in the range of 7.02 mg/g, while [12] measured the TPC value in the range of 12.4 mg/g which are lower than this study. In our previous study on Australian-grown herbs [3], we measured the total phenolic content (12.43 mg GAE/g/g) in parsley, which is comparatively lower than Australian native sea parsley. The higher value of TPC represents that 80% methanol with 0.1% formic acid allowed better extraction compared to the solvent, time, and other conditions used in the previous study by [12,18]. Other possible reasons might be the different types of cultivars used in current and previous studies. The variation in TPC can also be attributed to various conditions such as solvent, concentration, solvent-to-sample ratio, time and temperature, cultivar, and geographical location where these plants were grown [8]. Furthermore, the methods used to measure the TPC also affect the estimation of phenolics. The TPCs of river mint and bush mint were lower than in a previously conducted study [19].
On the other hand, the TFC values in bush tomatoes (9.66 ± 0.42 mg QE/g) and sea parsley (8.59± 0.51 mg QE/g) were almost the same in both plants’ extracts. The higher TFC value was measured in bush mint (18.81 ± 1.14 mg QE/g) and river mint (13.73 ± 0.32 mg QE/g), respectively. Previously, flavonoids were measured in the range of 8.28–14.7 mg QE/g in river mint, while in this study, river mint was observed 13.73 mg QE/g, which is lower than the previously conducted research [20]. Furthermore, characterization and quantification with LC-MS/MS can deliver more accurate information regarding the presence of individual phenolic metabolites in Australian native herbs and fruits.

2.2. Antioxidant Potential of Australian Native Herbs and Medicinal Plants

In this study, a total of six in vitro antioxidant assays were conducted to measure the antioxidant potential of Australian native river mint, bush mint, bush tomatoes, and sea parsley (Table S1, Figure 1).
The DPPH free radical scavenging activity of the selected native Australian plants varied between 12.47 and 28.86 mg AAE/g. Bush mint was quantified with the highest scavenging activity, whereas sea parsley contained the lowest DPPH (12.47 ± 0.35 mg AAE/g) scavenging activity. Previously, Tang et al. [21] quantified the DPPH (110.2 ± 9.0 μmol GAE/g) in native oregano (Prostanthera rotundifolia), which is also a type of mint bush. The ABTS assay is an efficient technique to determine the antioxidant activity in plant food extracts as the response of antioxidant ingredients involves rapid reaction kinetics [22]. In this assay, the antioxidant activity of the extracted sample was determined by its reaction with a preformed solution of ABTS+ radical cation [3]. The ABTS scavenging activity of the selected native plants was found in the range of 46.18 to 114.44 mg AAE/g (Table S1). The highest ABTS scavenging activity (114.44 ± 1.01 mg AAE/g) was quantified in bush mint, while the lowest ABTS (46.18 ± 0.38 mg AAE/g) activity was quantified in sea parsley. Previously, Tang et al. [21] quantified the ABTS (262.4 ± 2.2 μmol TE/g) in mint bush (Prostanthera rotundifolia). The findings of our study are in accordance with the previous studies that reported that herbs and spices with the higher TPC possessed higher antioxidant activity [3,8]. The ABTS scavenging activity was higher than DPPH probably because the ABTS assay was used to measure the antioxidant capacity of hydrophobic and hydrophilic phenolic compounds [23,24]. The ABTS and DPPH of bush mint (114.44 ± 1.01 mg AAE/g) and (28.86 ± 0.49 mg AAE/g) were also found to be higher than what we previously investigated in Australian grown mint (106.99 ± 2.90 mg AAE/g) and (21.65 ± 0.36 mg AAE/g), respectively [3]. This indicates that bush mint has a higher antioxidant potential than mint. The highest FRAP (23.02 ± 2.57 mg AAE/g) activity was quantified in bush mint, while the lowest FRAP (5.13 ± 1.42 mg AAE/g) was quantified in sea parsley.
The metal chelating ability of Australian native herbs and fruits was estimated by using the ferrous ion chelating assay (FICA), and the highest FICA (3.26 ± 0.10 mg EDTA/g) was observed in bush mint. Furthermore, the highest OH-RSA value (43.25 ± 0.42 mg AAE/g) was also measured in bush mint. This is vital because it inhibits lipid peroxidation by inhibiting the transition of oxidized metal ions [25,26]. It has been reported that there is no single method to measure the total antioxidant potential of plant extracts due to the diverse nature of antioxidant compounds, especially phenolic constituents. The reactive oxygen species (ROS), mainly hydroxyl radical (OH), hydrogen peroxide (H2O2), and superoxide radical (O2), are regularly produced in the human body and harm various cellular biomolecules including protein, carbohydrates, DNA, and lipids leading to different diseases. The highest iron chelating activity observed in bush mint was probably due to the excessive concentration of chelators in its extract. The radical scavenging capacity and reducing ability of iron chelators are dependent on their concentration. A significant variation in the ferrous iron chelating ability of different spices, fruits, vegetables, and root vegetables were also reported [27]. A thorough review of the literature suggests that probably this is the first attempt to determine the scavenging ability of the selected native Australian plants by conducting OH-RSA and FICA, hence no data are available for comparison. However, in some studies [8], OH-RSA and FICA assays have been conducted to determine the antioxidant potential of herbs and spices by measuring their potential, and significant variations were recorded in all samples. The variation in results compared to other herbs might be attributed to differences in herb species, maturity stages, agro-ecological conditions, and extraction methods [3,8].

2.3. Correlation of Total Phenolic Content and Antioxidant Activities

In this context, we represented the results of phenolic compounds in four Australian native herbs and medicinal plants and their antioxidant potential (Table 1).
A highly significant, positive correlation (p ≤ 0.05) of TPC was observed with TFC (r = 0.96). The ferric reducing activity of native herbs was strongly correlated with TPC having a Pearson’s correlation coefficient r = 0.96 (p ≤ 0.05). This positive correlation between TPC and FRAP indicates that the reducing power of the selected native herbs and medicinal plants are strongly linked with their non-flavonoids. These results are in line with findings of Ali et al. [8], who documented that the ferric reducing power ability of dragon fruit was positively associated with its phenolic contents. The ABTS assay established the chain-breaking ability of antioxidants through hydrogen donation by scavenging ABTS+ radicals. The strong positive correlation between TPC and ABTS suggests that the selected native Australian herbs contain abundant antioxidants which have a strong ability to scavenge ABTS+ radicals by donating hydrogen. The TFC of phenolic extracts of native herbs depicted a highly positive correlation with OH-RSA (r = 0.92, p ≤ 0.01) and ferric ion chelating activity (r = 0.91, p ≤ 0.01). This indicates that the OH-RSA scavenging activity and ferric ion chelating activity of phenolic extracts of native plants were significantly contributed to by the total flavonoid content. In this experiment, we noted a positive correlation between DPPH and FRAP, FRAP and FICA, and PMA and OH-RSA. A significant positive correlation between the FRAP and ABTS of spices was also observed previously [3,8].
It has been reported that the DPPH assay is suitable to measure the antioxidant activities of hydrophobic compounds only while the ABTS scavenging assay measures the activity of lipophilic and hydrophilic compounds [3,8,28,29]. This appears to indicate that phenolic compounds in the bush mint samples had a direct relationship with the antioxidant mechanisms of ferric reducing and ferric chelating activity, while flavonoids were more closely associated with the OH and ferric chelating activities. The results indicate the versality of bioactive compounds in the extracts of native Australian herbs and medicinal plants [30]. Furthermore, the arrangement and number of hydroxyl groups on the ring structure are important to determine the total antioxidant potential of plant extracts [31].

2.4. LC-MS/MS Analysis

To confirm the hypothesis that phenolic compounds may contribute to antioxidant activities, phenolic extracts (bush tomatoes, bush mint, river mint, and sea parsley) were further characterized through LC-ESI- QTOF-MS/MS (Figure S1). A total of 123 phenolic metabolites were tentatively identified in these plants (Table 2).

2.4.1. Phenolic Acids

Thirty-five compounds were recognized as phenolic acids. It has been reported that phenolic acids have better sensitivity in the negative mode [32]. Compound 2 (gallic acid—C7H6O5) was identified in bush mint, bush tomatoes, and sea parsley, confirmed through pure standard due to the constant product ion at ESI m/z 125 after the removal of CO2 from the precursor ion (m/z 169) [8]. Protocatechuic acid 4-O-glucoside was identified in sea parsley, bush mint, and bush tomatoes at m/z 315.0721 confirmed through the MS/MS product ion at m/z 153 after the removal of glycosyl moiety from the precursor ion. Furthermore, protocatechuic acid (compound 5) and p-hydroxybenzoic acid (compound 7) produced fragments at ESI m/z 109 and 93 (Figure S2). Protocatechuic acid is widely distributed in various plants and has antimicrobial, antioxidant, anti-inflammatory, antiviral, anticancer, antiaging, antidiabetic, neuro-protective, cardioprotective, and hepatoprotective properties [33].
Rosmarinic acid, chicoric acid, ferulic acid, sinapic acid, 3-caffeoylquinic acid (chlorogenic acid), caffeic acid, p-coumaric acid, syringic acid, and cinnamic acid were confirmed through pure standards. Compound 22 (p-coumaric acid—C9H8O3) was putatively identified in bush tomatoes, bush mint, river mint, and sea parsley in the negative mode at m/z 119 after the loss of CO2 [M−H−44] from the precursor ion (m/z 163.0395) (Figure S3). Ferulic acid (compound 23) was confirmed through the pure standard at m/z 193.0504 in river mint and sea parsley. Ferulic acid has been reported for a wide range of therapeutic properties including antioxidant, anticancer, antidiabetic, antiapoptotic effect, antiaging effect, neuro-protective effect, radioprotective effect, pulmonary protective effect, hypotensive effect, and antiatherogenic effect [34]. Furthermore, 3-feruloyqunic acid (compound 24) was detected in river mint and bush tomatoes, while 1,5-dicaffeoylquinic acid (compound 29) was detected in sea parsley, bush mint, and bush tomatoes in both modes. Compound 30 (m/z 179.0353) was identified as caffeic acid after producing a product ion at ESI m/z 135 (Figure S2). Rosmarinic acid produced a characteristic fragment at m/z 197, which was a 2-hydroxy derivative of hydrocaffeic acid, while two caffeic acid fragments at 161 and 135 represented the removal of H2O and CO2 (Figure S2). Rosmarinic acid (compound 33) was one of the most abundant phenolic acids commonly present in these herbs. It has various health benefiting properties such as anti-inflammatory, antidepressant, antiulcerogenic, antioxidant, and antimicrobial properties which were widely studied in different studies [35,36]. Previously, it was also identified and quantified in oregano, rosemary, mint, basil, bay, and thyme [3].

2.4.2. Flavonoids

Sixty-seven flavonoids were detected in the selected plants. Compound 37 (m/z 289.0704) was detected in bush mint and bush tomatoes in the negative mode. Compound 37 was tentatively identified as epicatechin (C15H14O6) [37]. Procyanidin dimmer B2 (compound 36) was detected in bush tomatoes which made product ions at m/z 451, 525, 407, and m/z 289. Procyanidin trimmer C1 (compound 38) was found in bush mint at ESI m/z 865.2004. Previously, procyanidin dimmer B1 and procyanidin trimmer C1 were detected in nutmeg and cinnamon [8]. Compound 44 (neoeriocitrin) was detected in bush tomatoes, bush mint, and river mint. Previously, Zeng et al. [38] also reported neoeriocitrin in the extract of Exocarpium Citri grandis (ECG). Naringin (compound 47) at ESI was putatively identified in bush tomatoes, bush mint, river mint, and sea parsley, which produced daughter ions at m/z 459, m/z 313, and m/z 271 after the loss of [M–H−C8H8O], [M–H–C8H8O-rha], and [M–H–rha-glu] from the precursor ion. Compound 58 at ESI m/z 285.0403 produced fragment ions at m/z 177, 151, and 119 after the loss of C6H6O [M-H-94], C8H8O [M-H-120], and C7H7O4 [M-H-152], respectively, from the precursor ion. Compound 58 was tentatively identified as 3,4′,7-Tetrahydroxyflavone. Compounds 54 (kaempferol), 57 (swertisin), 60 (diosmin), 63 (diosmetin), and 66 (chrysin) were identified through the MS/MS spectra of pure standards.
Kaempferol 3,7-O-diglucoside (compound 77) at ESI m/z 609.1459 was tentatively identified in bush tomatoes, bush mint, river mint, and sea parsley, which generated product ions at m/z 447 and m/z 285 after the loss of [M−H−162] and [M−H−324], respectively, detected in MS/MS. Myricetin 3-O-rhamnoside (compound 85), myricetin 3-O-rutinoside (compound 78), myricetin 3-O-arabinoside (compound 83), isorhamnetin 3-O-rutinoside (compound 74), isorhamnetin 3-O-glucuronide (compound 80), quercetin 4′-O-glucuronide (compound 82), kaempferol 3-O-glucuronide (compound 79), and jaceidin 4′-O-glucuronide (compound 81) produced fragment ions at m/z 317 (myricetin), m/z 315 (isorhamnetin), m/z 301 (quercetin), m/z 285 (kaempferol), and m/z 359 (jaceidin) after the loss of rhamnoside [M−H−146], rutinoside [M−H−308], arabinoside [M−H−132], and glucuronide [M−H−176] from their precursor ions, respectively (Table 2). Previously, myricetin 3-O-rhamnoside and quercetin 4′-O-glucuronide were reported in lemon and mint with a strong antioxidant potential [39]. Compound 86 (3,7-dimethylquercetin) was detected in bush tomatoes, bush mint, and river mint [40]. Previously, it had been identified in mint, rosemary, sage, basil, and oregano [3]. Compound 77 (kaempferol 3,7-O-diglucoside) at ESI m/z 609.1459 produced fragment ions at m/z 447 and m/z 287 after the loss of one glucoside [M−H−162] and two glucoside units [M−H−324].

2.4.3. Stilbenes and Lignans

Stilbenes and lignans are vital phenolic compounds due to their potent health effects. In this experiment, we putatively identified nine phenolic metabolites in selected herbs and medicinal plants. Piceatannol (compound 103) at ESI m/z 243.0643 generated a product ion at m/z 225 after the loss of H2O (18) from the precursor ion. Piceatannol was identified in sea parsley, river mint, and bush tomatoes. It has some well-known health properties such as antioxidant, antimutagenic, anticancer, and anti-inflammatory elements; see Ali et al. [3]. Compound 109 (m/z 361.1661) produced a product ion at m/z 346 after the removal of methyl radical from the precursor ion, while the same compound also produced product ions at m/z 177 and 165 after the C8-C8′-carbons’ cleavage from the parent ion. Previously, Hanhineva et al. [41] also defined the presence of secoisolariciresinol through MS/MS detected in whole-grain rye bran. Compound 106 (sagerinic acid) was only identified in bush mint. Previously, Velamuri et al. [42] identified and quantified sagerinic acid in sage and rosemary, while Serrano et al. [43] also reported sagerinic acid in Lepechinia meyenii (Walp.) Epling and Lepechina foribunda (Benth.) Epling. Lu and Yeap Foo [44] also reported the antioxidant activity of sagerinic acid. Sagerinic acid is widely distributed in herbs and spices. Compound 112 (enterolactone) at ESI+ m/z 299.1279 was tentatively identified in bush mint, river mint, and sea parsley and has been reported for having antioxidant [45] and anticancer activities [46].

2.4.4. Other Compounds

Phenolic terpenes including carnosol and carnosic acid were reported by Wang et al. [47]. Compound 121 and 122 (carnosol and carnosic acid) generated fragment ions at m/z 285 and m/z 287 via the removal of CO2 (44) from their precursor ions, respectively. The antioxidant potential of phenolic terpenes was reported by Zabot et al. [48] for the prevention of various pathologies in the pharmaceutical area. Both phenolic terpenes were reported in bush mint and river mint. Compound 113 (scopoletin) at ESI m/z 191.0355 was identified in bush mint, sea parsley, and bush tomatoes which produced a fragment ion at m/z 147 after the loss of CO2 from the precursor ion. Compound 117 (umbelliferone) was in all selected native herbs, while coumarin (compound 119) was detected through MS/MS product ions in bush mint, river mint, and bush tomatoes. Previously, coumarin was identified in cinnamon, fennel, allspice, and oregano, while umbelliferone was identified in mint, rosemary, oregano, sage, and basil [3,8].

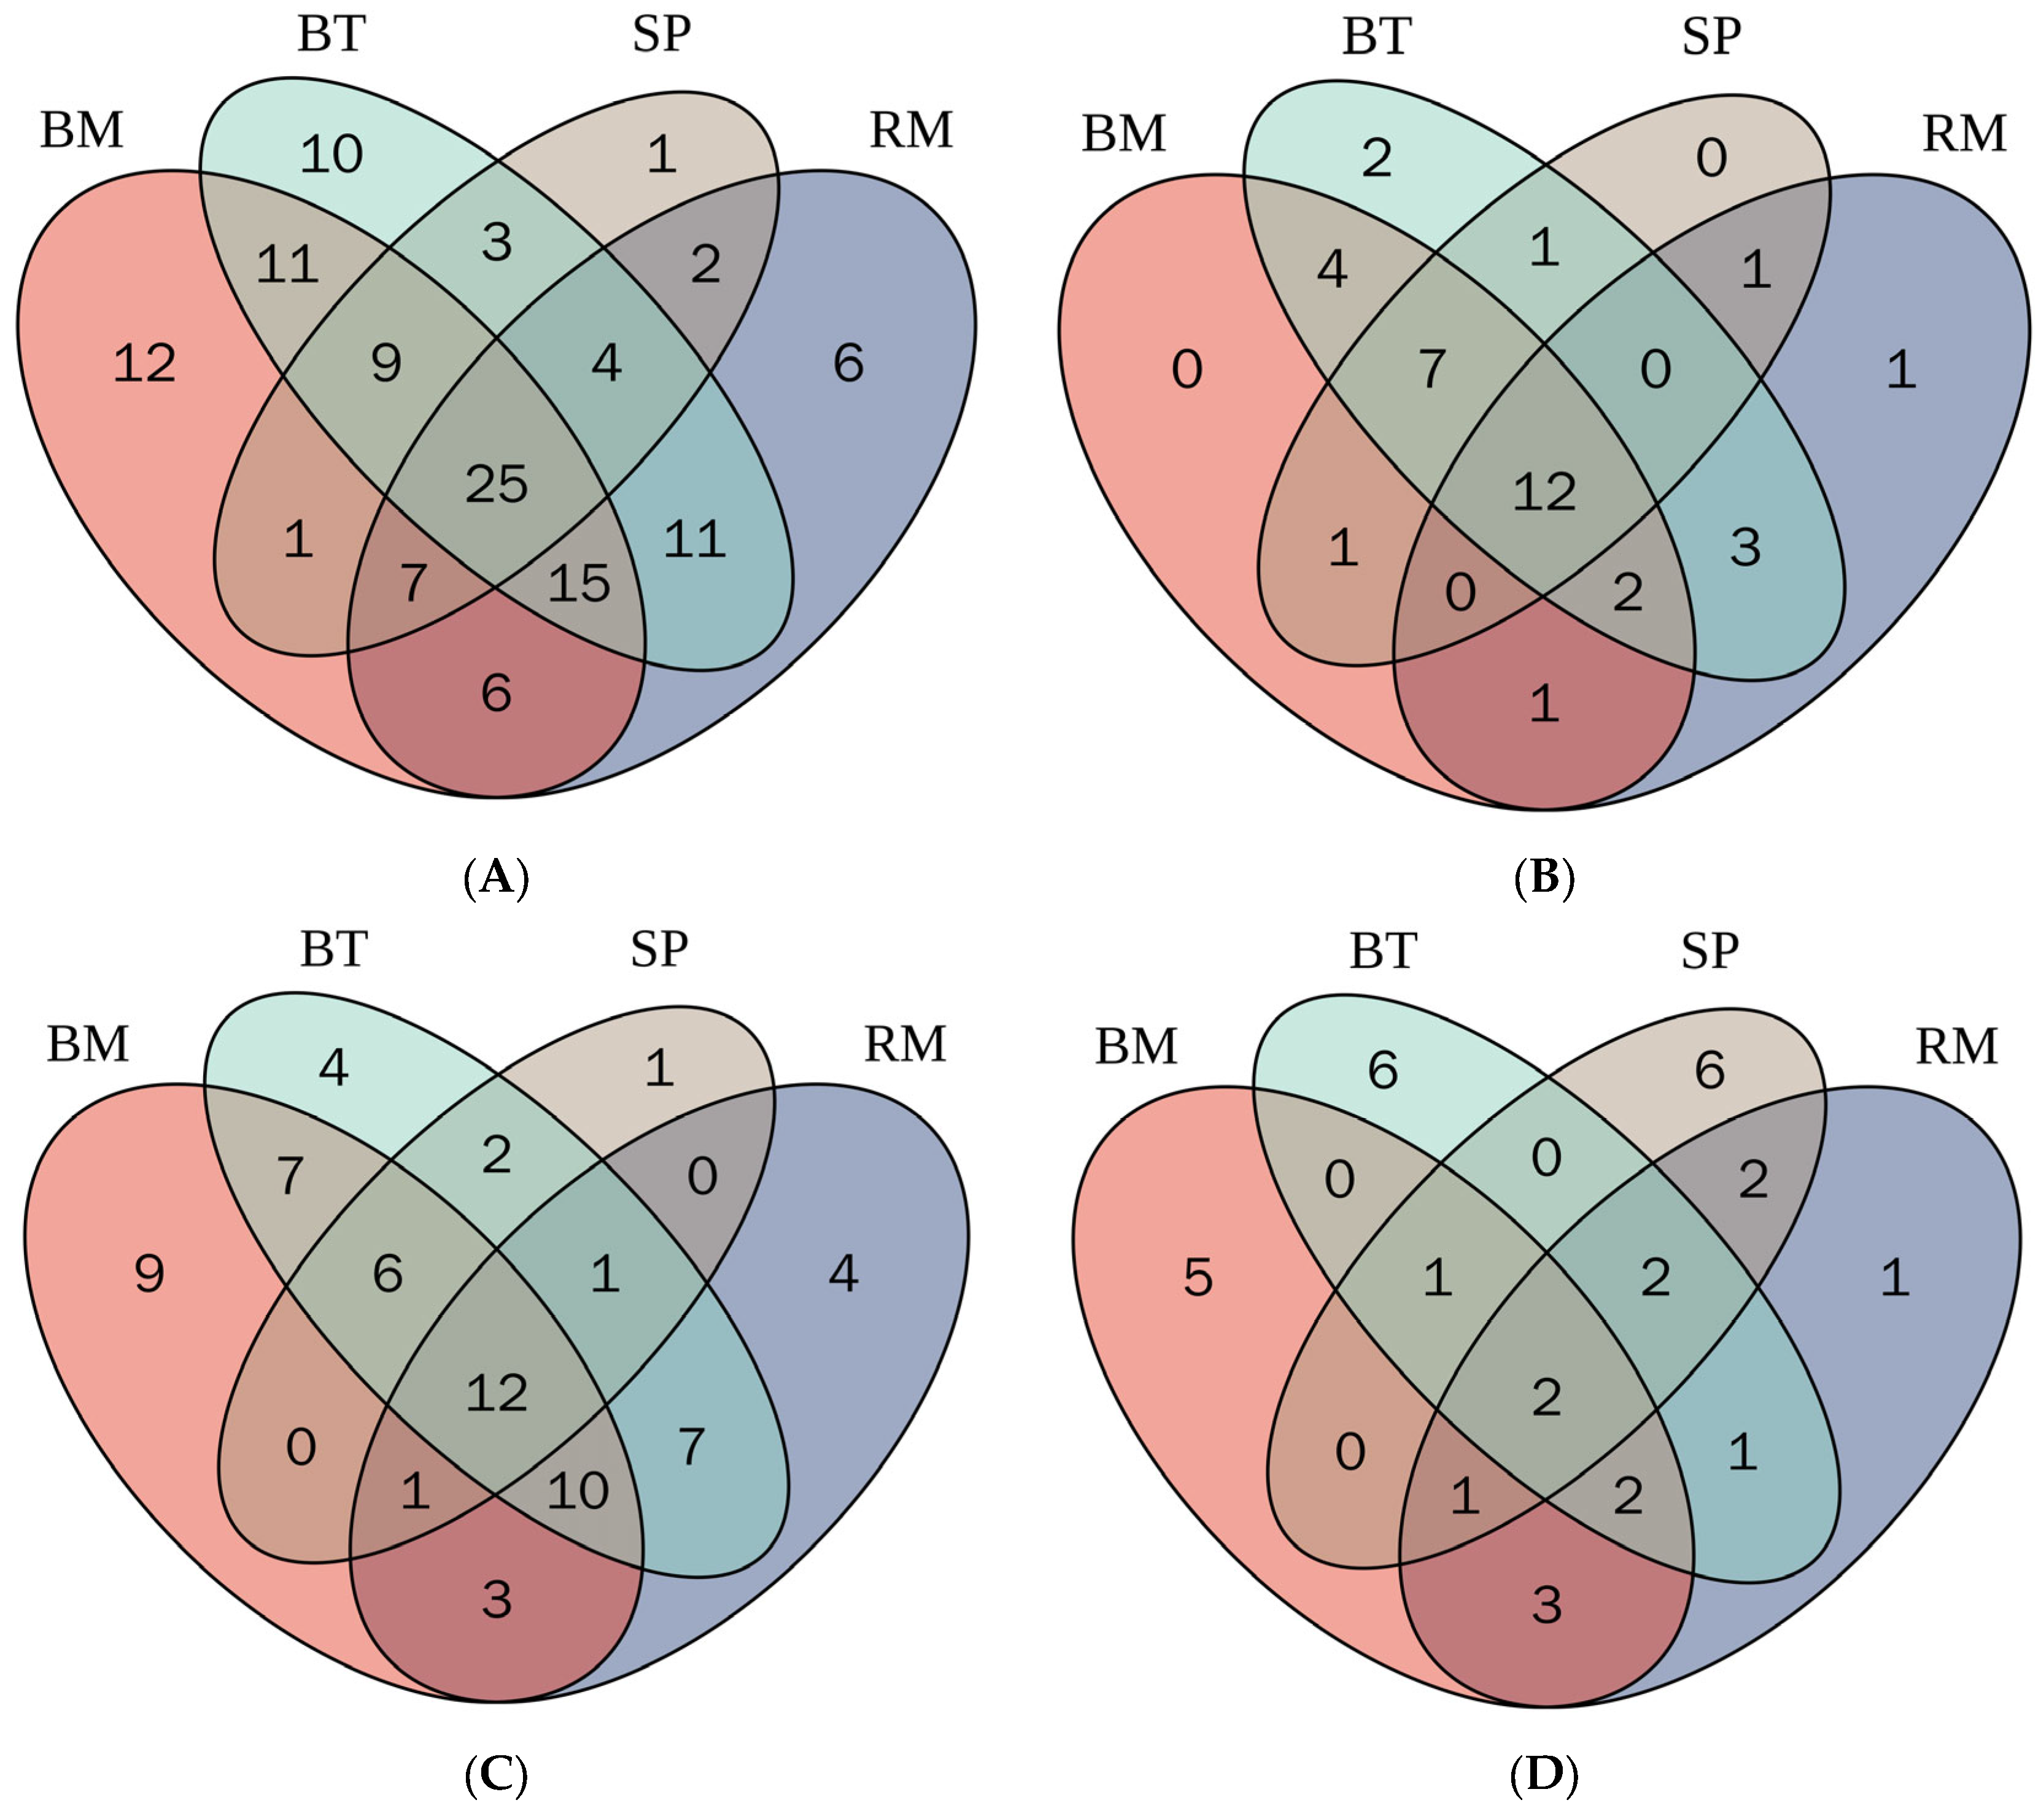
2.5. Distribution of Bioactive Phenolic Metabolites in Selected Native Australian Plants

The distribution of phenolic compounds in the selected native Australian plants was achieved by conducting the Venn diagram represented in Figure 2.
Native Australian herbs and fruits contain a diverse range of different phenolic compounds including total phenolics, total phenolic acids, total flavonoids, and total other polyphenols including stilbenes, lignans, phenolic terpenes, curcuminoids, and tyrosols, etc.
The Venn diagram (Figure 2A) represents that the highest total number of unique metabolites was identified in bush mint (12, 9.8%), while the total lowest number of unique metabolites was identified in sea parsley (1, 0.8%). In addition, 25 metabolites (20.0%) were overlapped in river mint, bush mint, bush tomatoes, and sea parsley. The results clearly demonstrate that bush mint contained a wide range of phenolic metabolites that contributed to the higher antioxidant potential. Moreover, the distribution of the total number of phenolic acids is represented in Figure 2B, which depicts that the highest number of unique phenolic acids was identified in bush tomatoes (2, 5.7%). Twelve phenolic acids were overlapped in bush mint, river mint, bush tomatoes, and sea parsley. Total flavonoids are represented in Figure 2C, which shows that the highest number of total unique flavonoids was detected in bush mint (9, 13.0%), while the lowest number of unique total flavonoids was detected in sea parsley (1, 1.5%). In flavonoids, twelve metabolites (18.0%) were present in all herbs and fruits, while seven (10.0%) compounds were overlapped in bush mint and bush tomatoes. Figure 2D was conducted to represent the distribution of the total other compounds (stilbenes, lignans, phenolic terpenes, curcuminoids, and tyrosols) in river mint, bush mint, bush tomatoes, and sea parsley. It depicts that the highest number of unique other metabolites (6, 19.0%) was identified in bush tomatoes and sea parsley, while the lowest number of other phenolic metabolites (1, 3.1%) was in river mint. Two (6.2%) other phenolic metabolites were overlapped in river mint, bush tomatoes, and sea parsley, while two (6.2%) other compounds were overlapped in river mint and sea parsley.

2.6. LC-MS/MS Quantification/Semi-Quantification of Individual Phenolic Metabolites

Natural products have been used to improve human health for years. The nutraceutical usage of fruits as protective and healing supplements has been increased due to their wide range of bioactive phenolic and non-phenolic metabolites. Polyphenols are organic compounds which are derived from plant-based foods, and they play a significant role in the prevention of many oxidative stress-related diseases such as cardiovascular, cancers and neurodegenerative diseases.

2.6.1. Phenolic Acids

A total of 17 phenolic acids were semi-quantified in Australian native herbs and fruits (Table S2). Rosmarinic acid was the most abundant phenolic metabolite found in bush mint (945.56 ± 43.50 μg/g) and river mint (745.67 ± 25.02 μg/g). It was also quantified in bush tomatoes (76.57 ± 4.98 μg/g) and sea parsley (23.43 ± 1.01 μg/g). The higher concentration of chlorogenic acid was quantified in bush tomatoes (747.52 ± 67.48 μg/g), bush mint (584.07 ± 12.39 μg/g), river mint (238.76 ± 14.99 μg/g), and sea parsley (29.07 ± 0.98 μg/g), respectively. Previously, rosmarinic acid was also quantified in oregano (1.6 mg/g), rosemary (0.54 mg/g), mint (0.20 mg), and other herbs [3]. Tang et al. [19] also quantified chlorogenic acid in Australian native mint (15.4 μg/mg of purified extract). Rosmarinic acid is the biomarker of herbs; therefore, it is widely identified and quantified in herbs. Previously, Tang et al. [19] also quantified rosmarinic acid in native mint (160.4 μg/mg of purified extract). Moreover, Wang et al. [49] quantified rosmarinic acid in the range of 2.0–27.4 mg/g, while Zheng and Wang [50] quantified rosmarinic acid in the range of 0.33–1.5 mg/g in different Mediterranean herbs through HPLC. We found only one study where they observed the antioxidant activities of Australian native bush mint, and only eight phenolic compounds were identified and quantified [21]. Both gallic acid and vanillic acid were quantified in bush tomatoes, bush mint, and sea parsley. Gallic acid was quantified in the range of 7.09–72.14 μg/g, while vanillic acid was quantified in the range of 70.49 to 118.08 μg/g in selected Australian native herbs. Furthermore, 3-p-coumaroylquinic acid and 5-feruloylquinic acid were quantified in sea parsley (9.24 ± 0.08 μg/g) and bush mint (80.20 ± 5.11 μg/g), respectively, while 3-sinapoylquinic acid was quantified in bush tomatoes (102.26 ± 5.06 μg/g), bush mint (107.34 ± 4.98 μg/g), river mint (114.73 ± 2.41 μg/g), and sea parsley (89.28 ± 3.04 μg/g), respectively. Caffeic acid and protocatechuic acid were also quantified in all selected Australian native herbs and fruits (Table S2). The highest amount of caffeic acid was found in river mint (556.80 ± 29.28 μg/g), while the least concentration was measured in bush tomatoes (11.66 ± 0.58 μg/g). To the best of our knowledge, a very limited number of studies was conducted on Australian native bush mint, bush tomatoes, river mint, and sea parsley.

2.6.2. Flavonoids

Flavonoids are the most abundant class of polyphenols widely present in fruits and vegetables [51]. A total of nine flavonoids were quantified in Australian native herbs and fruits (Table S2). Diosmetin (65.61 ± 2.04 μg/g), epicatechin gallate (67.79 ± 3.33 μg/g), acacetin (138.37 ± 22.49 μg/g), and luteolin (98.36 ± 1.73 μg/g) were only quantified in bush mint. Procyanidin B2 was only quantified in river mint (37.97 ± 4.10 μg/g) and bush tomatoes (44.15 ± 2.87 μg/g). Diosmin was quantified in bush mint (45.17 ± 2.96 μg/g), river mint (14.04 ± 0.47 μg/g), bush tomatoes (71.46 ± 5.57 μg/g), and sea parsley (10.64 ± 0.46 μg/g). Epicatechin was quantified in bush mint (39.90 ± 1.26 μg/g) and bush tomatoes (38.03 ± 0.19 μg/g). Kaempferol and kaempferol 3-glucoside were quantified in bush mint (64.16 ± 5.03 μg/g and 309.74 ± 50.04 μg/g) and sea parsley (12.48 ± 0.58 μg/g and 2.59 ± 0.18 μg/g), respectively.

2.6.3. Other Polyphenols

A total of 11 other polyphenols including stilbenes, lignans, coumarins, phenolic terpenes, and other polyphenols were quantified in Australian native herbs. Sagerinic acid and umbelliferone were only quantified in bush mint (690.71 ± 61.64 μg/g and 112.63 ± 24.94 μg/g), while rosmanol was only quantified in bush tomatoes (56.45 ± 4.88 μg/g). This is the first time that we have identified and quantified sagerinic acid in bush mint. Polydatin and resveratrol were quantified in bush mint (39.67 ± 1.12 μg/g and 116.03 ± 4.09 μg/g) and bush tomatoes (32.44 ± 1.87 μg/g and 135.25 ± 5.05 μg/g), respectively. Coumarin, carnosol, and carnosic were quantified in bush mint and river mint. Pyrogallol was quantified in river mint (10.56 ± 0.45 μg/g), bush tomatoes (17.93 ± 0.77 μg/g), and sea parsley (19.16 ± 0.47 μg/g), respectively.

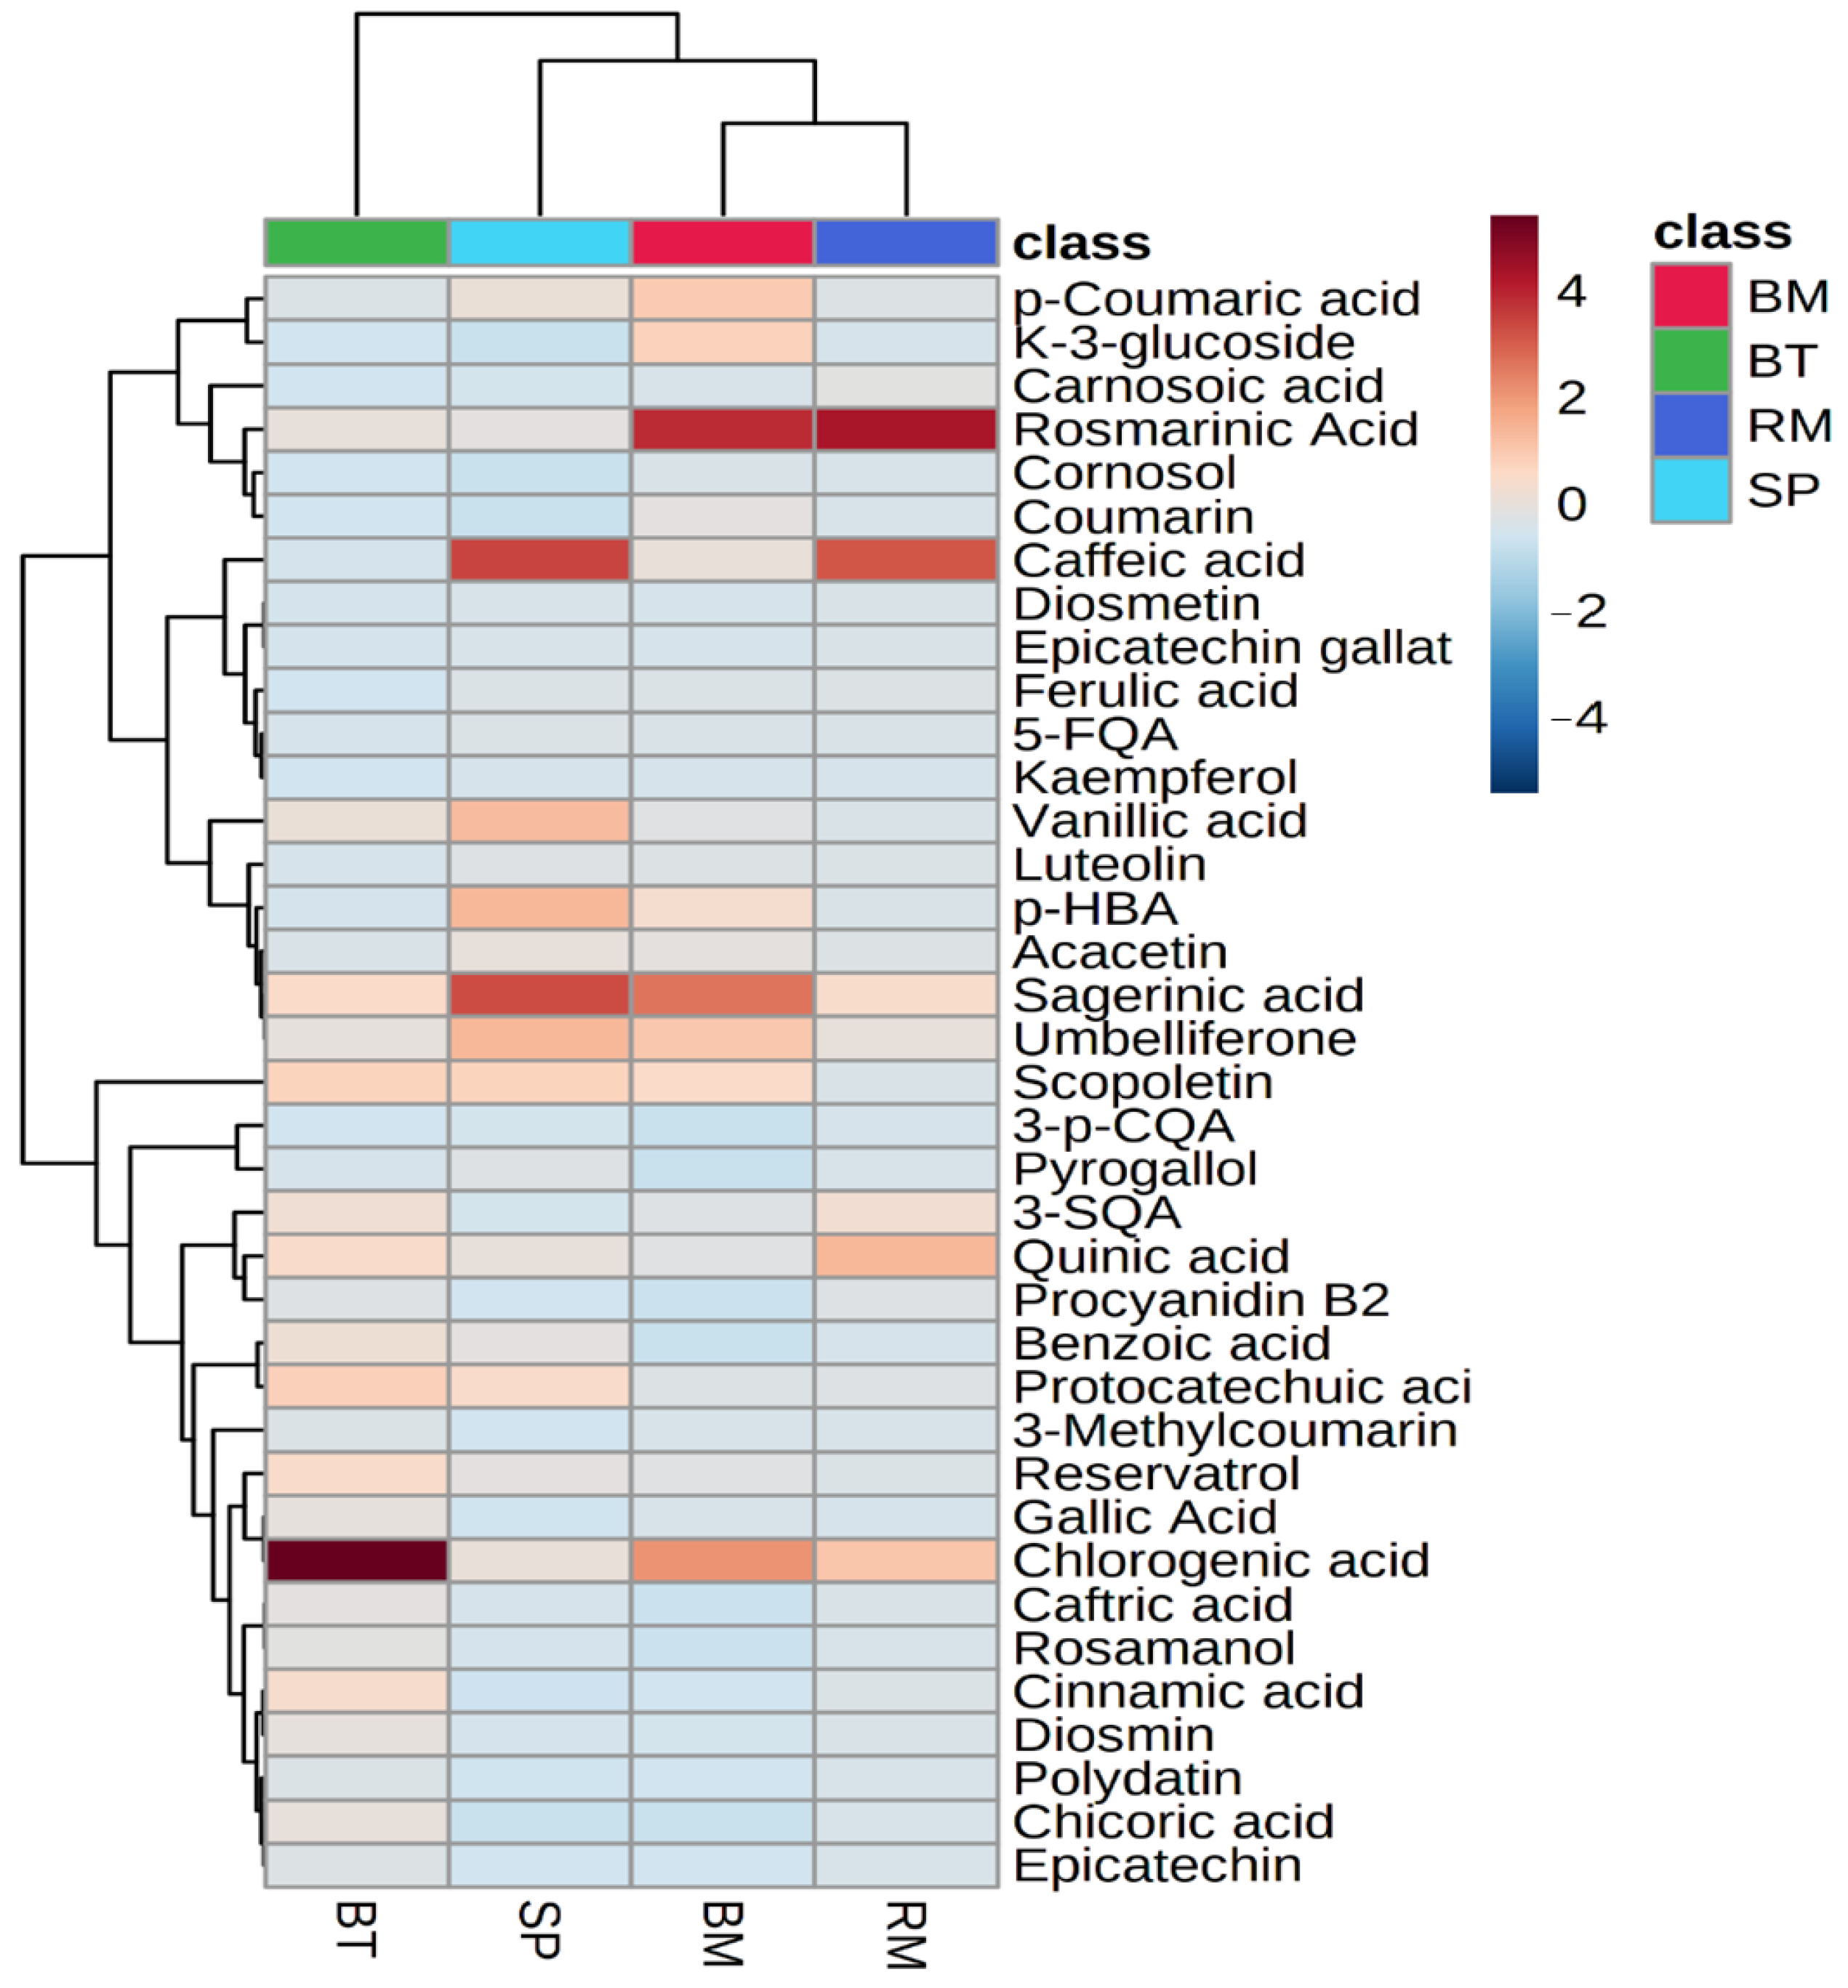
2.6.4. Heatmap and Hierarchical Clustering of Quantified Phenolic Metabolites

A heatmap and hierarchical clustering were conducted to illustrate the concentration of phenolic metabolites quantified in Australian native herbs (Figure 3).
The variation of color indicates the concentration of phenolic metabolites. The blue color indicates the lower or zero concentration, while the red color indicates the higher concentration of phenolic metabolites. A total of three column-wise and sixteen row-wise clusters were generated, where bush mint and river mint were correlated to each other, while bush tomatoes were correlated to bush mint, river mint, and sea parsley. The highest concentration of rosmarinic acid was observed in bush mint and river mint, while chlorogenic acid was quantified with the highest concentration in bush tomatoes.

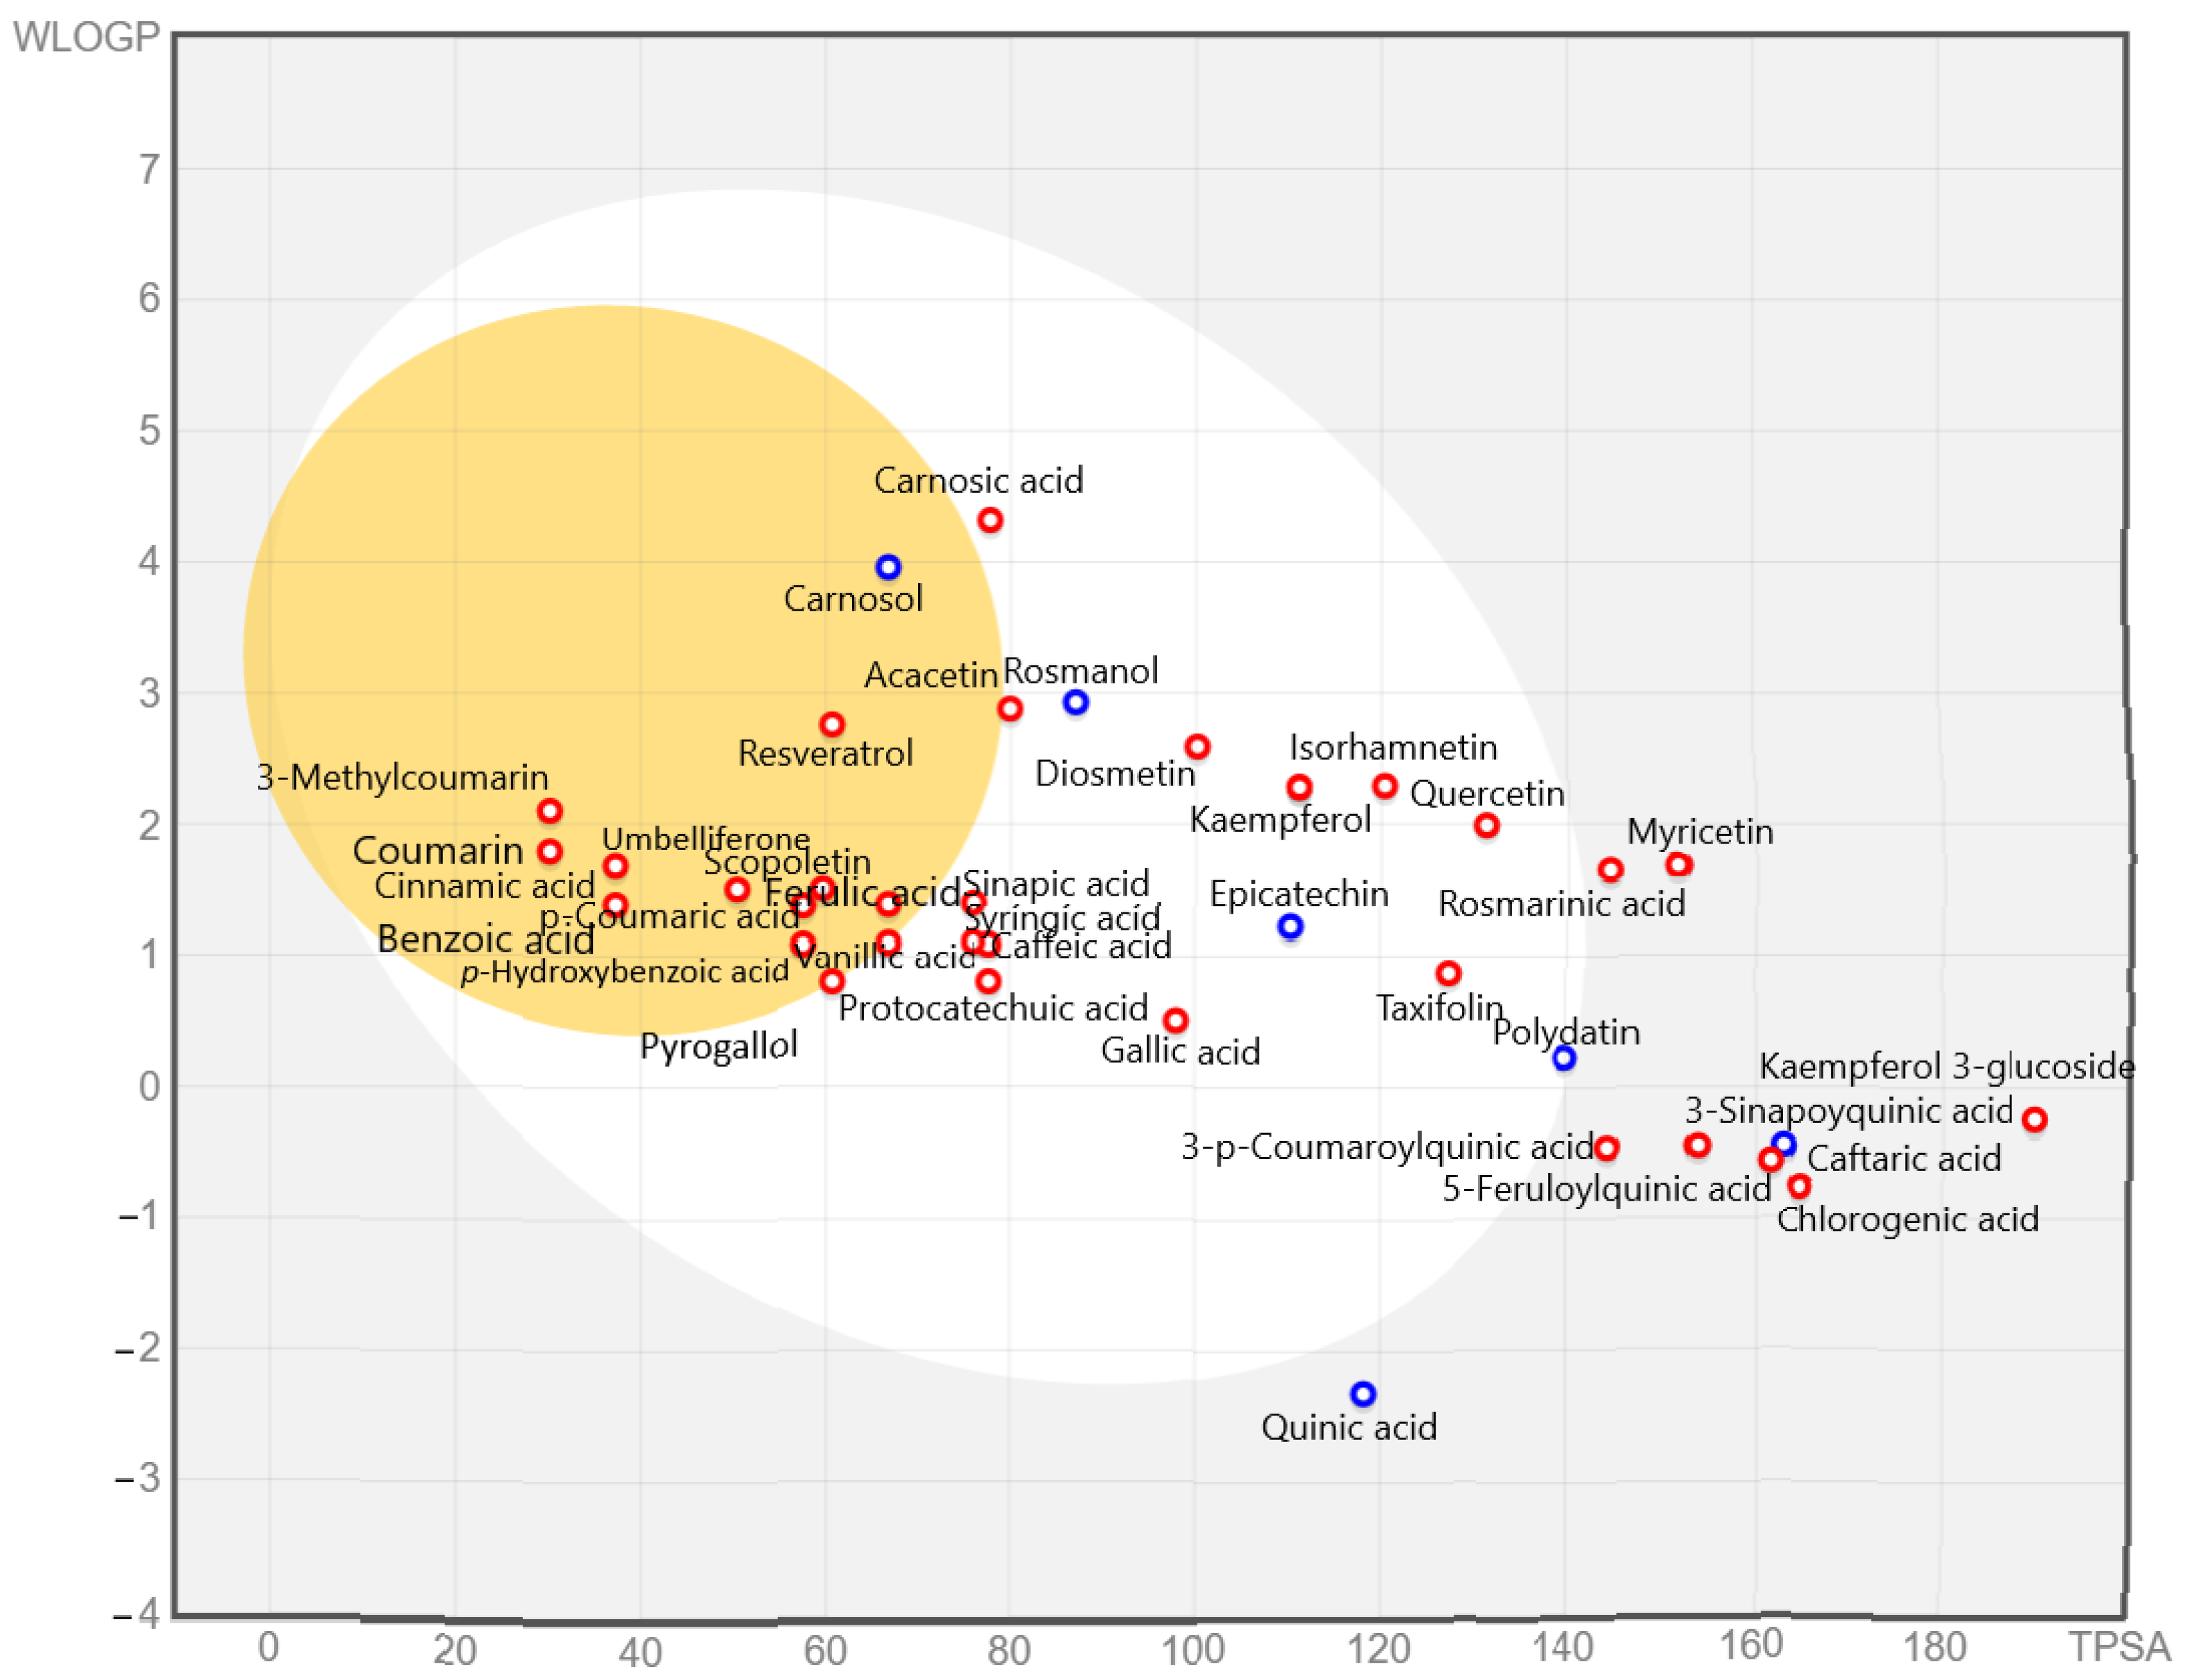
2.7. Pharmacokinetics Properties of the Abundant Phenolic Metabolites

The use of computational tools in drug discovery has increased. These methods are used to test the suitability of drug compounds for absorption, distribution, metabolism, excretion, and toxicology (ADMET) properties. Therefore, the study of drug compounds for ADMET properties is critical to improve the success rate of compounds during in vivo and clinical trials. In this context, we evaluated the ADMET properties of the most abundant phenolic compounds to improve the pharmaceutical potential of the selected native Australian medicinal plants in industrial and human utilization.

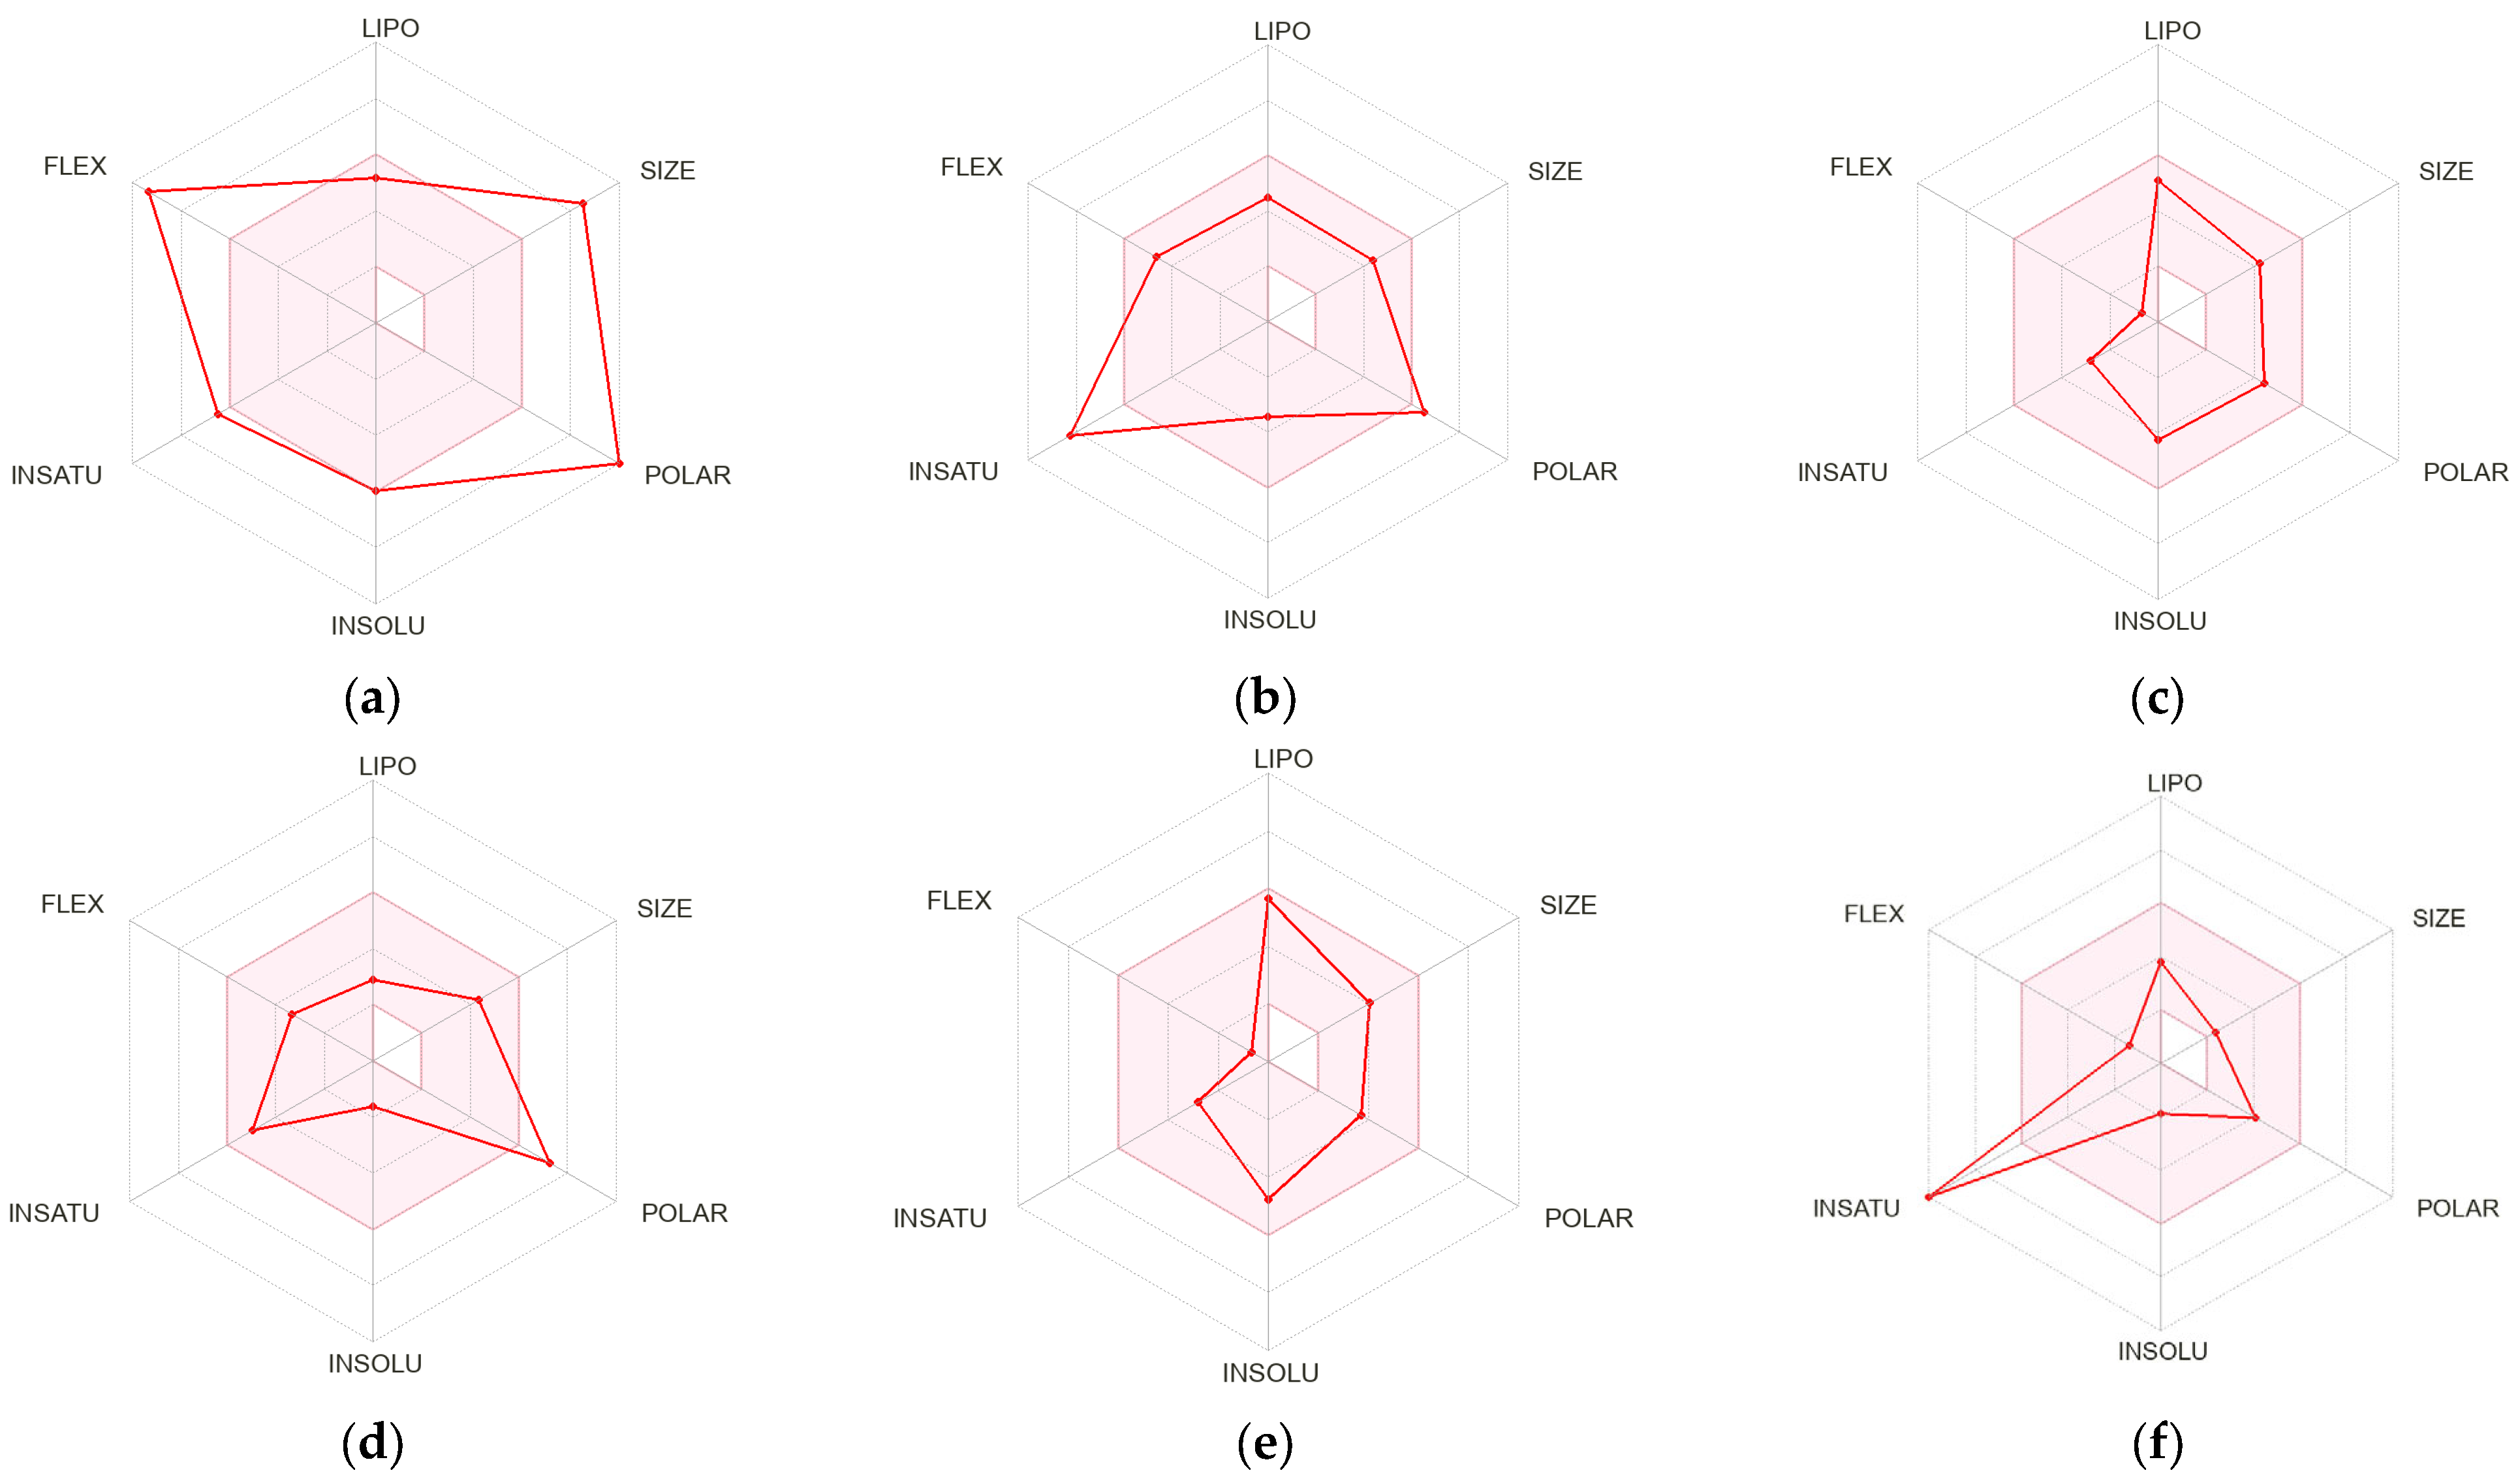
2.7.1. Predicted Absorption and Distribution of Phenolic Compounds

The absorption and distribution of the most phenolic species were predicted by the Boiled-Egg method and by following the previously reported protocol [15]. The obtained data are reported in Figure 4 and Tables S3 and S4.
The data in Figure 4 and Table S4 predicted that carnosol, coumarin, cinnamic acid, p-hydroxybenzoic acid, p-coumaric acid, 3-methylcoumarin, benzoic acid, resveratrol, umbelliferone, scopoletin, and ferulic acid readily passed through the blood–brain barrier (BBB), while protocatechuic acid, gallic acid, rosmanol, kaempferol, caffeic acid, acacetin, pyrogallol, carnosic acid, taxifolin, sinapic acid, vanillic acid, syringic acid, epicatechin, polydatin, quercetin, isorhamnetin, and diosmetin were absorbed through the gastrointestinal tract. In contrast, rosmarinic acid, quinic acid, caftaric acid, kaempferol 3-glucoside, myricetin, chlorogenic acid, 3-sinapoylquinic acid, 5-feroylquinic acid, and 3-p-coumaroylquinic acid did not predict gastrointestinal absorption.
Moreover, benzoic acid (100%), carnosic acid (99.03%), coumarin (97.34%), 3-methylcoumarin (97.26), scopoletin (95.28%), cinnamic acid (94.83%), umbelliferone (94.55%), acacetin (94.32%), ferulic acid (93.69%), p-coumaric acid (93.49%), rosmanol (93.41%), sinapic acid (93.06%), carnosol (91.21%), resveratrol (90.94%), p-hydroxybenzoic acid (83.96%), pyrogallol (83.55%), and luteolin (81.13%) were predicted with the highest human intestinal absorption, respectively (Table S3). Coumarin and 3-methylcoumarin predicted the skin permeability. It is worth noting that quinic acid and derivatives were predicted to have no human intestinal absorption (Table S3). Furthermore, cinnamic acid (1.72), benzoic acid (1.71), coumarin (1.65), 3-methylcoumarin (1.65), umbelliferone (1.21), p-coumaric acid (1.21), scopoletin (1.18), resveratrol (1.17), p-hydroxybenzoic acid (1.15), acacetin (1.14), pyrogallol (1.12), rosmanol (1.02), and taxifolin (0.92) were predicted to have the highest Caco-2 cells’ permeability, respectively. A phenolic compound has a high Caco-2 cell permeability if the Caco2 permeability value is higher than 0.90. The high Caco-2 absorption was predicted in accordance with a previous study [52]. Furthermore, the compounds which had Caco-2 permeability, gastrointestinal absorption, a good bioavailability score, and obeyed Lipinski’s rule of five and did not have BBB, did not act as a P-gp substrate, and had less skin permeability were successful drug compounds [53].
Rosmarinic acid was the most abundant phenolic acid quantified in bush mint and river mint, did not violate Lipinski’s rule and was insoluble in water. It predicted a low gastrointestinal absorption (32.52%) and negligible Caco-2 cells’ absorption. Previously, in vitro and in vivo experiments reported that rosmarinic acid has approximately 1% gastrointestinal absorption [54,55]. It was also predicted that rosmarinic acid cannot cross the BBB; see [54]. Caffeic acid predicted higher absorption (66.41%) than rosmarinic acid in accordance with the previously reported study [56]. Most of the phenolic compounds (around 95%) that are not absorbed in the gastrointestinal part can be metabolized by gut microbiota into small phenolic metabolites where they tend to absorb from the colon [57]. Generally, phenolic compounds are bound to albumin and transported to the liver through the portal vein after absorption [15]. On the other hand, the bioavailability of many phenolic compounds is low due to the limited absorption, extensive metabolism, and rapid excretion [58]. It is worth noting that the nature of phenolic compounds in the intestine can be altered due to the pre-systemic metabolism through sulphate conjugation, glucuronidation, and hydrogenation of the aliphatic double bonds [59].

2.7.2. Drug Likeness

The oral bioavailability of phenolic compounds was predicted through the bioavailability radar using the method by Daina et al. [60]. The bioavailability radar was used to predict the drug likeness to assess the oral bioavailability of drug molecules (Figure 5).
Figure 5 and Table S5 depict that only carnosol and carnosic acid predicted the oral bioavailability. The oral bioavailability of the phenolic metabolites was predicted through the bioavailability radar by considering six parameters (size of compound, solubility, polarity, lipophilicity, saturation, and flexibility). Resveratrol was an important phenolic compound which predicted no oral bioavailability. The predicted results of resveratrol oral bioavailability are accordance with the previously published studies [61].

2.7.3. Metabolism, Excretion, and Toxicity

It has been reported that cytochrome P450 (CYP) has a crucial role in the metabolism of phenolic and other drug molecules [58]. The predicted results of metabolism and excretion are reported in Table S6. The metabolism of phenolic drug compounds was predicted through the CYP (CYP3A4, CYP1A2, CYP2C9, CYP2C19, and CYP2D6) model for substrate or inhibitor. Phenolic metabolites that inhibited the CYP pathway may have triggered the accumulation and increased the concentration of phenolic compounds, which became the cause of higher toxicity of a particular compound and vice versa. Phenolic metabolites with higher total clearance were predicted with higher bioavailability and metabolism in the liver (Table S6). The overall bioavailability of resveratrol was low due to extensive and rapid metabolism and excretion [62].
The predicted results of the toxicological screening of individual phenolic metabolites are given in the Table S7. The predicted results indicate that all bioactive compounds did not inhibit the hERG 1 channel and most of the compounds did not predict skin sensitization, AIMES toxicity, Tetrahymena pyriformis, hepatotoxicity, and minnow toxicity, except a few compounds. Resveratrol (which is widely studied), stilbene, and 3-methylcoumarin predicted mutagenicity (AIMES toxicity), while resveratrol also predicted higher toxicity in Tetrahymena pyriformis at the rate of 0.29 μg/L. Previously, Patel et al. [62] also reported side effects of resveratrol in humans at the rate of 1 g/Kg body weight. Resveratrol, rosmanol, and 3-methylcoumarin predicted hepatotoxicity. Rosmanol also predicted minnow toxicity. Rosmarinic acid, chlorogenic acid, caffeic acid, and sagerinic acid were the most abundant phenolic compounds in the selected herbs which did not predict any toxicity. Previously, Hitl et al. [36] also reported no toxicity of rosmarinic acid in humans [63,64].

3. Materials and Methods

3.1. Chemicals and Reagents

Our previously published work describes all the chemicals used in this experiment [8,65,66]. All the pure standards were purchased from Sigma Aldrich (St. Louis, MI, USA).

3.2. Extraction Process of Phenolic Compounds

Bush mint, river mint, and sea parsley were purchased in dried form from Tucker Bush (https://tuckerbush.com.au) accessed on 21 September 2021. These plants were grown and dried in the Perth Hills in Whadjuk Noongar country. Bush tomatoes in dried form were purchased from Natif Australia (https://natif.com.au) accessed on 21 September 2021, and were further ground with a laboratory grinder. The phenolic compounds were extracted from these plants by taking 1 g sample in 20 mL 80% methanol acidified with 1% formic acid in triplicate. The complete process has been reported in our previously published work [65].

3.3. Polyphenols Estimation and Their Antioxidant Activities

3.3.1. Quantification of TPC and TFC

The TPC and TFC of bush tomatoes, bush mint, river mint, and sea parsley were quantified by following the methods of Ali et al. [8] and Zahid et al. [67]. The standard curves of gallic acid (0–200 μg/mL) and quercetin (0–50 μg/mL) were generated to calculate the TPC and the TFC in this experiment.

3.3.2. Antioxidant Activities

The DPPH and ABTS inhibition activities were quantified using the methods of Ali et al. [8] and Sharifi-Rad et al. [68]. The development of the calibration curve was completed by solutions of known 0–50 μg/mL ascorbic acid (C6H8O6) concentrations. Briefly, an aliquot of 25 μL of each extract or ascorbic acid was mixed with 275 μL 0.1 mM methanolic DPPH and placed in the dark for 25 min before reading the absorbance at 517 nm. The reducing properties of the culinary herbs were determined by following the method of Bashmil et al. [69]. An aliquot of 20 µL was mixed with 280 µL FRAP reagent (mixture of 20 mM ferric chloride, 10 mM TPTZ solution, and 300 mM sodium acetate buffer in the v/v ratio of 1:1:1). The mixture was kept for 10 min at 37 °C before the plate reading at 593 nm and results were expressed as mg AAE/g. An ABTS assay was conducted by modifying the method of Chou et al. [39]. The ABTS solution was prepared by dissolving 140 mM potassium persulfate and 7 mM ABTS solution both in water and placing them in the dark for 16 h. The next day, absorbance was set at 0.70 ± 0.02 by diluting with ethanol (approx. 1 mL in 45 mL of ethanol). The sample or standard (ascorbic acid) of 10 µL was mixed with a solution of 290 µL and incubated at room temperature in the dark for 6 min before reading the plate at 734 nm. Ascorbic acid (0–150 μg/mL) was used to generate a standard curve.
FICA was performed by a method of Ali et al. [8]. In total, 15 μL sample extract was mixed with 85 μL dist. water, 50 μL of 2 mM FeCl3 (with additional 1:15 dilution in water), and 50 μL of 5 mM ferrozine (with additional 1:6 dilution in water). Then, it was incubated at 25 °C for 10 min. Absorbance was measured at 562 nm and the equation was constructed by using 0–50 μg/mL EDTA. The PMA was measured by following the method of Sharifi-Rad et al. [68]. Briefly, 260 μL of phosphomolybdate reagent was mixed with 40 μL sample or standard. The phosphomolybdate reagent was prepared by mixing 0.004 M ammonium molybdate, 0.028 M sodium phosphate, and 0.6 M H2SO4 in an equal ratio. Then, the plate was incubated in a water bath at 95 ± 5 °C for 90 min by wrapping it with aluminum foil. After said time, the plate was cooled, and absorbance was measured at 695 nm. Ascorbic acid (0–200 μg/mL) was used to construct the equation. The method of Bashmil et al. [69], after modifications, was used to estimate RPA for these selected herbs. Briefly, the mixture was prepared as follows: 10 µL extract or standard, 25 µL of 0.2 M phosphate buffer (pH 6.6), and 25 µL of K3[Fe(CN)6] incubated for 20 min at 25 °C. Later, the addition of 25 µL 10% TCA solution in the mixture was followed by water and FeCl3, 85 µL and 10 µL, respectively. The mixture was again incubated at the same temperature for 20 min. Ascorbic acid (0–300 μg/mL) was used to establish the standard curve. The OH-RSA was determined by following the method of Ali et al. [8] with some modifications. The reaction mixture was prepared with 50 μL of each herbal extract, 6 mM FeSO4.7H2O, and 6 mM H2O2 (30%) and the mixture was incubated for 10 min at 25 °C before adding the 50 μL 6 mM 3-hydroxybenzoic acid. The standard curve was generated by using 0–300 μg/mL ascorbic acid at 510 nm, and the results were expressed as mg AAE/g of the sample.

3.4. LC-ESI-QTOF-MS/MS Analysis

The detailed identification and quantification of phenolic metabolites from bush tomatoes, bush mint, river mint, and sea parsley were conducted by following our previously established methods [65,66]. An Agilent 6520 Accurate Mass QTOF LC-MS (Agilent Technologies, Santa Clara, USA) in automatic MS/MS acquisition mode and a Synergi 4 um Hydro Reversed Phase (RP 80 Å) LC column (250 × 4.6 mm) connected with C18 ODS (4.0 × 2.0 mm) guard column were used in this experiment. An aliquot of 10 μL of each plant extract was injected, while the flow rate of mobile phase A (0.1% LC-MS grade formic acid in Milli-Q water) and mobile phase B (0.1% LC-MS grade formic acid in acetonitrile) was adjusted at 0.6 mL/min with the following gradient: 10–20% B (0–10 min), 20–25% B (10–20 min), 25–30% B (20–30 min), 30–45% B (30–40 min), 45–60% B (40–50 min), 60–90% B (50–65 min), 90–100% B (65–67 min), 100–10% B (67–68 min), and 10% B (68–70 min). The following LC conditions were followed: scan mode (50–1500 m/z), capillary voltage (3500 V), nebulization at 45 psi, nitrogen gas flow (9 L/min) at 325 °C, and collision energies (10, 20, 40 eV). Agilent MassHunter (version B.06.00) software was used for extraction and identification of individual phenolic compounds along with Personal Compound Database and Library (PCDL) library score 70, MassBank of North America (MoNA), and Human Metabolome Database (HMDB). Thirty-seven phenolic compounds were semi-quantified, while the MS/MS spectra of forty-one compounds were also acquired in this experiment.

3.5. Pharmacokinetics Study of the Most Abundant Phenolic Compounds

Pharmacokinetics properties were investigated by following the methods of Ali et al. [1,15]. Oral bioavailability, absorption, distribution, metabolism, excretion, and toxicity of the abundant phenolic compounds were predicted.

3.6. Statistical Analysis

XLSTAT-2019.1.3 (Addinsoft Inc. New York, NY, USA) software and Minitab version 18.0 (State College, PA, USA) were used for the investigation of the correlation analysis and analysis of variance in this study.

4. Conclusions

The results obtained from the given data indicate that bush mint has a strong antioxidant potential which is positively correlated to higher phenolic contents. A total of 123 phenolic metabolites were putatively identified in bush mint, bush tomatoes, river mint, and sea parsley. Phenolic metabolites from native Australian herbs and fruits may represent significant potential that could be used for additional health applications and against oxidative stress. Many of the phenolic compounds have been reported here for the first time in these native Australian herbs and medicinal plants. Rosmarinic acid, chlorogenic acid, sagerinic acid, caffeic acid, and quinic acid are the most abundant phenolic metabolites in these native Australian herbs. The phytochemical composition and strong antioxidant potential of these native Australian herbs and medicinal plants will explore the use of these plants in various food, feed, pharmaceutical, and cosmetic industries. Pharmacokinetic properties further help in the drug discovery of the identified compounds in these plants.

Supplementary Materials

The following supporting information can be downloaded at: https://www.mdpi.com/article/10.3390/plants12050993/s1, Figure S1: Total ion chromatograms (TIC) and base peak chromatograms (BPC) of bush mint, river mint, bush tomatoes, and sea parsley in positive (black color) and negative mode (blue color); Figure S2: MS/MS spectra of protocatechuic acid (A) and gallic acid (B); Figure S3: MS/MS spectra of caffeic acid, p-coumaric acid, and rosmarinic acid; Table S1: Phenolic contents in Australian native herbs and fruits and their antioxidant activities; Table S2: LC-MS/MS quantification of phenolic compounds (μg/g) from Australian native herbs and fruits; Table S3: Predicted absorption and distribution of selected compounds; Table S4: Pharmacokinetics properties of selected compounds; Table S5: Radar bioavailability properties of selected compounds; Table S6: Predicted metabolism and excretion of selected compounds; Table S7: Predicted toxicity of abundant phenolic compounds.

Author Contributions

Conceptualization, methodology, software, validation, formal analysis, investigation, data curation, visualization, and writing—original draft preparation, A.A.; writing—review and editing, supervision, resources, project administration, and funding acquisition, J.J.C. and F.R.D. All authors have read and agreed to the published version of the manuscript.

Funding

This research received no external funding.

Institutional Review Board Statement

Not applicable.

Informed Consent Statement

Not applicable.

Data Availability Statement

Not applicable.

Acknowledgments

We would like to thank Nikolas Williamson, Asif Noor, Swati Varshney, and Shiue Nie from the Mass Spectrometry and Proteomics Facility, Bio21 Institute, the University of Melbourne, Australia for providing technical support.

Conflicts of Interest

The authors declare no conflict of interest.

References

  1. Ali, A.; Kiloni, S.M.; Cáceres-Vélez, P.R.; Jusuf, P.R.; Cottrell, J.J.; Dunshea, F.R. Phytochemicals, antioxidant activities, and toxicological screening of native australian fruits using zebrafish embryonic model. Foods 2022, 11, 4038. [Google Scholar] [CrossRef]
  2. Balentine, D.A.; Albano, M.C.; Nair, M.G. Role of medicinal plants, herbs, and spices in protecting human health. Nutr. Rev. 1999, 57, S41–S45. [Google Scholar] [CrossRef] [PubMed]
  3. Ali, A.; Bashmil, Y.M.; Cottrell, J.J.; Suleria, H.A.R.; Dunshea, F.R. Lc-ms/ms-qtof screening and identification of phenolic compounds from australian grown herbs and their antioxidant potential. Antioxidants 2021, 10, 1770. [Google Scholar] [CrossRef] [PubMed]
  4. Cottrell, J.J.; Le, H.H.; Artaiz, O.; Iqbal, Y.; Suleria, H.A.; Ali, A.; Celi, P.; Dunshea, F.R. Recent advances in the use of phytochemicals to manage gastrointestinal oxidative stress in poultry and pigs. Anim. Prod. Sci. 2022, 62, 1140–1146. [Google Scholar] [CrossRef]
  5. Kiani, H.S.; Ali, A.; Zahra, S.; Hassan, Z.U.; Kubra, K.T.; Azam, M.; Zahid, H.F. Phytochemical composition and pharmacological potential of lemongrass (cymbopogon) and impact on gut microbiota. AppliedChem 2022, 2, 229–246. [Google Scholar] [CrossRef]
  6. Zhong, L.; Bornman, J.F.; Wu, G.; Hornoff, A.; Dovi, K.A.P.; Al-Ali, H.; Aslam, N.; Johnson, S.K. The nutritional and phytochemical composition of the indigenous australian pindan walnut (terminalia cunninghamii) kernels. Plant Foods Hum. Nutr. 2018, 73, 40–46. [Google Scholar] [CrossRef] [PubMed]
  7. Konczak, I.; Zabaras, D.; Dunstan, M.; Aguas, P. Antioxidant capacity and hydrophilic phytochemicals in commercially grown native australian fruits. Food Chem. 2010, 123, 1048–1054. [Google Scholar] [CrossRef]
  8. Ali, A.; Wu, H.; Ponnampalam, E.N.; Cottrell, J.J.; Dunshea, F.R.; Suleria, H.A.R. Comprehensive profiling of most widely used spices for their phenolic compounds through lc-esi-qtof-ms2 and their antioxidant potential. Antioxidants 2021, 10, 721. [Google Scholar] [CrossRef]
  9. Kumar, G.; Dey, S.K.; Kundu, S. Herbs and their bioactive ingredients in cardio-protection: Underlying molecular mechanisms and evidences from clinical studies. Phytomedicine 2021, 92, 153753. [Google Scholar] [CrossRef]
  10. Tapsell, L.C.; Hemphill, I.; Cobiac, L.; Patch, C.S.; Sullivan, D.R.; Fenech, M.; Roodenrys, S.; Keogh, J.B.; Clifton, P.M.; Williams, P.G.; et al. Health benefits of herbs and spices: The past, the present, the future. Med. J. Aust. 2006, 185, S1–S24. [Google Scholar] [CrossRef] [Green Version]
  11. Singh, N.; Yadav, S.S. A review on health benefits of phenolics derived from dietary spices. Curr. Res. Food Sci. 2022, 5, 1508–1523. [Google Scholar] [CrossRef]
  12. Konczak, I.; Zabaras, D.; Dunstan, M.; Aguas, P. Antioxidant capacity and phenolic compounds in commercially grown native australian herbs and spices. Food Chem. 2010, 122, 260–266. [Google Scholar] [CrossRef]
  13. Ali, A.; Ponnampalam, E.N.; Pushpakumara, G.; Cottrell, J.J.; Suleria, H.A.R.; Dunshea, F.R. Cinnamon: A natural feed additive for poultry health and production-a review. Animals 2021, 11, 2026. [Google Scholar] [CrossRef] [PubMed]
  14. Kiselova-Kaneva, Y.; Galunska, B.; Nikolova, M.; Dincheva, I.; Badjakov, I. High resolution lc-ms/ms characterization of polyphenolic composition and evaluation of antioxidant activity of sambucus ebulus fruit tea traditionally used in bulgaria as a functional food. Food Chem. 2022, 367, 130759. [Google Scholar] [CrossRef]
  15. Ali, A.; Cottrell, J.J.; Dunshea, F.R. Antioxidant, alpha-glucosidase inhibition activities, in silico molecular docking and pharmacokinetics study of phenolic compounds from native australian fruits and spices. Antioxidants 2023, 12, 254. [Google Scholar] [CrossRef]
  16. Cáceres-Vélez, P.R.; Ali, A.; Fournier-Level, A.; Dunshea, F.R.; Jusuf, P.R. Phytochemical and safety evaluations of finger lime, mountain pepper, and tamarind in zebrafish embryos. Antioxidants 2022, 11, 1280. [Google Scholar] [CrossRef]
  17. Liu, H.; Qiu, N.; Ding, H.; Yao, R. Polyphenols contents and antioxidant capacity of 68 chinese herbals suitable for medical or food uses. Food Res. Int. 2008, 41, 363–370. [Google Scholar] [CrossRef]
  18. Sommano, S.; Caffin, N.; Kerven, G. Screening for antioxidant activity, phenolic content, and flavonoids from australian native food plants. Int. J. Food Prop. 2013, 16, 1394–1406. [Google Scholar] [CrossRef] [Green Version]
  19. Tang, K.S.C.; Konczak, I.; Zhao, J. Identification and quantification of phenolics in australian native mint (mentha australis r. Br.). Food Chem. 2016, 192, 698–705. [Google Scholar] [CrossRef]
  20. Kee, K.T.; Koh, M.; Oong, L.X.; Ng, K. Screening culinary herbs for antioxidant and α-glucosidase inhibitory activities. Int. J. Food Sci. Technol. 2013, 48, 1884–1891. [Google Scholar] [CrossRef]
  21. Tang, K.S.C.; Konczak, I.; Zhao, J. Phenolic compounds of the australian native herb prostanthera rotundifolia and their biological activities. Food Chem. 2017, 233, 530–539. [Google Scholar] [CrossRef]
  22. Chanput, W.; Krueyos, N.; Ritthiruangdej, P. Anti-oxidative assays as markers for anti-inflammatory activity of flavonoids. Int. Immunopharmacol. 2016, 40, 170–175. [Google Scholar] [CrossRef] [PubMed]
  23. Choi, M.-H.; Shin, H.-J. Anti-oxidative and anti-melnogenesis effects of buleberry extract. Kor. J. Aesthet Cosmetol. 2015, 13, 261–266. [Google Scholar]
  24. Lee, S.-H.; Jang, M.; Kim, G.-H. Antioxidative effects of extracts from different parts of epimedium koreanum nakai. J. Korean Soc. Food Sci. Nutr. 2016, 45, 188–193. [Google Scholar] [CrossRef]
  25. Gülçin, İ. Antioxidant activity of caffeic acid (3, 4-dihydroxycinnamic acid). Toxicology 2006, 217, 213–220. [Google Scholar] [CrossRef]
  26. Gülçin, İ.; Huyut, Z.; Elmastaş, M.; Aboul-Enein, H.Y. Radical scavenging and antioxidant activity of tannic acid. Arab. J. Chem. 2010, 3, 43–53. [Google Scholar] [CrossRef] [Green Version]
  27. Tarwadi, K.; Agte, V. Antioxidant and micronutrient quality of fruit and root vegetables from the indian subcontinent and their comparative performance with green leafy vegetables and fruits. J. Sci. Food Agric. 2005, 85, 1469–1476. [Google Scholar] [CrossRef]
  28. Kim, S.Y. Fluctuations in phenolic content and antioxidant capacity of green vegetable juices during refrigerated storage. Prev. Nutr. Food Sci. 2015, 20, 169. [Google Scholar] [CrossRef] [Green Version]
  29. Floegel, A.; Kim, D.-O.; Chung, S.-J.; Koo, S.I.; Chun, O.K. Comparison of abts/dpph assays to measure antioxidant capacity in popular antioxidant-rich us foods. J. Food Compos. Anal. 2011, 24, 1043–1048. [Google Scholar] [CrossRef]
  30. Miliauskas, G.; Venskutonis, P.R.; van Beek, T.A. Screening of radical scavenging activity of some medicinal and aromatic plant extracts. Food Chem. 2004, 85, 231–237. [Google Scholar] [CrossRef]
  31. Freeman, B.L.; Eggett, D.L.; Parker, T.L. Synergistic and antagonistic interactions of phenolic compounds found in navel oranges. J. Food Sci. 2010, 75, C570–C576. [Google Scholar] [CrossRef]
  32. El-Akad, R.H.; El-Din, M.G.S.; Farag, M.A. How does lagenaria siceraria (bottle gourd) metabolome compare to cucumis sativus (cucumber) f. Cucurbitaceae? A multiplex approach of hr-uplc/ms/ms and gc/ms using molecular networking and chemometrics. Foods 2023, 12, 771. [Google Scholar] [CrossRef]
  33. Kakkar, S.; Bais, S. A review on protocatechuic acid and its pharmacological potential. ISRN Pharmacol. 2014, 2014, 1–9. [Google Scholar] [CrossRef] [Green Version]
  34. Srinivasan, M.; Sudheer, A.R.; Menon, V.P. Ferulic acid: Therapeutic potential through its antioxidant property. J. Clin. Biochem. Nutr. 2007, 40, 92–100. [Google Scholar] [CrossRef] [PubMed] [Green Version]
  35. Ribeiro-Santos, R.; Carvalho-Costa, D.; Cavaleiro, C.; Costa, H.S.; Albuquerque, T.G.; Castilho, M.C.; Ramos, F.; Melo, N.R.; Sanches-Silva, A. A novel insight on an ancient aromatic plant: The rosemary (rosmarinus officinalis l.). Trends Food Sci. Technol. 2015, 45, 355–368. [Google Scholar] [CrossRef]
  36. Hitl, M.; Kladar, N.; Gavarić, N.; Božin, B. Rosmarinic acid-human pharmacokinetics and health benefits. Planta Med. 2021, 87, 273–282. [Google Scholar] [CrossRef] [PubMed]
  37. Rockenbach, I.I.; Jungfer, E.; Ritter, C.; Santiago-Schübel, B.; Thiele, B.; Fett, R.; Galensa, R. Characterization of flavan-3-ols in seeds of grape pomace by ce, hplc-dad-msn and lc-esi-fticr-ms. Food Res. Int. 2012, 48, 848–855. [Google Scholar] [CrossRef] [Green Version]
  38. Zeng, X.; Su, W.; Zheng, Y.; Liu, H.; Li, P.; Zhang, W.; Liang, Y.; Bai, Y.; Peng, W.; Yao, H. Uflc-q-tof-ms/ms-based screening and identification of flavonoids and derived metabolites in human urine after oral administration of exocarpium citri grandis extract. Molecules 2018, 23, 895. [Google Scholar] [CrossRef] [Green Version]
  39. Chou, O.; Ali, A.; Subbiah, V.; Barrow, C.J.; Dunshea, F.R.; Suleria, H.A.R. Lc-esi-qtof-ms/ms characterisation of phenolics in herbal tea infusion and their antioxidant potential. Fermentation 2021, 7, 73. [Google Scholar] [CrossRef]
  40. Zhang, L.; Tu, Z.; Wang, H.; Fu, Z.; Wen, Q.; Chang, H.; Huang, X. Comparison of different methods for extracting polyphenols from ipomoea batatas leaves, and identification of antioxidant constituents by hplc-qtof-ms2. Food Res. Int. 2015, 70, 101–109. [Google Scholar] [CrossRef]
  41. Hanhineva, K.; Rogachev, I.; Aura, A.-M.; Aharoni, A.; Poutanen, K.; Mykkänen, H. Identification of novel lignans in the whole grain rye bran by non-targeted lc–ms metabolite profiling. Metabolomics 2012, 8, 399–409. [Google Scholar] [CrossRef]
  42. Velamuri, R.; Sharma, Y.; Fagan, J.; Schaefer, J. Application of uhplc-esi-qtof-ms in phytochemical profiling of sage (salvia officinalis) and rosemary (rosmarinus officinalis). Planta Med. Int. Open 2020, 7, e133–e144. [Google Scholar] [CrossRef]
  43. Serrano, C.A.; Villena, G.K.; Rodríguez, E.F. Phytochemical profile and rosmarinic acid purification from two peruvian lepechinia willd. Species (salviinae, mentheae, lamiaceae). Sci. Rep. 2021, 11, 7260. [Google Scholar] [CrossRef] [PubMed]
  44. Lu, Y.; Yeap Foo, L. Antioxidant activities of polyphenols from sage (salvia officinalis). Food Chem. 2001, 75, 197–202. [Google Scholar] [CrossRef]
  45. Kitts, D.D.; Yuan, Y.V.; Wijewickreme, A.N.; Thompson, L.U. Antioxidant activity of the flaxseed lignan secoisolariciresinol diglycoside and its mammalian lignan metabolites enterodiol and enterolactone. Mol. Cell. Biochem. 1999, 202, 91–100. [Google Scholar] [CrossRef] [PubMed]
  46. Liu, Z.; Fei, Y.J.; Cao, X.H.; Xu, D.; Tang, W.J.; Yang, K.; Xu, W.X.; Tang, J.H. Lignans intake and enterolactone concentration and prognosis of breast cancer: A systematic review and meta-analysis. J. Cancer 2021, 12, 2787–2796. [Google Scholar] [CrossRef] [PubMed]
  47. Wang, L.; Gan, C.; Wang, Z.; Liu, L.; Gao, M.; Li, Q.; Yang, C. Determination and pharmacokinetic study of three diterpenes in rat plasma by uhplc-esi-ms/ms after oral administration of rosmarinus officinalis l. Extract. Molecules 2017, 22, 934. [Google Scholar] [CrossRef] [Green Version]
  48. Zabot, G.L.; Moraes, M.N.; Rostagno, M.A.; Meireles, M.A.A. Fast analysis of phenolic terpenes by high-performance liquid chromatography using a fused-core column. Anal. Methods 2014, 6, 7457–7468. [Google Scholar] [CrossRef]
  49. Wang, H.; Provan, G.J.; Helliwell, K. Determination of rosmarinic acid and caffeic acid in aromatic herbs by hplc. Food Chem. 2004, 87, 307–311. [Google Scholar] [CrossRef]
  50. Zheng, W.; Wang, S.Y. Antioxidant activity and phenolic compounds in selected herbs. J. Agric. Food Chem. 2001, 49, 5165–5170. [Google Scholar] [CrossRef]
  51. Ali, A.; Zahid, H.F.; Cottrell, J.J.; Dunshea, F.R. A comparative study for nutritional and phytochemical profiling of coffea arabica (c. Arabica) from different origins and their antioxidant potential and molecular docking. Molecules 2022, 27, 5126. [Google Scholar] [CrossRef]
  52. Kaldas, M.I.; Walle, U.K.; Walle, T. Resveratrol transport and metabolism by human intestinal caco-2 cells. J. Pharm. Pharmacol. 2003, 55, 307–312. [Google Scholar] [CrossRef]
  53. Khalfaoui, A.; Noumi, E.; Belaabed, S.; Aouadi, K.; Lamjed, B.; Adnan, M.; Defant, A.; Kadri, A.; Snoussi, M.; Khan, M.A.; et al. Lc-esi/ms-phytochemical profiling with antioxidant, antibacterial, antifungal, antiviral and in silico pharmacological properties of algerian asphodelus tenuifolius (cav.) organic extracts. Antioxidants 2021, 10, 628. [Google Scholar] [CrossRef]
  54. Hase, T.; Shishido, S.; Yamamoto, S.; Yamashita, R.; Nukima, H.; Taira, S.; Toyoda, T.; Abe, K.; Hamaguchi, T.; Ono, K. Rosmarinic acid suppresses alzheimer’s disease development by reducing amyloid β aggregation by increasing monoamine secretion. Sci. Rep. 2019, 9, 8711. [Google Scholar] [CrossRef] [PubMed] [Green Version]
  55. Konishi, Y.; Kobayashi, S. Transepithelial transport of rosmarinic acid in intestinal caco-2 cell monolayers. Biosci. Biotechnol. Biochem. 2005, 69, 583–591. [Google Scholar] [CrossRef] [Green Version]
  56. Konishi, Y.; Hitomi, Y.; Yoshida, M.; Yoshioka, E. Pharmacokinetic study of caffeic and rosmarinic acids in rats after oral administration. J. Agric. Food Chem. 2005, 53, 4740–4746. [Google Scholar] [CrossRef]
  57. Aherne, S.A.; O’Brien, N.M. Dietary flavonols: Chemistry, food content, and metabolism. Nutrition 2002, 18, 75–81. [Google Scholar] [CrossRef] [PubMed]
  58. Khan, J.; Deb, P.K.; Priya, S.; Medina, K.D.; Devi, R.; Walode, S.G.; Rudrapal, M. Dietary flavonoids: Cardioprotective potential with antioxidant effects and their pharmacokinetic, toxicological and therapeutic concerns. Molecules 2021, 26, 4021. [Google Scholar] [CrossRef]
  59. Zahid, H.F.; Ali, A.; Ranadheera, C.S.; Fang, Z.; Ajlouni, S. Identification of phenolics profile in freeze-dried apple peel and their bioactivities during in vitro digestion and colonic fermentation. Int. J. Mol. Sci. 2023, 24, 1514. [Google Scholar] [CrossRef]
  60. Daina, A.; Michielin, O.; Zoete, V. Swissadme: A free web tool to evaluate pharmacokinetics, drug-likeness and medicinal chemistry friendliness of small molecules. Sci. Rep. 2017, 7, 42717. [Google Scholar] [CrossRef] [PubMed] [Green Version]
  61. Walle, T.; Hsieh, F.; DeLegge, M.H.; Oatis, J.E.; Walle, U.K. High absorption but very low bioavailability of oral resveratrol in humans. Drug Metab. Dispos. 2004, 32, 1377–1382. [Google Scholar] [CrossRef] [Green Version]
  62. Patel, K.R.; Scott, E.; Brown, V.A.; Gescher, A.J.; Steward, W.P.; Brown, K. Clinical trials of resveratrol. Ann. N. Y. Acad. Sci. 2011, 1215, 161–169. [Google Scholar] [CrossRef] [PubMed]
  63. Takano, H.; Osakabe, N.; Sanbongi, C.; Yanagisawa, R.; Inoue, K.; Yasuda, A.; Natsume, M.; Baba, S.; Ichiishi, E.; Yoshikawa, T. Extract of perilla frutescens enriched for rosmarinic acid, a polyphenolic phytochemical, inhibits seasonal allergic rhinoconjunctivitis in humans. Exp. Biol. Med. (Maywood) 2004, 229, 247–254. [Google Scholar] [CrossRef]
  64. Herrlinger, K.A.; Nieman, K.M.; Sanoshy, K.D.; Fonseca, B.A.; Lasrado, J.A.; Schild, A.L.; Maki, K.C.; Wesnes, K.A.; Ceddia, M.A. Spearmint extract improves working memory in men and women with age-associated memory impairment. J. Altern. Complement. Med. 2018, 24, 37–47. [Google Scholar] [CrossRef] [PubMed]
  65. Ali, A.; Cottrell, J.J.; Dunshea, F.R. Identification and characterization of anthocyanins and non-anthocyanin phenolics from australian native fruits and their antioxidant, antidiabetic, and anti-alzheimer potential. Food Res. Int. 2022, 162, 111951. [Google Scholar] [CrossRef]
  66. Ali, A.; Cottrell, J.J.; Dunshea, F.R. Lc-ms/ms characterization of phenolic metabolites and their antioxidant activities from australian native plants. Metabolites 2022, 12, 1016. [Google Scholar] [CrossRef]
  67. Zahid, H.F.; Ali, A.; Ranadheera, C.S.; Fang, Z.; Dunshea, F.R.; Ajlouni, S. In vitro bioaccessibility of phenolic compounds and alpha-glucosidase inhibition activity in yoghurts enriched with mango peel powder. Food Biosci. 2022, 50, 102011. [Google Scholar] [CrossRef]
  68. Sharifi-Rad, J.; Song, S.; Ali, A.; Subbiah, V.; Taheri, Y.; Suleria, H.A.R. Lc-esi-qtof-ms/ms characterization of phenolic compounds from pyracantha coccinea m. Roem. And their antioxidant capacity. Cell. Mol. Biol. 2021, 67, 201–211. [Google Scholar] [CrossRef] [PubMed]
  69. Bashmil, Y.M.; Ali, A.; BK, A.; Dunshea, F.R.; Suleria, H.A.R. Screening and characterization of phenolic compounds from australian grown bananas and their antioxidant capacity. Antioxidants 2021, 10, 1521. [Google Scholar] [CrossRef] [PubMed]
Figure 1. Phenolic contents (TPC and TFC) and antioxidant activities of river mint (RM), bush mint (BM), sea parsley (SP), and bush tomatoes (BT). The vales with letters (a–d) are significantly different from each other.
Plants 12 00993 g001
Figure 2. Distribution of phenolic compounds in native Australian river mint (RM), bush mint (BM), bush tomatoes (BT), and sea parsley (SP). (A) Total phenolic compounds; (B) total phenolic acids; (C) total flavonoids; (D) total other compounds in native Australian plants.
Plants 12 00993 g002
Figure 3. Heatmap clustering of quantified phenolic compounds in bush mint (BM), river mint (RM), bush tomatoes (BT), and sea parsley (SP).
Plants 12 00993 g003
Figure 4. Boiled-Egg method for the evaluation of absorption of abundant phenolic compounds. The blue dots indicate molecules predicted to be effluated from the CNS by P-glycoprotein, and the red dots indicate molecules predicted not to be effluated from the CNS by P-glycoprotein. The egg yolk area predicts the phenolic compounds that passively penetrate the blood–brain barrier (BBB). The egg white area predicts which phenolic compounds have been absorbed through the gastrointestinal tract.
Plants 12 00993 g004
Figure 5. The pink area of the bioavailability radar represents the optimal range for each property. Bioavailability radars of sagerinic acid (a), rosmarinic acid (b), rosmanol (c), chlorogenic acid (d), carnosol (e), and caffeic acid (f) were obtained.
Plants 12 00993 g005
Table 1. Pearson correlation between phenolic contents and antioxidant activities.
VariablesTPCTFCDPPHABTSFRAPPMAOH-RSA
TFC0.96 **
DPPH0.840.76
ABTS0.450.460.80
FRAP0.96 **0.850.91*0.50
PMA0.760.840.820.840.68
OH-RSA0.810.92 *0.740.680.690.97 **
FICA0.99 **0.91 *0.830.380.98 **0.670.72
** Significant correlation at p ≤ 0.05; * significant correlation at p ≤ 0.01.
Table 2. LC-MS/MS characterization of phenolic metabolites from Australian native herbs and fruits.
No.RT (min)Mode of IonizationTheoretical (m/z)Observed (m/z)Mass Error (ppm)MS/MS ProductionsMolecular FormulaProposed CompoundsHerbs and Fruits
Phenolic acids
Hydroxybenzoic acids
16.624[M−H]331.0671331.06823.3169, 151, 125C13H16O10Gallic acid 4-O-glucosideRM
27.054** [M−H]169.0142169.0134−4.7125C7H6O5* Gallic acidBT, BM, SP
38.447[M−H]315.0721315.0715−1.9153, 109C13H16O9Protocatechuic acid 4-O-glucosideSP, BM, BT
410.323[M−H]167.0350167.03500.0152, 123, 108C8H8O4* Vanillic acidBM, SP, BT
512.718[M−H]153.0193153.01930.0109C7H6O4Protocatechuic acidBM, SP, BT, RM
613.279[M−H]299.0772299.07885.3255, 137C13H16O84-Hydroxybenzoic acid 4-O-glucosideBM, BT
716.152[M−H]137.0244137.02482.993, 65C7H6O3p-Hydroxybenzoic acidSP, BM, BT
817.753[M−H]121.0295121.02950.0103, 77C7H6O2* Benzoic acidBT, RM, SP, BM
Hydroxycinnamic acids
94.122[M−H]191.0561191.05673.1171, 127, 85C7H12O6Quinic acidBT, RM, SP, BM
106.152[M−H]311.0408311.04110.9267, 179, 135C13H12O9Caftaric acidBT
117.342** [M−H]355.0671355.06730.6179, 135C15H16O10Caffeic acid 3-O-glucuronideBT, BM, SP, RM
1212.816[M−H]723.2142723.21673.5529, 499C33H40O181-Sinapoyl-2-feruloylgentiobioseBT, SP
1313.212[M−H]369.0827369.08321.4193, 178, 134C16H18O10Ferulic acid 4-O-glucuronideBT, BM
1414.722** [M−H]325.0565325.05711.8193, 149C14H14O9Feruloyl tartaric acidRM, BM
1515.595** [M−H]325.0929325.09331.2163, 119C15H18O8p-Coumaric acid 4-O-glucosideBM, BT, RM, SP
1616.282[M−H]355.1034355.10370.8193, 176, 161, 134C16H20O9Ferulic acid 4-glucosideBM, RM, BT
1716.611[M−H]223.0612223.0608−1.8193, 179, 149, 134C11H12O5* Sinapic acidBT
1816.733** [M−H]341.0878341.0872−1.8179C15H18O9Caffeic acid 4-O-glucosideBM, SP, BT
1917.234** [M−H]337.0929337.0921−2.4191, 119C16H18O83-p-Coumaroylquinic acidBT, BM, SP
2017.431[M−H]385.1140385.11441.0223, 193C17H22O101-O-Sinapoyl-ꞵ-d-glucoseRM, SP, BM, BT
2117.558** [M−H]295.0459295.04734.7115C13H12O8p-Coumaroyl tartaric acidRM, SP, BM, BT
2217.608[M−H]163.0400163.0395−3.1119C9H8O3* p-Coumaric acidRM, BM, SP, BT
2317.619[M−H]193.0506193.0504−1.0178, 149, 134C10H10O4* Ferulic acidRM, SP
2419.625[M−H]367.1034367.10360.5191C17H20O93-Feruloylquinic acidBT, RM
2519.701[M−H]197.0450197.0439−5.7182, 153, 138, 121C9H10O5* Syringic acidBM, BT
2621.648[M−H]147.0451147.04510.0129, 103C9H8O2* Cinnamic acidBM, RM, BT
2723.958[M−H]397.1140397.11523.0223, 191C18H22O103-Sinapoylquinic acidBT, RM
2827.531** [M−H]353.0878353.0873−1.4191, 179, 161, 135C16H18O9* 3-Caffeoylquinic acidSP, BT, BM, RM
2927.531** [M−H]515.1195515.11960.2191, 179, 135C25H24O121,5-Dicaffeoylquinic acidSP, BM
3029.235[M−H]179.0350179.03531.7135C9H8O4* Caffeic acidBT, BM, SP, RM
3129.423[M−H]473.0725473.07484.9293, 311C22H18O12Chicoric acidRM, BT
3230.095[M−H]959.2826959.28260.0887, 223, 207, 163C45H52O231,2,2′-TrisinapoylgentiobioseBT, BM
3330.671[M−H]359.0772359.0770−0.6197, 179, 161, 135C18H16O8* Rosmarinic acidBM, BT, SP, RM
3432.125[M−H]543.1508543.1502−1.1193, 191, 134C27H28O123,5-Diferuloylquinic acidSP, BM, BT, RM
3534.042[M−H]693.2036693.20370.1193, 134C32H38O171,2-DiferuloylgentiobioseBM, SP, BT
Flavonoids
Flavanols
3617.181[M−H]577.1351577.13530.3451, 425, 407, 289C30H26O12* Procyanidin dimer B2BT, RM
3717.465** [M−H]289.0717289.0704−4.5245, 205, 179C15H14O6* EpicatechinBT, BM
3819.595[M−H]865.1985865.20042.2739, 713, 695, 577, 451C45H38O18Procyanidin trimer C1BM
3919.625** [M−H]481.0987481.09992.5305C21H22O13(-)-Epigallocatechin 3′-O-glucuronideBT, SP, BM
4021.869[M−H]451.1246451.12500.9289, 245C21H24O11Catechin 3′-glucosideBM, BT, SP
4122.699[M−H]1153.26191153.2599−1.71135, 577, 289, 125C60H50O24Cinnamtannin A2BM
4225.918[M−H]609.1250609.12622.0591, 539C30H26O14Prodelphinidin dimer B3SP, RM, BT, BM
Flavanones
4318.43** [M−H]477.1038477.10400.4301C22H22O12Hesperetin 3′-O-glucuronideSP, BM, BT
4419.782[M−H]595.1668595.1665−0.5459, 287, 151C27H32O15NeoeriocitrinBT, BM, RM
4520.855[M−H]433.1140433.1139−0.2271C21H22O10Naringenin 7-O-glucosideBT
4622.011[M−H]407.1864407.18814.2287, 243, 159, 119C25H28O56-GeranylnaringeninBT
4724.293[M−H]579.1719579.1716−0.5459, 313, 271C27H32O14NaringinRM, BT, SP, BM
4839.991[M−H]741.2247741.22490.3579C33H42O19Narirutin 4′-O-glucosideBM, RM, BT, SP
4952.783[M−H]285.0768285.0765−1.0243, 164, 151, 136C16H14O5IsosakuranetinRM, BT
5065.819** [M+H]+611.1971611.19740.5303C28H34O15HesperidinBM, BT, RM
Flavones
514.268[M−H]637.1774637.1754−3.1329C29H34O16Tricin 7-neohesperidosideSP, BT
524.911** [M−H]505.0987505.10033.2329C23H22O13Tricin 7-O-glucuronideBM, RM
5318.274** [M−H]637.1046637.1044−0.3285C27H26O18Luteolin 7-O-diglucuronideBM, RM, BT
5418.905[M−H]285.0404285.04184.8151C15H10O6KaempferolBM, BT
5519.447** [M−H]343.0823343.0814−2.6327, 255, 241C18H16O7CirsilineolBT, RM, BM
5621.165[M−H]577.1563577.1555−1.4431, 269C27H30O14RhoifolinBT, BM, RM
5725.466[M−H]445.1140445.1134−1.3325, 297, 282C22H22O10* SwertisinBT, RM
5825.83** [M−H]285.0404285.0403−0.4177, 151, 119C15H10O63,4′,7-TetrahydroxyflavoneBT, BM, SP, RM
5927.21** [M−H]593.1512593.15130.2449, 287C27H30O15Apigenin 6,8-di-C-glucosideBT, BM, SP
6027.29** [M−H]607.1668607.16680300, 299C28H32O15* DiosminBT, RM, SP, BM
6129.297** [M−H]461.1089461.10971.7299C22H22O11Chrysoeriol 7-O-glucosideBT, SP, RM
6232.909[M−H]431.0983431.09932.3269C21H20O10Apigenin 6-C-glucosideBT, RM
6341.946[M−H]299.0561299.060113.3284C16H12O6* DiosmetinRM
6450.821[M−H]343.0823343.0809−4.1328, 313C18H16O7SantinBM
6552.842[M−H]255.0658255.069715.5213, 171C15H12O45,7-DihydroxyflavanoneBM
6653.416[M−H]253.0506253.05070.4235, 151C15H10O4* ChrysinBM
6754.173[M−H]283.0612283.064210.7268C16H12O5WogoninRM
6868.447[M+H]+255.0652255.06561.6213, 137, 119C15H10O47,4′-DihydroxyflavoneSP
6969.137[M+H]+303.0499303.0493−2.0285, 169C15H10O76-HydroxyluteolinRM
7021.687[M−H]283.0611283.06399.9268C16H12O5AcacetinBT, BM
7169.147[M+H]+317.0656317.0652−1.3302C16H12O78-MethoxyluteolinBM
7269.48[M+H]+549.1239549.12583.5531, 401, 301C25H24O14Chrysoeriol 7-O-(6″-malonyl-glucoside)SP, BM, BT
Flavonols
736.656[M−H]401.1242401.12502.0327, 209C21H22O83-MethoxysinensetinBT, RM
7413.212[M−H]623.1617623.16271.6315C28H32O16Isorhamnetin 3-O-rutinosideBT, SP, BM, RM
7513.358[M−H]446.0854446.08918.3285C21H19O11Kaempferol 7-O-glucosideRM
7613.844** [M−H]609.1097609.1075−3.6301C26H26O17Quercetin 3-O-xylosyl-glucuronideRM, BT, BM
7714.873** [M−H]609.1461609.1459−0.3447, 285C27H30O16Kaempferol 3,7-O-diglucosideBM, RM, SP, BT
7819.099** [M−H]625.1410625.14252.4317C27H30O17Myricetin 3-O-rutinosideBT, SP
7924.49** [M−H]461.0725461.0715−2.2285, 113, 85C21H18O12Kaempferol 3-O-glucuronideBM, BT
8025.494[M−H]491.0831491.0818−2.6315C22H20O13Isorhamnetin 3-O-glucuronideBM
8127.848** [M−H]535.1093535.10991.1359C24H24O14Jaceidin 4′-O-glucuronideBT, RM, BM
8228.879** [M−H]477.0674477.06862.5301C21H18O13Quercetin 4′-O-glucuronideBT, RM, BM, SP
8331.203** [M−H]449.0725449.0706−4.2317C20H18O12Myricetin 3-O-arabinosideBM, SP, BT
8431.977** [M−H]269.0455269.0453−0.7227, 151, 117C15H10O5ApigeninBT, RM, BM
8537.395** [M−H]463.0882463.0870−2.6317C21H20O12Myricetin 3-O-rhamnosideBT, RM
8644.404** [M−H]329.0667329.06793.6314, 299, 271C17H14O73,7-DimethylquercetinRM, BT, BM
Isoflavonoids
878.849** [M−H]315.0874315.0866−2.5300, 285, 135C17H16O6ViolanoneRM, BM, SP, BT
8812.208[M−H]329.1030329.10330.9285, 163C18H18O63′-O-MethylviolanoneSP, BT, BM
8915.877[M−H]457.1140457.1131−2.0253C23H22O106″-O-AcetyldaidzinBM, RM
9016.8** [M−H]517.0987517.10114.6271C24H22O136″-O-MalonylgenistinBM, SP, RM, BT
9120.242[M−H]269.0819269.08304.1253, 239, 223C16H14O4DihydroformononetinBM, RM
9221.949[M−H]271.0976271.09894.8255, 149, 121C16H16O43′-O-MethylequolBM, BT
9323.941[M−H]591.1355591.13570.3415, 253C27H28O15Daidzin 4′-O-glucuronideBM
9428.073** [M−H]531.1144531.11755.8283, 267C25H24O136″-O-MalonylglycitinBT
9528.221** [M−H]459.0933459.09330.0441, 283, 267C22H20O11Glycitein 4′-O-glucuronideBT
9628.286[M−H]257.0819257.08241.9239, 135, 121C15H14O43′,4′,7-TrihydroxyisoflavanBT, BM
9728.885[M−H]487.1246487.12623.3283, 267, 59C24H24O116″-O-AcetylglycitinRM, BT
9832.314[M−H]299.0561299.0558−1.0284C16H12O63′-HydroxymelanettinBT, BM
9953.600[M−H]283.0612283.0601−3.8268C16H12O5Biochanin ABM
10054.173** [M−H]283.0612283.06213.2255C16H12O52′-HydroxyformononetinRM, BM, SP
10154.401[M−H]285.0768285.0767−0.4269, 203, 175C16H14O5Dihydrobiochanin ABT, RM, BM, SP
10256.229[M−H]417.1191417.1188−0.7241C21H22O9Equol 7-O-glucuronideRM, BT, BM
Stilbenes
1034.630[M−H]243.0663243.0643−8.2225, 201, 174, 159C14H12O4PiceatannolSP, RM, BT
10426.569[M−H]419.1347419.13480.2257, 241C21H24O9RhaponticinBT
10528.073[M−H]227.0713227.0709−1.8211, 167, 127C14H12O3* ResveratrolBT
Lignans
10626.010[M−H]719.1612719.1610−0.3360, 359, 197, 179, 161C36H32O16Sagerinic acidBM
10729.042[M−H]357.1343357.13481.4341, 327, 191, 151C20H22O6PinoresinolRM, BT, SP
10839.577[M−H]557.2392557.23920.0539, 521, 509, 361C30H38O10Secoisolariciresinol-sesquilignanSP, RM
10947.844[M−H]361.1656361.16611.4346, 177, 165C20H26O6SecoisolariciresinolRM
11049.423[M−H]313.1081313.10882.2255C18H18O52-HydroxyenterolactoneBT, RM
11156.027[M−H]265.1234265.12443.997C12H26O4SMagnololBM
11269.400** [M+H]+299.1278299.12790.3281, 187, 165C18H18O4EnterolactoneRM, BM, SP
Other compounds
1134.333[M−H]191.0350191.03552.6175, 147C10H8O4ScopoletinBM, SP, BT, RM
11412.917[M−H]339.0721339.07312.9177C15H16O9AesculinBT, BM, RM
11518.146[M−H]177.0193177.0192−0.6133, 105C9H6O4AesculetinBT, BM, RM
11619.445[M−H]159.0451159.0450−0.6115C10H8O23-MethylcoumarinBM
11730.753[M−H]161.0244161.0242−1.2133C9H6O3UmbelliferoneBT, BM, SP, RM
11837.435[M−H]177.0557177.05570.0133C10H10O3MelleinBT
11939.116** [M+H]+147.0441147.04410.0103, 91C9H6O2CoumarinRM, BM, BT
12050.542[M−H]345.1707345.17142.0301C20H26O5RosmanolBT
12157.603[M−H]329.1758329.17703.6285C20H26O4CarnosolBM, RM
12261.237[M−H]331.1915331.1910−1.5287C20H28O4Carnosic acidRM, BM
1236.624[M−H]125.0244125.02515.6107, 97, 79C6H6O3* PyrogallolRM, BT, SP
RM = river mint; BM = bush mint; BT = bush tomatoes; SP = sea parsley; * = compounds were confirmed with pure standards; ** = compounds were identified in both modes.
Disclaimer/Publisher’s Note: The statements, opinions and data contained in all publications are solely those of the individual author(s) and contributor(s) and not of MDPI and/or the editor(s). MDPI and/or the editor(s) disclaim responsibility for any injury to people or property resulting from any ideas, methods, instructions or products referred to in the content.

