Article

Simulation of Photosynthetic Quantum Efficiency and Energy Distribution Analysis Reveals Differential Drought Response Strategies in Two (Drought-Resistant and -Susceptible) Sugarcane Cultivars

1
South Subtropical Crop Research Institute, Chinese Academy of Tropical Agricultural Sciences, Zhanjiang Experimental and Observation Station for National Long-Term Agricultural Green Development, Zhanjiang 524091, China
2
Zhanjiang Experimental Station, Chinese Academy of Tropical Agricultural Sciences, Zhanjiang 524013, China
3
Jiaxing Vocational and Technical College, Jiaxing 314036, China
*
Author to whom correspondence should be addressed.
Plants 2023, 12(5), 1042; https://doi.org/10.3390/plants12051042
Submission received: 9 January 2023 / Revised: 17 February 2023 / Accepted: 21 February 2023 / Published: 24 February 2023
(This article belongs to the Special Issue Sugarcane Biology and Genetic Breeding)

Abstract

:
Selections of drought-tolerant cultivars and drought-stress diagnosis are important for sugarcane production under seasonal drought, which becomes a crucial factor causing sugarcane yield reduction. The main objective of this study was to investigate the differential drought-response strategies of drought-resistant (‘ROC22’) and -susceptible (‘ROC16’) sugarcane cultivars via photosynthetic quantum efficiency (Φ) simulation and analyze photosystem energy distribution. Five experiments were conducted to measure chlorophyll fluorescence parameters under different photothermal and natural drought conditions. The response model of Φ to photosynthetically active radiation (PAR), temperature (T), and the relative water content of the substrate (rSWC) was established for both cultivars. The results showed that the decreasing rate of Φ was higher at lower temperatures than at higher temperatures, with increasing PAR under well-watered conditions. The drought-stress indexes (εD) of both cultivars increased after rSWC decreased to the critical values of 40% and 29% for ‘ROC22’ and ‘ROC16’, respectively, indicating that the photosystem of ‘ROC22’ reacted more quickly than that of ‘ROC16’ to water deficit. An earlier response and higher capability of nonphotochemical quenching (NPQ) accompanied the slower and slighter increments of the yield for other energy losses (ΦNO) for ‘ROC22’ (at day5, with a rSWC of 40%) compared with ‘ROC16’ (at day3, with a rSWC of 56%), indicating that a rapid decrease in water consumption and an increase in energy dissipation involved in delaying the photosystem injury could contribute to drought tolerance for sugarcane. In addition, the rSWC of ‘ROC16’ was lower than that of ‘ROC22’ throughout the drought treatment, suggesting that high water consumption might be adverse to drought tolerance of sugarcane. This model could be applied for drought-tolerance assessment or drought-stress diagnosis for sugarcane cultivars.

1. Introduction

Sugarcane is a major crop for sugar and bio-energy worldwide and essential for agricultural productivity and economic growth [1]. In China, sugar from sugarcane exceeds 90% of the total produced sugar; however, over 80% of the sugarcane planting area spans the slopes of arid lands in south China without irrigation facilities and where seasonal drought has become a major natural disaster. Seasonal drought is reflected in spatial–temporal characteristics based on the drought index of continuous days without precipitation [2]. Yield reduction caused by seasonal drought has gravely restricted the development of the sugarcane industry.
Several pot experiments and field studies have been conducted to understand the biological properties and improve the phenotypic and genotypic characteristics of sugarcane varieties under drought. Morphological parameters, including the leaf area, root and shoot weight, and stalk characteristics (length/height and diameter) of sugarcane, have been analyzed under drought induced via polyethylene glycol (PEG)treatment and withheld irrigation [3,4,5]. Both the drought-resistant and drought-susceptible genotypes showed decreased net photosynthetic rates (Pn), stomatal conductance (gs), PSII quantum efficiency (ΦPSII), and leaf relative water content; however, the genotypes exhibited increased nonphotochemical quenching (NPQ), malondialdehyde (MDA), proline, superoxide dismutase (SOD),and ascorbate peroxidase (APX) contents, which were higher in drought-resistant than in drought-susceptible genotypes [6,7,8]. Yield component analysis confirmed that the drought-resistant variety exhibited higher productivity than did the drought-susceptible variety due to its superior stalk characteristics (height, weight, and number) [9]. Moreover, studies on the roles of specific candidate genes (belonging to the abscisic-acid (ABA)-dependent pathway) in the drought-stress responses of resistant and susceptible sugarcane clones laid the foundation and direction for improving drought resistance of sugarcanes through marker-assisted breeding [10].
Process-based models have also been developed to estimate photosynthesis, biomass production, dry matter partitioning, and sugar accumulation for informed decision-making in sugarcane production [11,12]. Combining the irrigation module and the gross margin calculator with the crop growth and water balance model could simulate the yield and survival of newly planted ratoon sugarcane under different water-allocation and climate scenarios, supported with field irrigation management [13]. The accuracy of biomass simulation was substantially increased via further improving the transpiration efficiency and root-length density aspects of the model. These factors are determined throughthe genetic variations of sugarcane to water deficit; hourly transpiration traits, such as midday flattening and the conductance limit; and the hydraulic conductivity in each soil layer [14]. Moreover, the sugarcane model could achieve remote and large-scale monitoring of sugarcane irrigation when improved with innovative techniques and methods. These techniques involve adding a thermal infrared index coupled with a remote sense of the fraction of intercepted photosynthetically active radiation (fiPAR), or satellite thermal infrared [15,16,17]. However, almost all models are inseparable from simulation of photosynthetic performance, which is essential to plant growth as the source of matter and energy.
As a photosynthesis probe, chlorophyll fluorescence (ChlF) parameters have been applied to measure photosystem operation efficiency rapidly and nondestructively under normal and stressful circumstances [18]. The photosystem is directly affected by drought via stomatal closure triggered by ABA signals transferred from the roots [19,20], and thus could be used to evaluate the performances of plants subjected to drought stress. Decreases in the maximum quantum efficiency of PSII photochemistry (Fv/Fm), ΦPSII, photochemical quenching (qP), and the electron transport rate (ETR) accompanied increases in nonphotochemical quenching (NPQ), fast-relaxing NPQ (qE), slowly relaxing NPQ (qI), and the yield induced via downregulatory processes (ΦNPQ); ΦNO had been shown under drought stress in many studies [21,22,23,24].
Among the chlorophyll fluorescence parameters, the reliability of Fv/Fm in evaluating the performance of sugarcane cultivars under drought stress was verified in a previous study [23]. The decreasing rate of Fv/Fm was significantly higher in drought-tolerance cultivars than that in drought-susceptible cultivars under drought stress [25]. Though Fv/Fm could become a stable drought-resistance indicator for sugarcane cultivars, considering its slow and slight decrease during drought stress (mostly 2~15%) [3,23,25], we chose to simulate another important parameter, Φ (namely ΦPSII), under various water statuses, and evaluated sugarcane drought tolerance through analysis of the fitted parameters for two reasons: (1) Φ provides information on the noncyclic electron transport rate through PSII [18] and photoinhibition based on inactivation of PSII reaction centers [26] and exhibits a large varied amplitude (47.5%~64.3% decrease) with aggravation of drought in C4 plants, including sugarcane and reed [24,27]; (2) Φ is directly related to the ETR, which provides energy to biochemical reactions of CO2 assimilation [28], thus having been used to estimate photosynthetic rates via the modified FvCB model, which describes the relationship between the rate of carboxylation for the C4 cycle (Vp) and the rate of ATP production driven via e- transport (JATP), calculated from ΔF/Fm′ (equal to Φ, where ΔF = Fm′ − Fs,) [29]. Two other parameters, NPQ and ΦNO, were chosen in this study to analyze energy distribution under drought. The former represented total energy dissipation into heat loss containing energy-dependent, zeaxanthin-dependent, and photoinhibitory quenching [30], and the latter has been used to evaluate the occurrence of physiological damage accumulation during drought [24] and post-drought recovery [31].
Thus, the main objective of this study was to establish the relationship between photosynthetic quantum efficiency and water status and reveal the different drought-response patterns in drought-tolerant and -susceptible cultivars via analyzing the energy distribution associated with drought stress. This study provides a new perspective for sugarcane drought-tolerance assessment and drought-stress diagnosis.

2. Results

2.1. Photothermal Model Parameterization and Its Biological Significance

Φ decreased with rising or falling temperature from To under three given PAR levels, and the decreasing rate intensified with increasing PAR. The ΦbL values were lower than the ΦbH values under all three given PAR levels, indicating that the sugarcane photosystem is more sensitive to low temperatures. All of the Φ-related parameters (ΦbL, ΦbH, and ΦTo) declined with the increase in PAR, and the difference between ΦbL and ΦbH gradually increased, but both values occurred at the same PAR level in ‘ROC22’ and ‘ROC16’ (Figure 1). The Fv/Fm value showed no significant difference between ‘ROC22’ (0.7693 ± 0.003) and ‘ROC16’ (0.7685 ± 0.0027). Parameter Ε reflected the amplitude decrease in ΦTo with increasing PAR and had the value of 5.91×10⁻⁴ for both tested cultivars (Table 1). In general, the cultivars exhibited high light efficiency at low Ε.

2.2. Response of the Estimated Parameter to Drought Treatment

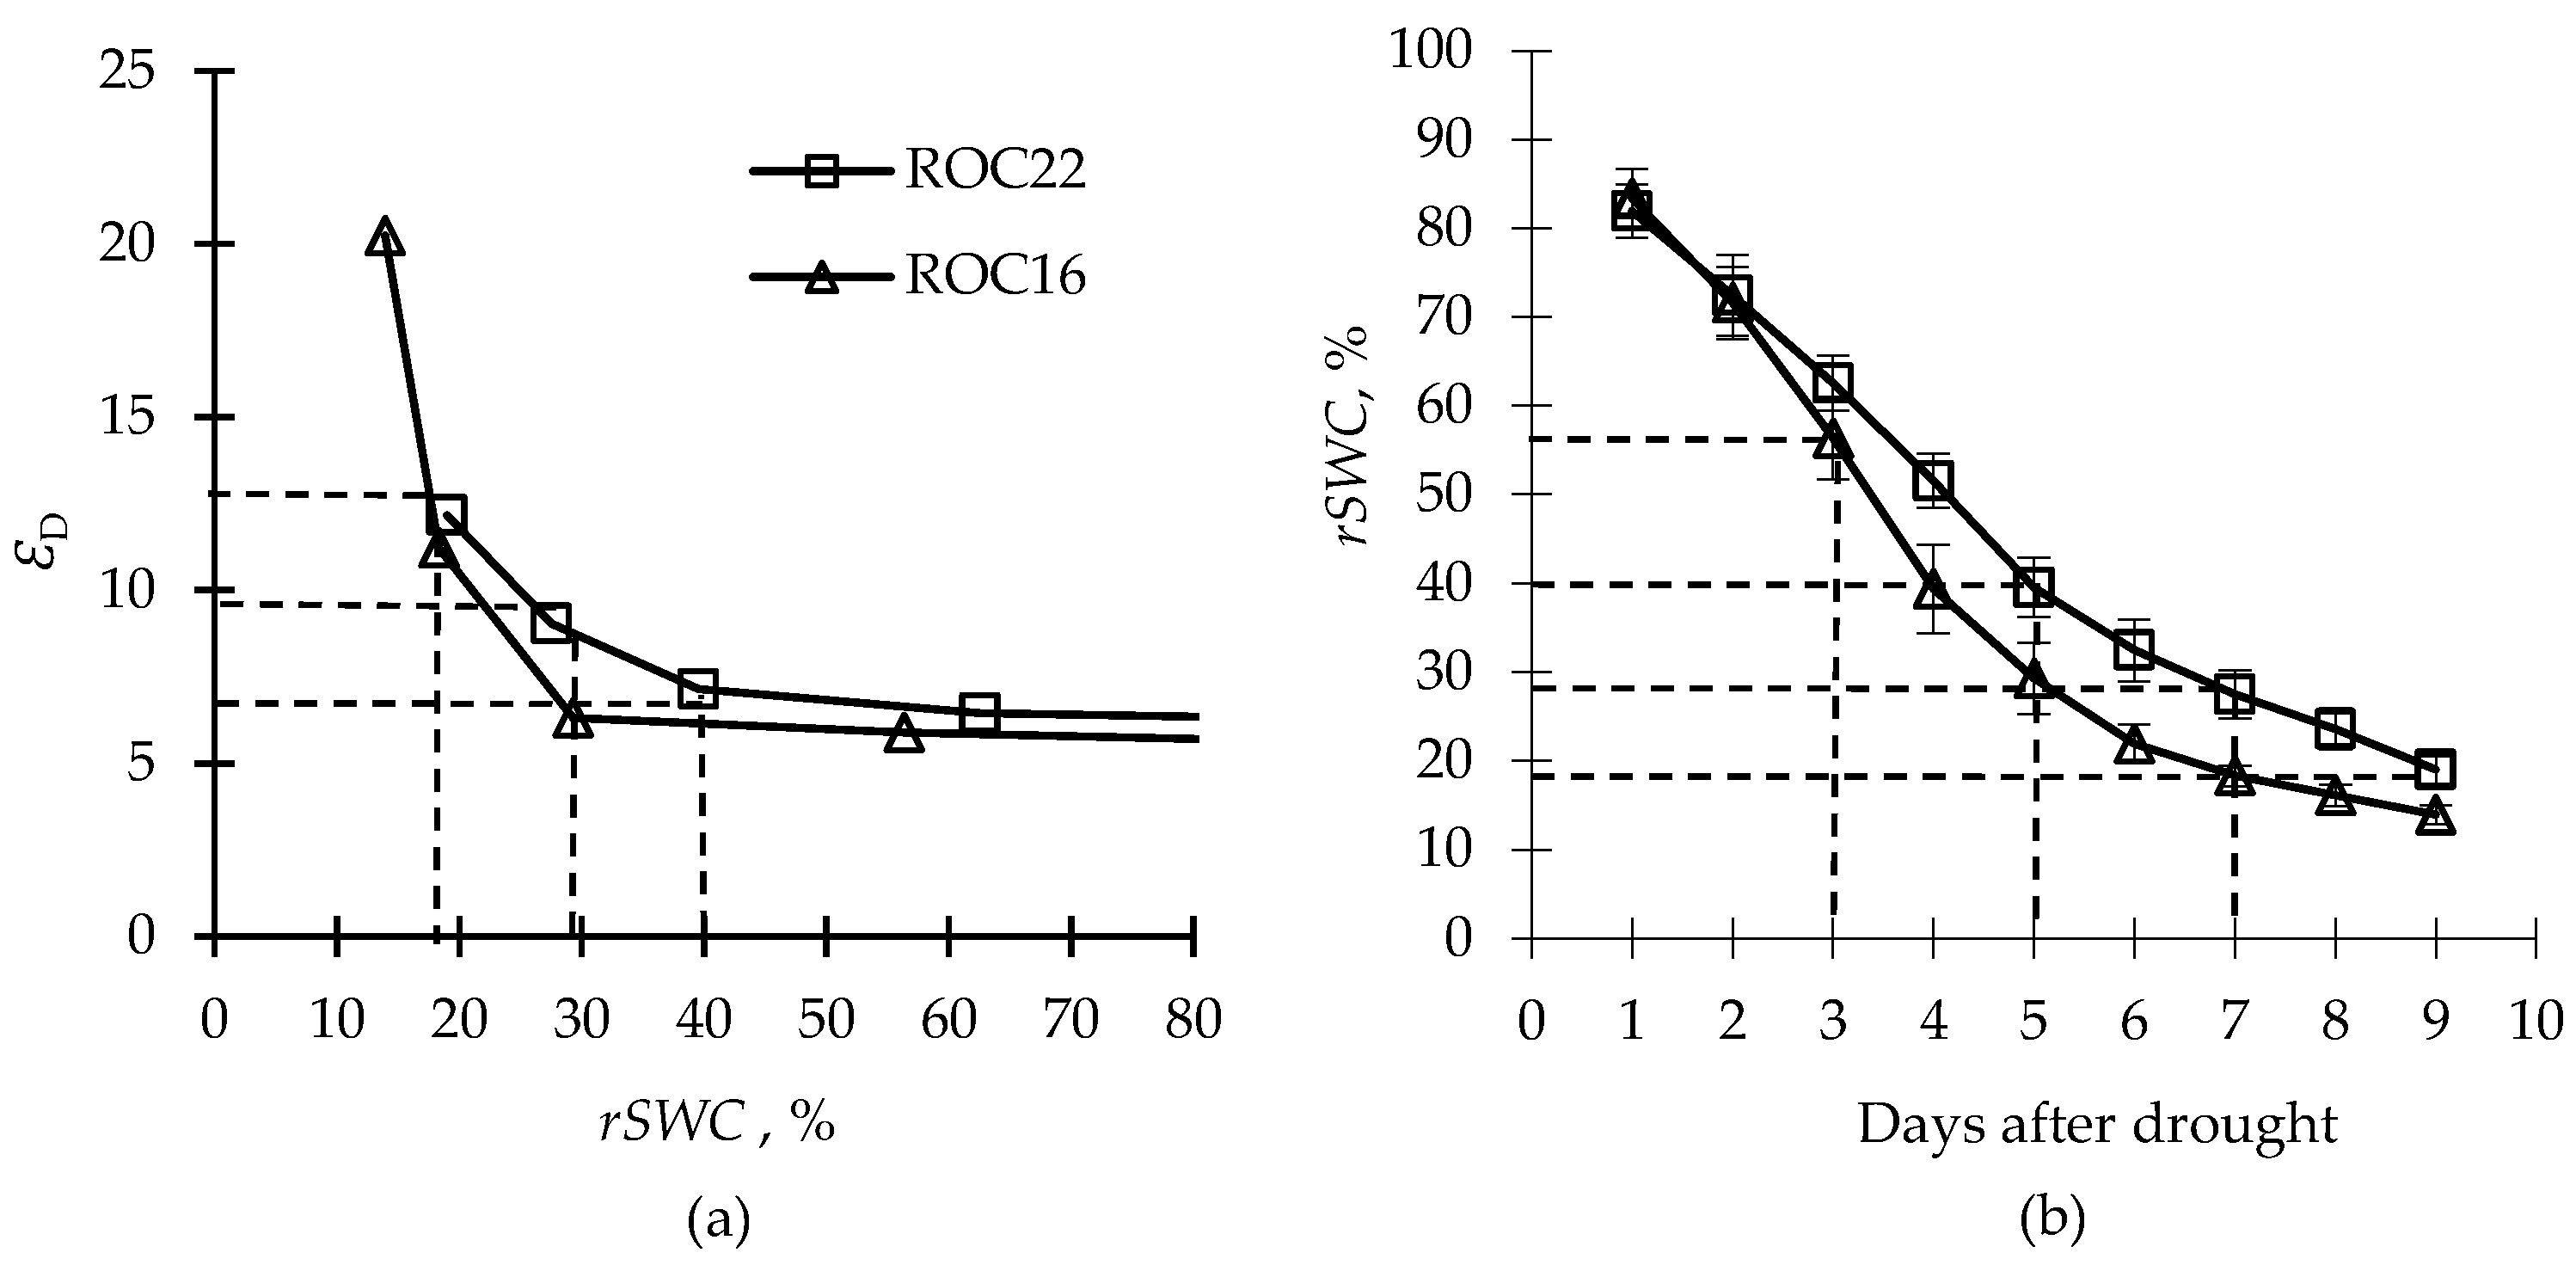
The parameter ΕD increased with the decrease in rSWC for both cultivars, and a higher ΕD value of denoted severe effects of drought-induced stress on the plant thus could be used for drought-stress assessment. Different downward trends were observed between the two cultivars during drought stress. The ΕD of ‘ROC22’ increased gradually when the rSWC decreased from 29% to 18%, while that of ‘ROC16’ increased drastically when the rSWC dropped below the 29% level. Based on the corresponding Ε D for drought-stress assessment, the slight, moderate, and severe drought conditions were described as 7 <Ε D< 9, 9 <Ε D< 13, and Ε D> 13, respectively (Figure 2a).
According to our experiments, the rSWCc values for ‘ROC22’ and ‘ROC16’ were 40% and 29%, respectively, showing that the photochemical reaction for ‘ROC22’ responded at a higher water status in contrast to that of ‘ROC16’ (Figure 2b). Additionally, rSWC decreased faster for ‘ROC16’ than for ‘ROC22’ during drought stress, indicating that the two cultivars possessed different water consumption characteristics under drought conditions.

2.3. Energy Distributionin PSII in Response to Drought

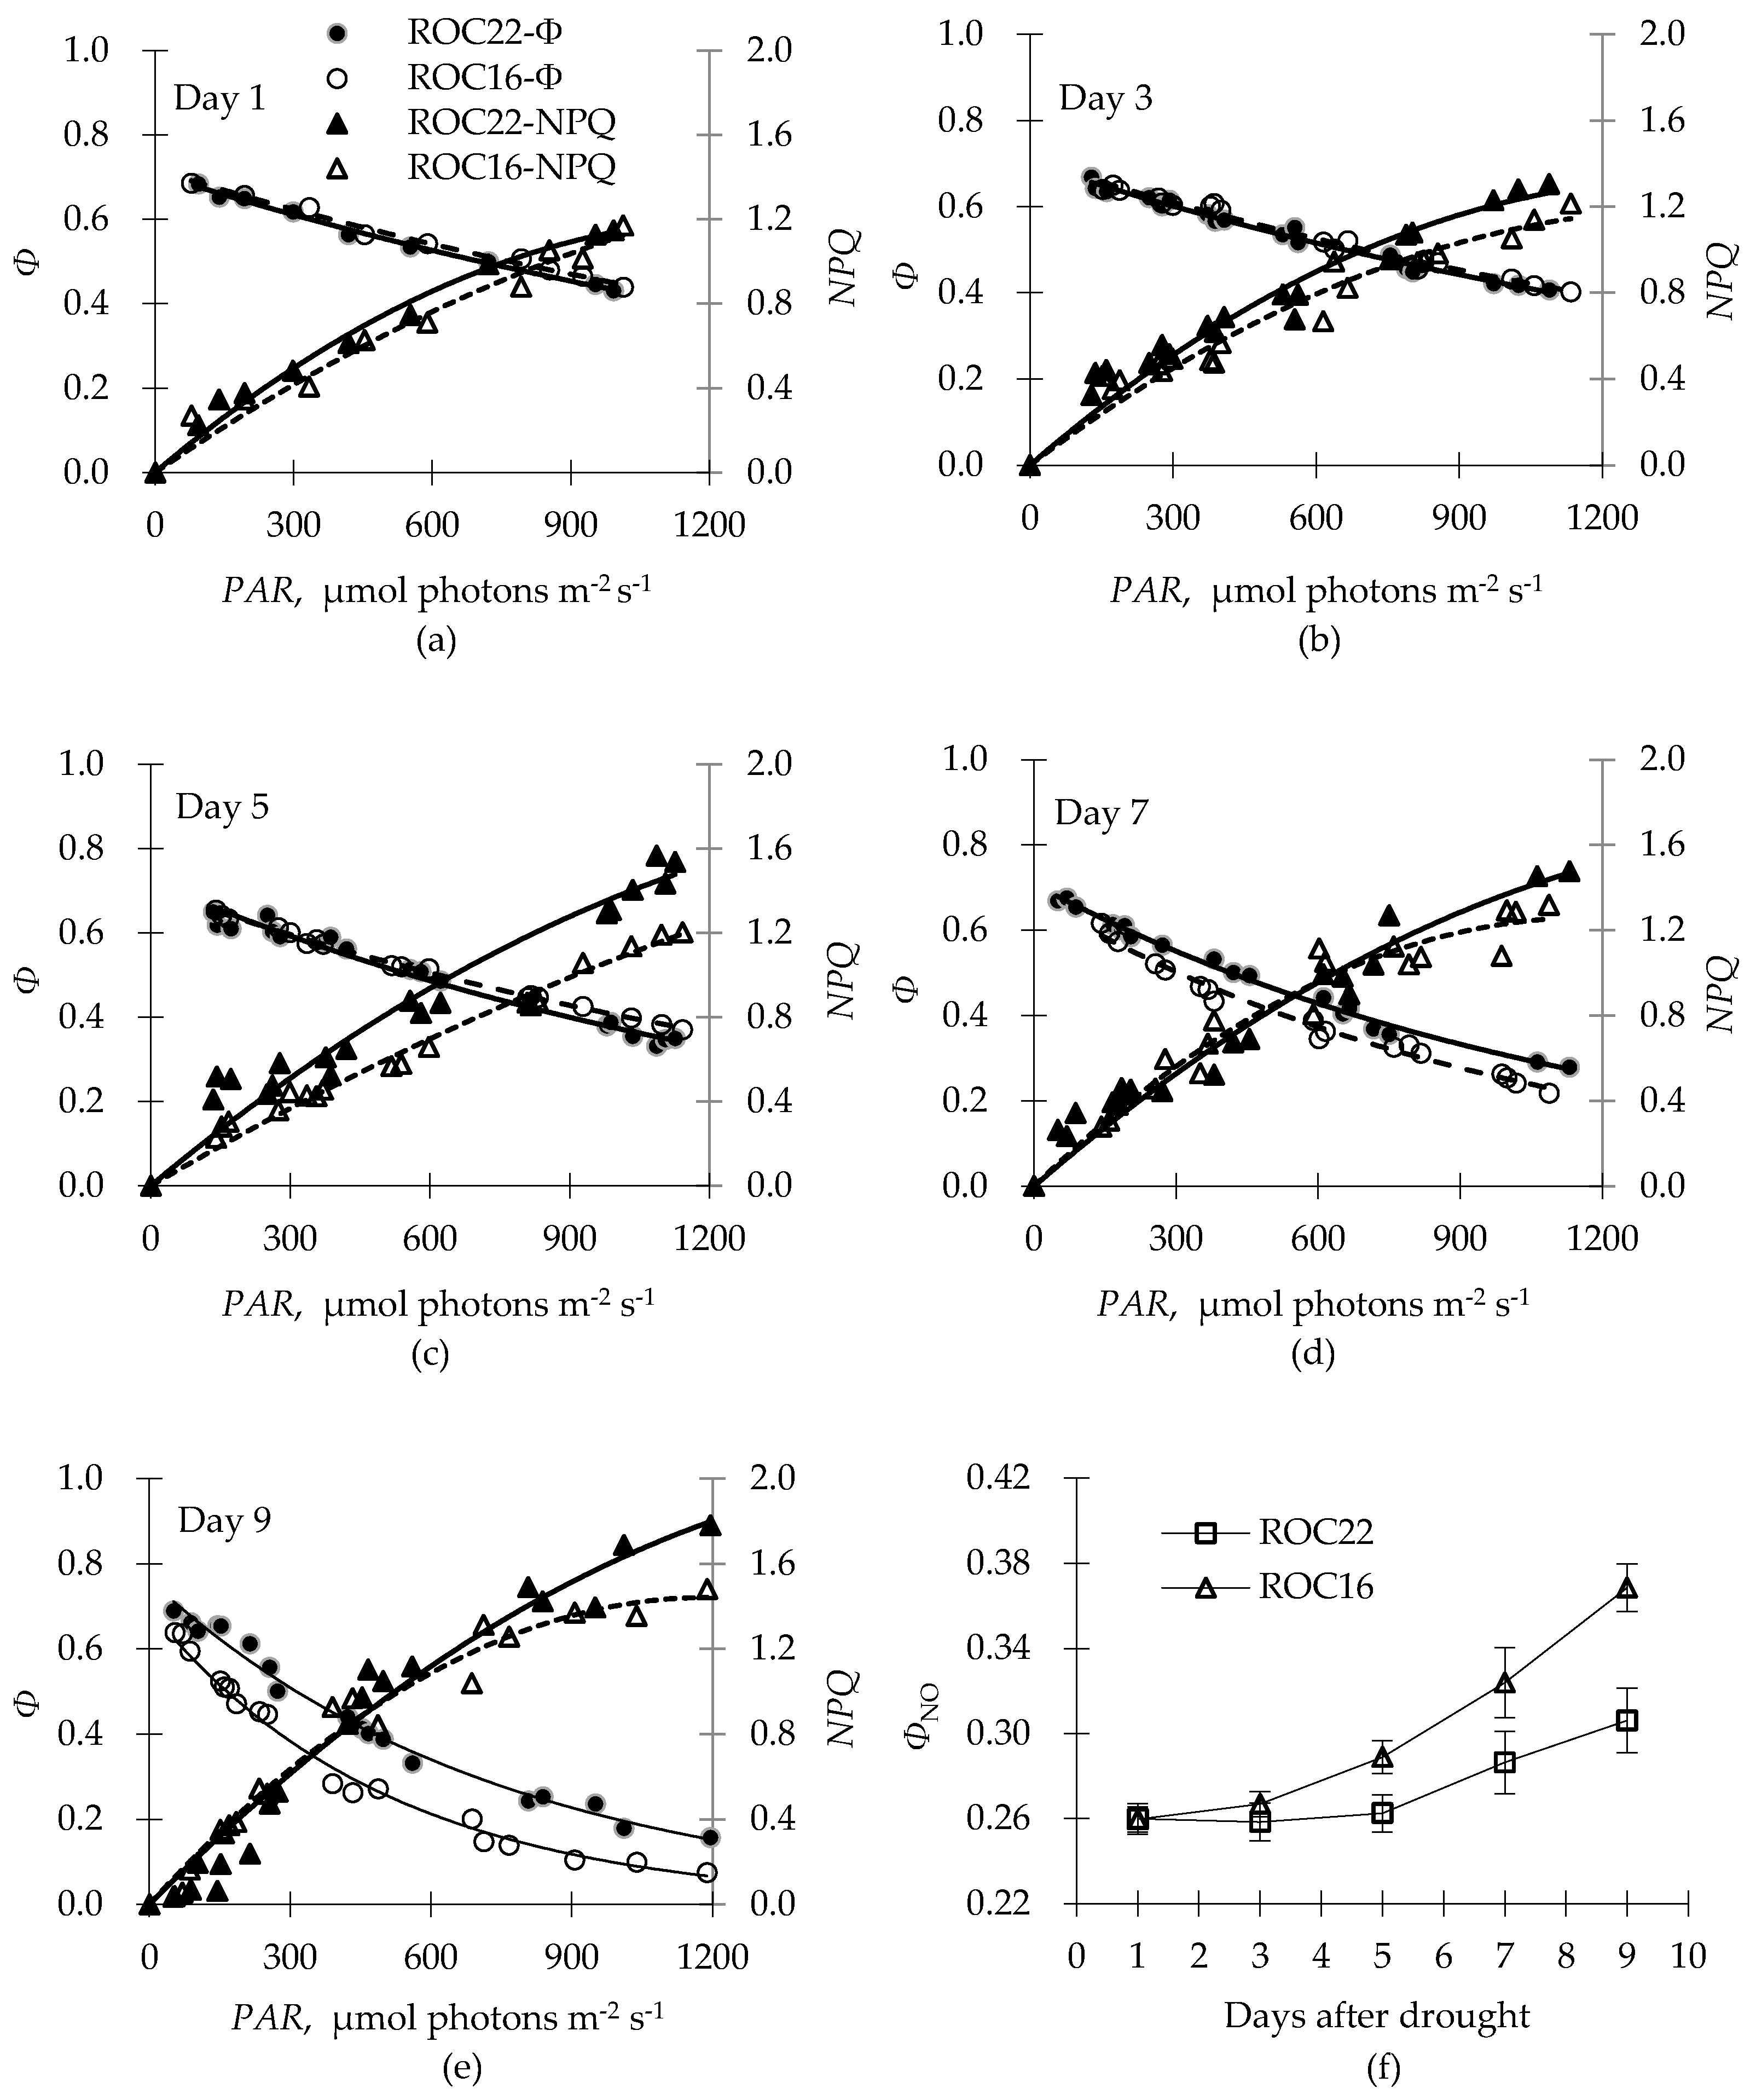
We used the parameters Φ and NPQ to assess the transfer of excitation light energy to photochemical reaction and its decay via heat loss, respectively. Five days after the drought treatment, the Φ of ‘ROC16’ was slightly higher than that of ‘ROC22’; however, both cultivars exhibited the same NPQ level on day 1, and it differed with the increasing PAR from day 3 to day 5 (Figure 3a–c). ‘ROC22’ maintained high Φ compared to ‘ROC16’ at day 7 after the drought treatment, but the two cultivars had the same NPQ level when the PAR was below 900 μmol photons m−2 s−1. After 9 days of drought stress, both the Φ and the NPQ of ‘ROC16’ were significantly lower than those of ‘ROC22’ (Figure 3d,e). The results demonstrated that the photoprotective mechanism based on the heat loss of ‘ROC16’ did not involve excessive energy consumptionwhen compared with that of ‘ROC22’. Another piece of evidence that showed less energy consumption was the increased ΦNO levels observed on day 3 (rSWC 56%) and day 5 (rSWC 40%) for ‘ROC16’ and ‘ROC22’, respectively, after the drought treatment. The ΦNO value of ‘ROC16’ was significantly higher than that of ‘ROC22’ after day 3, and the difference was magnified with aggravation of drought stress, indicating higher drought-induced damage imposed on ‘ROC16’ than on ‘ROC22’ (Figure 3f).
Furthermore, the ΕD values of the two cultivars increased on day 5 after the drought treatment, but the rSWC values of ‘ROC22’ and ‘ROC16’ decreased to 40% and 29%, respectively. This differed from the rSWC values (56% for ‘ROC16’ and 40% for ‘ROC22’) that corresponded to the turning point of ΦNO, implying that the PSII of ‘ROC22’ responded to the water deficit more quickly than did that of ‘ROC16’. Contemporaneously, for ‘ROC22’, the NPQ rose to 1.6 when the PAR approached 1200 μmol photons m−2 s−1 but remained below 1.3 for ‘ROC16’ throughout the drought treatment. NPQ merely increased when the PAR ranged from 100 to 900 μmol photons m−2 s−1 on day 7 and day 9 for ‘ROC16’ and on day 5 for ‘ROC22’. This phenomenon demonstrated that rapid and high energy dissipation in drought is essential for drought tolerance in sugarcane.

2.4. Different Drought-Response Patterns for Two Cultivars

We investigated the diverse drought-response patterns of the two sugarcane cultivars. The results showed that ‘ROC22’ exhibited a quick response and a high capability of NPQ (Figure 2b) instead of liner electron transport (exhibited via low Ε D) at the onset of drought (rSWC of 40%) (Figure 3c). This delayed the conversion from the drought-induced reaction to the physiological damage of the PSII, which was indicated with an increase in ΦNO (Figure 3f). However, ‘ROC16’ maintained a relatively lower Ε D value to ensure photochemical efficiency until the rSWC dropped to 29%, after which the NPQ increased at PAR of merely 100~900 μmol photons m−2 s−1. Moreover, the ΦNO of ‘ROC16’ was significantly higher than that of ‘ROC22’. The different water consumption characteristics of the two cultivars were revealed in the differentially decreasing rates of rSWC, which showed that ‘ROC16’ had higher rSWC than ‘ROC22’ throughout the drought treatment.

2.5. Model Validation

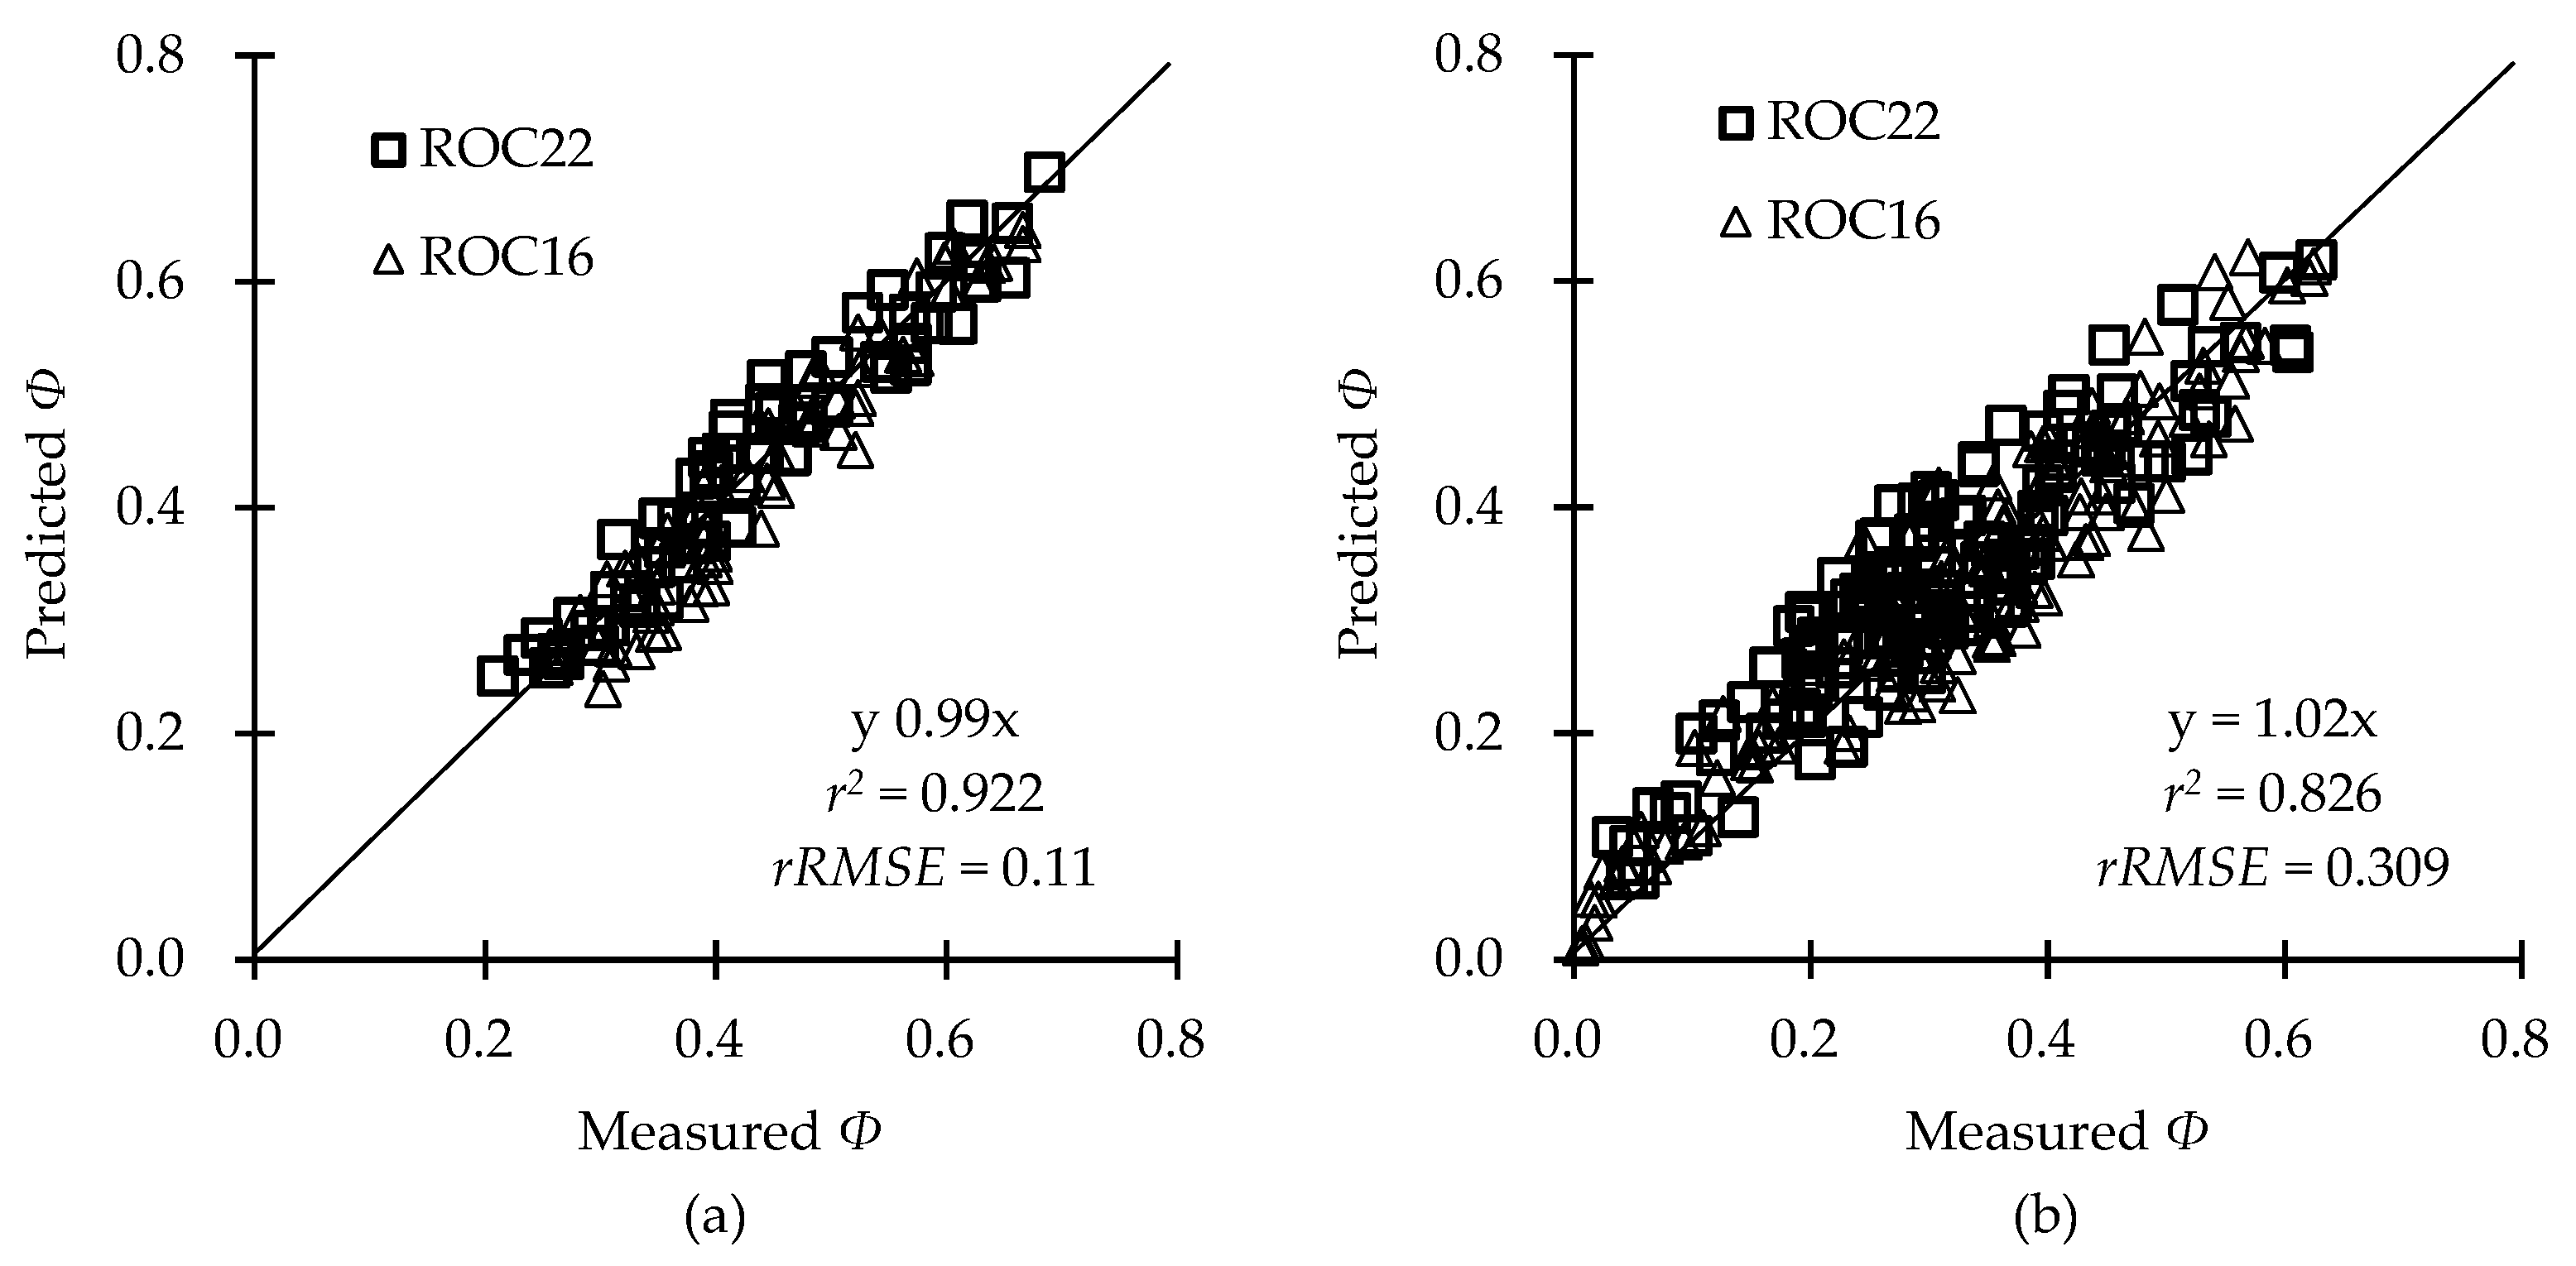
The coefficient of determination (r2) and relative root mean-squared error (rRMSE) of the predicted values were 0.922 and 0.11 (Figure 4a), while those of the measured values were 0.826 and 0.309 (Figure 4b), respectively, for Φ under different photothermal and drought conditions, indicating that the model could be applied for drought-tolerance assessment or drought-stress diagnosis for sugarcane cultivars.

3. Discussion

The minimum, optimal, and maximum temperatures obtained from the curve fitting of the net photosynthetic rate under saturated light (Pn,max) and air temperature (Ta) were used to describe the fundamental temperature for crop growth [32]. The relationship between Φ and T at limited PAR observed in our study was similar to those reported in previous studies [33]; however, in our study, the fitted parameters varied with different PAR levels (Figure 1). Unlike with Pn,max, the occurrence of Φb (ΦbL or ΦbH) at low or high temperatures was associated with alternative electron fluxes beyond photochemical reaction processes, such as photorespiration, the Mehler reaction, or cyclic and pseudocyclic electron transport under normal or drought conditions [34,35]. For instance, photorespiration and the Mehler reaction constituted 20% and 30% of the total electron flux, respectively [36,37]. Moreover, the rETR remained at 50% under normal conditions, even when photosynthesis ceased due to stomatal closure under drought stress [38]. This could also explain the existence of Φb and the gradual decrease in Φ with increases or decreases in temperature in our study compared with the Pn,max-Ta of the C3, C4, and CAM plants [39].
The Φ of sugarcane, a typical C4 crop, showed higher sensitivity to lower temperatures than to higher temperatures because C4 pathway enzymes are cold-labile due to the limitations of phosphoenolpyruvate carboxylase (PEPC) and pyruvate phosphate dikinase (PPDK) [40,41]. This explains why the ΦbL value was lower than that of ΦbH, and the increasing disparity between ΦbL and ΦbH with increasing PAR. The assumption that ΦbL and ΦbH exhibited the same downward trend as ΦTo in our study resulted in underestimation of Φ, especially when a value below 0.2 was obtained with a combination of drought, high PAR, and low (or high) temperature (Figure 4b). This phenomenon resulted from the fact that both net photosynthetic rate and ΦPSII significantly decrease more under drought–cold stress than under drought stress only [42]. Additionally, combined heat and drought stress severely affect crop leaves at the physiological and biochemical levels via detrimental variation of photosynthetic pigments, osmolytes, and enzymatic antioxidant activities more than heat or drought stress alone [43,44].
We supposed that light energy was allocated between liner electron transport (Φ) and heat loss (NPQ) at the onset of drought stress until the occurrence of potential damage in the PSII, indicated with the concurrence of increased ΦNO and decreased NPQ (or qN) shown in studies of salt stress [45,46] and disease influence [47]. The increase in NPQ compromised the decrease in Φ based on their new relationship acquired in the dark that followed illumination, which could be more appropriate to describe the photoprotective potential of NPQ [48]. This phenomenon also appeared in sweet sorghum and maize, with the degree of NPQ change differing in different cultivars under drought stress [49,50]. However, a significant increase in ΦNO was found when sorghum suffered from drought [51]; this might be related to quenching of singlet oxygen via β-carotene [52], which could also cause photoinhibition via degradation of the D1 protein in the PSII center [53]. Similar results appeared in coastal halophytic marsh grasses with increasing salinity, and the high levels of the Mehler reaction and antioxidant enzymes improved adaptation in photoprotection [54]. Another study reported a decrease in ΦNO with enhanced ΦNPQ in maize under a long time field condition, which probably represented heat energy loss in protection of the stressed younger leaves [55].
Both the Φ and the water consumption of ‘ROC22’ were lower than those of ‘ROC16’ before the 5-day marker after drought, similarly to a previous study, where the sugarcane response to drought involved a rapid decrease in Pn and gs for the drought-tolerance cultivar rather than the drought-sensitive one [7]. This might be associated with rapid stomatal closure, to reduce water loss, induced via ABA [56], which is synthesized in arid root systems to induce specific genes and proteins in response to water deficit [10,57]. In conversion of the value range of the ΕD to water status, the drought degree of sugarcane plantation was divided into three stages: 29% < rSWC < 40% (slight), 18 < rSWC< 29% (moderate), and rSWC < 18% (severe). These ranges were lower than those reported in the previous study (which were 65~70% (slight), 45~50% (moderate), and 25~30% (severe)) [58], since we concentrated on the critical value of irrecoverable physiological injury instead of the yield reduction caused by the stress reaction. The accuracy, persuasiveness, and application scope of the model could be improved after more cultivars (or varieties) participate in parameter fitting and model validation.

4. Materials and Methods

4.1. Plant Materials and Treatment

Two sugarcane cultivars, ‘ROC22’ (drought-resistant) and ‘ROC16’ (drought-sensitive), cultivated by the Taiwan Sugar Research Institute, were used in this study; both were main cultivars introduced and applied in production in south China [59] and used in many drought-response researches [24,60,61]. Five experiments were conducted with the same planting, management, and drought treatment during different seasons in Zhanjiang, China (21° N, 110° E), from 2019 to 2021. Bucket planting was adopted for the experiment, with 30 buckets for each cultivar and three stems (1 bud per segment) per bucket, arranged based on field planting density (90,000 buds·ha−1). The caliber, bottom diameter, and height of each bucket were 40 cm, 30 cm, and 40 cm, respectively. The buckets contained red soil (70%), sand (20%), and organic manure (10%) as a substrate. The buckets were placed on hardened ground in an open environment without shading to implement photothermal experiments at the 8th/euphylla stage until the drought experiments were initiated. Five and ten buckets with uniform-growth seedlings were selected for the photothermal experiments and the drought experiments, respectively. The environmental conditions and substrate properties for each experiment are displayed in Table 2.
Photothermal experiments were conducted under field conditions. The average Fv/Fm value of 9 leaves, measured at To under well-watered conditions and selected from 15 plants (5 buckets) in experiment 5 (Exp5) and with 30 points of Φ obtained under 3 given PAR levels (285, 625, and 1150 μmol photons m−2 s−1), with T ranging from 11.8 °C to 42.7 °C for each cultivar from 30 plants (10 buckets) in Exp1-3, was used to fit the photothermal response model (evaluation of Φ under different light and temperature backgrounds). Furthermore, 60 sets of the Φ, PAR, and T measured for each cultivar fromExp4 and Exp5were used for model validation. The buckets were kept in a nearby greenhouse for a short time (10 min) for Φ acquisition at a higher T (over 38 °C).
For the subsequent drought experiments, the buckets were placed infield conditions, except for those in Exp5, which were moved into the phytotron from 6:00 to 12:00, with the PAR increasing from 0 to 1200 μmol photons m−2 s−1 (20% light intensity increased per hour using artificial light) under optimal T (29 ± 1.5 °C) at 1, 3, 5, 7, and 9 d after withholding of irrigation. The measured Φ, VWC, Fv/Fm, PAR, and T were used to estimate ΕD, and the energy dissipation parameters obtained from Exp5 were used to analyze the different responses of the photoprotective mechanisms between the two cultivars under drought conditions. A total of 125 sets of the Φ, VWC, Fv/Fm, PAR, and T obtainedfor each cultivarfrom 8:00 to 12:00 am in Exp1-4 were used for model validation.

4.2. Chlorophyll Fluorescence and Substrate Water Content Measurement

The chlorophyll fluorescence (ChlF) parameters were measured on the middle part of each +1 leaf (the first fully expanded leaf when counting from the top down) using a MINI-PAM-II analyzer (Walz, Effeltrich, Germany), which measures PAR and temperature via a self-contained sensor. All of the ChlF parameters were obtained under natural light conditions, except for those measured in the phytotron in Exp5, where artificial light had been used for light adaptation. The leaf clip was slightly adjusted to ensure relatively constant PAR (within ±10), and a stable Fs was waited for to initiate the process of measuring Fm′. Then, Fo and Fm were measured after 30 min of dark adaptation using dark clips at the same leaf position. The next round of Fs and Fm′ measurement was conducted after 30 min of natural light adaptation (artificial light in the phytotron in Exp5). Four basic fluorescence parameters, Fs (steady fluorescence from light-adapted leaves), Fm′ (maximal fluorescence from light-adapted leaves), Fo (minimal fluorescence from 30 min dark-adapted leaves), and Fm (maximal fluorescence from 30 min dark-adapted leaves), were measured from morning to midday. The obtained parameters were then used to calculate the minimal fluorescence from light-adapted leaves (Fo′) [62], photosynthetic quantum efficiency (Φ), the maximum quantum efficiency of PSII photochemistry (Fv/Fm), nonphotochemical quenching (NPQ), and the yield for other energy losses (ΦNO) [63] indicating non-regulated energy dissipation.
Fo′ = Fo/[(Fv/Fm) + (Fo/Fm′)]
Φ = (Fm′ − Fs)/Fm
Fv/Fm = (FmFo)/Fm
NPQ = Fm/Fm′ − 1
ΦNO = 1/[NPQ + 1 + qL(Fm/Fo − 1)], where qL = (Fo′/Fs)(FmFs)/(FmFo)
Parameter Φ was equivalent to and symbolized as ΔF/Fm′, ΦPSII, ΦII, or Φ2 in different studies, with the same calculation result [21,22,23,24,27,29,31,45,46,47,48,49,51,54,55,63].
Volumetric water content (VWC) was measured at a depth of 0~16 cm in each bucket via AZS-100 (Aozuo, China) at 8:00 a.m., with 5 repetitions during the drought treatment. The rSWC was calculated with the formula rSWC = VWC/VWCS (VWCS was measured at sufficient irrigation with 3 repetitions; Table 1).

4.3. Model Construction

4.3.1. Estimation of Photosynthetic Quantum Efficiency (Φ) under Different Photothermal Conditions

Three levels of PAR (285, 625, and 1150 μmol photons m−2 s−1) were adopted to measure Φ under different air temperatures (T) using artificial light in field conditions in different seasons, calculated using the formulae transformed from the calibration model proposed to evaluate the response of Φ to photothermal backgrounds [64] (Figure 1a):
Φ ( T ) = { Φ b L + ( Φ T o Φ b L ) × sin ( π 2 × T T min T o T min ) T min T T o Φ b H + ( Φ T o Φ bH ) × sin ( π 2 × T max T T max T o ) T o T T max
where ΦTo, ΦbL, and ΦbH represent the optimum Φ under To and the basic Φ values under low T and high T at limited PAR. Tmin, To, and Tmax represent the minimal, optimal, and maximal temperatures for sugarcane photosynthesis and vegetative growth, with values of 15 °C, 30 °C, and 40 °C, respectively, according to previous studies [65,66,67]. The relationship between ΦbL, ΦbH, ΦTo, and PAR was established as follows (Figure 1b):
Φ bL = a L × e P A R × b L
Φ bH = a H × e P A R × b H
Φ T o = ( F v / F m ) × e ε × 10 - 4 × P A R
The mean value of the Fv/Fm measured from Exp1~3 was used for Equation (4)’s fitting, and aL, bL, aH, and bH are empirical coefficients fitted from Equations (2) and (3). The parameter Ε, fitted from Equation (4), was merely related to different sugarcane cultivars.

4.3.2. Estimation of the Parameters under Drought Conditions

We inserted Equations (2)–(4) into Equation (1) to determine the Φ, Fv/Fm, PAR, T, and rSWC measured under drought and used the values to describe the relationship between ε and rSWC (Figure 2a):
ε D = { ε r S W C > r S W C c ε + c × e d × r S W R r S W C r S W C c
where rSWCc indicates the critical limit of rSWC for the two sugarcane cultivars, Ε D is Ε under drought stress, and c and d are the empirical coefficients fitted from Equation (5).
The effect of drought stress on ΦbL and ΦbH was assumed to be the same as that of ΦTo, and these values were calculated as:
Φ bL D = Φ bL × e ε × 10 - 4 × P A R
Φ bHD = Φ bH × e ε × 10 - 4 × P A R
where ΦbLD and ΦbHD represent ΦbL and ΦbH, respectively, under drought stress.

4.3.3. Model Validation

The coefficient of determination (r2) and relative root mean-squared error (rRMSE) were adopted to analyze the conformity and accuracy between the predicted and the measured values and were calculated as follows:
r 2 = ( ( x x ¯ ) ( y y ¯ ) ) 2 ( x x ¯ ) 2 ( y y ¯ ) 2
r R M S E = i = 1 n ( O B S i S I M i ) 2 n M
where x, y, x ¯ , y ¯ , OBSi, SIMi, M, and n are the measured value, predicted value, average measured variables, average predicted variables, observed value, simulated value, average observed value, and sample size for Equations (8) and (9), respectively.
The definitions, units, and values (standard error shown in brackets) of the parameters and empirical coefficients are listed in Table 1.

5. Conclusions

The simulation and energy distribution analyses exhibited an opposition between water consumption and drought tolerance. ‘ROC22’ (drought-resistant) decreased its water consumption and activated a photoprotective mechanism to delay the drought-induced physiological injury, while ‘ROC16’ (drought-susceptible) maintained relatively high water consumption to guarantee photochemical reactions but was severely injured with aggravation of drought.

Author Contributions

Conceptualization, D.A.; methodology, D.A. and B.Z.; formal analysis, D.A.; investigation, D.A., B.Z., Z.X., R.K. and C.Y.; writing—original draft preparation, D.A.; writing—review and editing, J.S.; supervision, J.S. and Y.L.; project administration, D.A. All authors have read and agreed to the published version of the manuscript.

Funding

This research was funded by the Hainan Provincial Natural Science Foundation of China, grant number 320MS113, and the Central Public-interest Scientific Institution Basal Research Fund for Chinese Academy of Tropical Agricultural Sciences, grant number 1630102017003.

Data Availability Statement

The data presented in this study are available upon request from the corresponding authors.

Conflicts of Interest

The authors declare no conflict of interest. The funders had no role in the design of this study; in the collection, analyses, or interpretation of the data; in the writing of this manuscript; or in the decision to publish these results.

References

  1. Khan, M.T.; Seema, N.; Khan, I.A.; Yasmine, S. Applications and potential of sugarcane as an energy crop. Agric. Res. Updates 2017, 16, 1–23. [Google Scholar]
  2. Huang, W.; Sui, Y.; Yang, X.; Dai, S.; Qu, H.; Li, M. Spatio-temporal characteristics of crop drought in southern China based on drought index of continuous days without available precipitation. Trans. Chin. Soc. Agric. Eng. 2014, 30, 125–135. [Google Scholar]
  3. Khonghintaisong, J.; Songsri, P.; Toomsan, B.; Jongrungklang, N. Rooting and physiological trait responses to early drought stress of sugarcane cultivars. Sugar Tech 2018, 20, 396–406. [Google Scholar] [CrossRef]
  4. Misra, V.; Solomon, S.; Mall, A.K.; Prajapati, C.P.; Hashem, A.; Abd_Allah, E.F.; Ansari, M.I. Morphological assessment of water stressed sugarcane: A comparison of waterlogged and drought affected crop. Saudi. J. Biol. Sci. 2020, 27, 1228–1236. [Google Scholar] [CrossRef]
  5. Chapae, C.; Songsri, P.; Gonkhamdee, S.; Jongrungklang, N. Understanding drought responses of sugarcane cultivars controlled under low water potential conditions. Chil. J. Agric. Res. 2020, 80, 370–380. [Google Scholar] [CrossRef]
  6. Cia, M.C.; Guimarães, A.C.R.; Medici, L.O.; Chabregas, S.M.; Azevedo, R.A. Antioxidant responses to water deficit bydrought-tolerant and –sensitive sugarcane varieties. Ann. Appl. Biol. 2012, 161, 313–324. [Google Scholar] [CrossRef]
  7. Sales, C.R.G.; Marchiori, P.E.R.; Machado, R.S.; Fontenele, A.V.; Machado, E.C.; Silveira, J.A.G.; Ribeiro, R.V. Photosyntheticandantioxidantresponsestodroughtduringthesugarcaneripening. Photosynthetica 2015, 53, 547–554. [Google Scholar] [CrossRef]
  8. Cha-um, S.; Wangmoon, S.; Mongkolsiriwatana, C.; Ashraf, M.; Kirdmanee, C. Evaluatingsugarcane (Saccharum sp.) cultivars for water deficit tolerance using some key physiological markers. Plant Biotechnol. 2012, 29, 431–439. [Google Scholar] [CrossRef]
  9. Silva, M.D.A.; Silva, J.A.G.D.; Enciso, J.; Sharma, V.; Jifon, J. Yield components as indicators of drought tolerance of sugarcane. Sci. Agric. 2008, 65, 620–627. [Google Scholar] [CrossRef]
  10. Priji, P.J.; Hemaprabha, G. Sugarcane specific drought responsive candidate genes belonging to ABA dependent pathway identified from basic species clones of Saccharum sp. and Erianthus sp. Sugar Tech 2014, 17, 130–137. [Google Scholar] [CrossRef]
  11. Liu, D.L.; Bull, T.A. Simulation of biomass and sugar accumulation in sugarcane using a process-based model. Ecol. Model. 2001, 144, 181–211. [Google Scholar] [CrossRef]
  12. Singels, A.; Bezuidenhout, C.N. A new method of simulating dry matter partitioning in the Canegro sugarcane model. Field Crops Res. 2002, 78, 151–164. [Google Scholar] [CrossRef]
  13. Singels, A.; Paraskevopoulos, A.L.; Mashabela, M.L. Farm level decision support for sugarcane irrigation management during drought. Agric. Water Manag. 2019, 222, 274–285. [Google Scholar] [CrossRef]
  14. Inman-Bamber, N.G.; Jackson, P.A.; Stokes, C.J.; Verrall, S.; Lakshmanan, P.; Basnayake, J. Sugarcane for water-limited environments: Enhanced capability of the APSIM sugarcane model for assessing traits for transpiration efficiency and root watersupply. Field Crops Res. 2016, 196, 112–123. [Google Scholar] [CrossRef]
  15. Lebourgeois, V.; Chopart, J.L.; Bégué, A.; Mézo, L.L. Towards using a thermal infrared index combined with water balance modeling to monitor sugarcane irrigation in a tropical environment. Agric. Water Manag. 2010, 97, 75–82. [Google Scholar] [CrossRef]
  16. Morel, J.; Bégué, A.; Todoroff, P.; Martiné, J.-F.; Lebourgeois, V.; Petit, M. Coupling asugarcane crop model with the remotely sensed timeseries of fIPAR to optimise the yield estimation. Eur.J.Agron. 2014, 61, 60–68. [Google Scholar] [CrossRef]
  17. Veysi, S.; Naseri, A.A.; Hamzeh, S.; Bartholomeus, H. A satellite based crop water stress index for irrigation scheduling in sugarcane fields. Agric. Water Manag. 2017, 189, 70–86. [Google Scholar] [CrossRef]
  18. Baker, N.R. Chlorophyll fluorescence: A probe of photosynthesis in vivo. Annu. Rev. PlantBiol. 2008, 59, 89–113. [Google Scholar] [CrossRef]
  19. Ismail, M.R.; Davies, W.J.; Awad, M.H. Leaf growth and stomatal sensitivity to ABA in droughted pepper plants. Sci. Hortic. 2002, 96, 313–327. [Google Scholar] [CrossRef]
  20. Tombesi, S.; Nardini, A.; Frioni, T.; Soccolini, M.; Zadra, C.; Farinelli, D.; Poni, S.; Palliotti, A. Stomatal closure is induced byhydraulic signals and maintained by ABA in drought-stressed grapevine. Sci. Rep. 2015, 5, 12449. [Google Scholar] [CrossRef]
  21. Dias, M.C.; Brüggemarm, W. Limitations of photosynthesis in Phaseolus vulgaris under drought stress: Gas exchange, chlorophyll fluorescence and Calvin cycle enzymes. Photosynthetica 2010, 48, 96–102. [Google Scholar] [CrossRef]
  22. Massacci, A.; Nabiev, S.M.; Pietrosanti, L.; Nematov, S.K.; Chernikova, T.N.; Thor, K.; Leipner, J. Response of the photosynthetic apparatus of cotton (Gossypium hirsutum) to the onset of drought stress under field conditions studied by gas-exchange analysis and chlorophyll fluorescence imaging. Plant Physiol. Biochem. 2008, 46, 189–195. [Google Scholar] [CrossRef]
  23. Zhu, L.; Xing, Y.; Yang, L.; Li, Y.; Yang, R.; Mo, L. Effects of waters tress on leaf water and chlorophyll fluorescence parameters of sugarcane seedling. Agric. Sci. Technol. 2010, 11, 17–21. [Google Scholar]
  24. An, D.; Cao, J.; Huang, X.; Zhou, J.; Dou, M. Application of Lake-model based indices from chlorophyll fluorescence on sugarcane seedling drought resistance study. Chin. J. Plant. Ecol. 2015, 39, 398–406. [Google Scholar]
  25. Silva, M.A.; Pincelli, R.P.; Barbosa, A.M. Water stress effects on chlorophyll fluorescence and chlorophyll content in sugarcane cultivars with contrasting tolerance. Biosci. J. 2018, 34, 75–87. [Google Scholar] [CrossRef]
  26. Krause, G.H.; Somersalo, S.; Zumbusch, E.; Weyers, B.; Laasch, H. On the mechanism of photoinhibition in chloroplasts. Relationship between changes in fluorescence and activity of PhotosystemII. J. Plant Physiol. 1990, 136, 472–479. [Google Scholar] [CrossRef]
  27. Naumann, J.C.; Young, D.R.; Anderson, J.E. Linking leaf chlorophyll fluorescence properties to physiological responses for detection of salt and drought stress in coastal plants pecies. Physiol. Plant. 2007, 131, 422–433. [Google Scholar] [CrossRef] [PubMed]
  28. Genty, B.; Briantais, J.M.; Baker, N.R. The relationship between quantum yield of photosynthetic electron transport and quenching of chlorophyll fluorescence. Biochim. Biophys. Acta. 1989, 990, 87–92. [Google Scholar] [CrossRef]
  29. Yin, X.; Sun, Z.; Struik, P.C.; Putten, P.E.L.V.D.; Ieperen, W.V.; Harbinson, J. Using a biochemical C4 photosynthesis model and combined gas exchange and chlorophyll fluorescence measurements to estimate bundle-sheath conductance of maize leaves differing in age and nitrogen content. Plant Cell Environ. 2011, 34, 2183–2199. [Google Scholar] [CrossRef]
  30. Derks, A.; Schaven, K.; Bruce, D. Diverse mechanisms for photoprotection in photosynthesis. Dynamic regulation of photosystem II excitation in response to rapid environmental change. Biochim. Biophys. Acta 2015, 1847, 468–485. [Google Scholar] [CrossRef]
  31. Yu, S.; Zhang, N.; Kaiser, E.; Li, G.; An, D.; Sun, Q.; Chen, W.; Liu, W.; Luo, W. Integrating chlorophyll fluorescence parameters into a crop model improves growth prediction under severe drought. Agric. For. Meteorol. 2021, 303, 108367. [Google Scholar] [CrossRef]
  32. Xu, R.; Dai, J.; Luo, W.; Yin, X.; Li, Y.; Tai, X.; Han, L.; Chen, Y.; Lin, L.; Li, G.; et al. A photothermal model of leaf area index for greenhouse crops. Agric. For. Meteorol. 2010, 150, 541–552. [Google Scholar] [CrossRef]
  33. Clarke, J.E.; Johnson, G.N. In vivo temperature dependence of cyclic and pseudocyclic electron transport in barley. Planta 2001, 212, 808–816. [Google Scholar] [CrossRef] [PubMed]
  34. Wingler, A.; Quick, W.P.; Bungard, R.A.; Bailey, K.J.; Lea, P.J.; Leegood, R.C. The role of photorespiration during drought stress: Ananalysis utilizing barley mutants with reduced activities of photorespiratory enzymes. Plant Cell Environ. 1999, 22, 361–373. [Google Scholar] [CrossRef]
  35. Sagun, J.V.; Badger, M.R.; Chow, W.S.; Ghannoum, O. Mehler reaction plays a role in C3 and C4 photosynthesis under shade and low CO2. Photosynth. Res. 2021, 149, 171–185. [Google Scholar] [CrossRef]
  36. Asada, K. The water-water cyclein chloroplasts: Scavenging of active oxygens and dissipation of excess photons. Annu. Rev. Plant Physiol. Plant Mol. Biol. 1999, 50, 601–639. [Google Scholar] [CrossRef]
  37. Ort, D.R.; Baker, N.R. A photo-protective role for O2 as an alternative electron sink in photosynthesis? Curr. Opin. Plant Biol. 2002, 5, 193–198. [Google Scholar] [CrossRef]
  38. Flexas, J.; Briantais, J.; Cerovic, Z.; Medrano, H.; Moya, I. Steady-state and maximum chlorophyll fluorescence responses to water stress in grapevine leaves: A new remote sensing system. Remote Sens. Environ. 2000, 73, 283–297. [Google Scholar] [CrossRef]
  39. Yamori, W.; Hikosaka, K.; Way, D.A. Temperature response of photosynthesis in C3, C4, and CAM plants: Temperature acclimation and temperature adaptation. Photosynth. Res. 2014, 119, 101–117. [Google Scholar] [CrossRef]
  40. Chinthapalli, B.; Murmu, J.; Raghavendra, A.S. Dramatic difference in the responses of phosphoenolpyruvate carboxylase to temperature in leaves of C3 and C4 plants. J. Exp. Bot. 2003, 54, 707–714. [Google Scholar] [CrossRef]
  41. Wang, D.; Naidu, S.L.; Portis, A.R., Jr.; Moose, S.P.; Long, S.P. Can the cold tolerance of C4 photosynthesis in Miscanthus 9 giganteus relative to Zea mays be explained by differences in activities and thermal properties of Rubisco? J. Exp. Bot. 2008, 59, 1779–1787. [Google Scholar] [CrossRef] [PubMed]
  42. Guo, Q.; Li, X.; Niu, L.; Jameson, P.E.; Zhou, W. Transcription-associated metabolomic adjustments in maize occur during combined drought and cold stress. Plant Physiol. 2021, 186, 677–695. [Google Scholar] [CrossRef] [PubMed]
  43. Ibáñez, H.; Ballester, A.; Muñoz, R.; Quiles, M.J. Chlororespiration and tolerance to drought, heat and high illumination. J. Plant Physiol. 2010, 167, 732–738. [Google Scholar] [CrossRef] [PubMed]
  44. Sattar, A.; Sher, A.; Ijaz, M.; Ul-Allah, S.; Rizwan, M.S.; Hussain, M.; Jabran, K.; Cheem, M.A. Terminal drought and heat stress alter physiological and biochemical attributes in flag leaf of bread wheat. PLoS ONE 2020, 15, e0232974. [Google Scholar] [CrossRef] [PubMed]
  45. Yuan, Y.; Shu, S.; Li, S.; He, L.; Li, H.; Du, N.; Sun, J.; Guo, S. Effects of exogenous putrescine on chlorophyll fluorescence imaging and heat dissipation capacity in cucumber (Cucumis sativus L.) under salt stress. J. Plant Growth Regul. 2014, 33, 798–808. [Google Scholar] [CrossRef]
  46. Wei, H.; He, W.; Li, Z.; Ge, L.; Zhang, J.; Liu, T. Salt-tolerant endophytic bacterium Enterobacter ludwigiiB30 enhance bermuda grass growth under salt stress by modulating plant physiology and changing rhizosphere and root bacterial community. Front. Plant Sci. 2022, 13, 959427. [Google Scholar] [CrossRef] [PubMed]
  47. Suárez, J.C.; Vanegas, J.I.; Contreras, A.T.; Anzola, J.A.; Urban, M.O.; Beebe, S.E.; Rao, I.M. Chlorophyll Fluorescence Imaging as a Tool for evaluating disease resistance of common bean lines in the western amazon region of colombia. Plants 2022, 11, 1371. [Google Scholar] [CrossRef]
  48. Ruban, A.V.; Johnson, M.P.; Duffy, C.D.P. The photoprotective molecular switch in the photosystem II antenna. Biochim. Biophys. Acta 2012, 1817, 167–181. [Google Scholar] [CrossRef]
  49. Guo, Y.; Tian, S.; Liu, S.; Wang, W.; Sui, N. Energy dissipation and antioxidant enzyme system protect photosystem II of sweet sorghum under drought stress. Photosynthetica 2018, 56, 861–872. [Google Scholar] [CrossRef]
  50. Liu, M.; Qi, H.; Zhang, Z.; Song, Z.; Kou, T.; Zhang, W.; Yu, Z. Response of photosynthesis and chlorophyll fluorescence to drought stress in two maize cultivars. Afr. J. Agric. Res. 2012, 7, 4751–4760. [Google Scholar]
  51. Zhang, F.; Zhu, K.; Wang, Y.; Zhang, Z.; Lu, F.; Yu, H.; Zou, J. Changes in photosynthetic and chlorophyll fluorescence characteristics of sorghum under drought and water logging stress. Photosynthetica 2019, 57, 1156–1164. [Google Scholar] [CrossRef]
  52. Conn, P.F.; Schalch, W.; Truscott, T.G. The singlet oxygen and carotenoid interaction. J. Photochem. Photobiol. B Biol. 1991, 11, 41–47. [Google Scholar] [CrossRef] [PubMed]
  53. Aro, E.M.; Kettunen, R.; Tyystjärvi, E. ATP and light regulate Dl protein modification and degradation role of Dl* inphotoinhibition. FEBS Lett. 1992, 297, 29–33. [Google Scholar] [CrossRef] [PubMed]
  54. Moinuddin, M.; Gulzar, S.; Hameed, A.; Gul, B.; Khan, M.A.; Edwards, G.E. Differences in photosynthetic syndromes of four halophytic marsh grasses in Pakistan. Photosynth. Res. 2017, 131, 51–64. [Google Scholar] [CrossRef] [PubMed]
  55. Li, Y.; Song, H.; Zhou, L.; Xu, Z.; Zhou, G. Tracking chlorophyll fluorescence as an indicator of drought and rewatering across the entire leaf life span in a maize field. Agric. Water Manag. 2019, 211, 190–201. [Google Scholar] [CrossRef]
  56. Zhang, J.; Tardieu, F. Relative Contribution of apices and mature tissues to ABA synthesisin droughted maize root systems. Plant Cell Physiol. 1996, 37, 598–605. [Google Scholar] [CrossRef]
  57. Campalans, A.; Messeguer, R.; Goday, A.; Pagès, M. Plant responses to drought, from ABA signal transduction events to the action of the induced proteins. Plant Physiol. Biochem. 1999, 37, 327–340. [Google Scholar] [CrossRef]
  58. Jin, W.; Yang, L.; Ying, P.; Yang, J.; Luo, C.; Li, Y. Eco-physiological responses of different sugarcane varieties to drought and re-watering. J. South. Agric. 2012, 43, 1945–1951. [Google Scholar]
  59. Wei, J.; Zhou, H.; Li, H.; Mao, L.; Song, X.; Lei, J.; Gui, Y.; Zhang, R.; Li, Y.; Liu, X. Introduction and utilization of sugarcane germplasm resources in Guangxi in the past 40 years. J. South. Agric. 2021, 52, 280–287. [Google Scholar]
  60. Yao, Y.; Liu, Y.; Su, J.; Lin, X.H. The effects of photosynthetic characters and water use efficiency under drought stress in sugarcane materials. Sugarcane Canesugar 2013, 1, 14–18. [Google Scholar]
  61. Khalil, F.; Xiao, N.; Tayyab, M.; Chen, P. Screening of EMS-induced drought-tolerant sugarcane mutants employing physiological, molecular and enzymatic approaches. Agronomy 2018, 8, 226. [Google Scholar] [CrossRef]
  62. Oxborough, K.; Baker, N.R. Resolving chlorophyll a fluorescence images of photosynthetic efficiency into photochemical and non-photochemical components-calculation of qP and Fv/Fm without measuring Fo′. Photosynth. Res. 1997, 54, 135–142. [Google Scholar] [CrossRef]
  63. Kramer, D.M.; Johnson, G.; Kiirats, O.; Edwards, G.E. New fluorescence parameters for the determination of QA redox state and excitation energy fluxes. Photosynth. Res. 2004, 79, 209–218. [Google Scholar] [CrossRef]
  64. An, D.S. Chlorophyll Fluorescence Based Water Stress Diagnosis for Cut Lilium Grown in Greenhouse; Nanjing Agriculture University: Nanjing, China, 2011. [Google Scholar]
  65. Zhang, M.Q.; Lv, J.L.; Chen, R.K. Diurnal variation of photosynthetic rate in sugarcane and its responses to light and temperature. J. Fujian Agric. Univ. 1998, 27, 398–401. [Google Scholar]
  66. Wahid, A. Physiological implications of metabolite biosynthesis for net assimilation and heat-stress tolerance of sugarcane (Saccharum officinarum) sprouts. J. Plant Res. 2007, 120, 219–228. [Google Scholar] [CrossRef] [PubMed]
  67. Sales, C.R.G.; Ribeiro, R.V.; Silveira, J.A.G.; Machado, E.C.; Martins, M.O.; Lagôa, A.M.M.A. Superoxide dismutase and ascorbate peroxidase improve the recovery of photosynthesis in sugarcane plants subjected to water deficit and low substrate temperature. Plant Physiol. Biochem. 2013, 73, 326–336. [Google Scholar] [CrossRef] [PubMed]
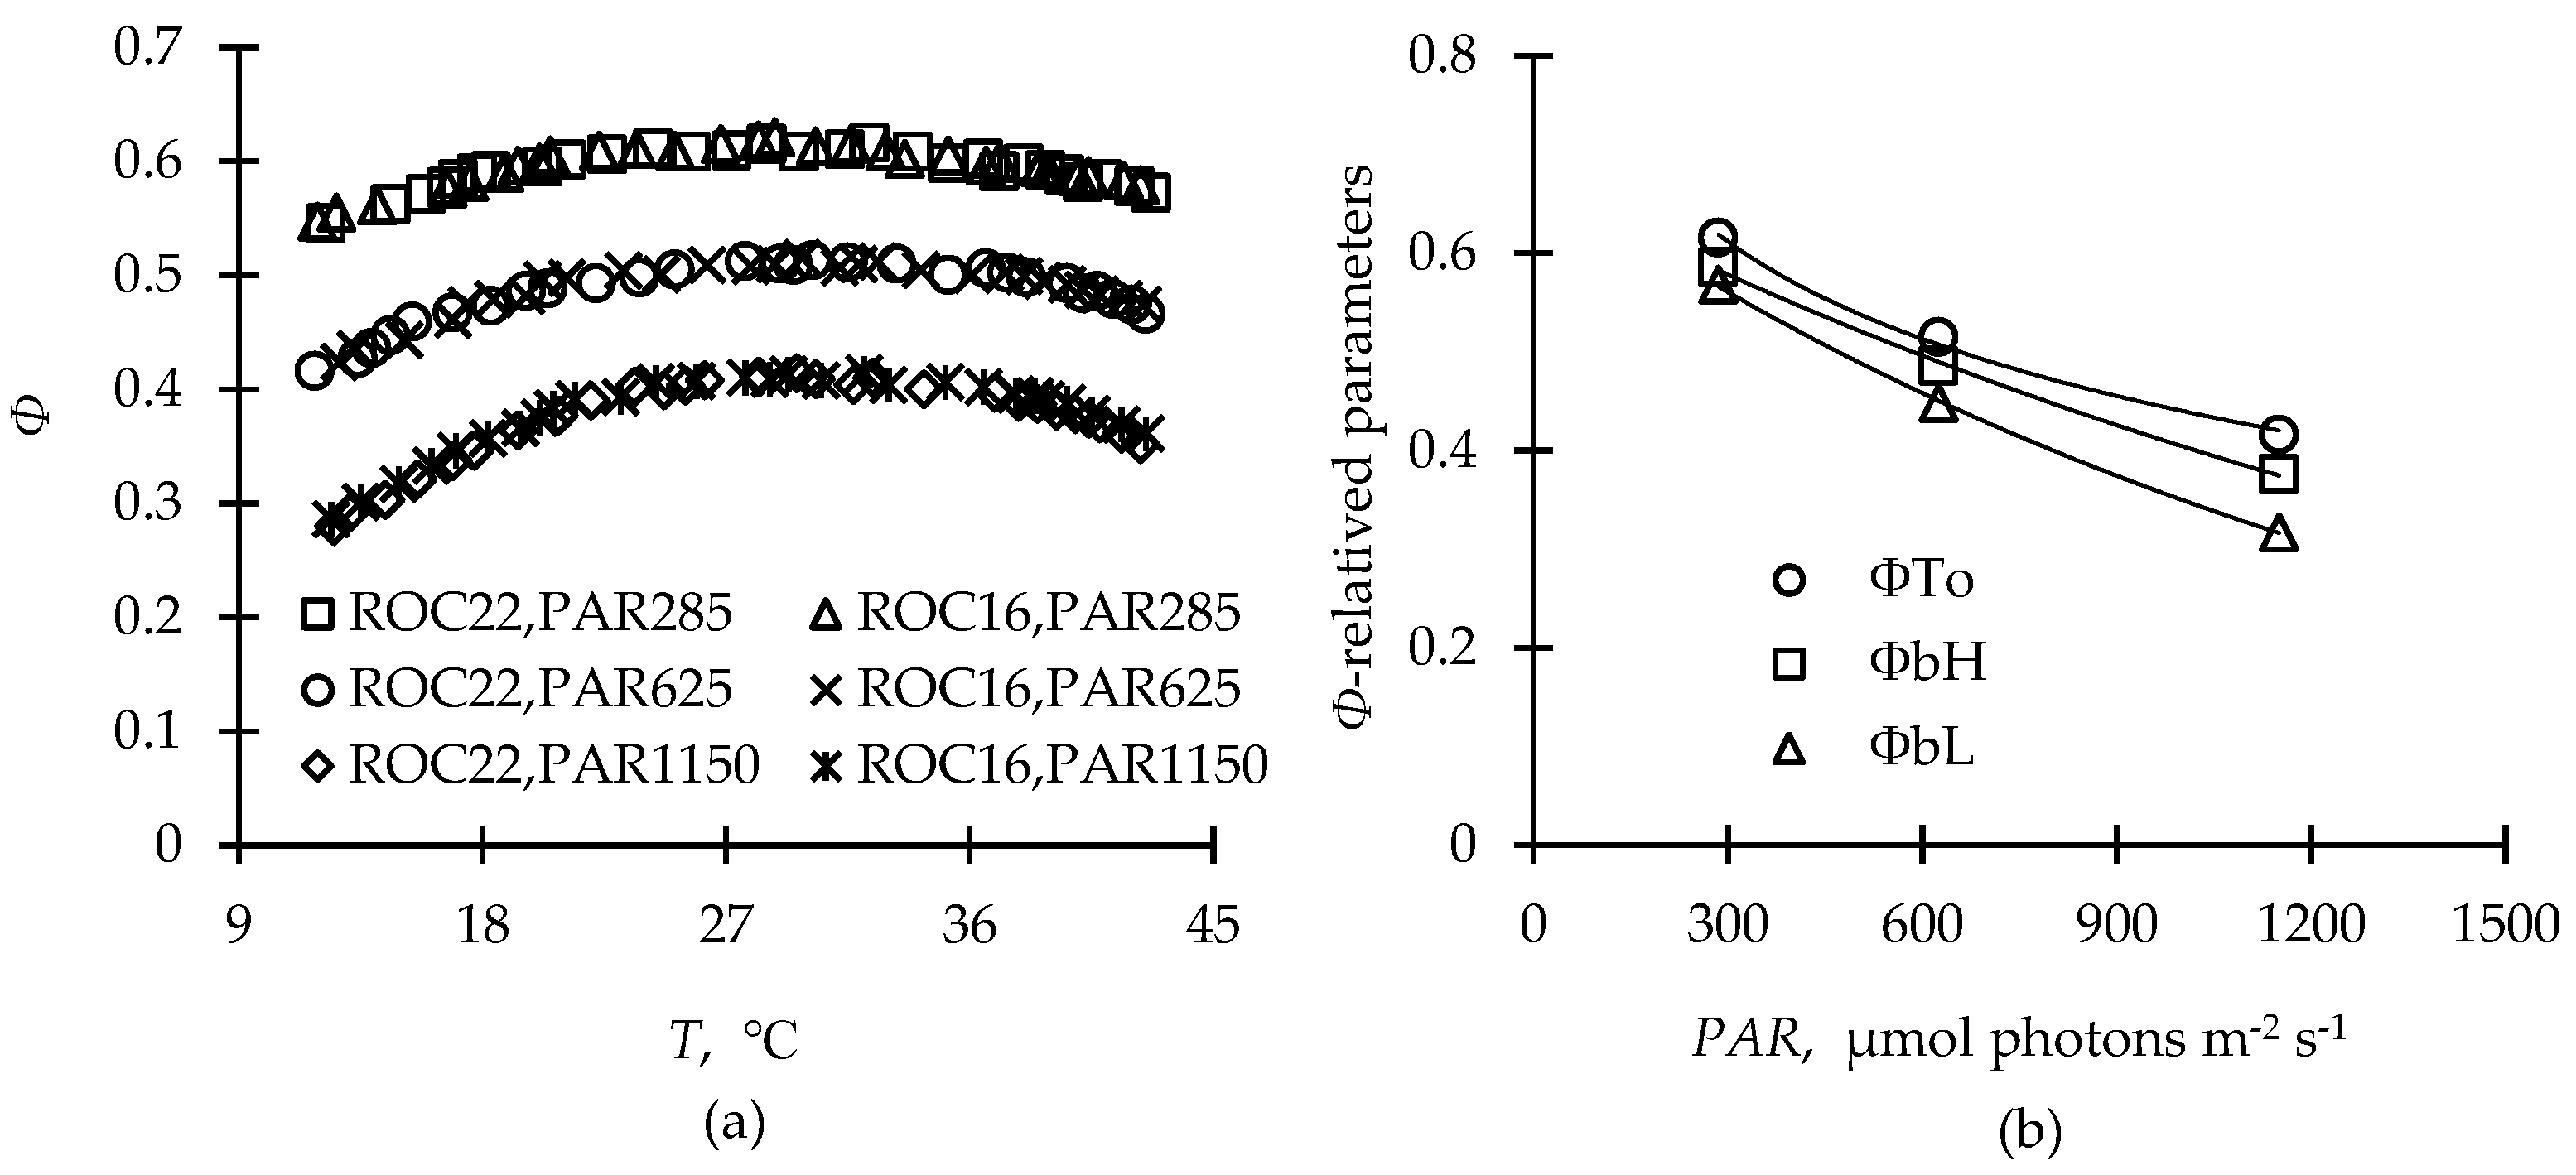
Figure 1. Response curves of photosynthetic quantum efficiency (Φ) to temperature (T) (a) and fitted curves of optimum Φ (ΦTo) and basic quantum efficiency at low or high temperature (ΦbL or ΦbH) to photosynthetically active radiation (PAR) (b).
Plants 12 01042 g001
Figure 2. Response ofthe drought-stress index (ΕD) to the relative soil water content (rSWC), (a) and rSWC after drought treatment of the two sugarcane cultivars (b).
Plants 12 01042 g002
Figure 3. Excitation light-energy distribution in the two tested cultivars at 1, 3, 5, 7, and 9 days after drought treatment. (ae) The photosynthetic quantum efficiency (Φ) and nonphotochemical quenching (NPQ) varied with PAR for two tested cultivars after withholding water ((be) share the same legend as (a)). (f) Average value of the yield for other energy losses (ΦNO) under different PAR vaired with the aggravation of drought stress for two tested cultivars.
Plants 12 01042 g003
Figure 4. Comparisons between the measured photosynthetic quantum efficiency (Φ) and the predicted Φ of the two cultivars under different photothermal (a) and drought conditions (b).
Plants 12 01042 g004
Table 1. List of parameters and empirical coefficients with definitions, units, and values (standard error shown in brackets) determined in this study.
Parameters DefinitionUnitValue
aL, bLEmpirical coefficient describing the change of ΦbL with PAR0.688, 6.77 × 10⁻⁴ for both cultivars
aH, bHEmpirical coefficient describing the change of ΦbH with PAR0.676, 5.16 × 10⁻⁴ for both cultivars
c, dEmpirical coefficient describing the change of ΕD with rSWC when rSWC was below rSWCc39.63, 10.01 for ROC22
286.78, 21.53 for ROC16
Fv/FmMaximum quantum efficiency of PSII photochemistry0.769 for both cultivars without water deficit
NPQNonphotochemical quenching
PARPhotosynthetically active radiation μmol photons m−2 s−1
rSWCRelative substrate water content calculated from VWC/VWCs%
rSWCcCritical value of rSWC%40 for ROC22
29 for ROC16
TTemperature°C
TminMinimum temperature for sugarcane photosynthesis and growth°C15
ToOptimum temperature for sugarcane photosynthesis and growth°C30
TmaxMaximum temperature for sugarcane photosynthesis and growth°C40
VWCVolumetric water content of substrate%
VWCsSaturated VWC%38 (0.66) for Exp1~3
38.3 (1.11) for Exp4~5
ΕThe amplitude decrease in ΦTo with increasing PAR5.91 × 10−4 for both cultivars
ΕDΕ varied with rSWC to describe the drought-stress degree
ΦPhotosynthetic quantum efficiencymol e−1 (mol photon)−1
ΦbLBasic Φ under low temperature, varied with PARmol e−1 (mol photon)−1
ΦbHBasic Φ under high temperature, varied with PARmol e−1 (mol photon)−1
ΦToOptimum Φ under To, varied with PARmol e−1 (mol photon)−1
ΦNOYield for other energy losses (indicate non-regulated energy dissipation)mol e−1 (mol photon)−1
Table 2. Detailed information on the experimental conditions and physicochemical properties of the substrate.
Exp1 aM, bVExp2 aM, bVExp3 aM, bVExp4 aV, bVExp5 aV, bM
Experimental and Environmental Conditions
Photothermal ExperimentStart date9 April 202011 July 202030 November 202020 May 202123 October 2021
Finish date11 April 202013 July 20202 December 202022 May 202125 October 2021
Average daily high temp (°C) 24.3 ± 236.2 ± 1.321.7 ± 1.835.2 ± 1.723.3 ± 4
Average daily low temp (°C) 19.4 ± 1.428.6 ± 0.211.4 ± 3.327.5 ± 0.116.7 ± 1.1
Average daily PARave (μmol photons m−2 s−1) 233 ± 129575 ± 61364 ± 27523 ± 139314.6 ± 165
Average daily PARmax (μmol photons m−2 s−1) 1477 ± 6232119 ± 661573 ± 2312085 ± 2531474 ± 647
Drought ExperimentStart date13 April 202014 July 20203 December 202023 May 202126 October 2021
Finish date22 April 202020 July 202014 December 20202 June 20214 November 2021
Average daily high temp (°C) 26.6 ± 2.535.3 ± 1.223 ± 1.334.8 ± 1.228.2 ± 0.8
Average daily low temp (°C) 20 ± 4.727.1 ± 115.3 ± 2.826.9 ± 1.121.4 ± 2.1
Average daily PARave (μmol photons m−2·s−1) 341 ± 124535 ± 60262 ± 93498 ± 74321 ± 81
Average daily PARmax (μmol photons m−2 s−1) 1896 ± 3882313 ± 1381441 ± 3222412 ± 2082012 ± 311
Physicochemical Properties of the Substrate
Bulk density (g·cm−3)1.19 1.19 1.19 1.21 1.21
Saturated volumetric water content (%)38383838.338.3
Organic C (g·kg−1)17.51 17.51 17.51 19.22 19.22
Avaliable N (mg·kg−1)36.34 36.34 36.34 33.88 33.88
Avaliable P (mg·kg−1)15.62 15.62 15.62 12.96 12.96
Avaliable K (mg·kg−1)44.70 44.70 44.70 46.16 46.16
pH4.82 4.82 4.82 5.07 5.07
Note: a and b denote photothermal and drought experiments, while M and V denote experimental data used for modeling and validation, respectively. Temperature and PAR data were selected from the daily data set recorded with a farm land environment monitoring system (CR1000).
Disclaimer/Publisher’s Note: The statements, opinions and data contained in all publications are solely those of the individual author(s) and contributor(s) and not of MDPI and/or the editor(s). MDPI and/or the editor(s) disclaim responsibility for any injury to people or property resulting from any ideas, methods, instructions or products referred to in the content.