Article

Plastomes of Garcinia mangostana L. and Comparative Analysis with Other Garcinia Species

1
Institute of Systems Biology, Universiti Kebangsaan Malaysia, Bangi 43600, Selangor, Malaysia
2
Biotechnology Research Institute, Universiti Malaysia Sabah, Kota Kinabalu 88400, Sabah, Malaysia
3
Department of Informatics, National Institute of Genetics, Mishima 411-8540, Shizuoka, Japan
*
Author to whom correspondence should be addressed.
Plants 2023, 12(4), 930; https://doi.org/10.3390/plants12040930
Submission received: 13 October 2022 / Revised: 14 February 2023 / Accepted: 14 February 2023 / Published: 17 February 2023
(This article belongs to the Section Plant Molecular Biology)

Abstract

:
The two varieties of mangosteen (Garcinia mangostana L.) cultivated in Malaysia are known as Manggis and Mesta. The latter is preferred for its flavor, texture, and seedlessness. Here, we report a complete plastome (156,580 bp) of the Mesta variety that was obtained through a hybrid assembly approach using PacBio and Illumina sequencing reads. It encompasses a large single-copy (LSC) region (85,383 bp) and a small single-copy (SSC) region (17,137 bp) that are separated by 27,230 bp of inverted repeat (IR) regions at both ends. The plastome comprises 128 genes, namely, 83 protein-coding genes, 37 tRNA genes, and 8 rRNA genes. The plastome of the Manggis variety (156,582 bp) obtained from reference-guided assembly of Illumina reads was found to be nearly identical to Mesta except for two indels and the presence of a single-nucleotide polymorphism (SNP). Comparative analyses with other publicly available Garcinia plastomes, including G. anomala, G. gummi-gutta, G. mangostana var. Thailand, G. oblongifolia, G. paucinervis, and G. pedunculata, found that the gene content, gene order, and gene orientation were highly conserved among the Garcinia species. Phylogenomic analysis divided the six Garcinia plastomes into three groups, with the Mesta and Manggis varieties clustered closer to G. anomala, G. gummi-gutta, and G. oblongifolia, while the Thailand variety clustered with G. pedunculata in another group. These findings serve as future references for the identification of species or varieties and facilitate phylogenomic analysis of lineages from the Garcinia genus to better understand their evolutionary history.

1. Introduction

Mangosteen (Garcinia mangostana L.) is well known as the ‘queen of fruits’ and it is priced for its unique taste and valuable natural compounds. Xanthones, which are abundantly found in the ripe fruit pericarp, have been shown to possess antioxidant, anti-cancer, anti-inflammatory, anti-bacterial, and anti-viral properties [1]. Mangosteen is mainly found in Southeast Asia, particularly in Malaysia, Indonesia, and Thailand [2]. The geographical origin of G. mangostana is still under debate. Unlike other flowering plants, G. mangostana reproduces apomictically by adventitious embryony in the mother plant without fertilization [3] and produces Garcinia-type recalcitrant seeds without embryo [4]. Morphological and phylogenetic analyses have been performed to examine the parental origin of G. mangostana and its relationship with other Garcinia species on the basis of internal transcribed spacer (ITS) [5,6,7], granule-bound starch synthase (GBSSI) [7], trnS-trnG, and combination of trnS-trnG with trnD-trnT [8]. They showed that G. mangostana was closely related to G. malaccensis, and as such, were postulated to have been derived from the hybridization of G. hombroniana and G. malaccensis [9]. However, as there was only one mangosteen sample (G. mangostana TH3) that showed heterozygosity in the ITS sequence, Nazre proposed G. mangostana and G. malaccensis to be grouped as one species but different varieties [10]. Mangosteen was suggested to have originated either from the hybrid of different varieties of G. malaccensis or the product of agricultural selective breeding retaining only superior female plants of G. malaccensis [10].
Nonetheless, several reports showed that molecular markers from the nuclear genome could not provide sufficient information for phylogeny demarcation [11]. This is likely due to recombination events in the plant nuclear genome during reproduction [12]. In contrast, the majority of the plastome is inherited maternally. Hence, a plastome with a slower rate of evolution provides a better resolution in examining species phylogenetic relationships, adaptive evolution, and divergence dating [13,14]. Recently, with the advancement of next-generation sequencing and long-read sequencing technology, complete plastomes have been able to be obtained easily at low costs. A complete plastome of G. mangostana of an unspecified variety that originated from Thailand was first reported in 2017 with the accession number KX822787 [15] (herein, denoted as the Thailand variety) and was shown to be closely related to G. pedunculata [15]. In Malaysia, two varieties of G. mangostana (Manggis and Mesta) were sequenced and deposited to GenBank [16,17,18]. The mitogenome of the Mesta variety was reported recently [19]. However, a complete analysis of the plastomes from these two varieties is yet to be reported.
In this study, we assembled and analyzed the complete mangosteen plastomes of Manggis and Mesta. Furthermore, we performed a comprehensive comparison of all available Garcinia plastomes from GenBank and provided an update to a previous comparative analysis [20]. The current comparative study elucidates the structural differences in plastomes for evolutionary inference of the Garcinia genus.

2. Results

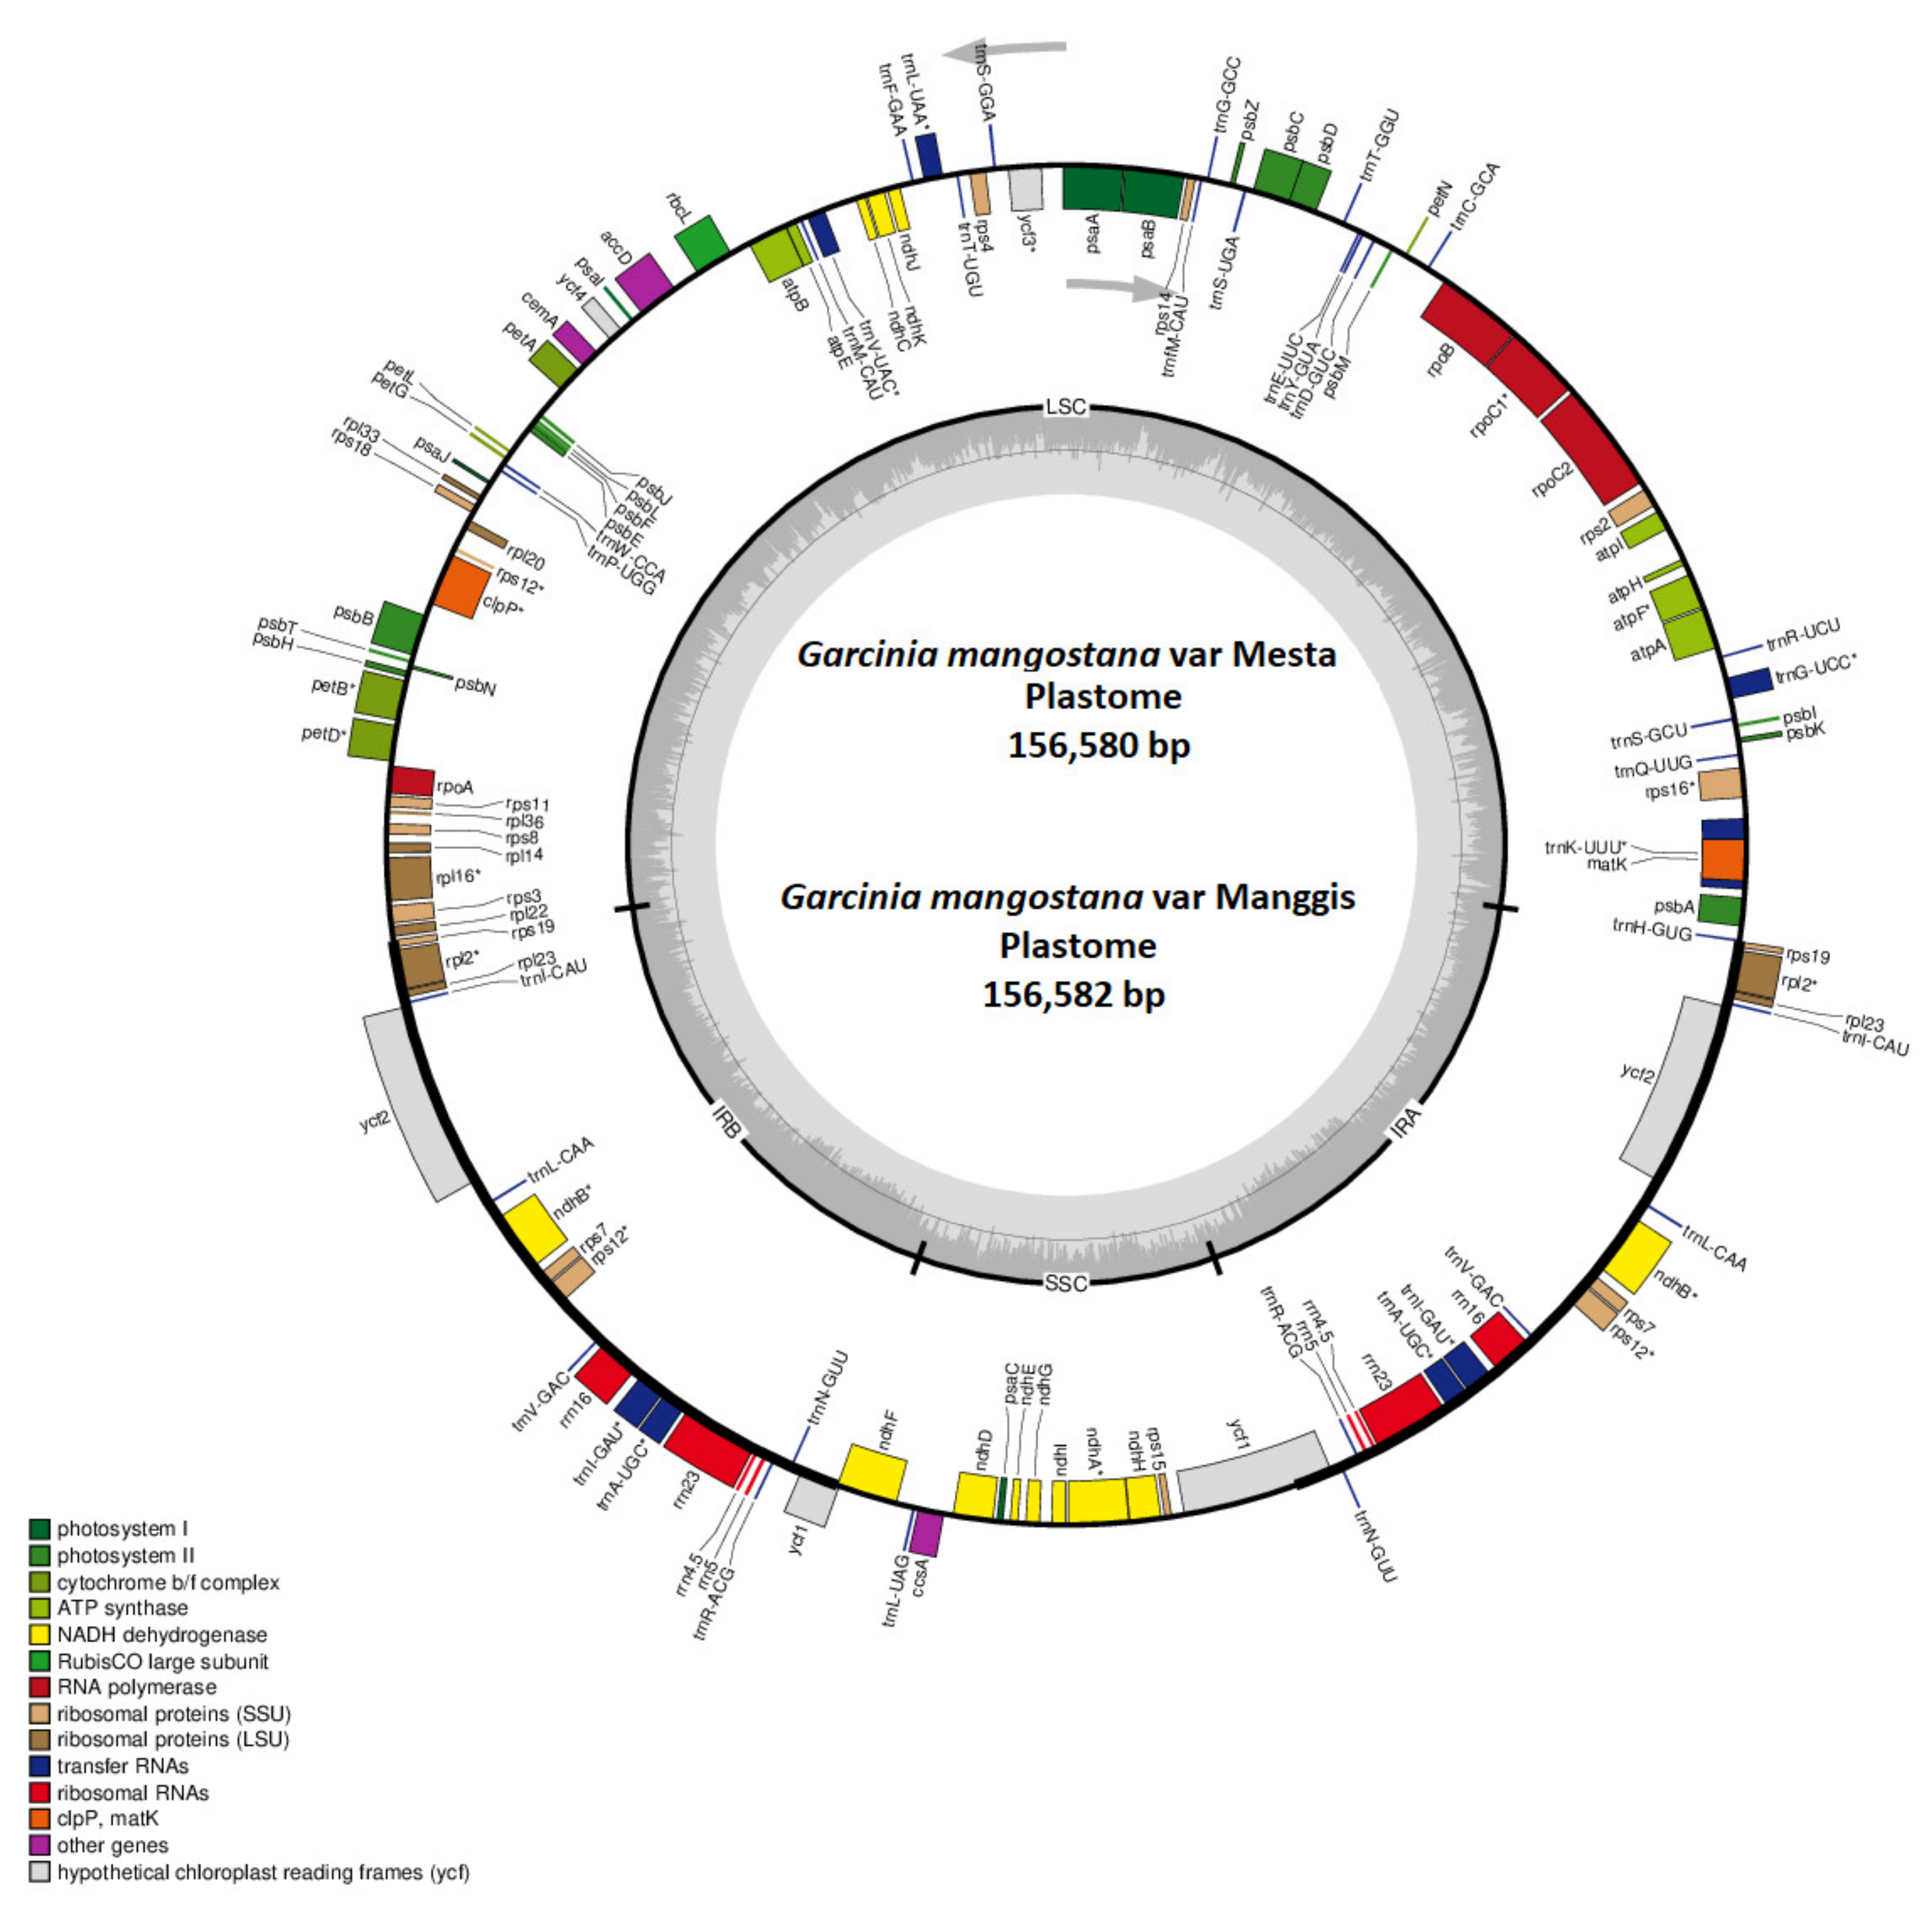
2.1. Characterization of the Mesta Plastome

De novo assembly of PacBio subreads data using the CANU assembler and error-correction with Illumina data using the Pilon program produced a total of 7616 contigs with an N50 genome length of 10,212 bp (Table S1). There was one contig (tig00037541_pilon) with the size of ≈165 kb that showed high similarity with the reference plastome in BLAT analysis. It was a circular contig, as indicated by the dot plot analysis using Gepard [21] (Figure S1). One of the identical overlapping ends (≈9.3 kb) was trimmed, and 18 bases were manually added on the basis of Illumina read correction to obtain the final Mesta plastome size of 156,580 bp. The average coverages of the Mesta plastome with PacBio subreads and Illumina clean reads were 265× and 3751×, respectively (Figure S2, Table S2).
The Mesta plastome constituted a typical conserved quadripartite structure with two inverted repeat (IR) regions (each 27,030 bp) separating the large single-copy (LSC) region (85,383 bp) from the small single-copy (SSC) region (17,137 bp) (Figure 1). The average GC content of the plastome was 36.2%, while the GC contents in LSC, SSC, and IR regions were 33.6%, 30.2%, and 42.2%, respectively. A total of 128 genes were identified, including 77 unique protein-coding genes with six duplicated genes in IR, 30 unique tRNAs (seven duplicated genes in IR), and 4 rRNAs (four duplicated genes in IR) (Table 1 and Table 2).

2.2. Manggis Plastome Assembly

The Manggis Illumina clean reads had a higher mapping rate to the Mesta plastome than the Thailand variety (Figure S3, Table S3). Hence, the Mesta plastome was used for a reference-guided genome assembly of the Manggis plastome. The complete plastome of Manggis had a genome size of 156,582 bp (Table 1) after manual curation with the same genome features as observed in the Mesta plastome (Figure 1), except for one single-nucleotide polymorphism (SNP) and two indels (Figure S4, Table S4). The average coverage of the Manggis plastome with the Illumina short reads was 2636× (Table S3).

2.3. Plastome Feature Comparison

In comparison with the plastomes of other Garcinia species, the plastome sizes of both Mesta and Manggis varieties (156,580 bp and 156,582 bp, respectively) were larger than G. gummi-gutta (156,202 bp) and G. oblongifolia (156,577 bp), but smaller than G. anomala (156,774 bp), G. pedunculata (157,688 bp), G. paucinervis (157,702 bp), and the Thailand variety (158,179 bp) (Table 1).
Gene infA was found in GenBank for G. pedunculata (NC_048983) and G. anomala (MW582313), while the gene rpl32 was found for G. pedunculata (NC_048983). However, both genes were not annotated accurately. Multiple sequence alignment of the infA and rpl32 genes (Figure S5) with other species showed that both annotated sequences did not have a conserved region as compared with other species. Hence, these genes were re-annotated and revised for accuracy prior to subsequent comparative analysis.
The number of protein-coding genes (83 CDS) was the same for all the Garcinia species. However, the gene trnH-GUG was not found in G. gummi-gutta. Hence, the total number of genes for G. gummi-gutta was 127 compared to 128 genes for other Garcinia species (Table 1). The overall GC content (36.1–36.2%) and GC content found in LSC (33.5–33.6%), SSC (30.1–30.3%), and IR (42.1–42.2%) were similar among the Garcinia species.
In the plastomes of six Garcinia species (including G. mangostana var. Manggis, Mesta, and Thailand) used in this comparative analysis, there were a total of 18 single-copy non-redundant plastid genes (rps16, atpF, rpoC1, ycf3, rps12, clpP, petB, petD, rpl16, rpl2, ndhB, ndhA, trnK-UUU, trnG-UCC, trnL-UAA, trnV-UAC, trnI-GAU, and trnA-UGC) containing at least one intron with two introns in clpP and rps12 (Table S5), which is similar to those generally found in other plants [22]. Gene clpP was located in the LSC region. Meanwhile, the 5′ exon of the rps12 gene was in the LSC region, while the 3′ exon was located in the IR regions, which is commonly observed in plastomes of other species such as Rhodomyrtus tomentosa, Salvia spp. [23,24], Ananas comosus var. comosus [22], and ferns [25]. Among the genes, trnK-UUU had the longest intron length, which agrees with previous studies [26,27,28].

2.4. Codon Usage and Amino Acid Frequency

The total numbers of codon usage in 83 protein-coding genes found in the plastomes was different among the Garcinia species, ranging from 26,195 in G. pedunculata, 26,216 in Thailand variety, 26,244 in G. paucinervies, 26,249 in G. anomala, 26,257 in both Manggis and Mesta varieties, 26,265 in G. gummi-gutta, to 26,268 in G. oblongifolia (refer to ‘total number of codon usage’ in Table S6). There were several common findings in the codon usage analysis of Garcinia plastomes: (1) a total of 20 translated amino acids; (2) the most frequent amino acid was leucine, while the least frequent was cysteine (Figure S6); (3) there were 30 types of codon out of 64 codons with relative synonymous codon usage (RSCU) values >1.0 (ending with either A or U, except for UUG) and 32 types of codons with RSCU < 1.0 (ending with either C or G, except for AUA, CUA, and UGA); (4) both AUG and UGG had RSCU values = 1 (Table S6). Similar findings were also detected in other plants, such as Euphorbiaceae and Rhodomyrtus tomentosa [24,29].
Generally, the start codon is ATG, but there were exceptions for several genes with initiation codons of GTG or ACG due to the RNA editing events during transcription. The first discovery of such an event came from the study of the rpl2 gene in the maize plastome when the start codon of this gene changed from ACG to ATG during transcription [30]. Other examples include GTG as an initiation codon of the psbC gene [31] and ACG for the ndhD gene [32] in the tobacco plastome, as well as start codons ACG and GTG for rpl2 and rps19 genes, respectively, in the Oryza sativa plastome [33]. Similarly, there were three genes (rpl33, rps19, and ndhD) in the plastomes of Garcinia species that did not start with ATG. The start codon was GTG for both rpl33 and rps19 genes in all the Garcinia species, except for rps19 in G. anomala, which started with an ATG. As for ndhD, ATG was found in G. anomala, while TTG was found in G. pedunculata, and ACG was found for all the other Garcinia species.

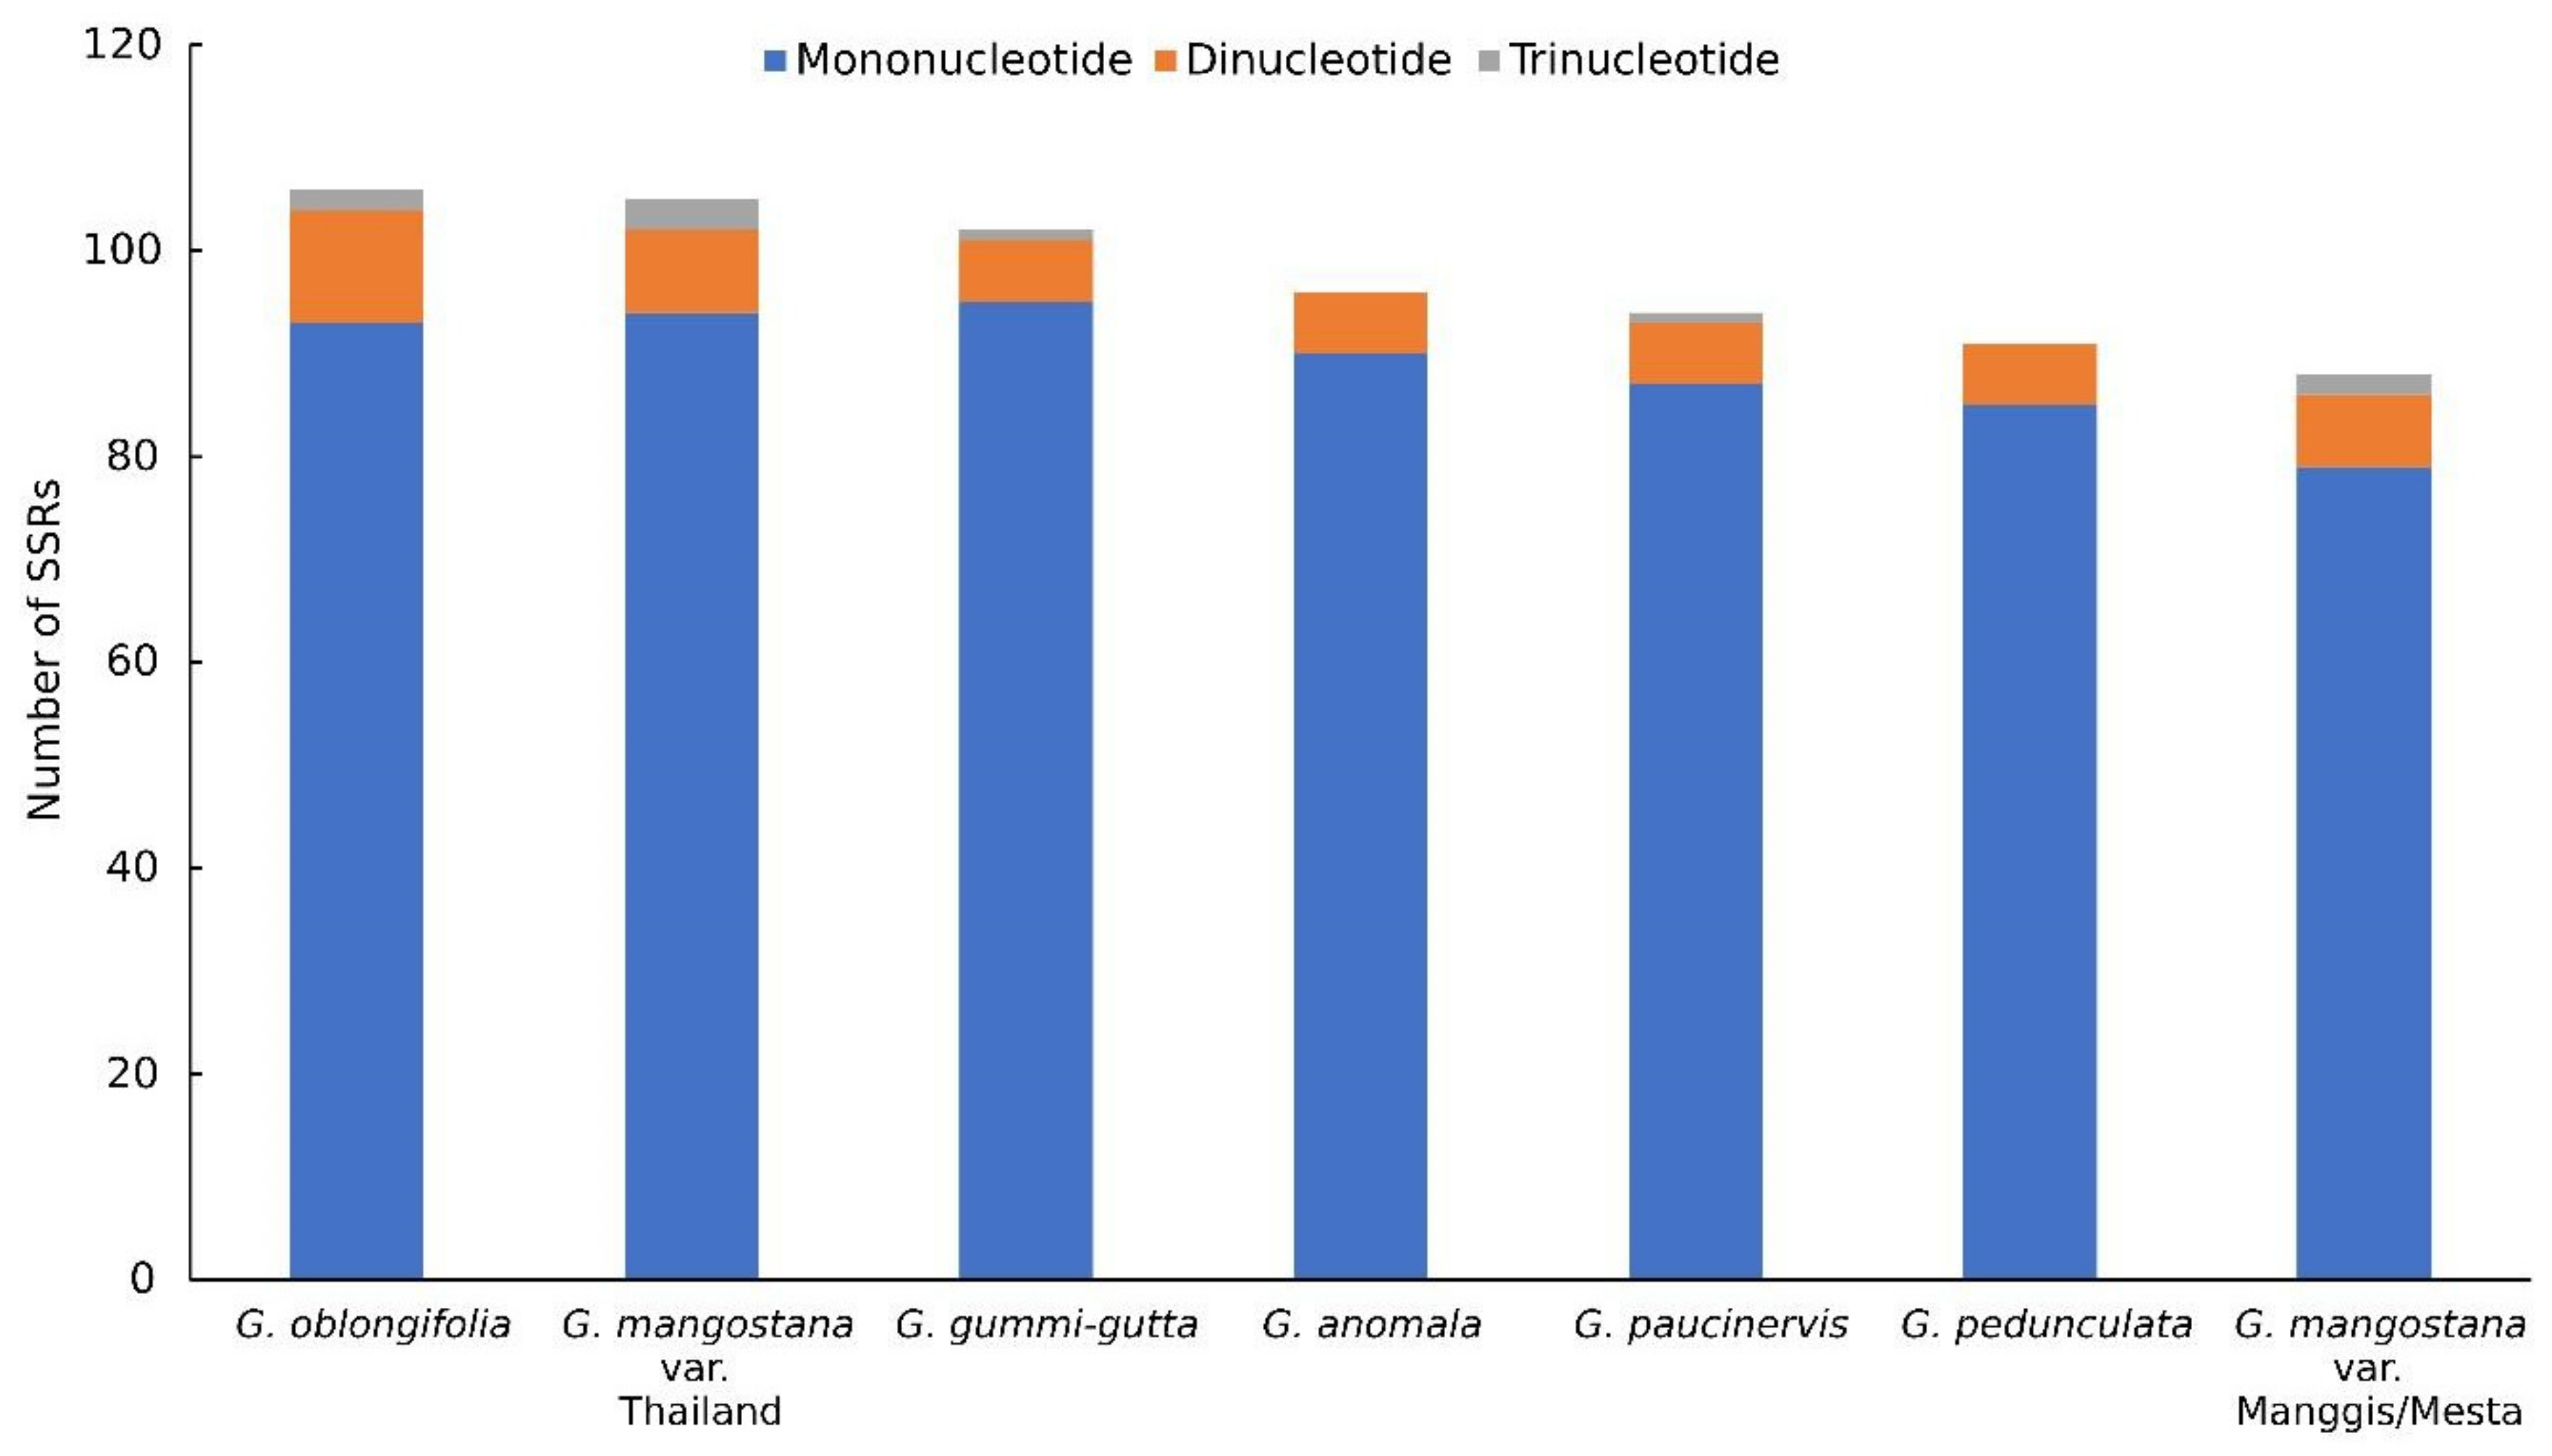
2.5. Simple Sequence Repeat (SSR) Analysis

A total of 88 SSRs were identified, including 79 mononucleotide repeats, 7 dinucleotide repeats, and 2 trinucleotide repeats with a total sequence size of 1065 bp and 1067 bp for Mesta and Manggis varieties, respectively. The SSRs identified in the plastomes of both Mesta and Manggis were nearly the same, except Manggis had additional mononucleotides, A (SSR (A)14 and (A)15 at no. 3) and C (SSR (C)12(A)12 and (C)13(A)12 at no. 25), as per Tables S7 and S8, respectively, for Mesta and Manggis. There were 14 compound SSRs in both Mesta and Manggis. The most abundant motif found in both Mesta and Manggis varieties was mononucleotide repeats (89.8%), in which mononucleotide T (48.9%) and A (38.6%) constituted the highest portion compared to mononucleotide C (1.1%) and G (1.1%). Among them, only 10 of the mononucleotide repeats were located at the coding regions of rpoC2, rpoC1, rpoB, rps19, ycf2, and ycf1 genes. All dinucleotide and trinucleotide repeats were located at the non-coding regions, which are common phenomena in flowering plants [34]. All the SSRs in the plastomes of Mesta and Manggis varieties including their respective locations are listed in Tables S7 and S8, respectively.
The total number of SSR varied among the different Garcinia species (Figure 2). Mesta and Manggis varieties had the lowest number of total SSR (88) compared to G. oblongifolia (106), Thailand variety (105), G. gummi-gutta (102), G. anomala (96), G. paucinervis (94), and G. pedunculata (91). Mononucleotide repeats constituted the highest percentage in SSR analysis in this study, agreeing with the previous studies of plastomes from 164 lower and higher plants [34]. The highest dinucleotide repeat was found in G. oblongifolia (11), followed by the Thailand variety (8) and Mesta/Manggis varieties (7), while the other Garcinia species showed six dinucleotide repeats. The Thailand variety had three trinucleotide repeats, being the highest among all the Garcinia species. There was only one trinucleotide repeat found in both G. gummi-gutta and G. paucinervis compared to two trinucleotide repeats found in Mesta, Manggis, and G. oblongifolia. Trinucleotide repeat was not found in G. anomala and G. pedunculata. Most of the mononucleotide SSR belonged to the A/T repeats, and the same findings were observed in the previous studies [22,24,27].

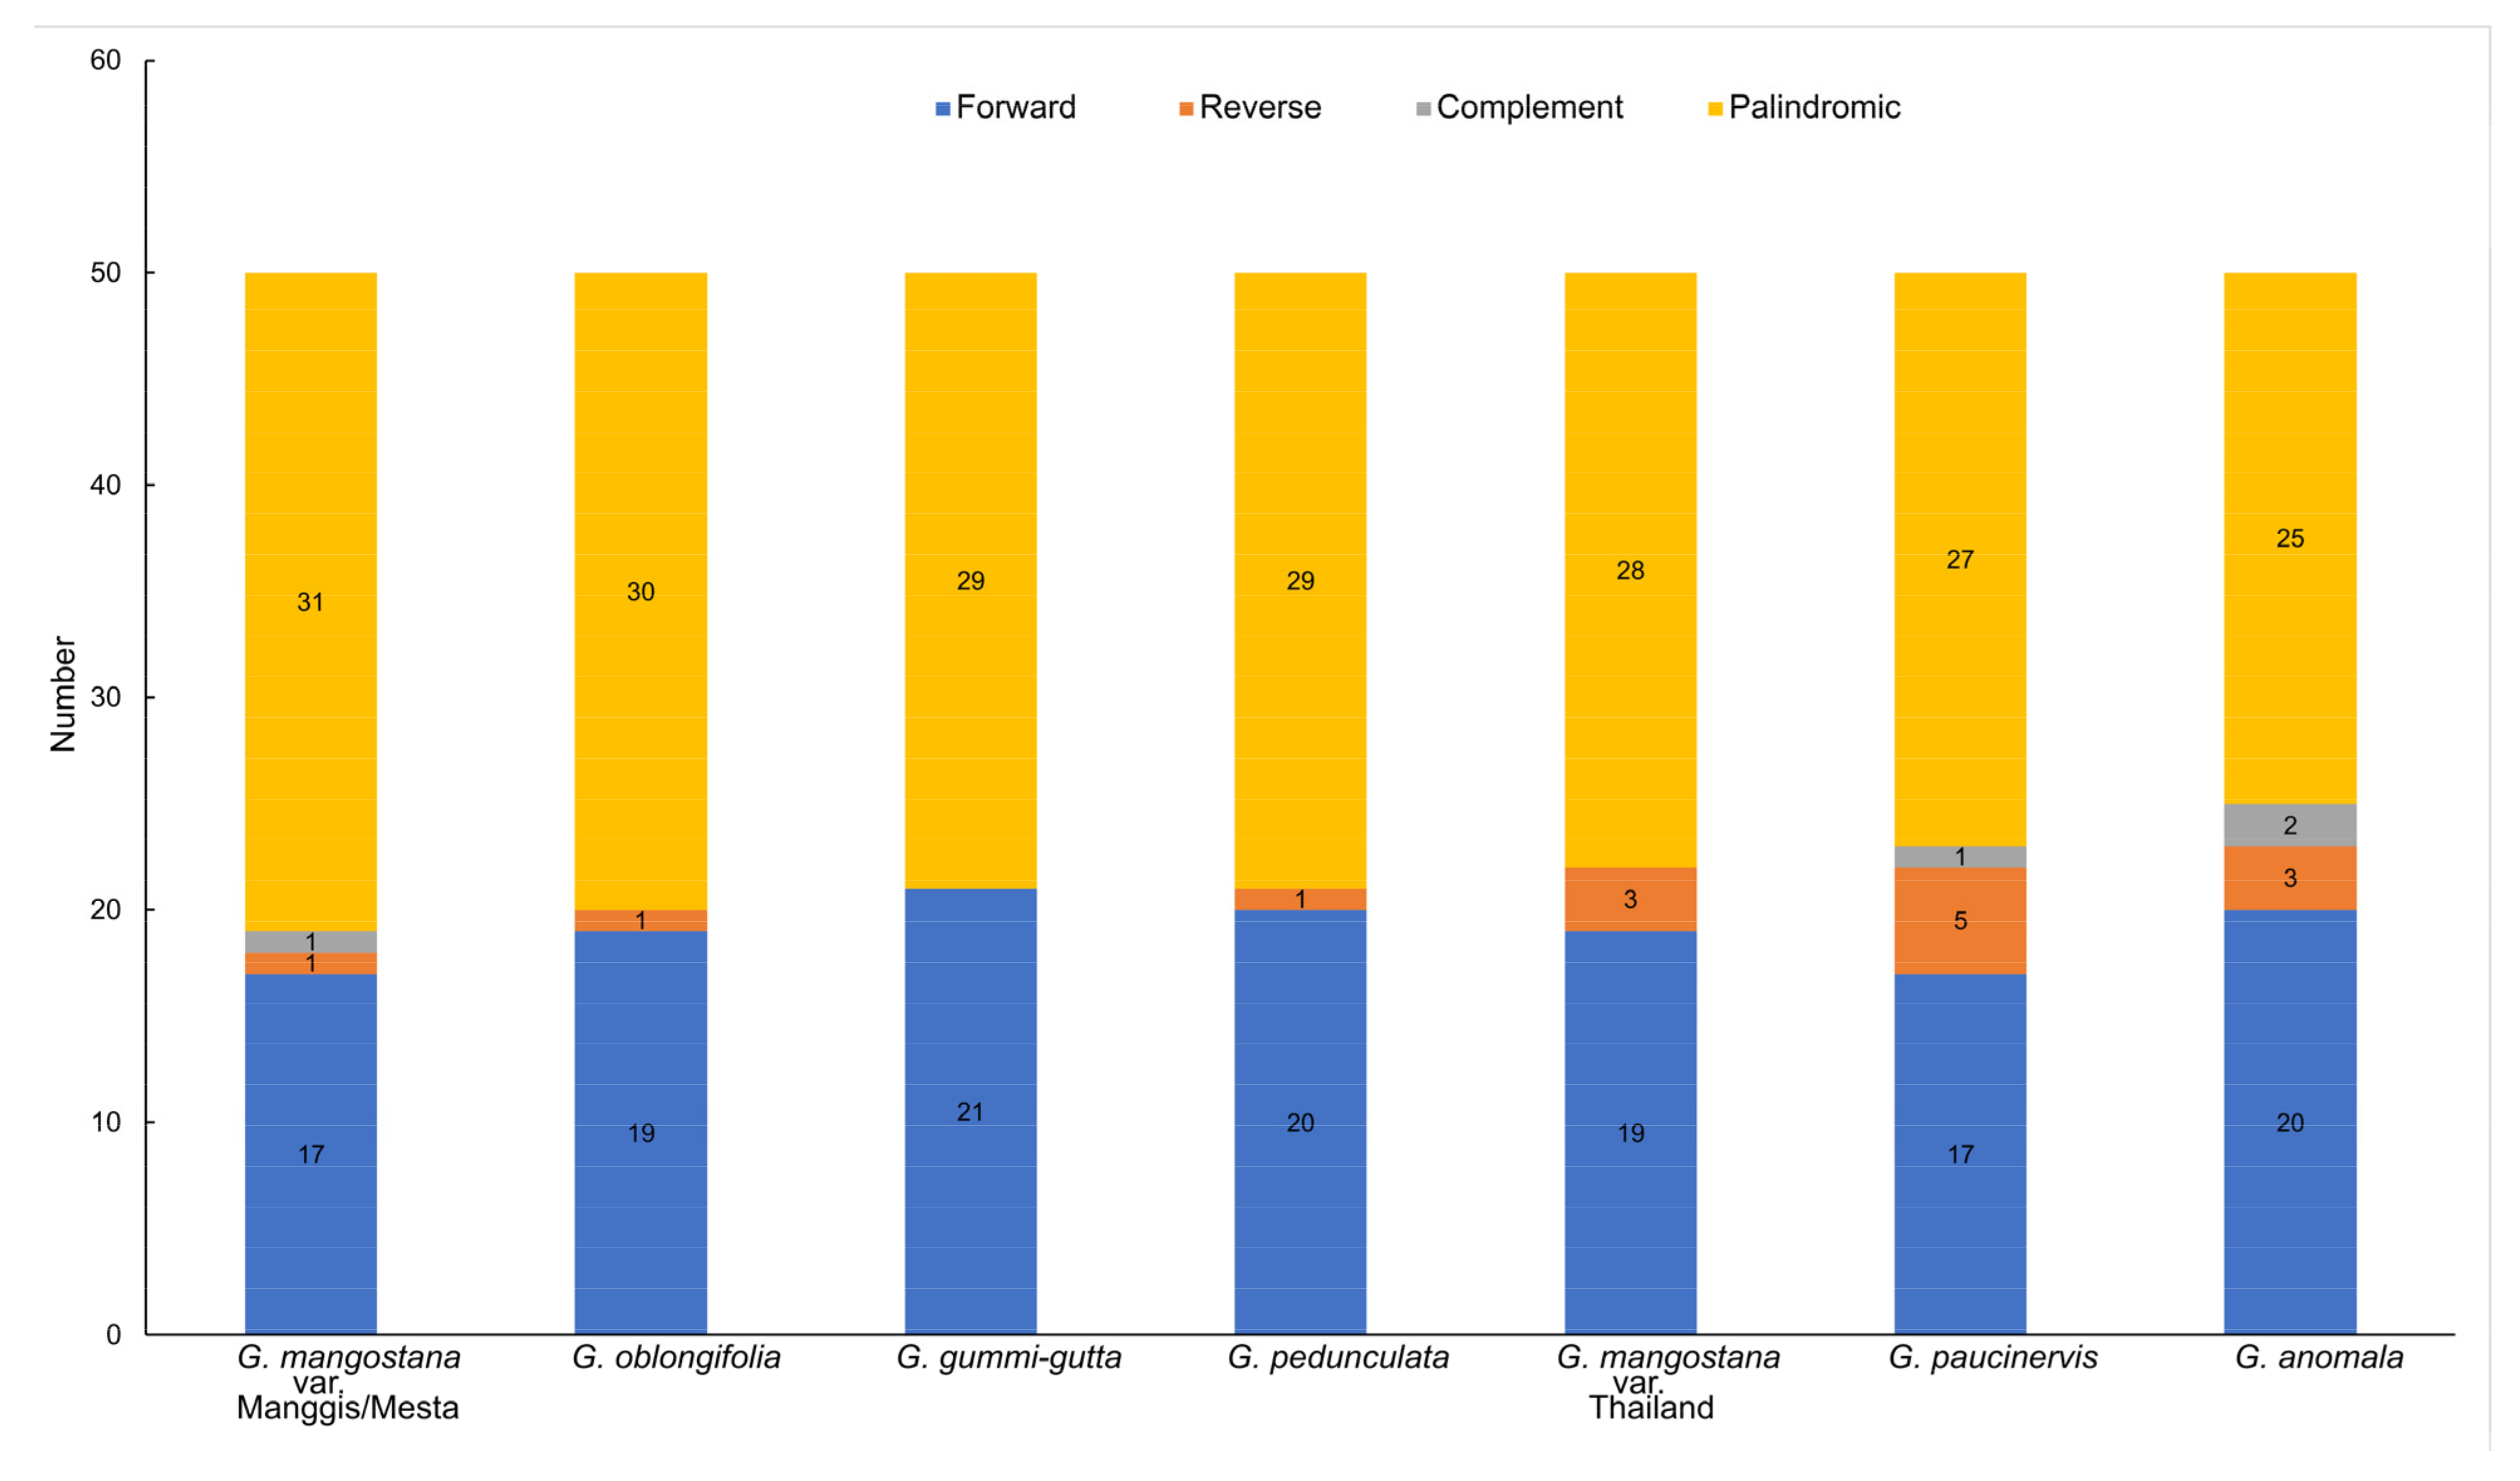
2.6. Long Repeat Analysis

By using the default setting of 50 for maximum computed repeats, different types of long repeats were detected in the plastomes of Garcinia species, including forward repeats, reverse repeats, complement repeats, and palindromic repeats (Figure 3). The palindromic repeat was the most common repeat found in Garcinia species, followed by the forward repeats, which was also observed in other plants [28]. Mesta and Manggis varieties had the highest number of palindromic repeats of 31, while G. anomala had the lowest number of palindromic repeats of 25. The reverse repeat was found in all Garcinia species, except G. gummi-gutta, which had the highest number of forward repeats (21). G. paucinervis had the highest number of reverse repeats (5), followed by three reverse repeats found in the Thailand variety and G. anomala, while the other Garcinia species only had one reverse repeat. In addition, complement repeat was only found in G. anomala (2), Mesta and Manggis varieties (1), and G. paucinervis (1).

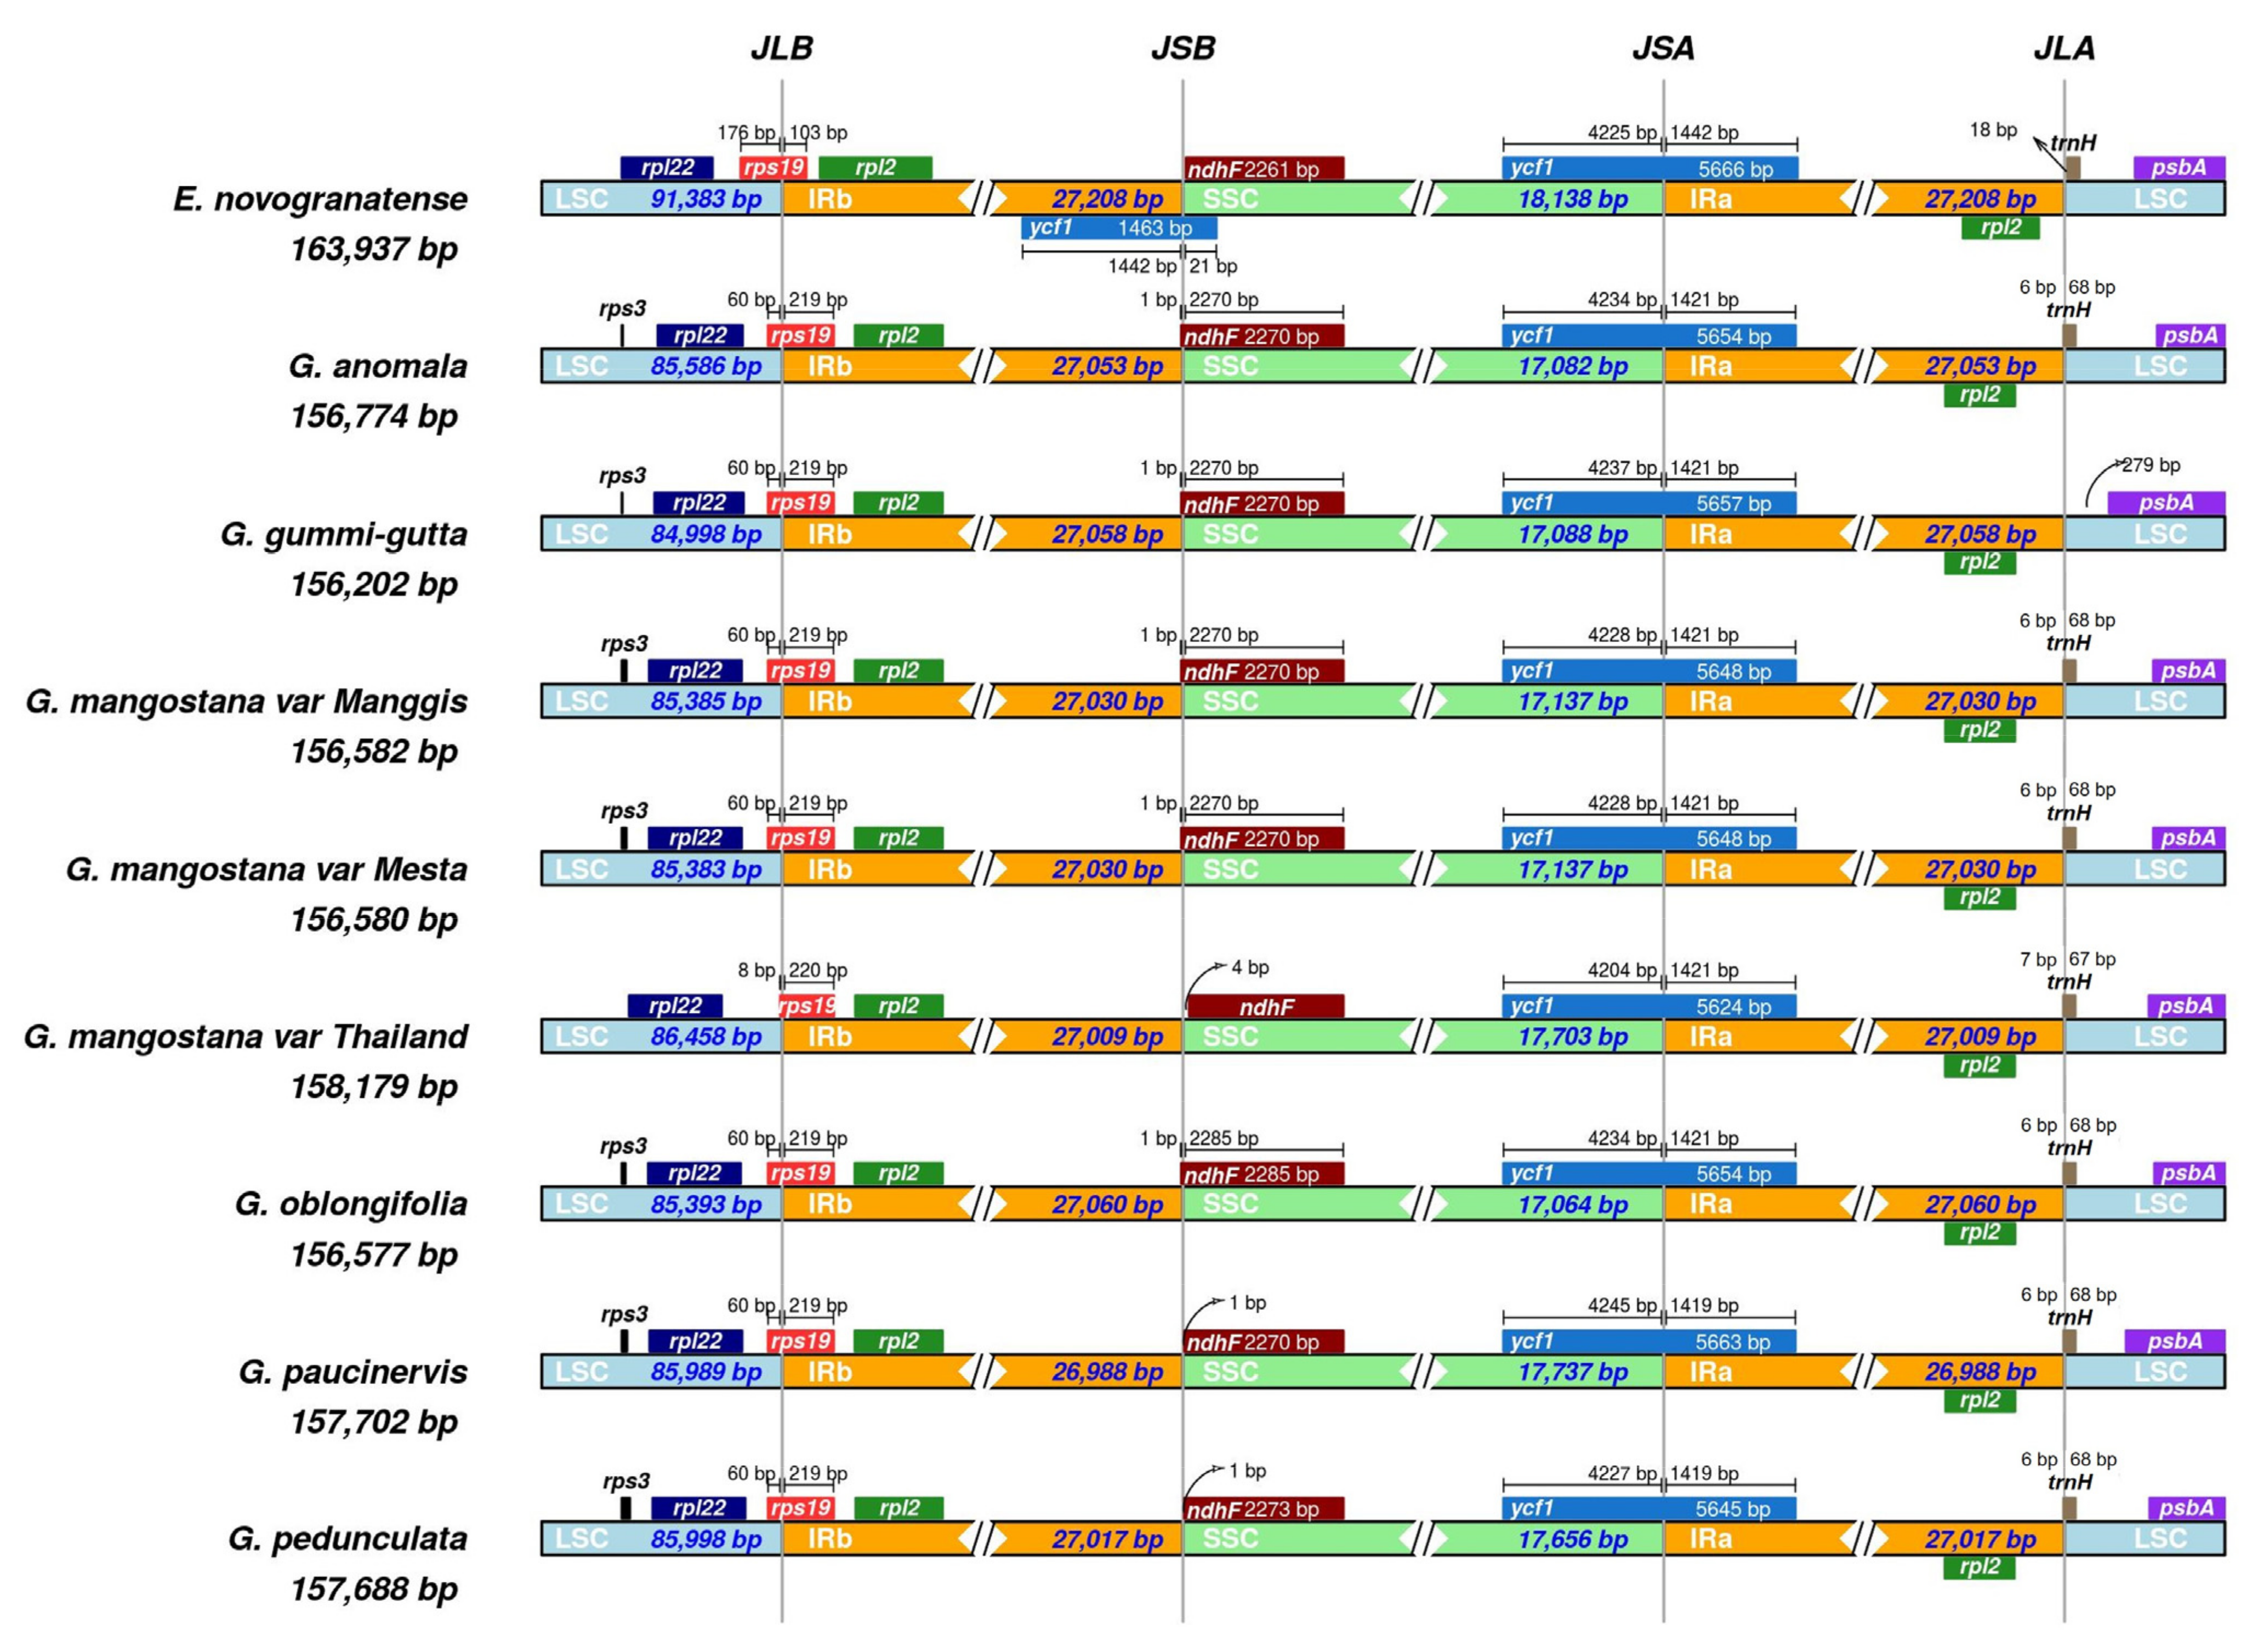
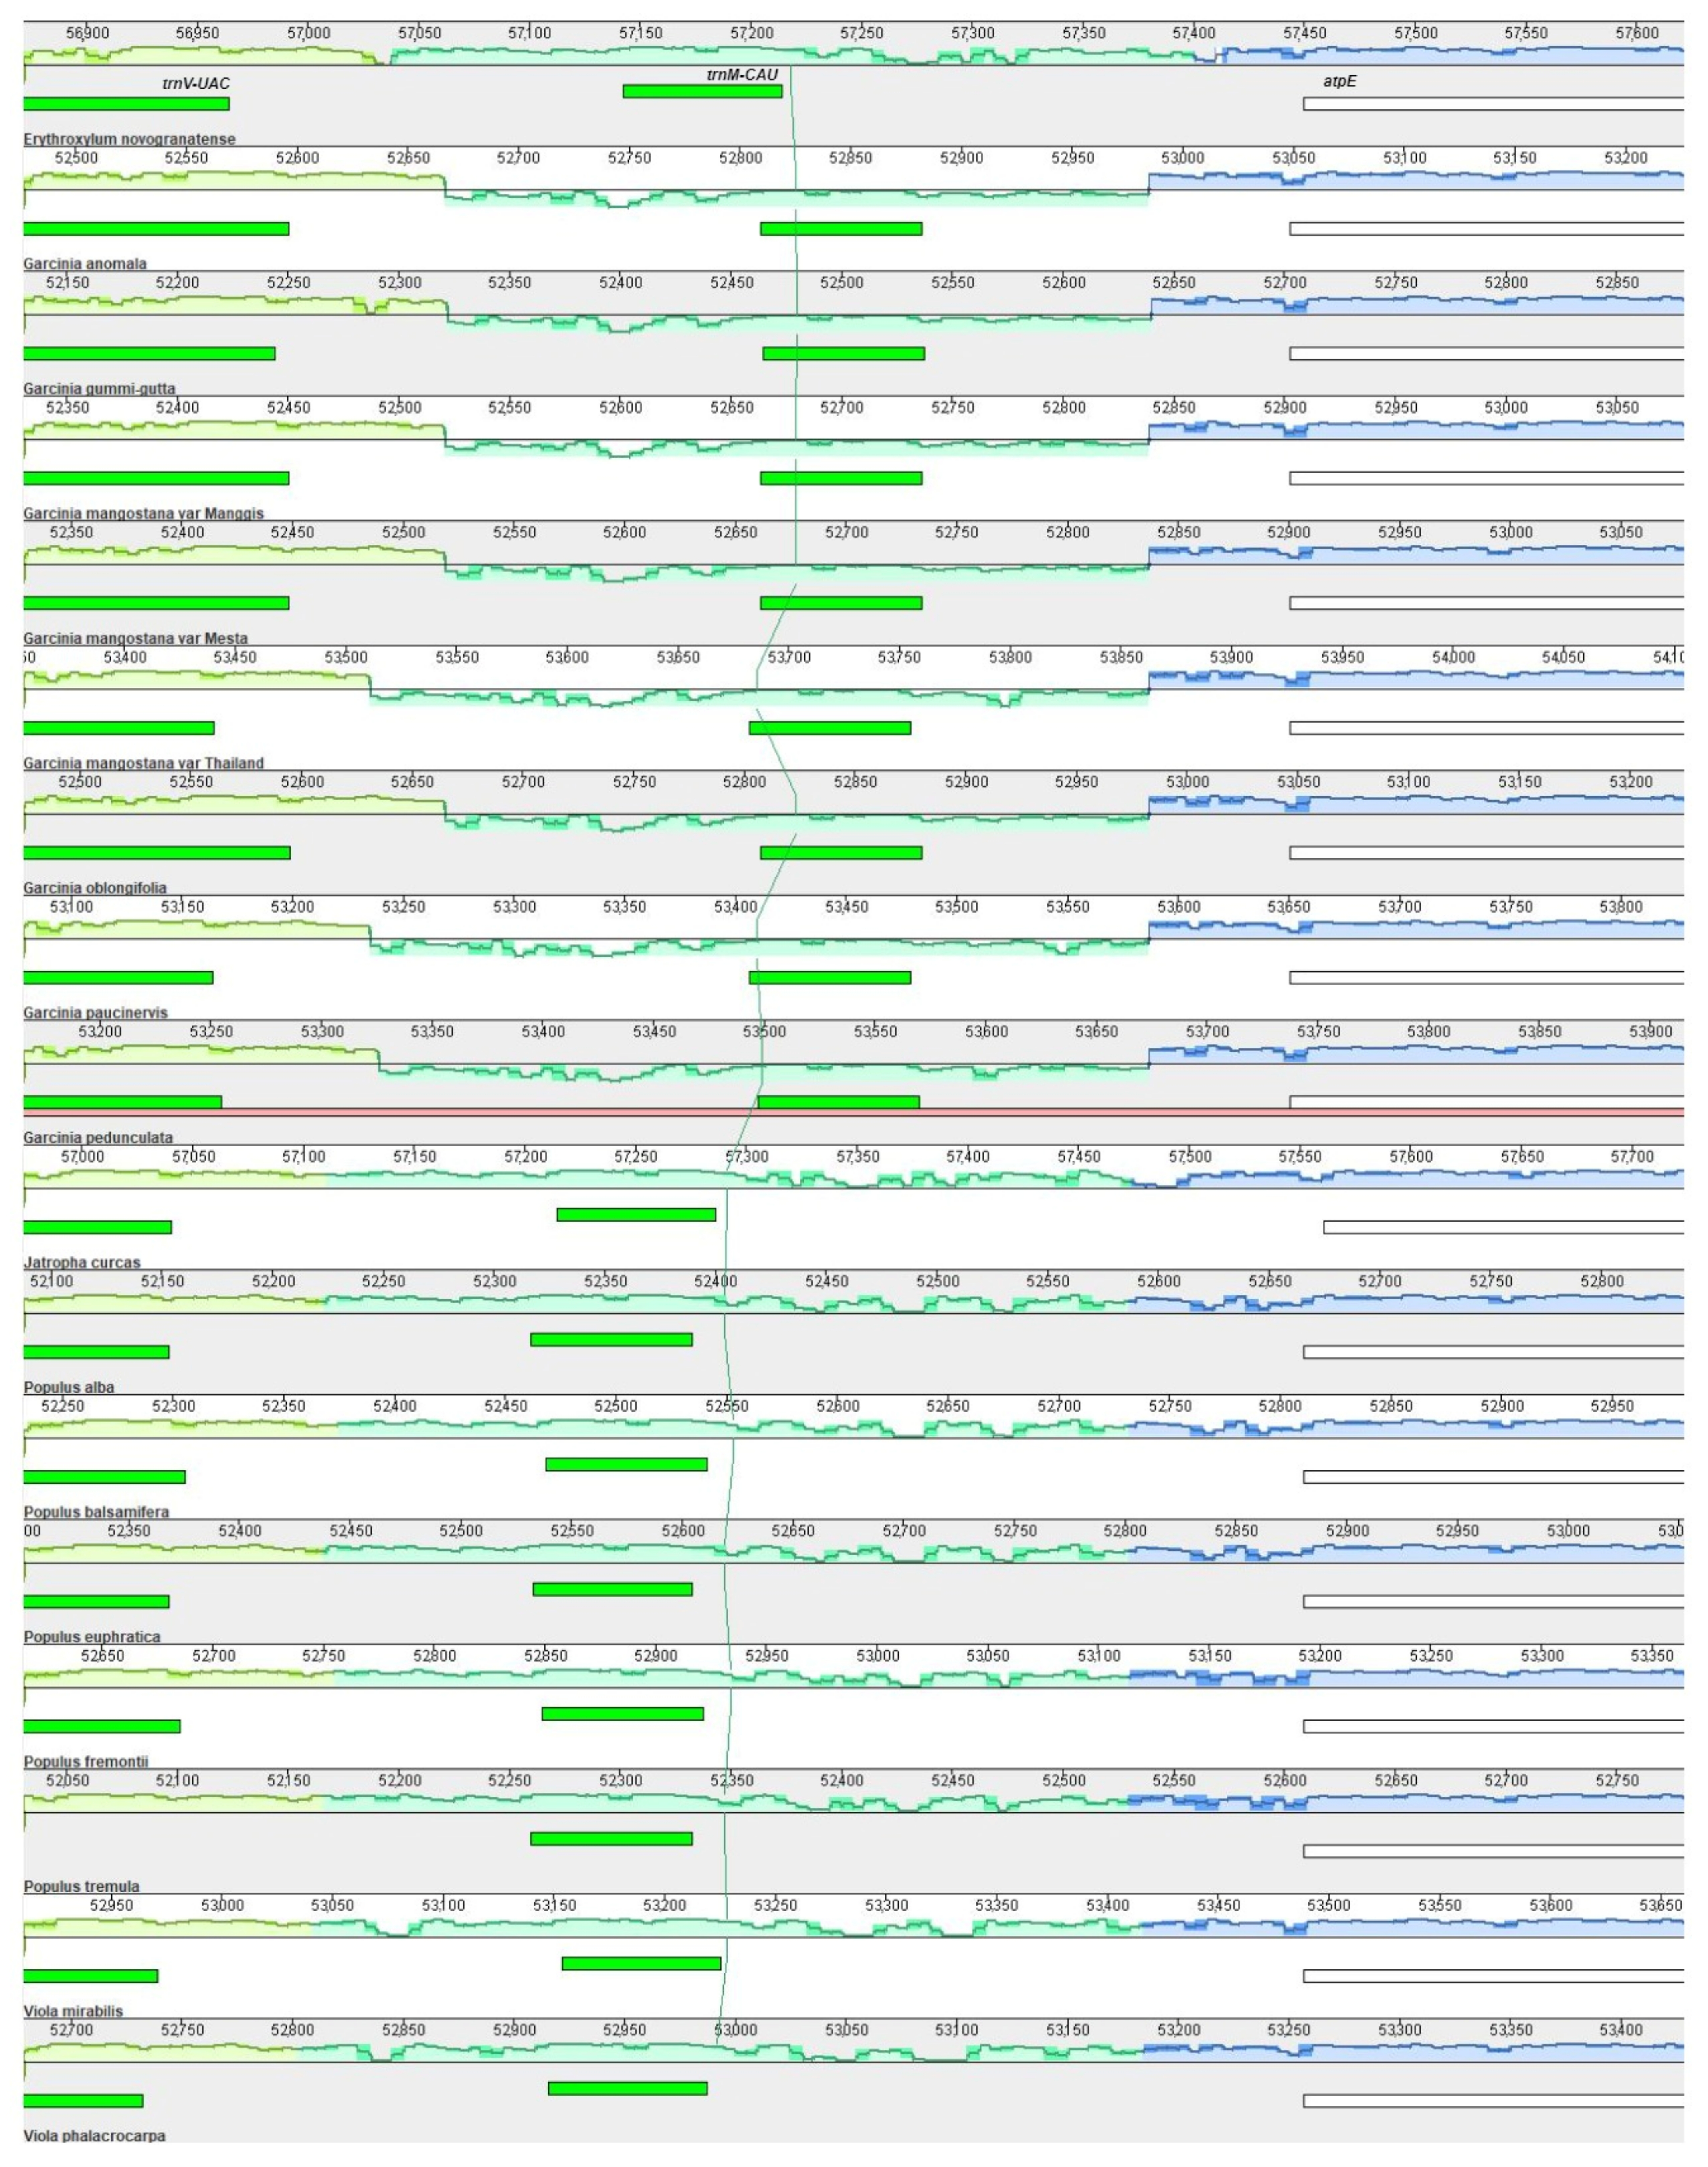
2.7. Contraction and Expansion of the Inverted Repeat Region

The smallest inverted repeat (IR) was found in G. paucinervis (26,988 bp), while the largest IR was found in G. oblongifolia (27,060 bp) (Figure 4). Genes that can be found at or close to the junctions of IRs were rps19, ndhF, ycf1, and trnH. The gene rps19 was located at the LSC/IRb junction site (JS) and the fragment size located at LSC in all Garcinia species was 60 bp, except for the Thailand variety, which was only 8 bp. In addition, the rps19 gene fragment of the Thailand variety located at the IRb site was 1 bp longer (220 bp) than the rps19 gene fragment (219 bp) of the other Garcinia species at the same location. The ndhF gene spanned across the SSC/IRb with 1 bp located at the IRb region for G. anomala, G. gummi-gutta, Manggis and Mesta varieties, and G. oblongifolia. However, it was 1 bp away from the SSC/IRb junction site of both G. paucinervis and G. pedunculata. Interestingly, the Thailand mangosteen was the only one with ndhF gene 4 bp from the SSC/IRb junction. The ycf1 gene fragment (1421 bp) in the IRa region was the same for all Garcinia species, except for G. pedunculata and G. paucinervis (1419 bp). The size of the ycf1 fragment in the SSC region ranged from 4204 to 4245 bp. In addition, it was found that tRNA-trnH was missing at the IRa/LSC junction of G. gummi-gutta. In comparison with Erythroxylum novogranatense (Plastome size: 163,937 bp; LSC: 91,383 bp; SSC: 18,138 bp; IR: 27,208 bp), a sister group of G. mangostana [15], plastome size, LSC, SSC, and IR regions of Garcinia species were much shorter (Figure 4, Table 1).

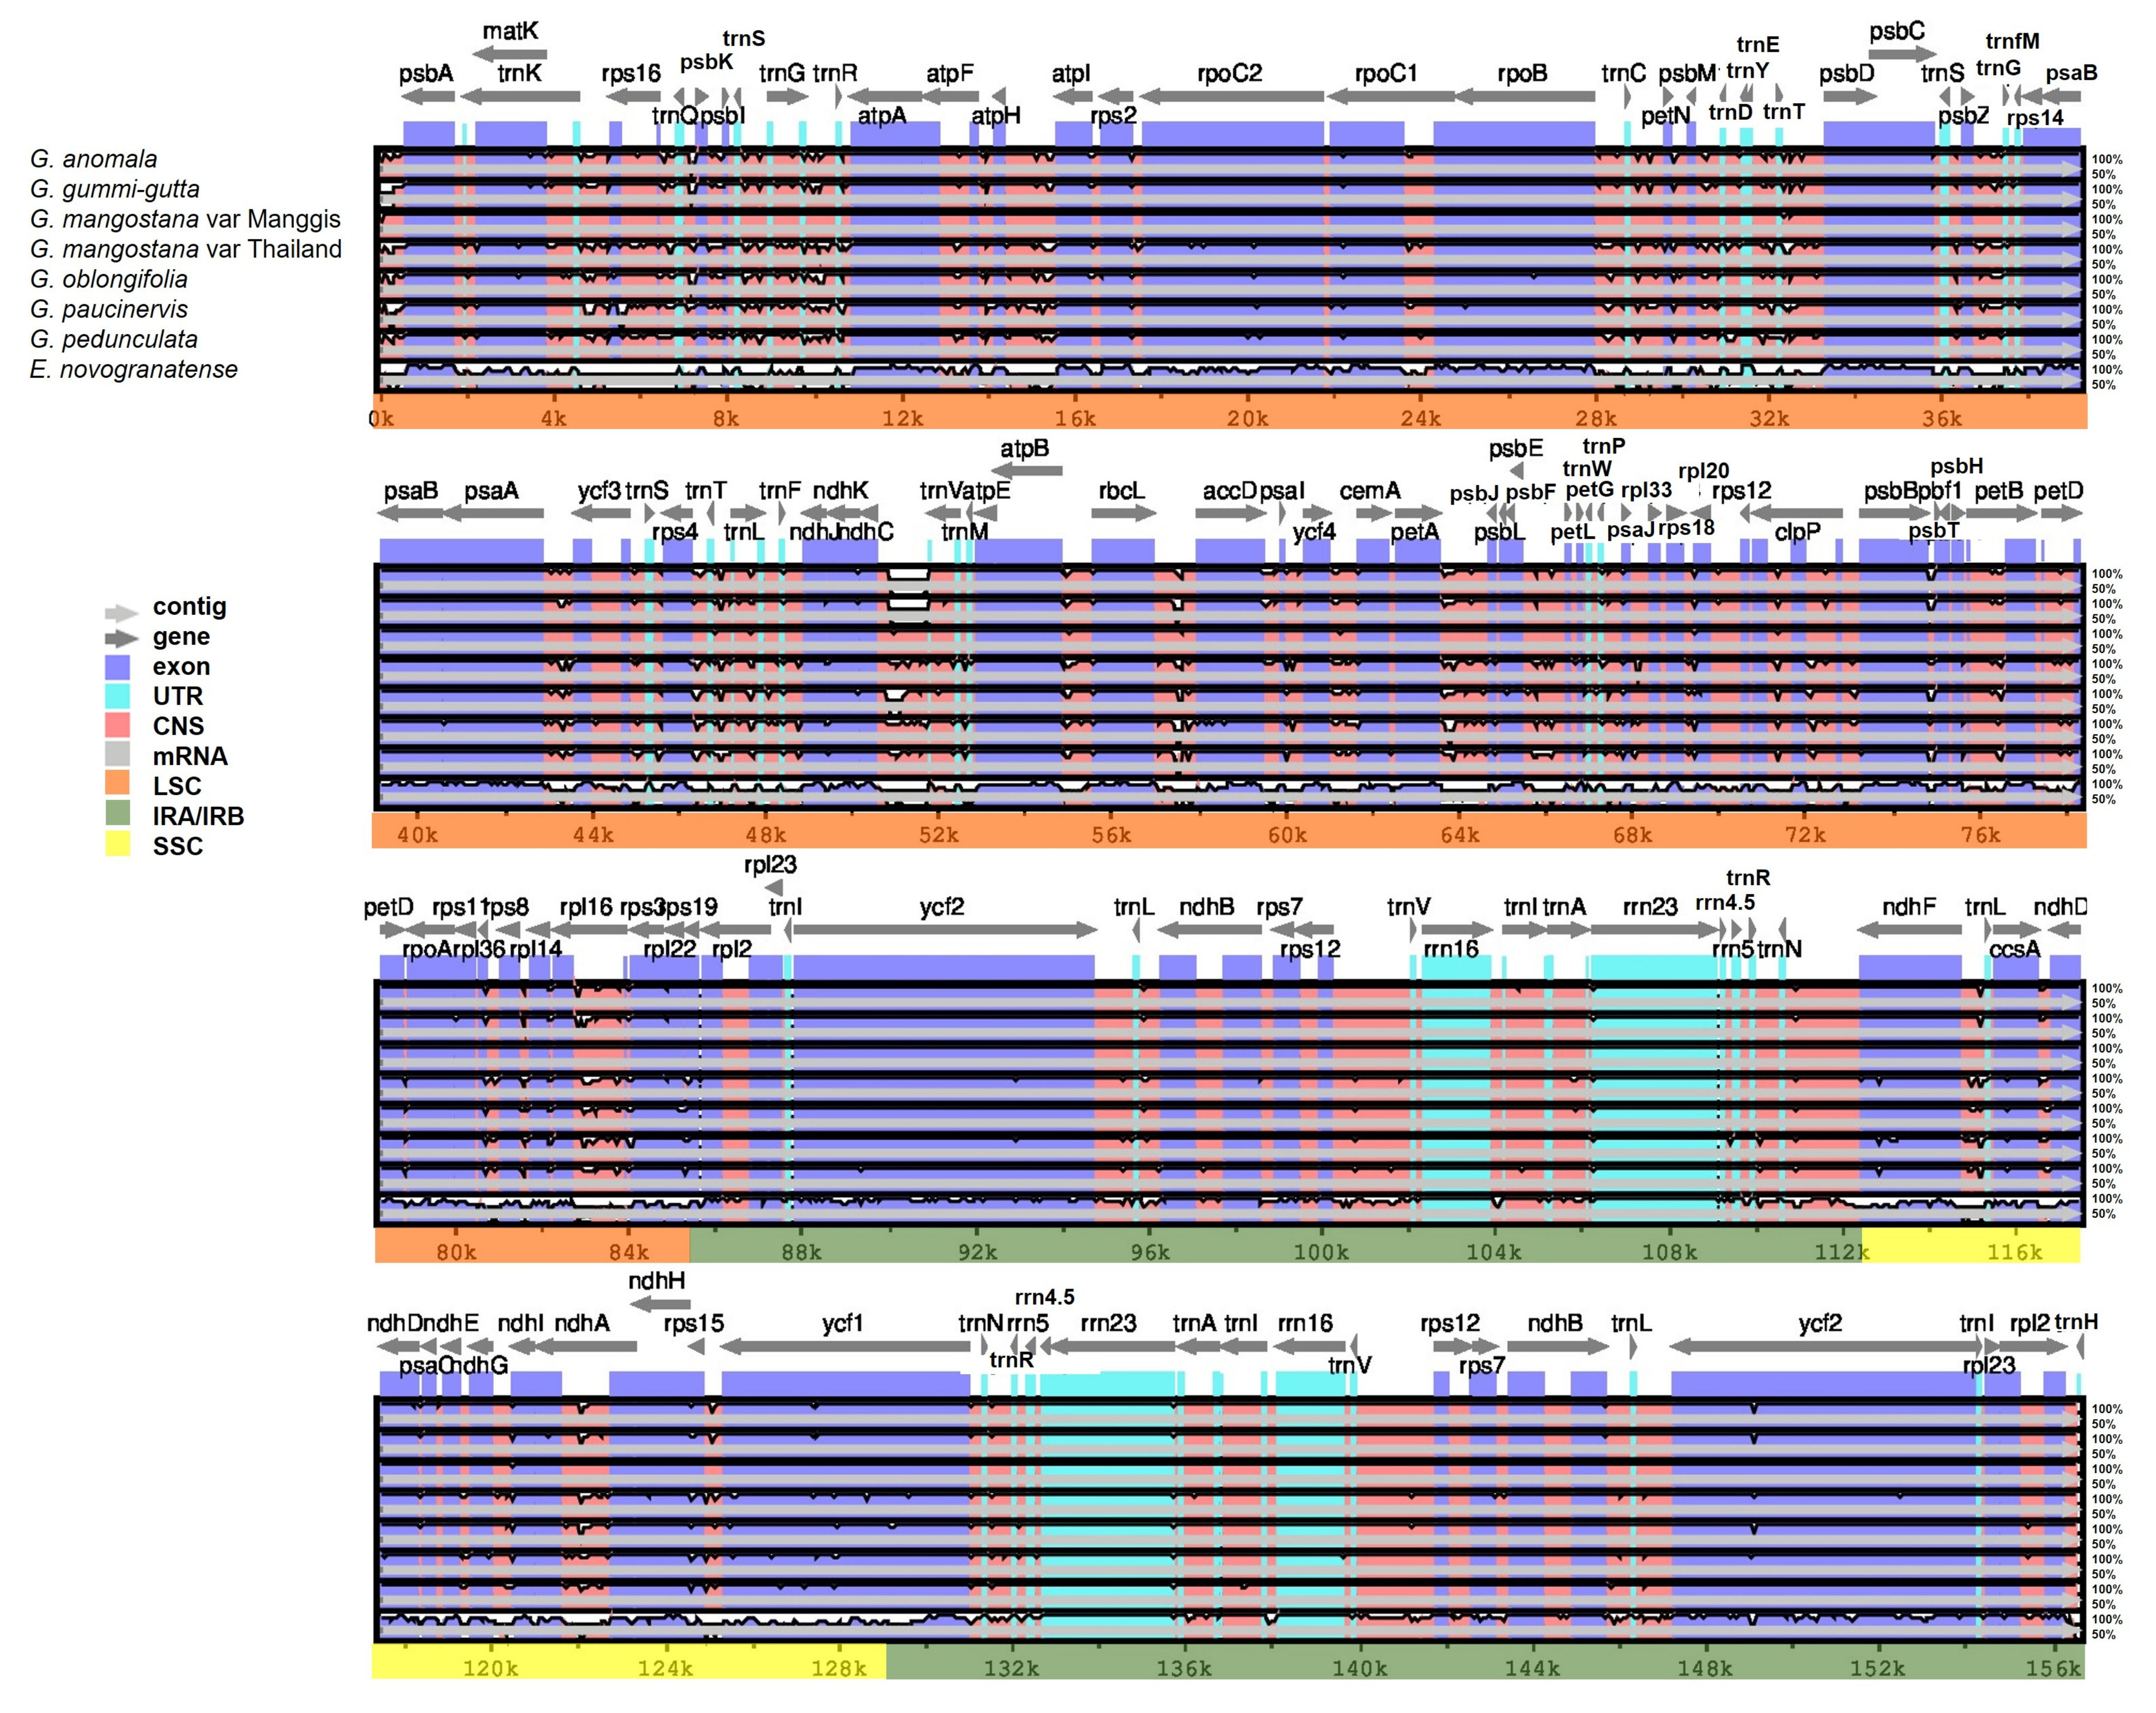
2.8. Comparative Plastome Analysis

Plastome comparison using Mesta as a reference was performed using the mVista online alignment tool (Figure 5). The qualitative comparison among Garcinia species showed that (1) IR regions were more conserved (higher % identity) compared with LSC and SSC regions, and (2) coding regions were more conserved (higher % identity) than intergenic regions. This result agreed with previous reports in Plantaginaceae, Rosaceae, and Sapindaceae families [26,35,36]. For LSC, highly divergent intergenic regions include trnH-psbA, trnQ-psbK, trnG-trnR, atpF-atpH, atpH-atpI, trnT-psbD, ndhC-trnV, rbcL-accD, psbB-psbT, and the intergenic region within the rpl16 gene. As for SSC, the highly divergent regions include ndhF-trnL and the intergenic region within the ndhA gene. Divergent regions were also found in the coding regions such as matK, rpoC2, rpoC1, rpoB, rbcL, accD, ycf4, cernA, petA, petD, rpoA, ndhF, ccsA, ycf1, and ycf2 (Figure 5). In comparison with Erythroxylum novogranatense, plastome sequences of Garcinia species were conserved within the Clusiaceae family.
Multiple genome (plastome) alignment between 17 species from the order Malpighiales (Table S9) using Mauve with E. novogranatense as a reference detected one inversion of ≈360 bp. It was located between trnV-UAC and the atpE gene with 15 bp palindromic repeats (ACATCCTATTTCTTT/AAAGAAATAGGATGT) detected at the break point of both sites of inversion. Surprisingly, this inversion was only found in Garcinia species (Figure 6) but not in other species of the same order.

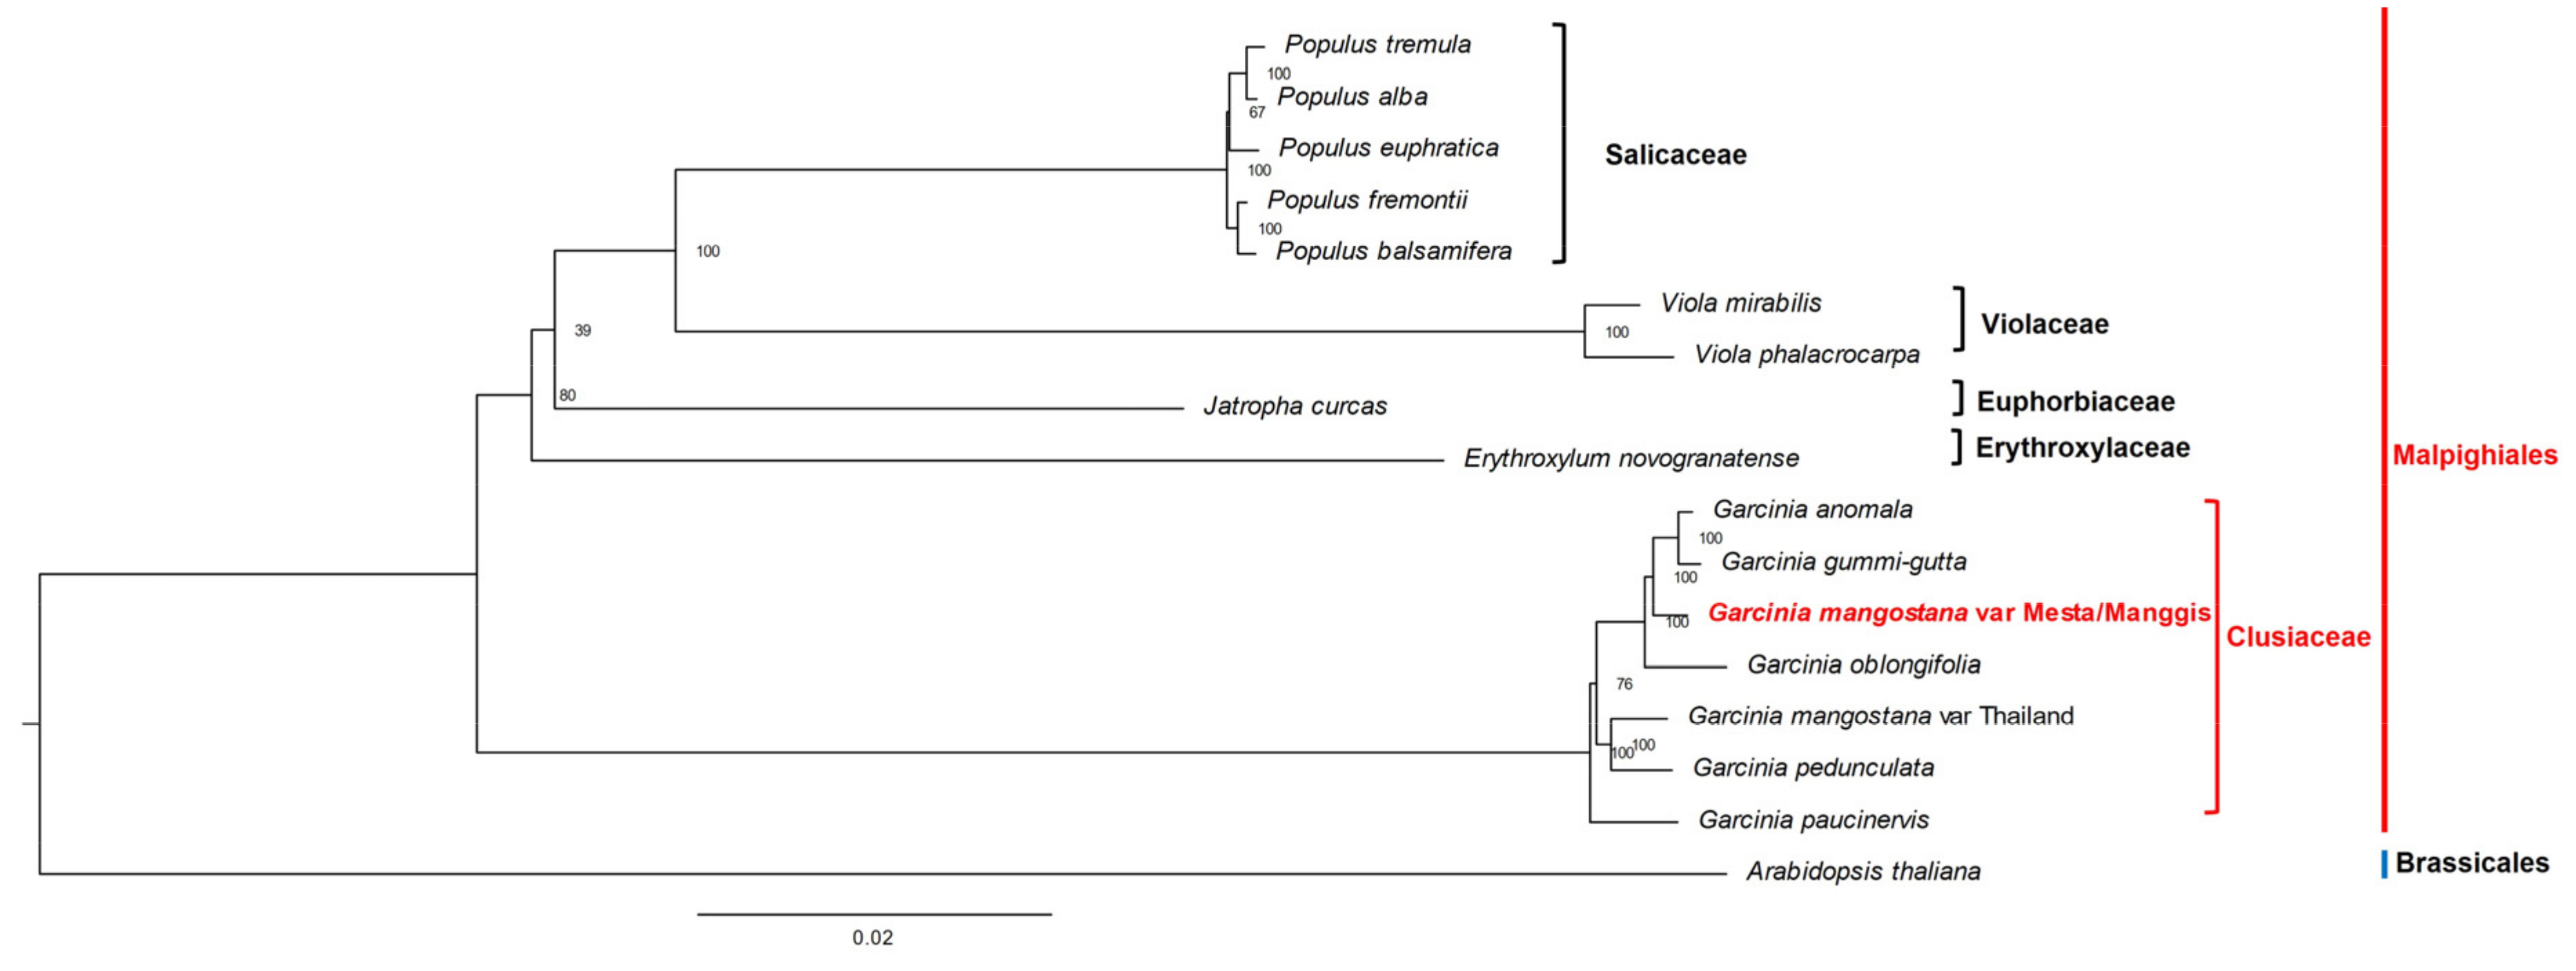
2.9. Phylogenomic Analysis

A total of 74 protein-coding genes (Table S10) were used for phylogenomic analysis. Phylogenomic analysis showed that both Manggis and Mesta varieties were grouped together as the CDS sequences were 100% identical, despite some base differences in non-coding regions. Both were grouped under the clade of Garcinia species in the Malpighiales order among the three groups of Garcinia species (Figure 7). G. anomala and G. gummi-gutta were closely related and formed one group with the Mesta/Manggis varieties and G. oblongifolia. The Thailand variety and G. pedunculata formed another group, while G. paucinervis formed the third group in the Clusiaceae family.

3. Discussion

Plant DNA is rich in plastome (≈5–20%) and hence, an enrichment strategy is not required for sequencing [14]. In this study, a complete mangosteen plastome of Mesta variety (156,580 bp) was successfully obtained from PacBio long reads. Here, the use of long reads for the assembly of the plastid genomes was ideal to obtain longer contigs and to resolve repetitive regions [27,37,38,39]. In addition, Illumina sequencing data were used to correct the random errors within PacBio reads [40]. Furthermore, the polished Mesta plastome allowed for the reference-guided assembly of the plastome from Manggis, which had only Illumina short reads.
Both the Mesta and Manggis plastomes were nearly identical (Figure 1), consisting of a typical conserved quadripartite plastome structure found in most of the land plants [14,41]. Generally, the number of genes encoded in a plastome ranges from 110 to 130 genes [36]. Both Malaysian mangosteen plastomes fall within the range with 128 genes (111 unique genes), consistent with all other Garcinia species found in GenBank, except for G. gummi-gutta, which lost one trnH gene (Table 1). Typically, plastomes have 30–31 tRNAs [42,43], and the loss of tRNA genes is not uncommon. For instance, two hemiparasitic Taxillus species lost seven tRNAs, including tRNA-trnH [44]. Sometimes, missing tRNAs might be replaced by other types of anticodons, such as Neochloris aquatica (NC_029670.1), Bracteacoccus giganteas (NC_028586.1), Tetradesmus obliquus (NC_008101.1), Floydiella terrestris (NC_014346.1), Schizomeris leibleinii (NC_015645.1), and Oedogonium cardiacum (NC_011031.1) [45].
The plastome size, structure, and gene content are highly conserved among Garcinia species. There were 18 genes (12 protein-coding genes and 6 tRNAs) containing intron(s) in the plastomes of Garcinia species. Although introns are not protein coding, they play an important role in gene expression by regulating the rate of transcription, nuclear export, and stability of transcripts [46,47]. The loss of introns such as rpl2 and rps16 has been reported in the plant plastomes [48,49,50,51], but we did not find any evidence of this in the plastomes of Garcinia species.
We detected two mis-annotations of genes (infA and rpl32) in G. pedunculata [20] and one mis-annotation of infA in G. anomala [52]. The infA is usually located between rpl36 and rps8, whereas rpl32 is usually located between ndhF and trnL-UAG [53]. Instead, the annotated infA was located within the rpoC1 gene (G. anomala: MW582313 [52]; G. pedunculata: NC048983 [54]), while rpl32 of G. pedunculata was located between rpoB and trnC-GCA. Hence, both genes were actually not found in the Garcinia plastomes, in agreement with a previous report that both infA and rpl32 genes were lost in G. mangostana [55]. Plastid gene transfers to the nuclear genome (e.g., accD, infA, rpl22, and rpl32) have been documented in several plants [53,56,57]. The abundance of infA and rpl32 transcripts in the seed transcriptome [4] suggests the same scenario for G. mangostana.
Genetic variations in G. mangostana cultivars have been shown by randomly amplified DNA fingerprinting (RAF) and inter simple sequence repeat (ISSR) molecular markers [58,59,60]. Plastomes also contain SSR and long repeats [61,62,63,64]. SSR, which is a stretch of 1–6 bp small repeats, is found extensively in different regions of the plastome, such as the intergenic regions, intron regions, and protein-coding regions [24]. In contrast, the long repeats found in the plastomes mostly fall within the intergenic region, although some of them were present in protein-coding genes [65]. Repetitive regions might lead to species variation as they have a higher tendency of recombination, translocation, and insertion/deletion [66]. In this study, SSR and long repeat analyses of plastomes showed variations among Garcinia species and varieties of G. mangostana. This supports the idea that both molecular markers are useful for species identification and taxonomic studies [67,68,69].
One of the main factors that contribute to the plastome size differences is the inverted repeat (IR) expansion and contraction [70,71]. For instance, nine genes were transferred from the SSC to the IR region in Plantago ovata, resulting in an extremely long IR (37.4 kb) [26] as compared to IR found in the other plastomes, which normally range between 25 and 30 kb [42]. In contrast, the loss of IR had been reported in the plastomes of Vicia bungei [72] and 25 durian varieties recently [38]. Besides long inversion, small-to-medium-sized (<few hundred base pairs) inversion in the plastome was also commonly found in angiosperm. Inversion between trnV-UAC and the atpE gene had been reported for the first time in the plastome of the Thai variety [15] and it is also found in the plastomes of all other seven Garcinia species used in this study. Small inversion in the plastome was also reported in P. maritima [26], Panax schinseng [73], Urticaceae family [51], and Lindera species [74]. Generally, this inversion is flanked by palindromes or quasi-palindrome (8–50 bp) to form the hairpin loop, and it is suggested that small inversion occurrence was affected by hairpin thermodynamic stability [75].
The phylogenomic analysis showed identical protein-coding genes between Mesta and Manggis varieties, which implies the same maternal lineage for both varieties from Malaysia compared to the Thailand variety (Figure 7). This result is congruent with the analysis using the whole plastome sequences of 16 species (Figure S7). The Malaysian (Mesta/Manggis) and Thailand mangosteen varieties did not cluster together in the phylogenomic analysis, contrary to the initial hypothesis of this study, which assumed a close phylogenomic relationship of the same species. Analysis of polymorphic sites of the 74 CDS used for phylogenomic tree construction showed a total of 559 variable sites, accounting for 0.85% differences between Manggis/Mesta and Thailand varieties (Table S11). This was inconsistent with the clustering of different G. mangostana varieties, including the Thailand varieties in a previous phylogenetic study based on the nuclear ITS sequences [10].
To further investigate this discrepancy, we obtained the consensus ITS sequences of both Mesta (accession number: OK576276) and Manggis (accession number: OK576274) varieties by mapping the respective Illumina filtered reads against the published ITS sequence (accession number: AF367215). We reconstructed a phylogenetic tree [10] on the basis of the ITS sequences of other Garcinia species found in GenBank, including G. celebica, G. gummi-gutta, G. hombroniana, G. oblongifolia, G. paucinervis, and G. pedunculata (Table S12). The ITS phylogenetic tree (Figure S8) showed that all the G. mangostana varieties were grouped with G. malaccensis, congruent with the results of the previous study [10]. Meanwhile, Mesta and Manggis were distantly related to G. gummi-gutta, G. oblongifolia, G. paucinervis, and G. pedunculata. Furthermore, Mesta, Masta, and G. malaccensis MY4 were clustered together, away from the Manggis variety. This indicates genetic differences between the two varieties despite near identical plastomes and supports that both varieties might have originated from G. malaccensis.
We found that both Manggis and Mesta varieties showed heterozygosity at certain positions of the ITS (Manggis: position 200; Mesta: position 444, 477, and 527) according to Illumina short reads results (Figures S9 and S10, respectively). Out of ten G. mangostana reported in the previous study [10], only one sample (G. mangostana TH3) from Thailand showed heterozygosity. Hence, G. mangostana may not have been derived from the hybridization of G. hombroniana and G. malaccensis [9]. Meanwhile, near-identical Mesta and Manggis plastomes (Figure 1 and Figure 6) indicate the same maternal lineage. This means the different evolutionary inferences from the nuclear genome and plastome analysis as plastids are inherited maternally compared to recombination events in nuclear genomes during reproduction [12].
As hybridization is a common practice in plant breeding to produce hybrids with desirable traits [76], the genetic variations and heterozygosity observed in this study could be due to the different germplasms. Different germplasms may hybridize via selective breeding and could have produced different varieties of G. mangostana in Malaysia and Thailand [10]. However, this remains highly speculative and requires further investigations of mangosteen from different biogeographical origins as well as plastomes of G. celebica (syn. G. hombroniana), G. malaccensis, G. penangiana, and G. opaca to ascertain their maternal lineages.

4. Materials and Methods

4.1. Mesta Plastome De Novo Genome Assembly

Genome sequences of the Mesta variety were obtained from the NCBI SRA database with the accession numbers SRX2718652 to SRX2718659 for PacBio long-read data (9.5 Gb) [17] and SRX270978 for Illumina short reads (50.2 Gb) [18]. CANU v2.0 [77] was used to perform PacBio raw data correction, trimming, and assembly using default parameters with minor modifications (useGrid = false, genomeSize = 6 g, batMemory = 252, batThreads = 32, minInputCoverage = 0.15, stopOnLowCoverage = 0). The draft genome assembly was polished with Illumina data using Pilon v1.23 [77]. Candidate plastome contigs were identified by using the BLAT v36.0 alignment tool with the previously reported G. mangostana (NC_036341.1) as the query. The identified contig was manually curated on the basis of the read coverage to obtain the final plastome of Mesta for subsequent analysis.

4.2. Manggis Plastome Assembly

Genome sequences of the Manggis variety were obtained from the NCBI SRA database with the accession number SRX1426419 for Illumina reads (51.1 Gb) [16]. Different methods were used for Manggis variety plastome assembly: (1) reference-guided assembly using GetOrganelle v1.7.5 [78], (2) de novo assembly using GetOrganelle v1.7.5 [78], and (3) de novo assembly using Platanus v1.2.4 [79] (Figure S11). To select the reference for reference-guided genome assembly, Manggis clean reads were aligned against the complete plastomes of Mesta and Thailand [15] varieties using bwa-mem v0.7.17 [80] and samtools v1.1 [81]. Next, the mapping coverage was visualized using weeSAM v1.6 (https://github.com/centre-for-virus-research/weeSAM; accessed on 24 December 2020). The reference with higher percentage coverage was chosen as the final reference for subsequent analysis. Manual curation was performed on the reference-guided assembled Manggis plastome to obtain the final Manggis plastome (Figure S12, Table S13). The complete plastome sequences of Garcinia mangostana varieties Mesta and Manggis have been submitted to GenBank (https://www.ncbi.nlm.nih.gov/nuccore/; accessed on 21 April 2022) with the accession numbers MZ823408 and OK572535, respectively.

4.3. Plastome Annotation

Plastome annotation was performed online using GeSeq (https://chlorobox.mpimp-golm.mpg.de/geseq.html; accessed on 28 December 2020) [82]. Four Garcinia species (Garcinia gummi-gutta (NC_047250); Garcinia mangostana (NC_036341); Garcinia oblongifolia (NC_050384); and Garcinia pedunculata (NC_048983)) were used as BLAST-like Alignment Tool (BLAT) references. Respective gene annotations were corrected manually. Lastly, the plastome map was generated using the Organellar Genome DRAW (OGDRAW v1.3.1) program with default parameters [83]. The annotated plastomes of both Mesta and Manggis varieties were submitted to NCBI with accession numbers MZ823408 and OK572535, respectively.

4.4. Open Reading Frame (ORF) Coordinate Adjustment

The length of each gene found in Garcinia species was compared. Gene alignment was performed to visualize the differences when dissimilarity in gene length was detected by different annotation software. Next, manual coordinate adjustment was performed to standardize the 5′ end and the splicing site of these genes (Figure S13, Table S14). The adjusted OFR coordinates (Supplementary Data S1) were used for subsequent analysis.

4.5. Identification of Simple-Sequence Repeats (SSRs)

The MISA-web microsatellite identification tool v2.1 (https://webblast.ipk-gatersleben.de/misa/; accessed on 6 February 2021) [84] was used to identify SSRs with the following default parameters: the minimum number of repeats for SSR motif of mono-, di-, tri-, tetra-, penta-, and hexa- were set to 10, 6, 5, 5, 5, and 5, respectively; the maximum length of the sequence between two SSRs to be registered as a compound SSR was set as 100 bp.

4.6. Long Repeat Analysis

Web-based REPuter (https://bibiserv.cebitec.uni-bielefeld.de/reputer/; accessed on 9 March 2021) [85] was used to identify forward, reverse, complement, and palindromic repeat sequences using the default setting of 50 for maximum computed repeats; hamming distance was set to 3, and minimal repeat size was set to 30 bp [85].

4.7. Codon Usage Analysis

Codon usage and relative synonymous codon usage (RSCU) value of all the annotated protein-coding genes presented in the plastomes of Garcinia species were analyzed using the MEGA X software v10.2.1 [86]. The RSCU with value >1.00 refers to a codon that is frequently used, whereas RSCU with the value <1.00 refers to a codon that is less frequently used. There is no codon usage bias when the RSCU value = 1.00 [87].

4.8. Plastome Sequence Alignment and Comparative Analysis

Plastome alignment and visualization were performed using the online comparison tool mVista (https://genome.lbl.gov/vista/mvista/submit.shtml; accessed on 27 May 2021) in LAGAN mode [88,89]. Mesta was used as a reference for alignment. The inverted repeat (IR) regions and the junction sites of the large single-copy (LSC) and small single-copy (SSC) regions of all the Garcinia species were compared using the IRscope online webtool [90] for the visualization of the expansion or contraction events. For both analyses, Erythroxylum novogranatense, from the Erythroxylaceae family of the same order Malpighiales, was included.
Mauve v.2.4.0 with progressiveMauve [91] was used to detect plastome inversions using default settings. A total of 17 species plastomes from the order Malpighiales (Table S9) were aligned against E. novogranatense as a reference plastome. Palindrome in Galaxy Europe version 5.0.0.1 was used to detect palindromes with minimum and maximum length of palindromes set to 15 and 50 each, and the maximum gap between repeated regions was set to 400 bp.

4.9. Phylogenomic Analysis

For phylogenomic analysis, sixteen species were used: six Garcinia species (including G. mangostana var. Manggis, Mesta, and Thailand), five Populus species, two Viola species, Erythroxylum novogranatense, and Jatropha curcas from the order Malpighiales and Arabidopsis thaliana from the order Brassicales. A total of 74 protein-coding genes (Table S10) that are found in all plastomes of these 16 species (including three varieties from G. mangsotana) were downloaded from the NCBI Organelle Genome database. These protein-coding genes were concatenated before being aligned using the MAFFT version 7 online tool (https://mafft.cbrc.jp/alignment/server/; accessed on 4 April 2021) [92]. Next, ModelTest-NG v0.1.6 [93] was used to select the DNA Evolutionary Models. The best model selected was GTR + I + G4, and it was used in the subsequent maximum likelihood (ML) analysis using the RAxML-NG v1.0.2 tool [94] with 1000 bootstrap replicates.

5. Conclusions

The complete plastomes of both Mesta and Manggis varieties of G. mangostana from Malaysia were successfully assembled and analyzed. PacBio long-read sequencing data helped to resolve the repetitive sequences in Mesta. Subsequently, this allowed for reference-guided genome assembly of the Manggis plastome. Notably, the Manggis plastome was almost identical with the Mesta plastome compared to the plastome of the Thailand variety. Comparative analysis showed that the gene structure, gene content, gene order, and gene orientation of Garcinia plastomes were largely conserved, except for one missing trnH-GUG gene in G. gummi-gutta. Phylogenomic analysis indicated that the Mesta and Manggis varieties were closer to G. anomala, G. gummi-gutta, and G. oblongifolia, while the Thailand variety clustered with G. pedunculata. Phylogenetic analysis based on the nuclear ITS sequences separated the Mesta and Manggis varieties on the basis of differences in their nuclear genomes. This study suggests different origins of the Mesta/Manggis and Thailand varieties. SSR and long repeats of plastomes identified in this study will provide useful biomarkers for species/variety identification and future lineage study of Garcinia genus.

Supplementary Materials

The following supporting information can be downloaded at https://www.mdpi.com/article/10.3390/plants12040930/s1. Figure S1: Dot plot analysis showing tig00037451_pilon as a circular contig. Figure S2: Read depth of (a) Mesta PacBio subreads and (b) Mesta Illumina clean reads mapped against the Mesta plastome (MZ823408). * Sharp peak in (b) is due to the TA-rich region. Figure S3: Read depth of Manggis Illumina clean reads mapped against plastomes of (a) Mesta variety, (b) Mesta *, (c) Thailand variety, (d) Manggis variety, and (e) Manggis *. * Edited to exclude the TA-rich region of 52 bp. Figure S4: Sequence alignment result between plastomes of G. mangostana var. Manggis and var. Mesta showing the position of gaps and a variable site. Figure S5: Multiple sequence alignment of (a) infA gene of G. anomala and G. pedunculata; (b) rpl32 gene of G. pedunculata with other species. Figure S6: Comparison of amino acid frequency of six Garcinia species. Figure S7: Phylogenetic tree (maximum likelihood) construction based on 16 species’ (three varieties from G. mangostana) whole plastome sequence. Figure S8: Phylogenetic tree inferred from the ITS sequences of Garcinia species using the neighbor-joining method with bootstrap replications set to 1000 (MEGA X Version 10.2.1). Figure S9: Comparison between G. mangostana L. (mangosteen) and G. malaccensis to identify the substitution sites and indels in internal transcribed spacer (ITS) sequences. Figure S10: Positions of the ITS with heterozygosity detected at the ITS of Manggis and Mesta varieties as visualized using IGV. Figure S11: Different methods used in Manggis variety plastome assembly. Figure S12: ClustalW alignment and IGV visualization to confirm the indel and SNP detected in Table S12. Figure S13: Example of ORF alignment before and after adjustment. Table S1: Summary statistics of the polished assembled G. mangostana var. Mesta genome. Table S2: Summary statistics of the (a) Mesta PacBio subread and (b) Mesta Illumina clean read depth coverage mapped against the Mesta plastome (MZ823408). Table S3: Summary statistics of Manggis Illumina clean read depth coverage against plastomes of Thailand, Mesta, and Manggis varieties. Table S4: Summary of the polymorphism site analysis. Table S5: Genes with intron(s) in the plastomes of Garcinia species. Table S6: Relative synonymous codon usage (RSCU) in plastomes of different Garcinia species. Table S7: SSRs identified on the plastome of Mesta variety. Table S8: SSRs identified on the plastome of Manggis variety. Table S9: GenBank accession numbers of the species used the study. Table S10: List of protein-coding genes used to construct the phylogenomics tree. Table S11: Comparison of polymorphic sites (74 CDS used in phylogenomics tree construction) between G. mangostana var Mesta/Manggis versus the other Garcinia species. Table S12: List of species used for phylogenetic tree construction using the ITS sequences. Table S13: Summary of different methods used for Manggis plastome assembly. Table S14: CDS length comparison of Garcinia species before and after adjustment. Supplementary Data S1: Adjusted ORF of plastome genes from different Garcinia species.

Author Contributions

Conceptualization, C.-C.W. and H.-H.G.; methodology, C.-C.W. and H.-H.G.; software, C.-C.W.; validation, C.-C.W. and H.-H.G.; formal analysis, C.-C.W.; investigation, C.-C.W.; resources, H.-H.G.; data curation, C.-C.W.; writing—original draft preparation, C.-C.W.; writing—review and editing, N.A.N.M., V.K.S., M.A., Y.N., and H.-H.G.; visualization, C.-C.W.; supervision, H.-H.G.; project administration, H.-H.G.; funding acquisition, Y.N. and H.-H.G. All authors have read and agreed to the published version of the manuscript.

Funding

This research was funded by Universiti Kebangsaan Malaysia (UKM) Research University grant DIP-2020-005 and AP-2012-018 (H.-H.G.) and NIG-JOINT grant 2021 (2A2021) (Y.N. and H.-H.G.). Publication fee support using AMED-CREST grant, Japan 21gm0910011 (M.A.).

Data Availability Statement

The complete plastome sequences and ITS sequences of Garcinia mangostana var. Mesta and Manggis can be accessed via GenBank (https://www.ncbi.nlm.nih.gov/nuccore/, accessed on 12 October 2022).

Acknowledgments

We also would like to thank Dexter Lee Jiunn Herng for the technical support in data analysis.

Conflicts of Interest

The authors declare no conflict of interest.

References

  1. Mamat, S.F.; Azizan, K.A.; Baharum, S.N.; Noor, N.M.; Aizat, W.M. GC-MS and LC-MS analyses reveal the distribution of primary and secondary metabolites in mangosteen (Garcinia mangostana Linn.) fruit during ripening. Sci. Hortic. 2020, 262, 109004. [Google Scholar] [CrossRef]
  2. Aizat, W.M.; Jamil, I.N.; Ahmad-Hashim, F.H.; Noor, N.M. Recent updates on metabolite composition and medicinal benefits of mangosteen plant. PeerJ 2019, 7, e6324. [Google Scholar] [CrossRef] [PubMed] [Green Version]
  3. Sprecher, A. Étude sur la Semence et la Germination du Garcinia mangostana L.; Librairie Générale de l’Enseignement: Paris, France, 1919. [Google Scholar]
  4. Goh, H.-H.; Abu Bakar, S.; Kamal Azlan, N.D.; Zainal, Z.; Mohd Noor, N. Transcriptional reprogramming during Garcinia-type recalcitrant seed germination of Garcinia mangostana. Sci. Hortic. 2019, 257, 108727. [Google Scholar] [CrossRef]
  5. Chinawat, Y.; Subhadrabhanu, S. Phylogenetic relationship of Mangosteen and several wild relatives revealed by ITS Sequence data. J. Am. Soc. Hortic. Sci. 2004, 129, 368–373. [Google Scholar]
  6. Nazre, M.; Clyde, M.; Latiff, A. Phylogenetic relationships of locally cultivated Garcinia species with some wild relatives. Malays. Appl. Biol. 2007, 36, 31. [Google Scholar]
  7. Sweeney, P.W. Phylogeny and floral diversity in the genus Garcinia (Clusiaceae) and relatives. Int. J. Plant Sci. 2008, 169, 1288–1303. [Google Scholar] [CrossRef]
  8. Saleh, M. Taxonomic Revision and Molecular Studies of Garcinia Section Garcinia (Guttiferae); University of Edinburgh: Edinburgh, UK, 2006. [Google Scholar]
  9. Richards, A. Studies in Garcinia, dioecious tropical forest trees: The origin of the mangosteen (G. mangostana L.). Bot. J. Linn. Soc. 1990, 103, 301–308. [Google Scholar] [CrossRef]
  10. Nazre, M. New evidence on the origin of mangosteen (Garcinia mangostana L.) based on morphology and ITS sequence. Genet. Resour. Crop Evol. 2014, 61, 1147–1158. [Google Scholar] [CrossRef]
  11. Bi, Y.; Zhang, M.-F.; Xue, J.; Dong, R.; Du, Y.-P.; Zhang, X.-H. Chloroplast genomic resources for phylogeny and DNA barcoding: A case study on Fritillaria. Sci. Rep. 2018, 8, 1184. [Google Scholar] [CrossRef] [Green Version]
  12. Raspé, O. Inheritance of the Chloroplast Genome in Sorbus aucuparia L. (Rosaceae). J. Hered. 2001, 92, 507–509. [Google Scholar] [CrossRef] [Green Version]
  13. Cheon, K.-S.; Kim, K.-A.; Kwak, M.; Lee, B.; Yoo, K.-O. The complete chloroplast genome sequences of four Viola species (Violaceae) and comparative analyses with its congeneric species. PLoS ONE 2019, 14, e0214162. [Google Scholar] [CrossRef] [PubMed]
  14. Tonti-Filippini, J.; Nevill, P.G.; Dixon, K.; Small, I. What can we do with 1000 plastid genomes? Plant J. 2017, 90, 808–818. [Google Scholar] [CrossRef] [PubMed] [Green Version]
  15. Jo, S.; Kim, H.-W.; Kim, Y.-K.; Sohn, J.-Y.; Cheon, S.-H.; Kim, K.-J. The complete plastome of tropical fruit Garcinia mangostana (Clusiaceae). Mitochondrial DNA Part B 2017, 2, 722–724. [Google Scholar] [CrossRef] [PubMed] [Green Version]
  16. Abu Bakar, S.; Sampathrajan, S.; Loke, K.K.; Goh, H.H.; Mohd Noor, N. DNA-seq analysis of Garcinia mangostana. Genom. Data 2016, 7, 62–63. [Google Scholar] [CrossRef] [Green Version]
  17. Midin, M.R.; Loke, K.K.; Madon, M.; Nordin, M.S.; Goh, H.H.; Mohd Noor, N. SMRT sequencing data for Garcinia mangostana L. variety Mesta. Genom. Data 2017, 12, 134–135. [Google Scholar] [CrossRef]
  18. Abu Bakar, S.; Kumar, S.; Loke, K.K.; Goh, H.H.; Noor, N.M. DNA shotgun sequencing analysis of Garcinia mangostana L. variety Mesta. Genom. Data 2017, 12, 118–119. [Google Scholar] [CrossRef]
  19. Wee, C.-C.; Muhammad, N.A.N.; Subbiah, V.K.; Arita, M.; Nakamura, Y.; Goh, H.-H. Mitochondrial Genome of Garcinia mangostana L. variety Mesta. Sci. Rep. 2022, 12, 9480. [Google Scholar] [CrossRef]
  20. Wang, Y.; Zhao, B.; Lu, Z.; Shi, Y.; Li, J. The complete chloroplast genome provides insight into the polymorphism and adaptive evolution of Garcinia paucinervis. Biotechnol. Biotechnol. Equip. 2021, 35, 377–391. [Google Scholar] [CrossRef]
  21. Krumsiek, J.; Arnold, R.; Rattei, T. Gepard: A rapid and sensitive tool for creating dotplots on genome scale. Bioinformatics 2007, 23, 1026–1028. [Google Scholar] [CrossRef] [Green Version]
  22. Redwan, R.; Saidin, A.; Kumar, S. Complete chloroplast genome sequence of MD-2 pineapple and its comparative analysis among nine other plants from the subclass Commelinidae. BMC Plant Biol. 2015, 15, 196. [Google Scholar] [CrossRef] [Green Version]
  23. Gao, C.; Wu, C.; Zhang, Q.; Zhao, X.; Wu, M.; Chen, R.; Zhao, Y.; Li, Z. Characterization of chloroplast genomes from two Salvia medicinal plants and gene transfer among their mitochondrial and chloroplast genomes. Front. Genet. 2020, 11, 574962. [Google Scholar] [CrossRef] [PubMed]
  24. Huang, Y.; Yang, Z.; Huang, S.; An, W.; Li, J.; Zheng, X. Comprehensive analysis of Rhodomyrtus tomentosa chloroplast genome. Plants 2019, 8, 89. [Google Scholar] [CrossRef] [PubMed] [Green Version]
  25. Liu, S.; Wang, Z.; Wang, H.; Su, Y.; Wang, T. Patterns and rates of plastid rps12 gene evolution inferred in a phylogenetic context using plastomic data of ferns. Sci. Rep. 2020, 10, 9394. [Google Scholar] [CrossRef] [PubMed]
  26. Asaf, S.; Khan, A.L.; Khan, A.; Khan, G.; Lee, I.-J.; Al-Harrasi, A. Expanded inverted repeat region with large scale inversion in the first complete plastid genome sequence of Plantago ovata. Sci. Rep. 2020, 10, 3881. [Google Scholar] [CrossRef] [PubMed] [Green Version]
  27. Chen, X.; Li, Q.; Li, Y.; Qian, J.; Han, J. Chloroplast genome of Aconitum barbatum var. puberulum (Ranunculaceae) derived from CCS reads using the PacBio RS platform. Front. Plant Sci. 2015, 6, 42. [Google Scholar] [CrossRef] [PubMed] [Green Version]
  28. Li, D.-M.; Zhao, C.-Y.; Liu, X.-F. Complete chloroplast genome sequences of Kaempferia galanga and Kaempferia elegans: Molecular structures and comparative analysis. Molecules 2019, 24, 474. [Google Scholar] [CrossRef] [PubMed] [Green Version]
  29. Wang, Z.; Xu, B.; Li, B.; Zhou, Q.; Wang, G.; Jiang, X.; Wang, C.; Xu, Z. Comparative analysis of codon usage patterns in chloroplast genomes of six Euphorbiaceae species. PeerJ 2020, 8, e8251. [Google Scholar] [CrossRef] [PubMed] [Green Version]
  30. Hoch, B.; Maier, R.M.; Appel, K.; Igloi, G.L.; Kössel, H. Editing of a chloroplast mRNA by creation of an initiation codon. Nature 1991, 353, 178–180. [Google Scholar] [CrossRef]
  31. Kuroda, H.; Suzuki, H.; Kusumegi, T.; Hirose, T.; Yukawa, Y.; Sugiura, M. Translation of psbC mRNAs Starts from the Downstream GUG, not the Upstream AUG, and Requires the Extended Shine–Dalgarno Sequence in Tobacco Chloroplasts. Plant Cell Physiol. 2007, 48, 1374–1378. [Google Scholar] [CrossRef] [Green Version]
  32. Hirose, T.; Sugiura, M. Both RNA editing and RNA cleavage are required for translation of tobacco chloroplast ndhD mRNA: A possible regulatory mechanism for the expression of a chloroplast operon consisting of functionally unrelated genes. EMBO J. 1997, 16, 6804–6811. [Google Scholar] [CrossRef]
  33. Po, L.Q.; Zhong, X.Q. Codon usage in the chloroplast genome of rice (Oryza sativa L. ssp. japonica). Acta Agron. Sin. 2004, 30, 1220–1224. [Google Scholar]
  34. George, B.; Bhatt, B.S.; Awasthi, M.; George, B.; Singh, A.K. Comparative analysis of microsatellites in chloroplast genomes of lower and higher plants. Curr. Genet. 2015, 61, 665–677. [Google Scholar] [CrossRef] [PubMed]
  35. Dong, F.; Lin, Z.; Lin, J.; Ming, R.; Zhang, W. Chloroplast genome of rambutan and comparative analyses in Sapindaceae. Plants 2021, 10, 283. [Google Scholar] [CrossRef] [PubMed]
  36. Xue, S.; Shi, T.; Luo, W.; Ni, X.; Iqbal, S.; Ni, Z.; Huang, X.; Yao, D.; Shen, Z.; Gao, Z. Comparative analysis of the complete chloroplast genome among Prunus mume, P. armeniaca, and P. salicina. Hortic. Res. 2019, 6, 89. [Google Scholar] [CrossRef] [PubMed] [Green Version]
  37. Ferrarini, M.; Moretto, M.; Ward, J.A.; Šurbanovski, N.; Stevanović, V.; Giongo, L.; Viola, R.; Cavalieri, D.; Velasco, R.; Cestaro, A. An evaluation of the PacBio RS platform for sequencing and de novo assembly of a chloroplast genome. BMC Genom. 2013, 14, 670. [Google Scholar] [CrossRef] [Green Version]
  38. Shearman, J.R.; Sonthirod, C.; Naktang, C.; Sangsrakru, D.; Yoocha, T.; Chatbanyong, R.; Vorakuldumrongchai, S.; Chusri, O.; Tangphatsornruang, S.; Pootakham, W. Assembly of the durian chloroplast genome using long PacBio reads. Sci. Rep. 2020, 10, 15980. [Google Scholar] [CrossRef]
  39. Fahrenkrog, A.M.; Matsumoto, G.; Toth, K.; Jokipii-Lukkari, S.; Salo, H.M.; Häggman, H.; Benevenuto, J.; Munoz, P. Chloroplast genome assemblies and comparative analyses of major Vaccinium berry crops. bioRxiv 2022, 481500. [Google Scholar] [CrossRef]
  40. Wu, Z.; Gui, S.; Quan, Z.; Pan, L.; Wang, S.; Ke, W.; Liang, D.; Ding, Y. A precise chloroplast genome of Nelumbo nucifera (Nelumbonaceae) evaluated with Sanger, Illumina MiSeq, and PacBio RS II sequencing platforms: Insight into the plastid evolution of basal eudicots. BMC Plant Biol. 2014, 14, 289. [Google Scholar] [CrossRef] [Green Version]
  41. Zhu, A.; Guo, W.; Gupta, S.; Fan, W.; Mower, J.P. Evolutionary dynamics of the plastid inverted repeat: The effects of expansion, contraction, and loss on substitution rates. New Phytol. 2016, 209, 1747–1756. [Google Scholar] [CrossRef] [Green Version]
  42. Wicke, S.; Schneeweiss, G.M.; de Pamphilis, C.W.; Müller, K.F.; Quandt, D. The evolution of the plastid chromosome in land plants: Gene content, gene order, gene function. Plant Mol. Biol. 2011, 76, 273–297. [Google Scholar] [CrossRef] [Green Version]
  43. Bock, R. Structure, function, and inheritance of plastid genomes. In Cell and Molecular Biology of Plastids; Springer: Berlin/Heidelberg, Germany, 2007; pp. 29–63. [Google Scholar]
  44. Li, Y.; Zhou, J.-G.; Chen, X.-L.; Cui, Y.-X.; Xu, Z.-C.; Li, Y.-H.; Song, J.-Y.; Duan, B.-Z.; Yao, H. Gene losses and partial deletion of small single-copy regions of the chloroplast genomes of two hemiparasitic Taxillus species. Sci. Rep. 2017, 7, 12834. [Google Scholar] [CrossRef] [PubMed] [Green Version]
  45. Qi, F.; Zhao, Y.; Zhao, N.; Wang, K.; Li, Z.; Wang, Y. Structural variation and evolution of chloroplast tRNAs in green algae. PeerJ 2021, 9, e11524. [Google Scholar] [CrossRef] [PubMed]
  46. Shaul, O. How introns enhance gene expression. Int. J. Biochem. Cell Biol. 2017, 91, 145–155. [Google Scholar] [CrossRef] [PubMed]
  47. Heyn, P.; Kalinka, A.T.; Tomancak, P.; Neugebauer, K.M. Introns and gene expression: Cellular constraints, transcriptional regulation, and evolutionary consequences. Bioessays 2015, 37, 148–154. [Google Scholar] [CrossRef]
  48. Liu, L.; Wang, Y.; He, P.; Li, P.; Lee, J.; Soltis, D.E.; Fu, C. Chloroplast genome analyses and genomic resource development for epilithic sister genera Oresitrophe and Mukdenia (Saxifragaceae), using genome skimming data. BMC Genom. 2018, 19, 235. [Google Scholar] [CrossRef] [Green Version]
  49. Downie, S.R.; Olmstead, R.G.; Zurawski, G.; Soltis, D.E.; Soltis, P.S.; Watson, J.C.; Palmer, J.D. Six independent losses of the chloroplast DNA rpl2 intron in dicotyledons: Molecular and phylogenetic implications. Evolution 1991, 45, 1245–1259. [Google Scholar] [CrossRef]
  50. Haberle, R.C.; Fourcade, H.M.; Boore, J.L.; Jansen, R.K. Extensive rearrangements in the chloroplast genome of Trachelium caeruleum are associated with repeats and tRNA genes. J. Mol. Evol. 2008, 66, 350–361. [Google Scholar] [CrossRef]
  51. Ogoma, C.A.; Liu, J.; Stull, G.W.; Wambulwa, M.C.; Oyebanji, O.; Milne, R.I.; Monro, A.K.; Zhao, Y.; Li, D.-Z.; Wu, Z.-Y. Deep insights into the plastome evolution and phylogenetic relationships of the tribe Urticeae (Family urticaceae). Front. Plant Sci. 2022, 13, 870949. [Google Scholar] [CrossRef]
  52. Yue, B.; Shi, J. The complete chloroplast genome sequence of Garcinia anomala (Clusiaceae) from Yunnan Province, China. Mitochondrial DNA Part B 2021, 6, 1899–1900. [Google Scholar] [CrossRef]
  53. Alqahtani, A.A.; Jansen, R.K. The evolutionary fate of rpl32 and rps16 losses in the Euphorbia schimperi (Euphorbiaceae) plastome. Sci. Rep. 2021, 11, 7466. [Google Scholar] [CrossRef]
  54. Yang, D.; Qiu, Q.; Xu, L.; Xu, Y.; Wang, Y. The complete chloroplast genome sequence of Garcinia pedunculata. Mitochondrial DNA Part B 2020, 5, 220–221. [Google Scholar] [CrossRef] [PubMed] [Green Version]
  55. Jin, D.-M.; Jin, J.-J.; Yi, T.-S. Plastome structural conservation and evolution in the clusioid clade of Malpighiales. Sci. Rep. 2020, 10, 9091. [Google Scholar] [CrossRef] [PubMed]
  56. Millen, R.S.; Olmstead, R.G.; Adams, K.L.; Palmer, J.D.; Lao, N.T.; Heggie, L.; Kavanagh, T.A.; Hibberd, J.M.; Gray, J.C.; Morden, C.W. Many parallel losses of infA from chloroplast DNA during angiosperm evolution with multiple independent transfers to the nucleus. Plant Cell 2001, 13, 645–658. [Google Scholar] [CrossRef] [PubMed] [Green Version]
  57. Park, S.; Jansen, R.K.; Park, S. Complete plastome sequence of Thalictrum coreanum (Ranunculaceae) and transfer of the rpl32 gene to the nucleus in the ancestor of the subfamily Thalictroideae. BMC Plant Biol. 2015, 15, 40. [Google Scholar] [CrossRef] [Green Version]
  58. Ramage, C.M.; Sando, L.; Peace, C.P.; Carroll, B.J.; Drew, R.A. Genetic diversity revealed in the apomictic fruit species Garcinia mangostana L.(mangosteen). Euphytica 2004, 136, 1–10. [Google Scholar] [CrossRef]
  59. Sando, L.; Peace, C.; Ramage, C.; Carrol, B.; Drew, R. Assessment of genetic diversity in Australian-grown mangosteen (Garcinia mangostana L.) and its wild relatives. In Proceedings of the II International Symposium on Biotechnology of Tropical and Subtropical Species; ISHS Acta Horticulturae 692; ISHS: Taipei, Taiwan, 2001; pp. 143–152. [Google Scholar]
  60. Sobir, S.; Poerwanto, R.; Santosa, E.; Sinaga, S.; Mansyah, E. Genetic variability in apomictic mangosteen (Garcinia mangostana) and its close relatives (Garcinia spp.) based on ISSR markers. Biodivers. J. Biol. Divers. 2011, 12, 59–63. [Google Scholar] [CrossRef]
  61. Zhu, M.; Feng, P.; Ping, J.; Li, J.; Su, Y.; Wang, T. Phylogenetic significance of the characteristics of simple sequence repeats at the genus level based on the complete chloroplast genome sequences of Cyatheaceae. Ecol. Evol. 2021, 11, 14327–14340. [Google Scholar] [CrossRef]
  62. Alzahrani, D.A.; Yaradua, S.S.; Albokhari, E.J.; Abba, A. Complete chloroplast genome sequence of Barleria prionitis, comparative chloroplast genomics and phylogenetic relationships among Acanthoideae. BMC Genom. 2020, 21, 393. [Google Scholar] [CrossRef]
  63. Asaf, S.; Ahmad, W.; Al-Harrasi, A.; Khan, A.L. Uncovering the first complete plastome genomics, comparative analyses, and phylogenetic dispositions of endemic medicinal plant Ziziphus hajarensis (Rhamnaceae). BMC Genom. 2022, 23, 83. [Google Scholar] [CrossRef]
  64. Zhan, X.; Zhang, Z.; Zhang, Y.; Gao, Y.; Jin, Y.; Shen, C.; Wang, H.; Feng, S. Complete Plastome of Physalis angulata var. villosa, Gene Organization, Comparative Genomics and Phylogenetic Relationships among Solanaceae. Genes 2022, 13, 2291. [Google Scholar] [CrossRef]
  65. Guo, Y.-Y.; Yang, J.-X.; Li, H.-K.; Zhao, H.-S. Chloroplast genomes of two species of Cypripedium: Expanded genome size and proliferation of AT-biased repeat sequences. Front. Plant Sci. 2021, 12, 609729. [Google Scholar] [CrossRef] [PubMed]
  66. Dunn, M.J.; Anderson, M.Z. To repeat or not to repeat: Repetitive sequences regulate genome stability in Candida albicans. Genes 2019, 10, 866. [Google Scholar] [CrossRef] [PubMed] [Green Version]
  67. Yao, J.; Zhao, F.; Xu, Y.; Zhao, K.; Quan, H.; Su, Y.; Hao, P.; Liu, J.; Yu, B.; Yao, M. Complete chloroplast genome sequencing and phylogenetic analysis of two Dracocephalum plants. BioMed. Res. Int. 2020, 2020, 4374801. [Google Scholar] [CrossRef] [PubMed]
  68. Huang, J.; Yang, X.; Zhang, C.; Yin, X.; Liu, S.; Li, X. Development of chloroplast microsatellite markers and analysis of chloroplast diversity in Chinese jujube (Ziziphus jujuba Mill.) and wild jujube (Ziziphus acidojujuba Mill.). PLoS ONE 2015, 10, e0134519. [Google Scholar] [CrossRef]
  69. Park, H.; Kim, C.; Lee, Y.M.; Kim, J.H. Development of chloroplast microsatellite markers for the endangered Maianthemum bicolor (Asparagaceae s.l.). Appl. Plant Sci. 2016, 4, 1600032. [Google Scholar] [CrossRef]
  70. Bock, R.; Knoop, V. Genomics of Chloroplasts and Mitochondria; Springer Science & Business Media: Berlin, Germany, 2012; Volume 35. [Google Scholar]
  71. Chen, H.; Shao, J.; Zhang, H.; Jiang, M.; Huang, L.; Zhang, Z.; Yang, D.; He, M.; Ronaghi, M.; Luo, X. Sequencing and analysis of Strobilanthes cusia (Nees) Kuntze chloroplast genome revealed the rare simultaneous contraction and expansion of the inverted repeat region in angiosperm. Front. Plant Sci. 2018, 9, 324. [Google Scholar] [CrossRef] [Green Version]
  72. Jo, I.-H.; Han, S.; Shim, D.; Ryu, H.; Hyun, T.K.; Lee, Y.; Kim, D.; So, Y.-S.; Chung, J.-W. Complete Chloroplast Genome of the Inverted Repeat-Lacking Species Vicia bungei and Development of Polymorphic Simple Sequence Repeat Markers. Front. Plant Sci. 2022, 13, 1571. [Google Scholar] [CrossRef]
  73. Kim, K.-J.; Lee, H.-L. Complete chloroplast genome sequences from Korean ginseng (Panax schinseng Nees) and comparative analysis of sequence evolution among 17 vascular plants. DNA Res. 2004, 11, 247–261. [Google Scholar] [CrossRef]
  74. Jo, S.; Kim, Y.-K.; Cheon, S.-H.; Fan, Q.; Kim, K.-J. Characterization of 20 complete plastomes from the tribe Laureae (Lauraceae) and distribution of small inversions. PLoS ONE 2019, 14, e0224622. [Google Scholar] [CrossRef]
  75. Catalano, S.A.; Saidman, B.O.; Vilardi, J.C. Evolution of small inversions in chloroplast genome: A case study from a recurrent inversion in angiosperms. Cladistics 2009, 25, 93–104. [Google Scholar] [CrossRef]
  76. Goulet, B.E.; Roda, F.; Hopkins, R. Hybridization in plants: Old ideas, new techniques. Plant Physiol. 2017, 173, 65–78. [Google Scholar] [CrossRef] [PubMed] [Green Version]
  77. Walker, B.J.; Abeel, T.; Shea, T.; Priest, M.; Abouelliel, A.; Sakthikumar, S.; Cuomo, C.A.; Zeng, Q.; Wortman, J.; Young, S.K.; et al. Pilon: An integrated tool for comprehensive microbial variant detection and genome assembly improvement. PLoS ONE 2014, 9, e112963. [Google Scholar] [CrossRef] [PubMed]
  78. Jin, J.-J.; Yu, W.-B.; Yang, J.-B.; Song, Y.; de Pamphilis, C.W.; Yi, T.-S.; Li, D.-Z. GetOrganelle: A fast and versatile toolkit for accurate de novo assembly of organelle genomes. Genome Biol. 2020, 21, 241. [Google Scholar] [CrossRef] [PubMed]
  79. Kajitani, R.; Toshimoto, K.; Noguchi, H.; Toyoda, A.; Ogura, Y.; Okuno, M.; Yabana, M.; Harada, M.; Nagayasu, E.; Maruyama, H. Efficient de novo assembly of highly heterozygous genomes from whole-genome shotgun short reads. Genome. Res. 2014, 24, 1384–1395. [Google Scholar] [CrossRef] [PubMed] [Green Version]
  80. Li, H. Aligning sequence reads, clone sequences and assembly contigs with BWA-MEM. arXiv 2013, arXiv:1303.3997. [Google Scholar]
  81. Li, H.; Handsaker, B.; Wysoker, A.; Fennell, T.; Ruan, J.; Homer, N.; Marth, G.; Abecasis, G.; Durbin, R. The sequence alignment/map format and SAMtools. Bioinformatics 2009, 25, 2078–2079. [Google Scholar] [CrossRef] [Green Version]
  82. Tillich, M.; Lehwark, P.; Pellizzer, T.; Ulbricht-Jones, E.S.; Fischer, A.; Bock, R.; Greiner, S. GeSeq—Versatile and accurate annotation of organelle genomes. Nucleic Acids Res. 2017, 45, W6–W11. [Google Scholar] [CrossRef] [Green Version]
  83. Greiner, S.; Lehwark, P.; Bock, R. OrganellarGenomeDRAW (OGDRAW) version 1.3.1: Expanded toolkit for the graphical visualization of organellar genomes. Nucleic Acids Res. 2019, 47, W59–W64. [Google Scholar] [CrossRef] [Green Version]
  84. Beier, S.; Thiel, T.; Münch, T.; Scholz, U.; Mascher, M. MISA-web: A web server for microsatellite prediction. Bioinformatics 2017, 33, 2583–2585. [Google Scholar] [CrossRef] [Green Version]
  85. Kurtz, S.; Choudhuri, J.V.; Ohlebusch, E.; Schleiermacher, C.; Stoye, J.; Giegerich, R. REPuter: The manifold applications of repeat analysis on a genomic scale. Nucleic Acids Res. 2001, 29, 4633–4642. [Google Scholar] [CrossRef] [Green Version]
  86. Kumar, S.; Stecher, G.; Li, M.; Knyaz, C.; Tamura, K. MEGA X: Molecular evolutionary genetics analysis across computing platforms. Mol. Biol. Evol. 2018, 35, 1547–1549. [Google Scholar] [CrossRef] [PubMed]
  87. Harman, G.E.; Kubicek, C.P. Trichoderma and Gliocladium: Basic Biology, Taxonomy and Genetics; CRC Press: Boca Raton, FL, USA, 2002; Volume 1. [Google Scholar]
  88. Frazer, K.A.; Pachter, L.; Poliakov, A.; Rubin, E.M.; Dubchak, I. VISTA: Computational tools for comparative genomics. Nucleic Acids Res. 2004, 32, W273–W279. [Google Scholar] [CrossRef] [PubMed] [Green Version]
  89. Brudno, M.; Do, C.B.; Cooper, G.M.; Kim, M.F.; Davydov, E.; Green, E.D.; Sidow, A.; Batzoglou, S.; Program, N.C.S. LAGAN and Multi-LAGAN: Efficient tools for large-scale multiple alignment of genomic DNA. Genome. Res. 2003, 13, 721–731. [Google Scholar] [CrossRef] [PubMed] [Green Version]
  90. Amiryousefi, A.; Hyvönen, J.; Poczai, P. IRscope: An online program to visualize the junction sites of chloroplast genomes. Bioinformatics 2018, 34, 3030–3031. [Google Scholar] [CrossRef] [PubMed]
  91. Darling, A.E.; Mau, B.; Perna, N.T. progressiveMauve: Multiple genome alignment with gene gain, loss and rearrangement. PLoS ONE 2010, 5, e11147. [Google Scholar] [CrossRef] [Green Version]
  92. Katoh, K.; Rozewicki, J.; Yamada, K.D. MAFFT online service: Multiple sequence alignment, interactive sequence choice and visualization. Brief. Bioinform. 2019, 20, 1160–1166. [Google Scholar] [CrossRef] [Green Version]
  93. Darriba, D.; Posada, D.; Kozlov, A.M.; Stamatakis, A.; Morel, B.; Flouri, T. ModelTest-NG: A new and scalable tool for the selection of DNA and protein evolutionary models. Mol. Biol. Evol. 2020, 37, 291–294. [Google Scholar] [CrossRef] [Green Version]
  94. Kozlov, A.M.; Darriba, D.; Flouri, T.; Morel, B.; Stamatakis, A. RAxML-NG: A fast, scalable and user-friendly tool for maximum likelihood phylogenetic inference. Bioinformatics 2019, 35, 4453–4455. [Google Scholar] [CrossRef] [Green Version]
Figure 1. The circular plastome of the G. mangostana variety Mesta and Manggis. Genes inside the circle are transcribed clockwise while genes outside the circle are transcribed anti-clockwise, as indicated by the gray arrows. The gray bars inside the circle represent the GC content of the sequence. Asterisks (*) indicate genes containing intron(s).
Plants 12 00930 g001
Figure 2. SSR analysis of six Garcinia species plastomes.
Plants 12 00930 g002
Figure 3. Long repeat analysis of six Garcinia species plastomes.
Plants 12 00930 g003
Figure 4. Comparison of genes on the borders of the LSC, SSC, and IR regions among six Garcinia plastomes and Erythroxylum novogranatense. Corresponding plastome size is shown on the left of each track. The intervals show the distance between the start and end coordinates of a particular gene from the junction sites, namely, JLB (LSC/IRb), JSB (SSC/IRb), JSA (SSC/IRa), and JLA (LSC/IRa). The sequence length in each region is annotated for genes spanning the junction sites.
Plants 12 00930 g004
Figure 5. Alignment visualization of Garcinia species using Mesta as a reference by using the mVista alignment program. CNS: conserved non-coding sequences; UTR: untranslated region. The gray arrows above the alignment indicate the direction of the gene transcription. The identity percentage (50–100%) was indicated at the right-side of the mVista plot.
Plants 12 00930 g005
Figure 6. Multiple alignment using E. novogranatense as a reference. Color bars indicate syntenic blocks, and the connecting line indicates the correspondence of blocks across plastomes. There was a small inversion (jade-colored region below the x-axis) between trnV-UAC and the atpE gene (indicated above the green and white horizontal bars, respectively) shared by all Garcinia species.
Plants 12 00930 g006
Figure 7. Phylogenetic tree (maximum likelihood) construction of 16 species (three varieties from G. mangostana) based on 74 protein-coding genes. The red outer line indicates order name, while the inner line indicates the family name.
Plants 12 00930 g007
Table 1. Summary statistics of plastomes from different Garcinia species.
SpeciesPlastome Size (bp)Size (bp)Number of Genes *GC Content (%)
LSCSSCIRAllProtein-CodingrRNAtRNAAllLSCSSCIR
G. anomala 156,77485,58617,08227,053128 (111)83 (77)8 (4)37 (30)36.133.530.342.1
G. gummi-gutta 156,20284,99617,08827,059127 (110)83 (77)8 (4)36 (29)36.233.530.342.1
G. mangostanaManggis156,58285,38517,13727,030128 (111)83 (77)8 (4)37 (30)36.233.630.242.2
Mesta156,58085,38317,13727,030128 (111)83 (77)8 (4)37 (30)36.233.630.242.2
Thailand158,17986,45817,70327,009128 (111)83 (77)8 (4)37 (30)36.133.530.142.2
G. oblongifolia 156,57785,39317,06427,060128 (111)83 (77)8 (4)37 (30)36.233.630.342.2
G. paucinervis 157,70285,98917,73726,988128 (111)83 (77)8 (4)37 (30)36.233.630.342.2
G. pedunculata 157,68885,99817,65627,017128 (111)83 (77)8 (4)37 (30)36.233.630.242.2
* Parentheses indicate the number of unique genes.
Table 2. List of annotated genes in plastomes of Mesta and Manggis.
FunctionGroupGene Name
Protein synthesis and DNA replicationTransfer RNAtrnA-UGC (2×), trnC-GCA, trnD-GUC, trnE-UUC, trnF-GAA, trnfM-CAU, trnG-GCC, trnH-GUG, trnK-UUU, trnI-GAU (2×), trnL-CAA (2×), trnL-UAA, trnL-UAG, trnM-CAU, trnI-CAU (2×), trnN-GUU (2×), trnP-UGG, trnQ-UUG, trnR-ACG (2×), trnR-UCU, trnS-CGA, trnS-GCU, trnS-GGA, trnS-UGA, trnT-GGU, trnT-UGU, trnV-GAC (2×), trnV-UAC, trnW-CCA, trnY-GUA
Ribosomal RNArrn16 (2×), rrn23 (2×), rrn4.5 (2×), rrn5 (2×)
Ribosomal protein small subunitrps2, rps3, rps4, rps7 (2×), rps8, rps11, rps12 (2×), rps14, rps15, rps16, rps18, rps19
Ribosomal protein large subunitrpl2 (2×), rpl14, rpl16, rpl20, rpl22, rpl23 (2×), rpl33, rpl36
Subunits of RNA polymeraserpoA, rpoB, rpoC1, rpoC2
PhotosynthesisPhotosystem IpsaA, psaB, psaC, psaI, psaJ
Photosystem IIpsbA, psbB, psbC, psbD, psbE, psbF, psbH, psbI, psbJ, psbK, psbL, psbM, psbT, psbZ
Cytochrome b6f complexpetA, petB, petD, petG, petL, petN
ATP synthaseatpA, atpB, atpE, atpF, atpH, atpI
NADH-dehydrogenasendhA, ndhB (2×), ndhC, ndhD, ndhE, ndhF, ndhG, ndhH, ndhI, ndhJ, ndhK
Large subunit RubiscorbcL
Miscellaneous groupPhotosystem II protein NpsbN
Acetyl-CoA carboxylaseaccD
Cytochrome c biogenesisccsA
MaturasematK
ATP-dependent proteaseclpP
Inner membrane proteincemA
Pseudogene unknown functionConserved hypothetical chloroplast ORFycf1, ycf2 (2×), ycf3, ycf4
Disclaimer/Publisher’s Note: The statements, opinions and data contained in all publications are solely those of the individual author(s) and contributor(s) and not of MDPI and/or the editor(s). MDPI and/or the editor(s) disclaim responsibility for any injury to people or property resulting from any ideas, methods, instructions or products referred to in the content.

