
Domestication Potential of Garcinia kola Heckel (Clusiaceae): Searching for Diversity in South Cameroon

 , ,
, ,  ,
, 
Abstract
1. Introduction
2. Results
2.1. Morphological Diversity
2.1.1. Tree Traits
2.1.2. Fruit Traits
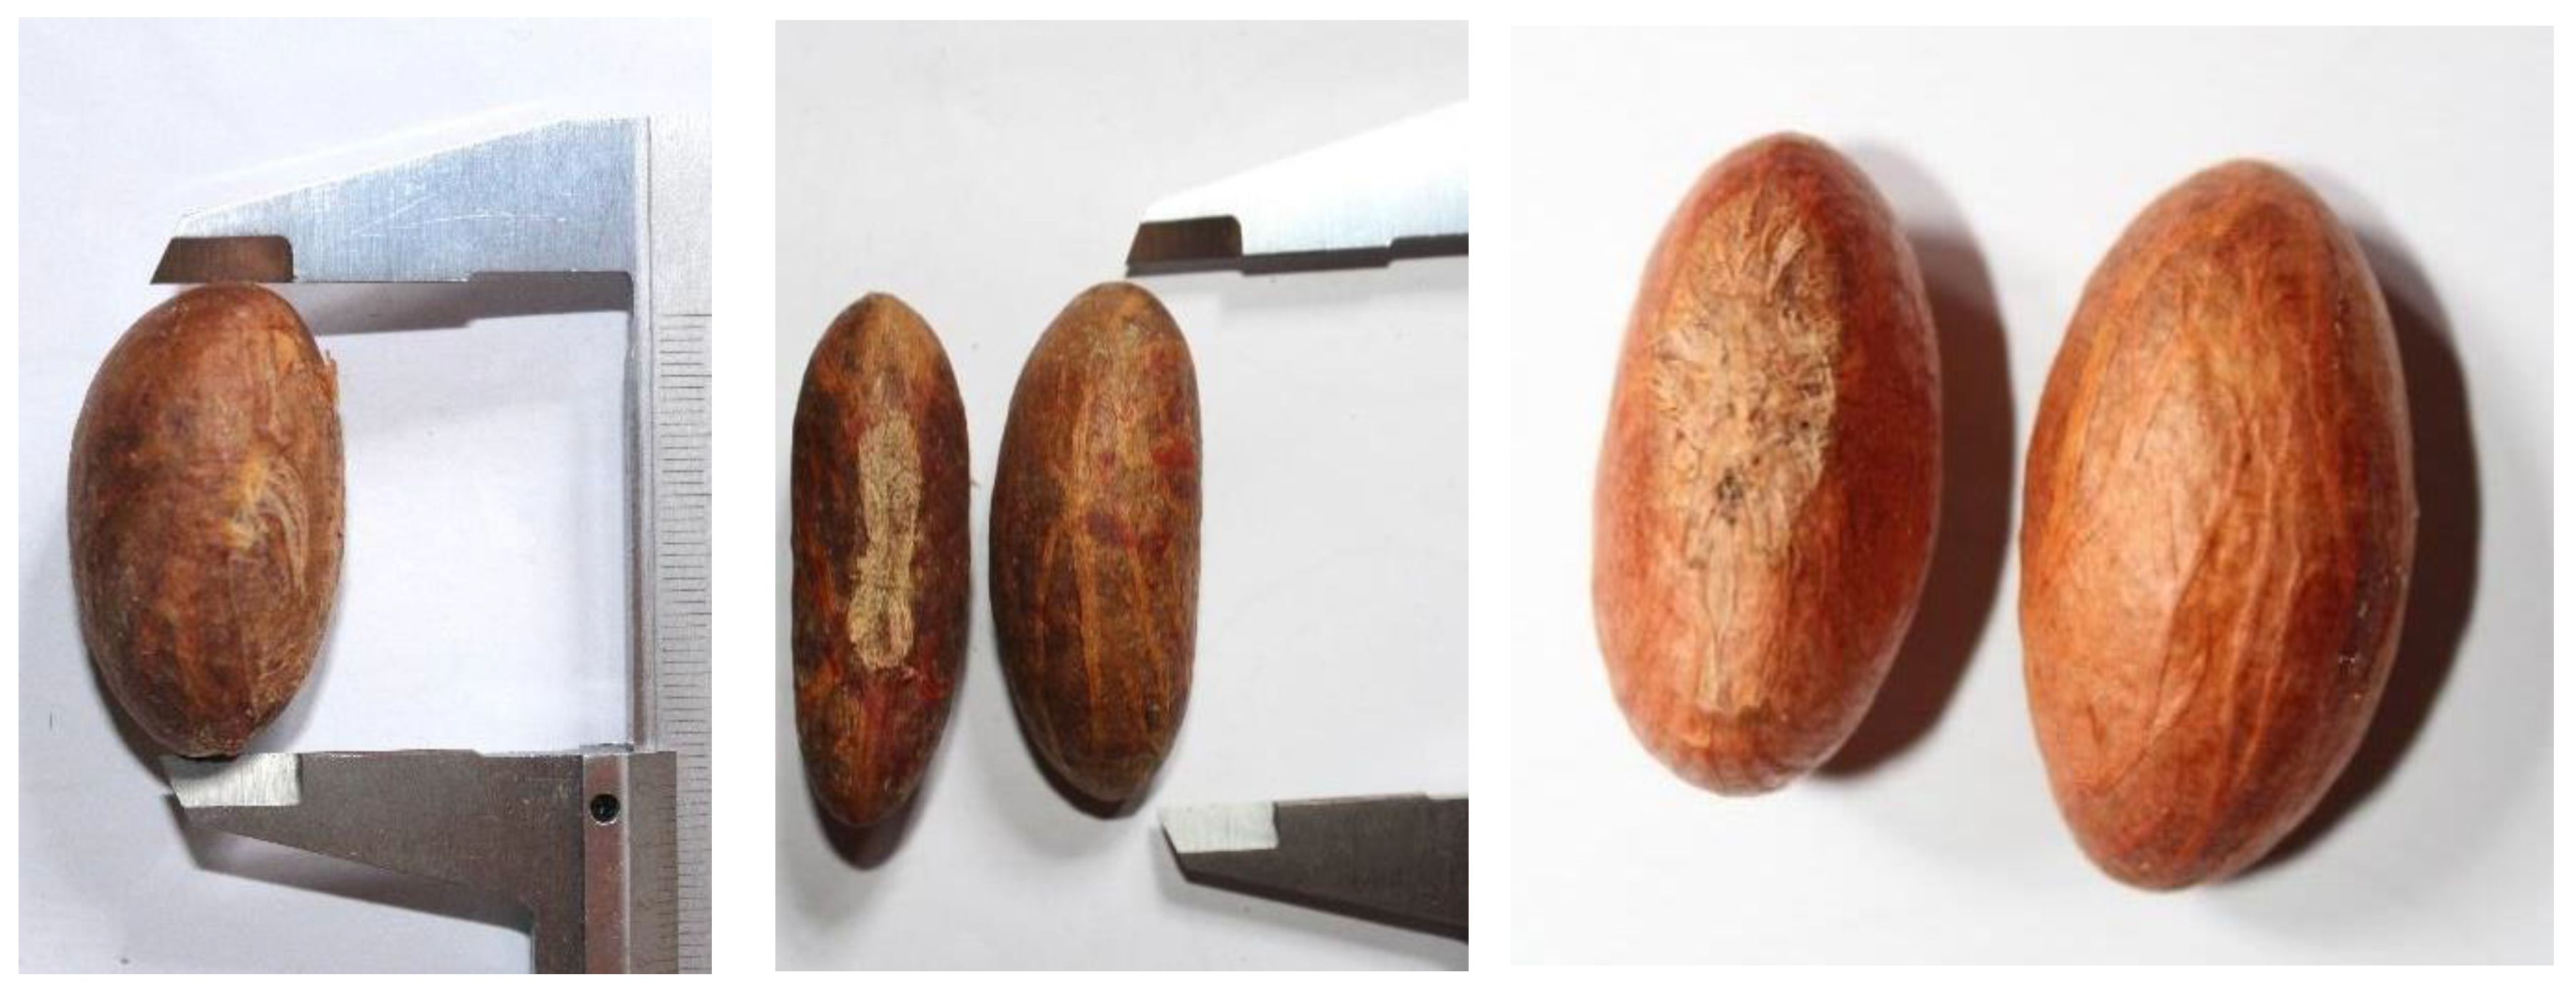
2.1.3. Seed Traits
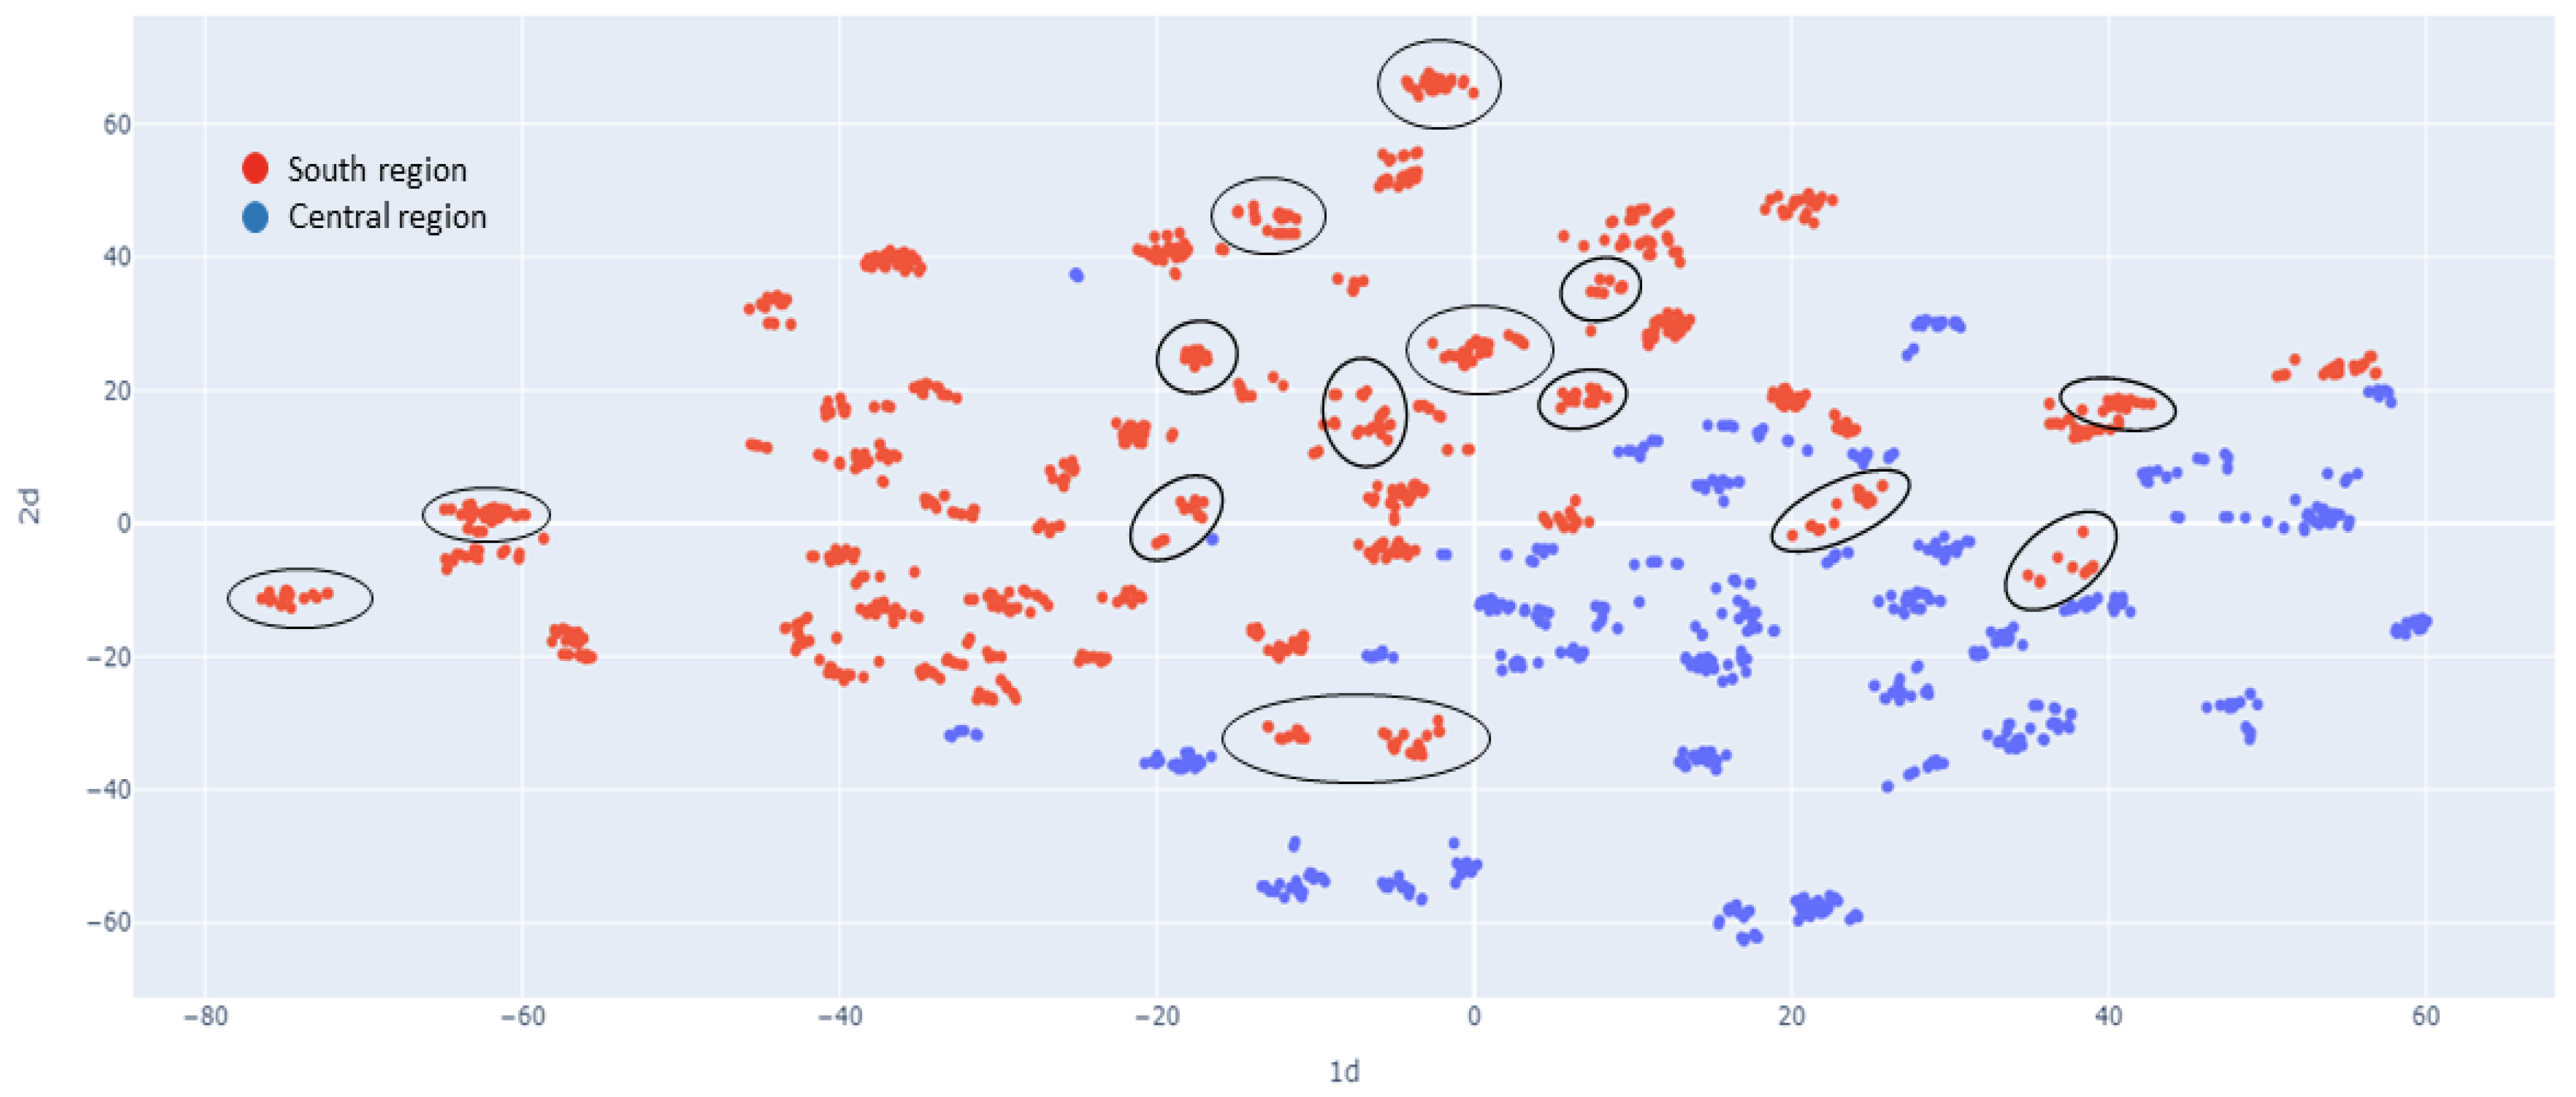
2.1.4. Population Structure
2.2. Genetic Diversity
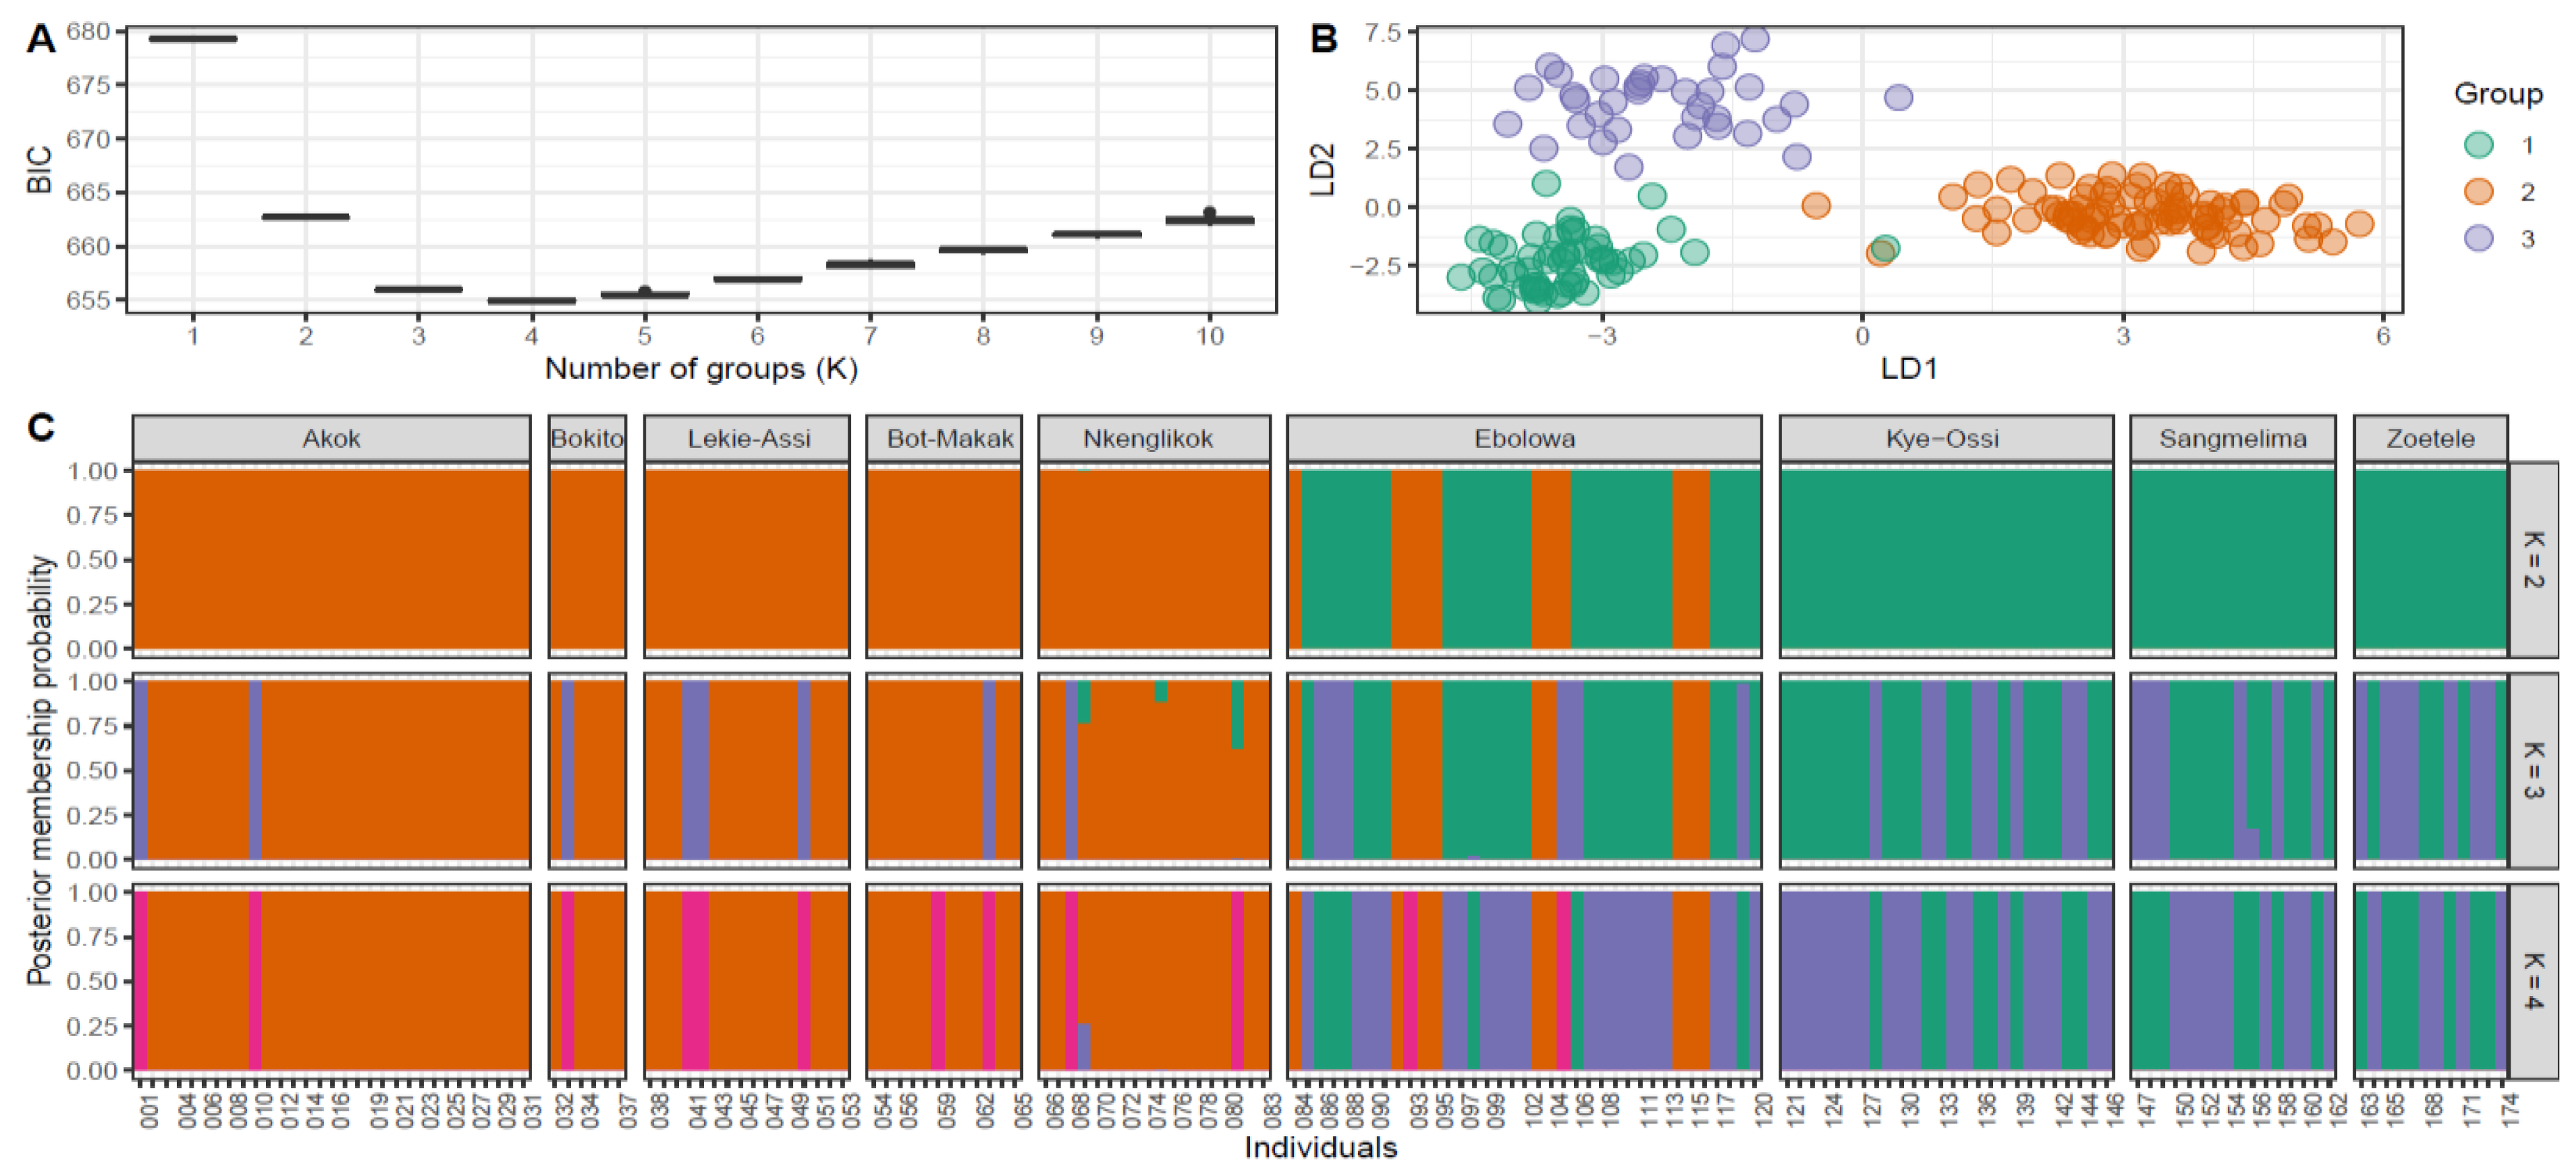
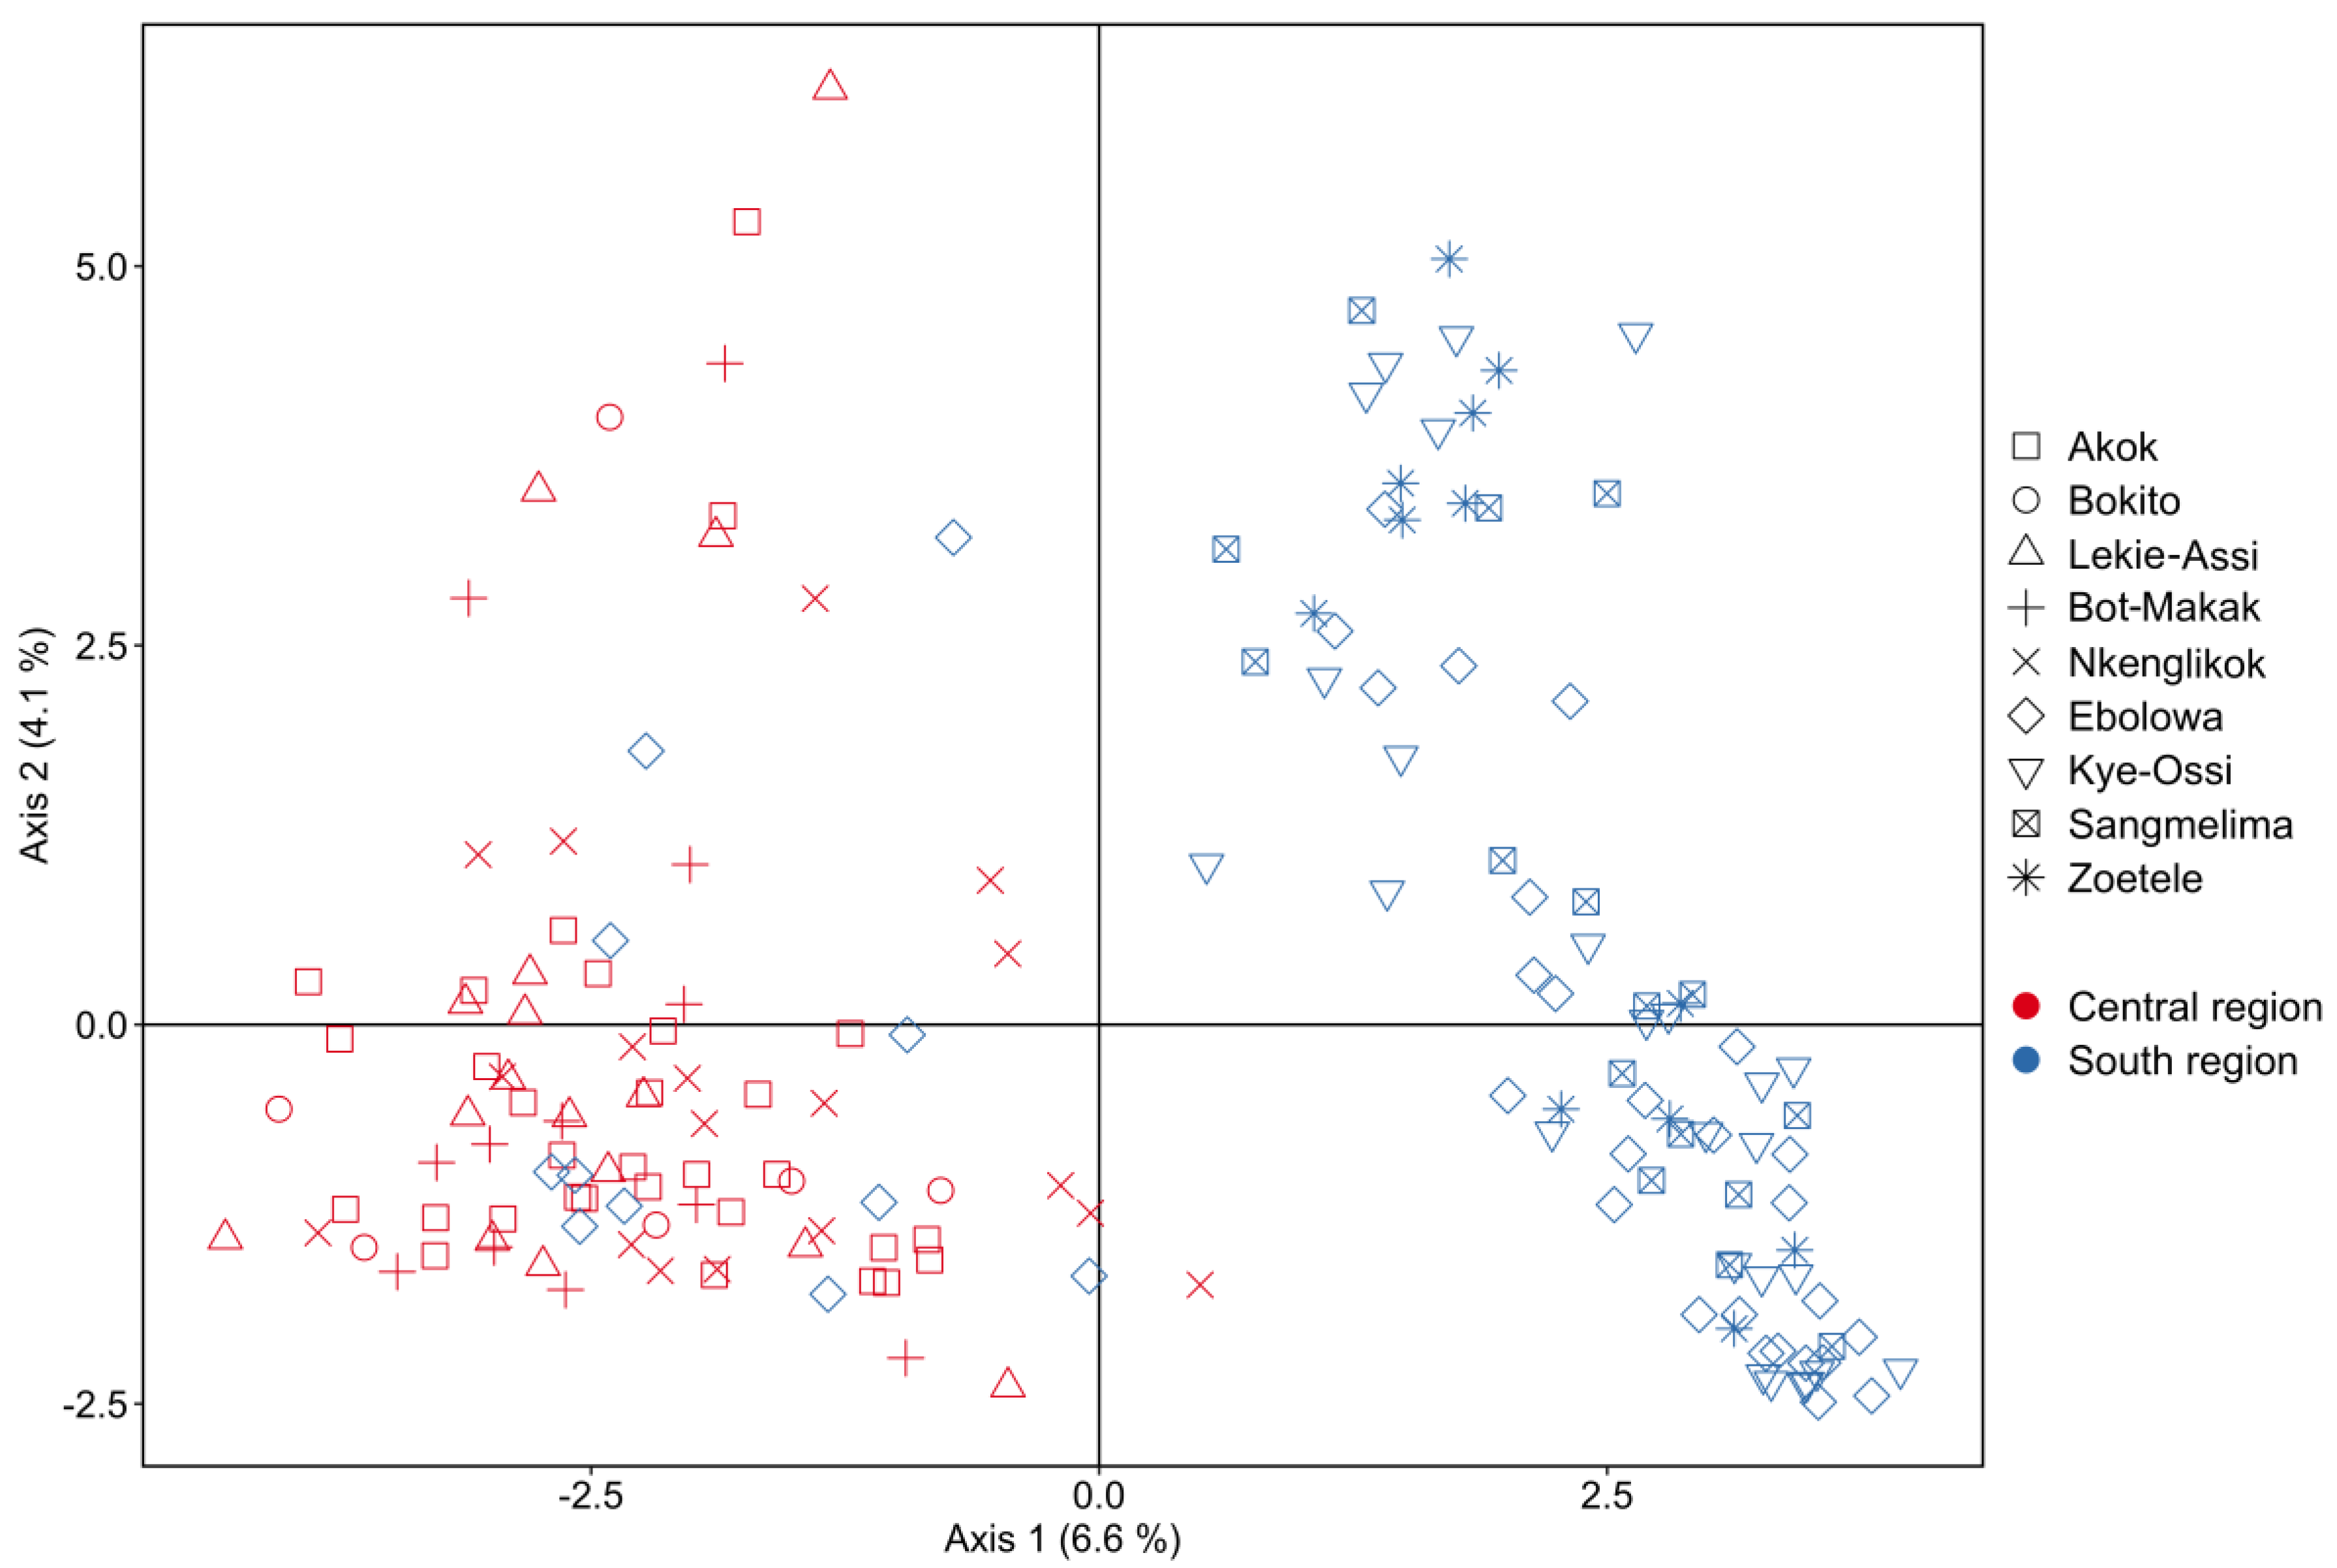
2.2.1. Population Structure
3. Discussion
3.1. Population Diversity and Structure
3.2. Implication for Domestication
3.3. Research Gaps and Future Recommendations
4. Materials and Methods
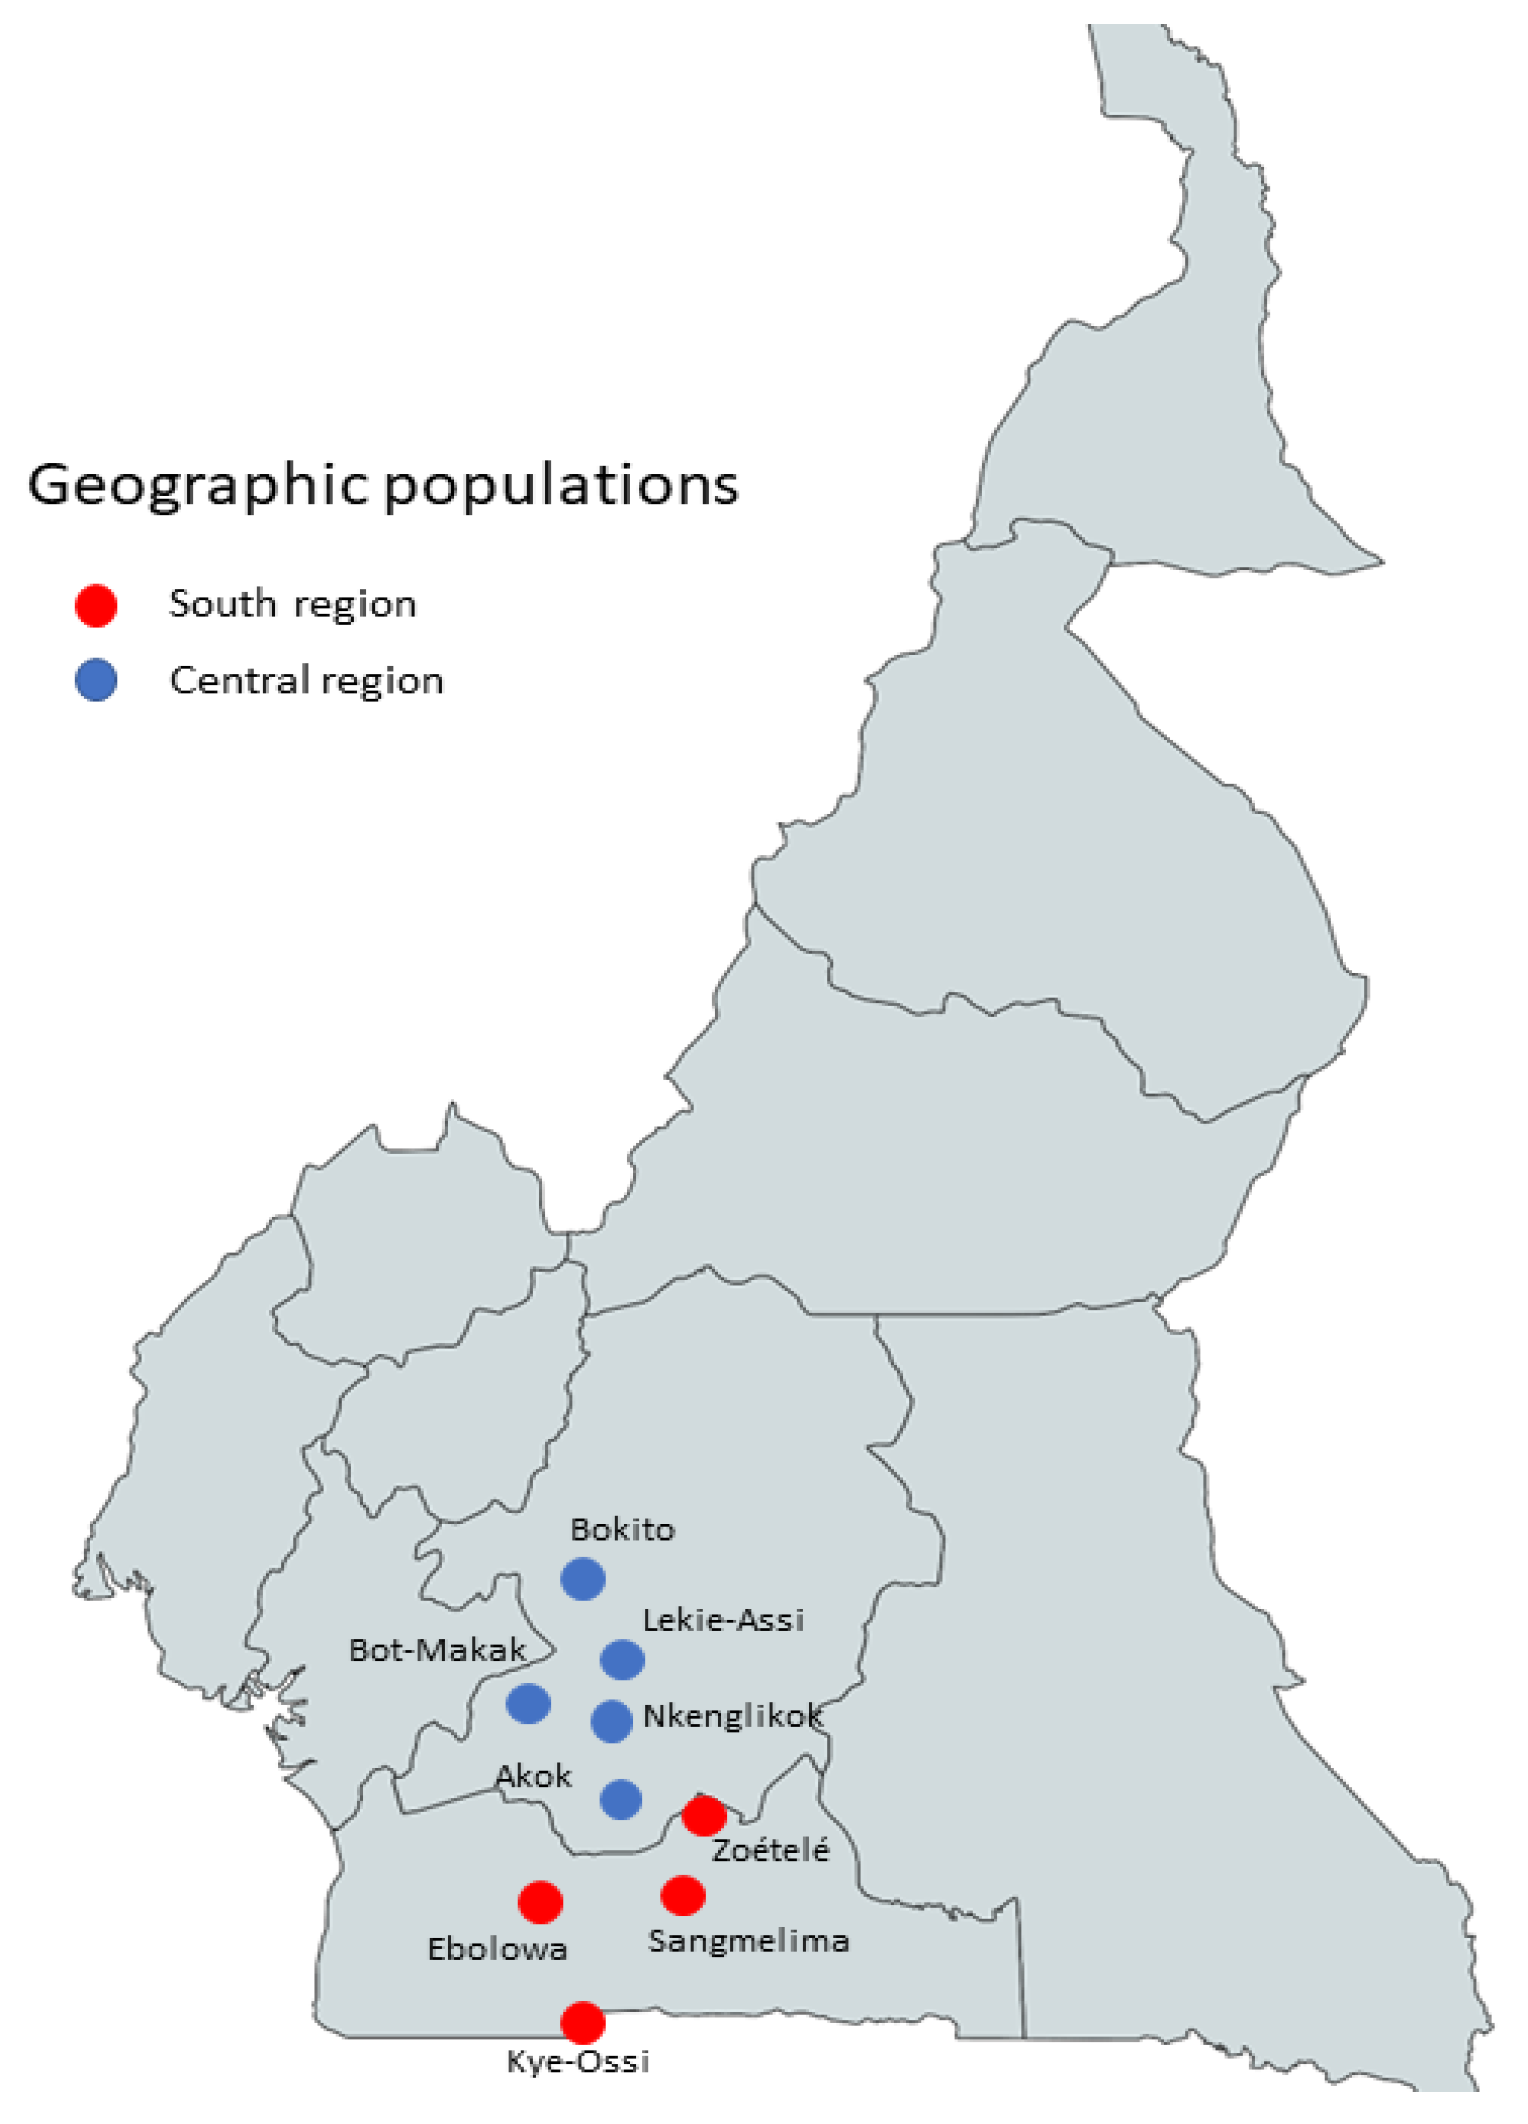
4.1. Study Site and Data Collection

| Geographic Population | Region | Genetic Diversity | Morphological Diversity | ||
|---|---|---|---|---|---|
| Trees | Fruits | Seeds | |||
| Akok | C | 31 | 30 | 193 | 444 |
| Bokito | C | 6 | 7 | 5 | 6 |
| Bot-Makak | C | 12 | 11 | 40 | 142 |
| Lekiasi | C | 16 | 16 | 52 | 295 |
| Nkenlikok | C | 18 | 17 | 119 | 285 |
| Total | C | 83 | 81 | 409 | 1172 |
| Ebolowa | S | 37 | 23 | 191 | 550 |
| Kye-Ossi | S | 26 | 20 | 179 | 437 |
| Sangmelima | S | 16 | 12 | 113 | 311 |
| Zoételé | S | 12 | 11 | 105 | 328 |
| Total | S | 91 | 66 | 588 | 1626 |
| Total | C, S | 174 | 147 | 997 | 2798 |
4.2. DNA Extraction and AFLP Analysis
4.3. Data Analysis
5. Conclusions
Supplementary Materials
Author Contributions
Funding
Institutional Review Board Statement
Informed Consent Statement
Data Availability Statement
Acknowledgments
Conflicts of Interest
References
- Agyili, J.; Sacande, M.; Koffi, E.; Peprah, T. Improving the Collection and Germination of West African Garcinia Kola Heckel Seeds. New For. 2007, 34, 269–279. [Google Scholar] [CrossRef]
- Yogom, B.T.; Avana-Tientcheu, M.-L.; Mboujda, M.F.M.; Momo, S.T.; Fonkou, T.; Tsobeng, A.; Barnaud, A.; Duminil, J. Ethnicity Differences in Uses and Management Practices of Bitter Kola Trees (Garcinia Kola) in Cameroon. Econ. Bot. 2020, 74, 429–444. [Google Scholar] [CrossRef]
- Dadjo, C.; Toyi, M.; Nyende, A.B.; Salako, K.V.; Assogbadjo, A.E. Impact of Land-Use on Tree and Fruit Morphometric Variation of the Bitter Kola (Garcinia Kola Heckel) in Benin: Insight for Domestication and Production. J. Hortic. For. 2018, 10, 127–134. [Google Scholar] [CrossRef]
- PROTA. Garcinia kola Heckel. Available online: https://prota4u.org/database/protav8.asp?g=psk&p=Garcinia+kola+Heckel (accessed on 26 October 2022).
- WFO; Beech, E.; Hills, R.; Rivers, M.C.; Oldfield, S.F.; Smith, P.P. World Flora Online, Garcinia kola Heckel 2022. Available online: http://www.worldfloraonline.org/taxon/wfo-0000694394 (accessed on 26 October 2022).
- Kanmegne, G.; Mbouobda, H.D.; Temfack, B.; Koffi, E.K.; Omokolo, D.N. Impact of Biochemical and Morphological Variations on Germination Traits in Garcinia Kola Heckel Seeds Collected from Cameroon. Res. J. Seed Sci. 2010, 3, 82–92. [Google Scholar] [CrossRef]
- Yakubu, F.B.; Adejoh, O.P.; Ogunade, J.O.; Igboanugo, A.B.I. Vegetative Propagation of Garcinia kola (Heckel). World J. Agric. Sci. 2014, 10, 85–90. [Google Scholar]
- Tshibangu, P.T.; Kapepula, P.M.; Kapinga, M.J.K.; Lupona, H.K.; Ngombe, N.K.; Kalenda, D.T.; Jansen, O.; Wauters, J.N.; Tits, M.; Angenot, L.; et al. Fingerprinting and Validation of a LC-DAD Method for the Analysis of Biflavanones in Garcinia Kola -Based Antimalarial Improved Traditional Medicines. J. Pharm. Biomed. Anal. 2016, 128, 382–390. [Google Scholar] [CrossRef] [PubMed]
- Iwu, M.M. Handbook of African Medicinal Plants; CRC Press: Boca Raton, FL, USA, 2014. [Google Scholar]
- Oluwatosin, A.; Tolulope, A.; Ayokulehin, K.; Patricia, O.; Aderemi, K.; Catherine, F.; Olusegun, A. Antimalarial Potential of Kolaviron, a Biflavonoid from Garcinia Kola Seeds, against Plasmodium Berghei Infection in Swiss Albino Mice. Asian Pac. J. Trop. Med. 2014, 7, 97–104. [Google Scholar] [CrossRef]
- Kagbo, H.D.; Ejebe, D.E. Phytochemistry and Preliminary Toxicity Studies of the Methanol Extract of the Stem Bark of Garcinia kola (Heckel). Internet J. Toxicol. 2010, 7, 1–18. [Google Scholar]
- Indabawa, I.; Arzai, A. Antibacterial Activity of Garcinia Kola and Cola Nitida Seed Extracts. Bayero J. Pure Appl. Sci. 2011, 4, 52–55. [Google Scholar] [CrossRef]
- Ijomone, O.M.; Nwoha, P.U.; Olaibi, O.K.; Obi, A.U.; Alese, M.O. Neuroprotective Effects of Kolaviron, a Biflavonoid Complex of Garcinia kola, on Rats Hippocampus against Methamphetamine-Induced Neurotoxicity. Maced. J. Med. Sci. 2012, 5, 10–16. [Google Scholar] [CrossRef]
- Awono, A.; Atyi, R.E.; Foundjem-Tita, D.; Levang, P. Vegetal Non-Timber Forest Products in Cameroon, Contribution to the National Economy. Int. For. Rev. 2016, 18, 66–77. [Google Scholar] [CrossRef]
- IUCN. The IUCN Red List of Threatened Species; Garcinia Kola: Cheek, M.; 2004; E.T34715A9884648 2022. Available online: https://www.iucnredlist.org/species/34715/9884648 (accessed on 26 October 2022).
- Olawuyi, O.J.; Azeez, A.A. Molecular Evaluation of; Garcinia Kola Heckel Accessions Using RAPD Markers. Am. J. Mol. Biol. 2019, 9, 41–51. [Google Scholar] [CrossRef]
- Manourova, A.; Polesny, Z.; Lojka, B.; Degrande, A.; Pribyl, O.; Van Damme, P.; Verner, V. Tracing the Tradition: Regional Differences in the Cultivation, Utilization, and Commercialization of Bitter Kola (Garcinia kola, Clusiaceae) in Cameroon. Econ. Bot. 2023, 1–15. [Google Scholar] [CrossRef]
- Leakey, R.R.B.; Tientcheu Avana, M.-L.; Awazi, N.P.; Assogbadjo, A.E.; Mabhaudhi, T.; Hendre, P.S.; Degrande, A.; Hlahla, S.; Manda, L. The Future of Food: Domestication and Commercialization of Indigenous Food Crops in Africa over the Third Decade (2012–2021). Sustainability 2022, 14, 2355. [Google Scholar] [CrossRef]
- Kouakou, K.L.; Dao, J.P.; Kouassi, K.L.; Beugré, M.M.; Koné, M.; Baudoin, J.-P.; Bi, Z.; Irié, A. Propagation of Garcinia Kola (Heckel) by Stem and Root Cutting. Silva Fenn. 2016, 50. [Google Scholar] [CrossRef]
- Dao, J.P.; Kouakou, K.L.; Kouakou, C.; Cherif, M.; Ouedraogo, M.H.; Koffi, K.K.; Bi, I.A.Z. Effect of Leafy and Leafless Greenwood, Softwood and Hardwood Cuttings Success of Garcinia Kola (Heckel). Agric. Sci. 2020, 11, 897. [Google Scholar] [CrossRef]
- Franzel, S.; Kindt, R. Species Priority Setting Procedures. In Agroforestry Tree Domestication: A primer; Dawson, I., Harwood, C., Jamnadass, R., Beniest, J., Eds.; World Agroforestry Centre: Nairobi, Kenya, 2012; pp. 36–45. [Google Scholar]
- Leakey, R.R.B. Agroforestry: Participatory Domestication of Trees. In Encyclopedia of Agriculture and Food Systems; Elsevier: Amsterdam, The Netherlands, 2014; pp. 253–269. [Google Scholar]
- Dah-Nouvlessounon, D.; Adoukonou-Sagbadja, H.; Nafan, D.; Adjanohoun, A.; Noumavo, P.A.; Sina, H.; Daouda, B.O.; Baba-Moussa, L. Morpho-Agronomic Variability of Three Kola Trees Accessions [Cola Nitida (Vent.) Schott et Endl., Cola Acuminata (P. Beauv.) Schott et Endl., and Garcinia Kola Heckel] from Southern Benin. Genet. Resour. Crop Evol. 2016, 63, 561–579. [Google Scholar] [CrossRef]
- Komenan, A.O.; Koffi, K.K.; Gbotto, A.A.; Kone, M.; Akaffou, D.S.; Kouakou, K.L.; Kouassi, K.I.; Zoro, B.I.A. Morphological Diversity and Distribution of Garcinia Kola Heckel (Clusiaceae) in Two Agro-Ecological Areas of Côte d’Ivoire. Am. J. Plant Sci. 2019, 10, 1871–1887. [Google Scholar] [CrossRef]
- Dadjo, C.; Nyende, A.B.; Yao, N.; Kiplangat, N.; Assogbadjo, A.E. Genome-Wide Genetic Diversity and Population Structure of Garcinia Kola (Heckel) in Benin Using DArT-Seq Technology. PLoS ONE 2020, 15, e0238984. [Google Scholar] [CrossRef]
- Akinnifesi, F.K.; Ajayi, O.C.; Sileshi, G.; Kadzere, I.; Akinnifesi, A.I. Domesticating and Commercializing Indigenous Fruit and Nut Tree Crops for Food Security and Income Generation in Sub-Saharan Africa. 2007. Available online: http://www.ndr.mw:8080/xmlui/handle/123456789/602 (accessed on 26 October 2022).
- Tchoundjeu, Z.; Degrande, A.; Leakey, R.R.; Nimino, G.; Kemajou, E.; Asaah, E.; Facheux, C.; Mbile, P.; Mbosso, C.; Sado, T. Impacts of Participatory Tree Domestication on Farmer Livelihoods in West and Central Africa. For. Trees Livelihoods 2010, 19, 217–234. [Google Scholar] [CrossRef]
- Manourova, A.; Leuner, O.; Tchoundjeu, Z.; Van Damme, P.; Verner, V.; Pribyl, O.; Lojka, B. Medicinal Potential, Utilization and Domestication Status of Bitter Kola (Garcinia Kola Heckel) in West and Central Africa. Forests 2019, 10, 124. [Google Scholar] [CrossRef]
- Moyers, B.T.; Morrell, P.L.; McKay, J.K. Genetic Costs of Domestication and Improvement. J. Hered. 2018, 109, 103–116. [Google Scholar] [CrossRef] [PubMed]
- Bélanger, J.; Pilling, D. The State of the World’s Biodiversity for Food and Agriculture.; Food and Agriculture Organization of the United Nations (FAO): Rome, Italy, 2019. [Google Scholar]
- Li, B.; Wang, A.; Zhang, P.; Li, W. Genetic Diversity and Population Structure of Endangered Glehnia Littoralis (Apiaceae) in China Based on AFLP Analysis. Biotechnol. Biotechnol. Equip. 2019, 33, 331–337. [Google Scholar] [CrossRef]
- Tang, S.; Dai, W.; Li, M.; Zhang, Y.; Geng, Y.; Wang, L.; Zhong, Y. Genetic Diversity of Relictual and Endangered Plant Abies Ziyuanensis (Pinaceae) Revealed by AFLP and SSR Markers. Genetica 2008, 133, 21–30. [Google Scholar] [CrossRef] [PubMed]
- Dávila-Lara, A.; Affenzeller, M.; Tribsch, A.; Díaz, V.; Comes, H.P. AFLP Diversity and Spatial Structure of Calycophyllum Candidissimum (Rubiaceae), a Dominant Tree Species of Nicaragua’s Critically Endangered Seasonally Dry Forest. Heredity 2017, 119, 275–286. [Google Scholar] [CrossRef] [PubMed]
- Rimlinger, A.; Avana, M.-L.; Awono, A.; Chakocha, A.; Gakwavu, A.; Lemoine, T.; Marie, L.; Mboujda, F.; Vigouroux, Y.; Johnson, V.; et al. Trees and Their Seed Networks: The Social Dynamics of Urban Fruit Trees and Implications for Genetic Diversity. PLoS ONE 2021, 16, e0243017. [Google Scholar] [CrossRef]
- Alessandri, S.; Cabrer, A.M.R.; Martìn, M.A.; Mattioni, C.; Pereira-Lorenzo, S.; Dondini, L. Genetic Characterization of Italian and Spanish Wild and Domesticated Chestnut Trees. Sci. Hortic. 2022, 295, 110882. [Google Scholar] [CrossRef]
- Wiersum, K.F. Domestication of Valuable Tree Species in Agroforestry Systems: Evolutionary Stages from Gathering to Breeding. Domest. Commer. Non-Timber For. Prod. 1996, 147–157. [Google Scholar]
- Waruhiu, A.N.; Kengue, J.; Atangana, A.R.; Tchoundjeu, Z.; Leakey, R.R. Domestication of Dacryodes Edulis. 2. Phenotypic Variation of Fruit Traits in 200 Trees from Four Populations in the Humid Lowlands of Cameroon. J. Food Agric. Environ. 2004, 2, 340–346. [Google Scholar]
- Leakey, R.R.B.; Page, T. The ‘Ideotype Concept’and Its Application to the Selection of Cultivars of Trees Providing Agroforestry Tree Products. For. Trees Livelihoods 2006, 16, 5–16. [Google Scholar] [CrossRef]
- Leakey, R.R.B.; Atangana, A.R.; Kengni, E.; Waruhiu, A.N.; Usoro, C.; Anegbeh, P.O.; Tchoundjeu, Z. Domestication of Dacryodes Edulis in West and Central Africa: Characterisation of Genetic Variation. For. Trees Livelihoods 2002, 12, 57–71. [Google Scholar] [CrossRef]
- PROTA4U. Available online: https://www.prota4u.org/database/search.asp (accessed on 19 March 2020).
- Kamga, Y.B.; Nguetsop, V.-F.; Anoumaa, M.; Mc, M.; Jr, N. Garcinia Kola (Guttiferae) in Tropical Rain Forests: Exploitation, Income Generation and Traditional Uses, in the East and Central Regions of Cameroon. J. Pharm. Chem. Biol. Sci. 2019, 7, 13–27. [Google Scholar]
- Delvaux, C.; Sinsin, B.; Darchambeau, F.; Van Damme, P. Recovery from Bark Harvesting of 12 Medicinal Tree Species in Benin, West Africa. J. Appl. Ecol. 2009, 46, 703–712. [Google Scholar] [CrossRef]
- Dawson, I.K.; Lengkeek, A.; Weber, J.C.; Jamnadass, R. Managing Genetic Variation in Tropical Trees: Linking Knowledge with Action in Agroforestry Ecosystems for Improved Conservation and Enhanced Livelihoods. Biodivers Conserv. 2009, 18, 969–986. [Google Scholar] [CrossRef]
- Dawson, I.K.; Hedley, P.E.; Guarino, L.; Jaenicke, H. Does Biotechnology Have a Role in the Promotion of Underutilised Crops? Food Policy 2009, 34, 319–328. [Google Scholar] [CrossRef]
- Clement, C.; De Cristo-Araújo, M.; Coppens D’Eeckenbrugge, G.; Alves Pereira, A.; Picanço-Rodrigues, D. Origin and Domestication of Native Amazonian Crops. Diversity 2010, 2, 72–106. [Google Scholar] [CrossRef]
- Weber, J.C.; Montes, C.S.; Vidaurre, H.; Dawson, I.K.; Simons, A.J. Participatory Domestication of Agroforestry Trees: An Example from the Peruvian Amazon. Dev. Pract. 2001, 11, 425–433. [Google Scholar] [CrossRef]
- Goma, H.C.; Rahim, K.; Nangendo, G.; Riley, J.; Stein, A. Participatory Studies for Agro-Ecosystem Evaluation. Agric. Ecosyst. Environ. 2001, 87, 179–190. [Google Scholar] [CrossRef]
- Kottek, M.; Grieser, J.; Beck, C.; Rudolf, B.; Rubel, F. World Map of the Köppen-Geiger Climate Classification Updated. Meteorol. Z. 2006, 15, 259–263. [Google Scholar] [CrossRef]
- Climate Data Climate Data for Cities Worldwide-Climate-Data.Org. Available online: https://en.climate-data.org/ (accessed on 28 June 2022).
- European Commission; Joint Research Centre. Soil Atlas of Africa; Union Européenne: Luxembourg, 2013; 176p. [Google Scholar]
- IPGRI. Descriptors for Mangosteen (Garcinia Mangostana); International Plant Genetic Resources Institute: Rome, Italy, 2003; ISBN 92-9043-587-9. [Google Scholar]
- Kehlenbeck, K.; Padulosi, S.; Alercia, A. Descriptors for Baobab (Adansonia digitata L.); Bioversity International, Rome, Italy and World Agroforestry Centre: Nairobi, Kenya, 2015. [Google Scholar]
- Bragg, D.C. Accurately Measuring the Height of (Real) Forest Trees. J. For. 2014, 112, 51–54. [Google Scholar] [CrossRef]
- Genebank Standards for Plant Genetic Resources for Food and Agriculture. Comm. Genet. Resour. Food Agric. 2014, 182.
- Vos, P.; Hogers, R.; Bleeker, M.; Reijans, M.; van de Lee, T.; Hornes, M.; Frijters, A.; Pot, J.; Peleman, J.; Kuiper, M. AFLP: A New Technique for DNA Fingerprinting. Nucleic Acids Res. 1995, 23, 4407–4414. [Google Scholar] [CrossRef] [PubMed]
- Van der Maaten, L.; Hinton, G. Visualizing Data Using T-SNE. J. Mach. Learn. Res. 2008, 9, 2579–2605. [Google Scholar]
- Vekemans, X.; Beauwens, T.; Lemaire, M.; Roldán-Ruiz, I. Data from Amplified Fragment Length Polymorphism (AFLP) Markers Show Indication of Size Homoplasy and of a Relationship between Degree of Homoplasy and Fragment Size. Mol. Ecol. 2002, 11, 139–151. [Google Scholar] [CrossRef]
- Kamvar, Z.N.; Tabima, J.F.; Grünwald, N.J. Poppr: An R Package for Genetic Analysis of Populations with Clonal or Partially Clonal Reproduction. PeerJ 2014, 2, e281. [Google Scholar] [CrossRef] [PubMed]
- Jombart, T. Adegenet: A R Package for the Multivariate Analysis of Genetic Markers. Bioinformatics 2008, 24, 1403–1405. [Google Scholar] [CrossRef]


| Geographic Population | Age (year) | Crown Diameter (m) | DBH (cm) | Tree Height (m) | Trunk Height (m) |
|---|---|---|---|---|---|
| Central region | |||||
| Akok | 58.4 ± 20.4 a | 9.70 ± 4.80 ab | 41.5 ± 14.7 d | 17.6 ± 4.47 a | 6.61 ± 6.19 a |
| Lekie-Assi | 45.9 ± 14.9 b | 9.66 ± 2.00 ab | 46.4 ± 8.06 d | 12.4 ± 3.63 ab | 3.92 ± 3.04 b |
| Bot-Makak | 49.4 ± 12.7 ab | 8.52 ± 1.86 b | 37.9 ± 9.45 d | 15.2 ± 4.53 ab | 4.92 ± 2.48 ab |
| Nkenglikok | 47.6 ± 21.1 b | 11.3 ± 2.14 a | 40.0 ± 12.4 d | 12.1 ± 2.16 ab | 3.95 ± 1.7 b |
| Total average C | 51.0 ± 21.6 S | 9.15 ± 3.68 NS | 39.3 ± 14.7 S | 14.5 ± 4.25 NS | 5.72 ± 4.42 NS |
| South region | |||||
| Ebolowa | 28.1 ± 12.9 c | 10.8 ± 3.00 a | 74.7 ± 39.2 c | 12.8 ± 3.04 ab | 4.66 ± 3.13 ab |
| Kye-Ossi | 24.2 ± 7.37 c | 8.52 ± 2.42 b | 70.0 ± 18.7 c | 11.8 ± 2.89 b | 3.72 ± 1.90 b |
| Sangmelima | 37.0 ± 8.02 bc | 9.26 ± 1.80 ab | 88.4 ± 5.99 b | 14.6 ± 1.81 ab | 5.92 ± 2.60 ab |
| Zoételé | 45.4 ± 10.4 b | 9.08 ± 2.52 ab | 108 ± 24.0 a | 13.9 ± 1.82 ab | 6.32 ± 2.05 a |
| Total average S | 33.2 ± 16.8 S | 9.55 ± 2.88 NS | 86.3 ± 40.1 S | 13.6 ± 3.44 NS | 5.46 ± 3.29 NS |
| Total average C, S | 43.0 ± 21.4 | 9.33 ± 3.34 | 60.4 ± 37.2 | 14.1 ± 3.93 | 5.60 ± 3.94 |
| Geographic Population | Fruit Diameter (cm) | Fruit Length (cm) | Fruit Weight (g) | No. of Seeds per Fruit | Seed Mass (g) | Seed Mass Ratio (%) |
|---|---|---|---|---|---|---|
| Central region | ||||||
| Akok | 7.09 ± 0.82 a | 6.95 ± 1.13 b | 171 ± 63.8 cd | 2.86 ± 0.94 bc | 13.0 ± 6.76 d | 7.65 ± 3.07 b |
| Lekie-Assi | 7.24 ± 1.02 a | 7.97 ± 1.39 b | 201 ± 72.4 ab | 2.78 ± 1.05 bc | 20.6 ± 9.37 a | 10.4 ± 3.17 a |
| Bot-Makak | 7.18 ± 0.90 a | 7.74 ± 1.22 b | 226 ± 84.3 a | 2.48 ± 1.00 bc | 12.9 ± 7.06 d | 5.88 ± 2.58 c |
| Nkenglikok | 7.31 ± 1.20 a | 6.97 ± 1.21 b | 197 ± 93.9 c | 2.92 ± 1.00 abc | 18.1 ± 8.00 ab | 10.22 ± 4.56 a |
| Total average C | 7.02 ± 1.05 NS | 5.54 ± 3.01 S | 147 ± 90.6 NS | 2.29 ± 1.07 S | 12.3 ± 8.34 S | 7.23 ± 3.94 S |
| South region | ||||||
| Ebolowa | 6.85 ± 1.03 a | 10.40 ± 2.21 a | 197 ± 69.8 c | 3.19 ± 0.77 a | 18.5 ± 7.58 ab | 9.93 ± 3.80 ab |
| Kye-Ossi | 6.48 ± 0.80 a | 10.5 ± 1.49 a | 154 ± 52.8 d | 2.89 ± 0.91 ab | 14.8 ± 10.3 c | 9.53 ± 4.90 a |
| Sangmelima | 6.86 ± 1.32 a | 12.0 ± 1.98 a | 235 ± 103 a | 3.12 ± 0.96 a | 22.6 ± 9.18 a | 10.1 ± 3.54 a |
| Zoételé | 7.25 ± 0.94 a | 11.7 ± 1.59 a | 213 ± 73.1 b | 3.40 ± 0.67 a | 23.3 ± 6.90 a | 11.6 ± 3.71 a |
| Total average S | 6.79 ± 0.96 NS | 8.45 ± 4.64 S | 144 ± 98.7 NS | 2.75 ± 1.10 S | 15.4 ± 9.39 S | 9.17 ± 4.43 S |
| Total average C, S | 6.84 ± 0.98 | 8.74 ± 3.08 | 175 ± 76.5 | 2.56 ± 1.05 | 14.1 ± 9.11 | 8.39 ± 4.34 |
| Geographic Population | Length (cm) | Weight (g) | Width (cm) |
|---|---|---|---|
| Central region | |||
| Akok | 2.87 ± 0.43 bc | 4.41 ± 1.48 c | 1.59 ± 0.18 b |
| Lekie-Assi | 3.54 ± 0.46 ab | 7.47 ± 2.16 a | 1.74 ± 0.30 ab |
| Bot-Makak | 2.92 ± 0.42 bc | 5.30 ± 2.07 bc | 1.70 ± 0.21 ab |
| Nkenglikok | 3.10 ± 0.42 ab | 6.24 ± 1.99 ab | 1.83 ± 0.24 a |
| Total average C | 2.98 ± 0.50 S | 5.22 ± 2.19 S | 1.66 ± 0.26 NS |
| South region | |||
| Ebolowa | 3.26 ± 0.44 ab | 5.81 ± 1.92 bc | 1.68 ± 0.22 ab |
| Kye-Ossi | 2.97 ± 0.56 bc | 5.06 ± 2.70 bc | 1.64 ± 0.26 ab |
| Sangmelima | 3.71 ± 0.71 a | 7.16 ± 1.79 a | 1.76 ± 0.18 ab |
| Zoételé | 3.58 ± 0.41 ab | 6.91 ± 1.88 ab | 1.76 ± 0.21 ab |
| Total average S | 3.25 ± 0.63 S | 5.78 ± 2.47 S | 1.67 ± 0.26 NS |
| Total average C, S | 3.15 ± 0.60 | 5.57 ± 2.38 | 1.67 ± 0.26 |
| Stands | |||
|---|---|---|---|
| Managed | Wild | t-Test | |
| Number of trees | 125 | 22 | |
| Age of tree | 41.51 ± 20.38 | 51.27 ± 25.56 | NS |
| DBH (cm) | 55.30 ± 30.54 | 89.45 ± 55.50 | S |
| Crown diameter (m) | 9.23 ± 3.33 | 9.91 ± 3.39 | NS |
| Tree height (m) | 13.40 ± 3.46 | 17.96 ± 4.21 | S |
| Trunk height (m) | 4.96 ± 3.04 | 9.27 ± 6.09 | S |
| Number of seeds per fruit | 2.51 ± 1.06 | 2.79 ± 0.99 | NS |
| Seed mass (g) | 14.16 ± 9.19 | 14.09 ± 8.73 | NS |
| Seed mass ratio (%) | 8.14 ± 4.29 | 9.50 ± 4.38 | NS |
| Population | N | #loc_P | PLP (%) | Hexp |
|---|---|---|---|---|
| Akok | 31 | 469 | 36.1 | 0.146 |
| Bokito | 6 | 502 | 38.6 | 0.164 |
| Lekie-Assi | 16 | 485 | 37.3 | 0.165 |
| Bot-Makak | 12 | 453 | 34.9 | 0.160 |
| Nkenglikok | 18 | 467 | 36 | 0.147 |
| Total C CV | 85 | 636 | 49 | 0.16 5.91% |
| Ebolowa | 37 | 366 | 28.2 | 0.123 |
| Kye-Ossi | 26 | 358 | 27.6 | 0.124 |
| Sangmelima | 16 | 442 | 34 | 0.143 |
| Zoételé | 12 | 410 | 31.6 | 0.164 |
| Total S CV | 92 | 552 | 42.5 | 0.09 13.96% |
| Total C, S | 174 | 1288 | 99.2 | 0.149 |
| n | Ht | Hw | Hb | Fst |
|---|---|---|---|---|
| 9 | 0.1 | 0.0978 | 0.0021 | 0.0212 |
| S.E. | 0.005752 | 0 | 0 | |
| Var | 0.000033 | 0 | −0.043297 |
| Variation | Sigma | % |
|---|---|---|
| Between regions | 8.21 | 8.17 |
| Between populations within regions | 0.83 | 0.83 |
| Within populations | 91.42 | 91 |
| Total variations | 100.46 | 100 |
| Status | N | #loc. | #loc_P | PLP | Hexp | Fst |
|---|---|---|---|---|---|---|
| Managed | 140 | 1299 | 439 | 33.8 | 0.091 | |
| Wild | 29 | 1299 | 499 | 38.4 | 0.088 | 0.004 |
| Central (n = 81) | South (n = 66) | Total (n = 147) | ||||
|---|---|---|---|---|---|---|
| Managed | 75 | 92.6% | 50 | 75.8% | 125 | 85% |
| Agroforestry systems | 56 | 69.1% | 37 | 56.1% | 93 | 63.9% |
| Homegardens | 19 | 23.5% | 13 | 19.7% | 32 | 21.7% |
| Wild (forest) | 6 | 7.4% | 16 | 24.2% | 22 | 15% |
| Amplification Step | Primer Sequences | |
|---|---|---|
| Preselective amplification | EcoRI + 1 | MseI + 1 |
| GACTGCGTACCAATTCA | GATGAGTCCTGAGTAAC | |
| Selective amplification | EcoRI + 3 (6-FAM) | MseI + 3 |
| GACTGCGTACCAATTCATT | GATGAGTCCTGAGTAACCT | |
| GATGAGTCCTGAGTAACTA | ||
| GACTGCGTACCAATTCAAT | GATGAGTCCTGAGTAACGA | |
| GATGAGTCCTGAGTAACAT |
Disclaimer/Publisher’s Note: The statements, opinions and data contained in all publications are solely those of the individual author(s) and contributor(s) and not of MDPI and/or the editor(s). MDPI and/or the editor(s) disclaim responsibility for any injury to people or property resulting from any ideas, methods, instructions or products referred to in the content. |
© 2023 by the authors. Licensee MDPI, Basel, Switzerland. This article is an open access article distributed under the terms and conditions of the Creative Commons Attribution (CC BY) license (https://creativecommons.org/licenses/by/4.0/).
Share and Cite
Maňourová, A.; Chinheya, I.P.; Kalousová, M.; Ruiz-Chután, J.A.; Okafor, U.C.; Tchoundjeu, Z.; Tsobeng, A.; Van Damme, P.; Lojka, B. Domestication Potential of Garcinia kola Heckel (Clusiaceae): Searching for Diversity in South Cameroon. Plants 2023, 12, 742. https://doi.org/10.3390/plants12040742
Maňourová A, Chinheya IP, Kalousová M, Ruiz-Chután JA, Okafor UC, Tchoundjeu Z, Tsobeng A, Van Damme P, Lojka B. Domestication Potential of Garcinia kola Heckel (Clusiaceae): Searching for Diversity in South Cameroon. Plants. 2023; 12(4):742. https://doi.org/10.3390/plants12040742
Chicago/Turabian StyleMaňourová, Anna, Irikidzai Prosper Chinheya, Marie Kalousová, José Alejandro Ruiz-Chután, Uche Cyprian Okafor, Zac Tchoundjeu, Alain Tsobeng, Patrick Van Damme, and Bohdan Lojka. 2023. "Domestication Potential of Garcinia kola Heckel (Clusiaceae): Searching for Diversity in South Cameroon" Plants 12, no. 4: 742. https://doi.org/10.3390/plants12040742
APA StyleMaňourová, A., Chinheya, I. P., Kalousová, M., Ruiz-Chután, J. A., Okafor, U. C., Tchoundjeu, Z., Tsobeng, A., Van Damme, P., & Lojka, B. (2023). Domestication Potential of Garcinia kola Heckel (Clusiaceae): Searching for Diversity in South Cameroon. Plants, 12(4), 742. https://doi.org/10.3390/plants12040742