Article

Metabolic and Molecular Rearrangements of Sauvignon Blanc (Vitis vinifera L.) Berries in Response to Foliar Applications of Specific Dry Yeast

1
Department of Agronomy, Food, Natural Resources, Animals and Environment (DAFNAE), University of Padova, 35020 Padova, Italy
2
Department of Agricultural and Food Sciences, University of Bologna, 40127 Bologna, Italy
3
National Research Institute for Agriculture, Food and Environment (INRAE), SVQV UMR A1131, University of Strasbourg, 67081 Strasbourg, France
4
Crop Science Research Center, Scuola Superiore Sant’Anna, 56127 Pisa, Italy
5
Technology Transfer Centre, Edmund Mach Foundation, Via E. Mach 1, 38010 San Michele all ‘Adige, Italy
6
Lallemand Italia, Via Rossini, 14/B, 37060 Verona, Italy
7
Interdepartmental Research Centre for Viticulture and Enology (CIRVE), University of Padova, Via XXVIII Aprile 14, Conegliano, 31015 Treviso, Italy
*
Author to whom correspondence should be addressed.
Plants 2023, 12(19), 3423; https://doi.org/10.3390/plants12193423
Submission received: 25 July 2023 / Revised: 18 September 2023 / Accepted: 22 September 2023 / Published: 28 September 2023

Abstract

:
Dry yeast extracts (DYE) are applied to vineyards to improve aromatic and secondary metabolic compound content and wine quality; however, systematic information on the underpinning molecular mechanisms is lacking. This work aimed to unravel, through a systematic approach, the metabolic and molecular responses of Sauvignon Blanc berries to DYE treatments. To accomplish this, DYE spraying was performed in a commercial vineyard for two consecutive years. Berries were sampled at several time points after the treatment, and grapes were analyzed for sugars, acidity, free and bound aroma precursors, amino acids, and targeted and untargeted RNA-Seq transcriptional profiles. The results obtained indicated that the DYE treatment did not interfere with the technological ripening parameters of sugars and acidity. Some aroma precursors, including cys-3MH and GSH-3MH, responsible for the typical aromatic nuances of Sauvignon Blanc, were stimulated by the treatment during both vintages. The levels of amino acids and the global RNA-seq transcriptional profiles indicated that DYE spraying upregulated ROS homeostatic and thermotolerance genes, as well as ethylene and jasmonic acid biosynthetic genes, and activated abiotic and biotic stress responses. Overall, the data suggested that the DYE reduced berry oxidative stress through the regulation of specific subsets of metabolic and hormonal pathways.

1. Introduction

Grapevine (Vitis vinifera L.) is one of the most important horticultural crops in the world, with an annual production of about 90 million tons, of which almost 75% are meant to be transformed into wine [1,2]. Vineyards’ productions are seriously threatened by climate change, especially by the globally average temperature rise, which over the last few years has already manifested a great impact on the wine industry. This scenario is expected to become even more serious in the near future [3,4]. The negative impacts of climate change on grapevines are both quantitative and qualitative. Drought and heat stresses during berry development and ripening result in significant changes in the fruit composition and lower-quality wines [1,5]. Under heat stress, grape berries accumulate sugars and lose their acidity at a faster rate, resulting in wines with excessive alcoholic content and poor acidity. Both primary (sugars, organic acids, and amino acids) and secondary (aroma compounds and phenolics) metabolisms are highly affected by high temperatures during grape berry ripening [6,7]. Previous studies have indicated that elevated temperatures across veraison and ripening irreversibly inhibit anthocyanin biosynthesis in the skin of red grapes and consequently result in reduced color in grapes and wines [8]. Additionally, wine aroma is affected by climatic changes [3]. Wine aroma is defined by the complex profile of several volatile molecules belonging to different chemical classes, such as terpenes, lipoxygenase (LOX) pathway products, norisoprenoids, methoxypyrazines, and sulphur (thiolic) compounds [1]. The regulation of the biosynthetic steps of aroma components is under developmental and environmental control, and the diverse aromatic pathways respond differently to drought and heat stress, some of them being enhanced and some being inhibited [3]. Sulphur compounds, referred to as volatile or varietal thiols, which contribute to desirable fruity aromas in Sauvignon Blanc (SB), are particularly sensitive to drought and temperature. Although a moderate water deficit may lead to the accumulation of varietal thiols, extreme drought and high temperatures cause a detrimental decrease in their amount [3]. The concentration of volatile thiols in the must and wine is overall connected with the concentration of their cysteine- or glutathione-bound precursors in the grapes, the biosynthesis of which is closely connected to glutathione (GSH) levels through its reaction with LOX pathway metabolites (e.g., hexenal) [1,9,10,11]. The prevalent sulphur compound (varietal thiol) in the must/wine is 3-mercaptohexan-1-ol (3MH), and its precursors are 3-S-glutathionylhexan-1-ol (GSH-3MH) and 3-S-cysteinylhexan-1-ol (Cys-3MH). GSH-3MH derives from the conjugation of GSH to hexenal through the action of GSH transferase (GST), while Cys-3MH arises from GSH-3MH metabolism by gamma glutamyl transpeptidase (GGT) [12]. GSH levels also display a significant decrease as a consequence of exposure to high temperatures and drought stress, to which GSH is very sensitive due to its use to counteract cellular oxidative stress [3,8]. Among the other aromatic compounds, methoxypyrazines are significantly reduced, while o-aminoacetophenone (AAP), which is a wine-off flavor, is increased when the vines are subjected to heat stress [8]. Monoterpenes are reported to be highly produced in response to high temperatures; however, their excessive amount is detrimental to the end flavor of wine [3]. In this complex context, mitigation strategies are needed to ensure the consistent quality of wines over different vintages. Some tools are available for viticulturists to mitigate the negative effects of climate change and to improve the compositional quality of the berries, including management of the canopy, water supply, nutritional status of the plants, and the supply of elicitors or biostimulants as either foliar sprays or soil applications [5]. However, these measures are, by themselves, not enough to face the rising temperature and lack of water and have limited benefits. According to Van Leeuwen et al. (2016) [4], the most effective way of counteracting climate change is the choice of plant material, but this cannot provide an immediate means to counteract climate change. In addition, a clear classification of the varieties according to drought tolerance still needs significant research to be developed. Irrigation, besides having a high financial and environmental impact, can result in salt accumulation in the soil, creating a new kind of stress and becoming less feasible in a context of limited water availability [4]. The adoption of nebulized water cooling of the canopy to preserve fruit composition and improve the aroma potential of grapes has the same drawbacks as irrigation [13].
Elicitors are one of the most commonly used strategies to increase secondary metabolite content in berries. Previous studies indicated that elicitors stimulate an “immune-like” response in grapes, triggering the production and accumulation of compounds such as polyphenols, phytoalexins, stilbenes, anthocyanins, and tannins [5,9,14]. Inactive dry yeast extracts (DYE) are a group of elicitors that can induce the accumulation of phenols, terpenoids, and other aromatic compounds [5,14]. Thus, DYE treatments are gaining interest as tools that can be exploited in organically managed vineyards to enhance the aroma profile of white grape varieties in the presence of unfavorable climatic conditions. According to Šuklje et al. (2016) [15], DYE applied to SB grapes increased the berry content of antioxidants, in particular GSH, certain amino acids, esters, and the precursors of aromatic thiols [15]. Giacosa et al. (2019) [5] observed an increase in anthocyanin production and berry skin thickness and reported an upregulation of volatile compounds, namely free acetate and ethyl esters, after DYE treatment. Furthermore, the authors proposed DYE as an effective method to counteract some of the consequences of climate change, such as heat stress [5]. While the positive effects exerted by DYE on aroma precursors or secondary metabolites are well documented, very little is known about the biochemical and molecular mechanisms of action of DYE, and a comprehensive transcriptional overview of such effects is lacking. In fact, Pastore et al. (2020) [14] have shown, through a targeted approach, that some key genes (e.g., UFGT) of the anthocyanin pathway are transcriptionally induced by the treatment with DYE in grapevine berries of the red variety Sangiovese. The same authors have hypothesized that this effect may take place as a consequence of an elicitor-like action of DYE, finally leading to the downstream activation of the above-mentioned genes. However, a systematic overview of the transcriptional changes induced by DYE on grape berries is currently missing, and the signaling pathways that may be involved in this process are currently unknown [14].
The purpose of this work was to fill this gap by studying in detail the biochemical and molecular effects of foliar applications of DYE on SB grapes and providing a hint on the molecular signaling pathways that may underpin the improvement in berry aroma and secondary metabolism. Overall, our study aimed to obtain a comprehensive overview, by RNA-Seq, of the transcriptional signatures evoked by the treatment with DYE to provide a systematic molecular frame for their specific mode of action. In particular, we wanted to highlight the transcriptional rewiring of the specific metabolic, hormonal, and oxidative stress responses that are evoked by DYE without impacting the overall ripening process, thus providing a first draft of the DYE elicitor-like molecular action.

2. Results

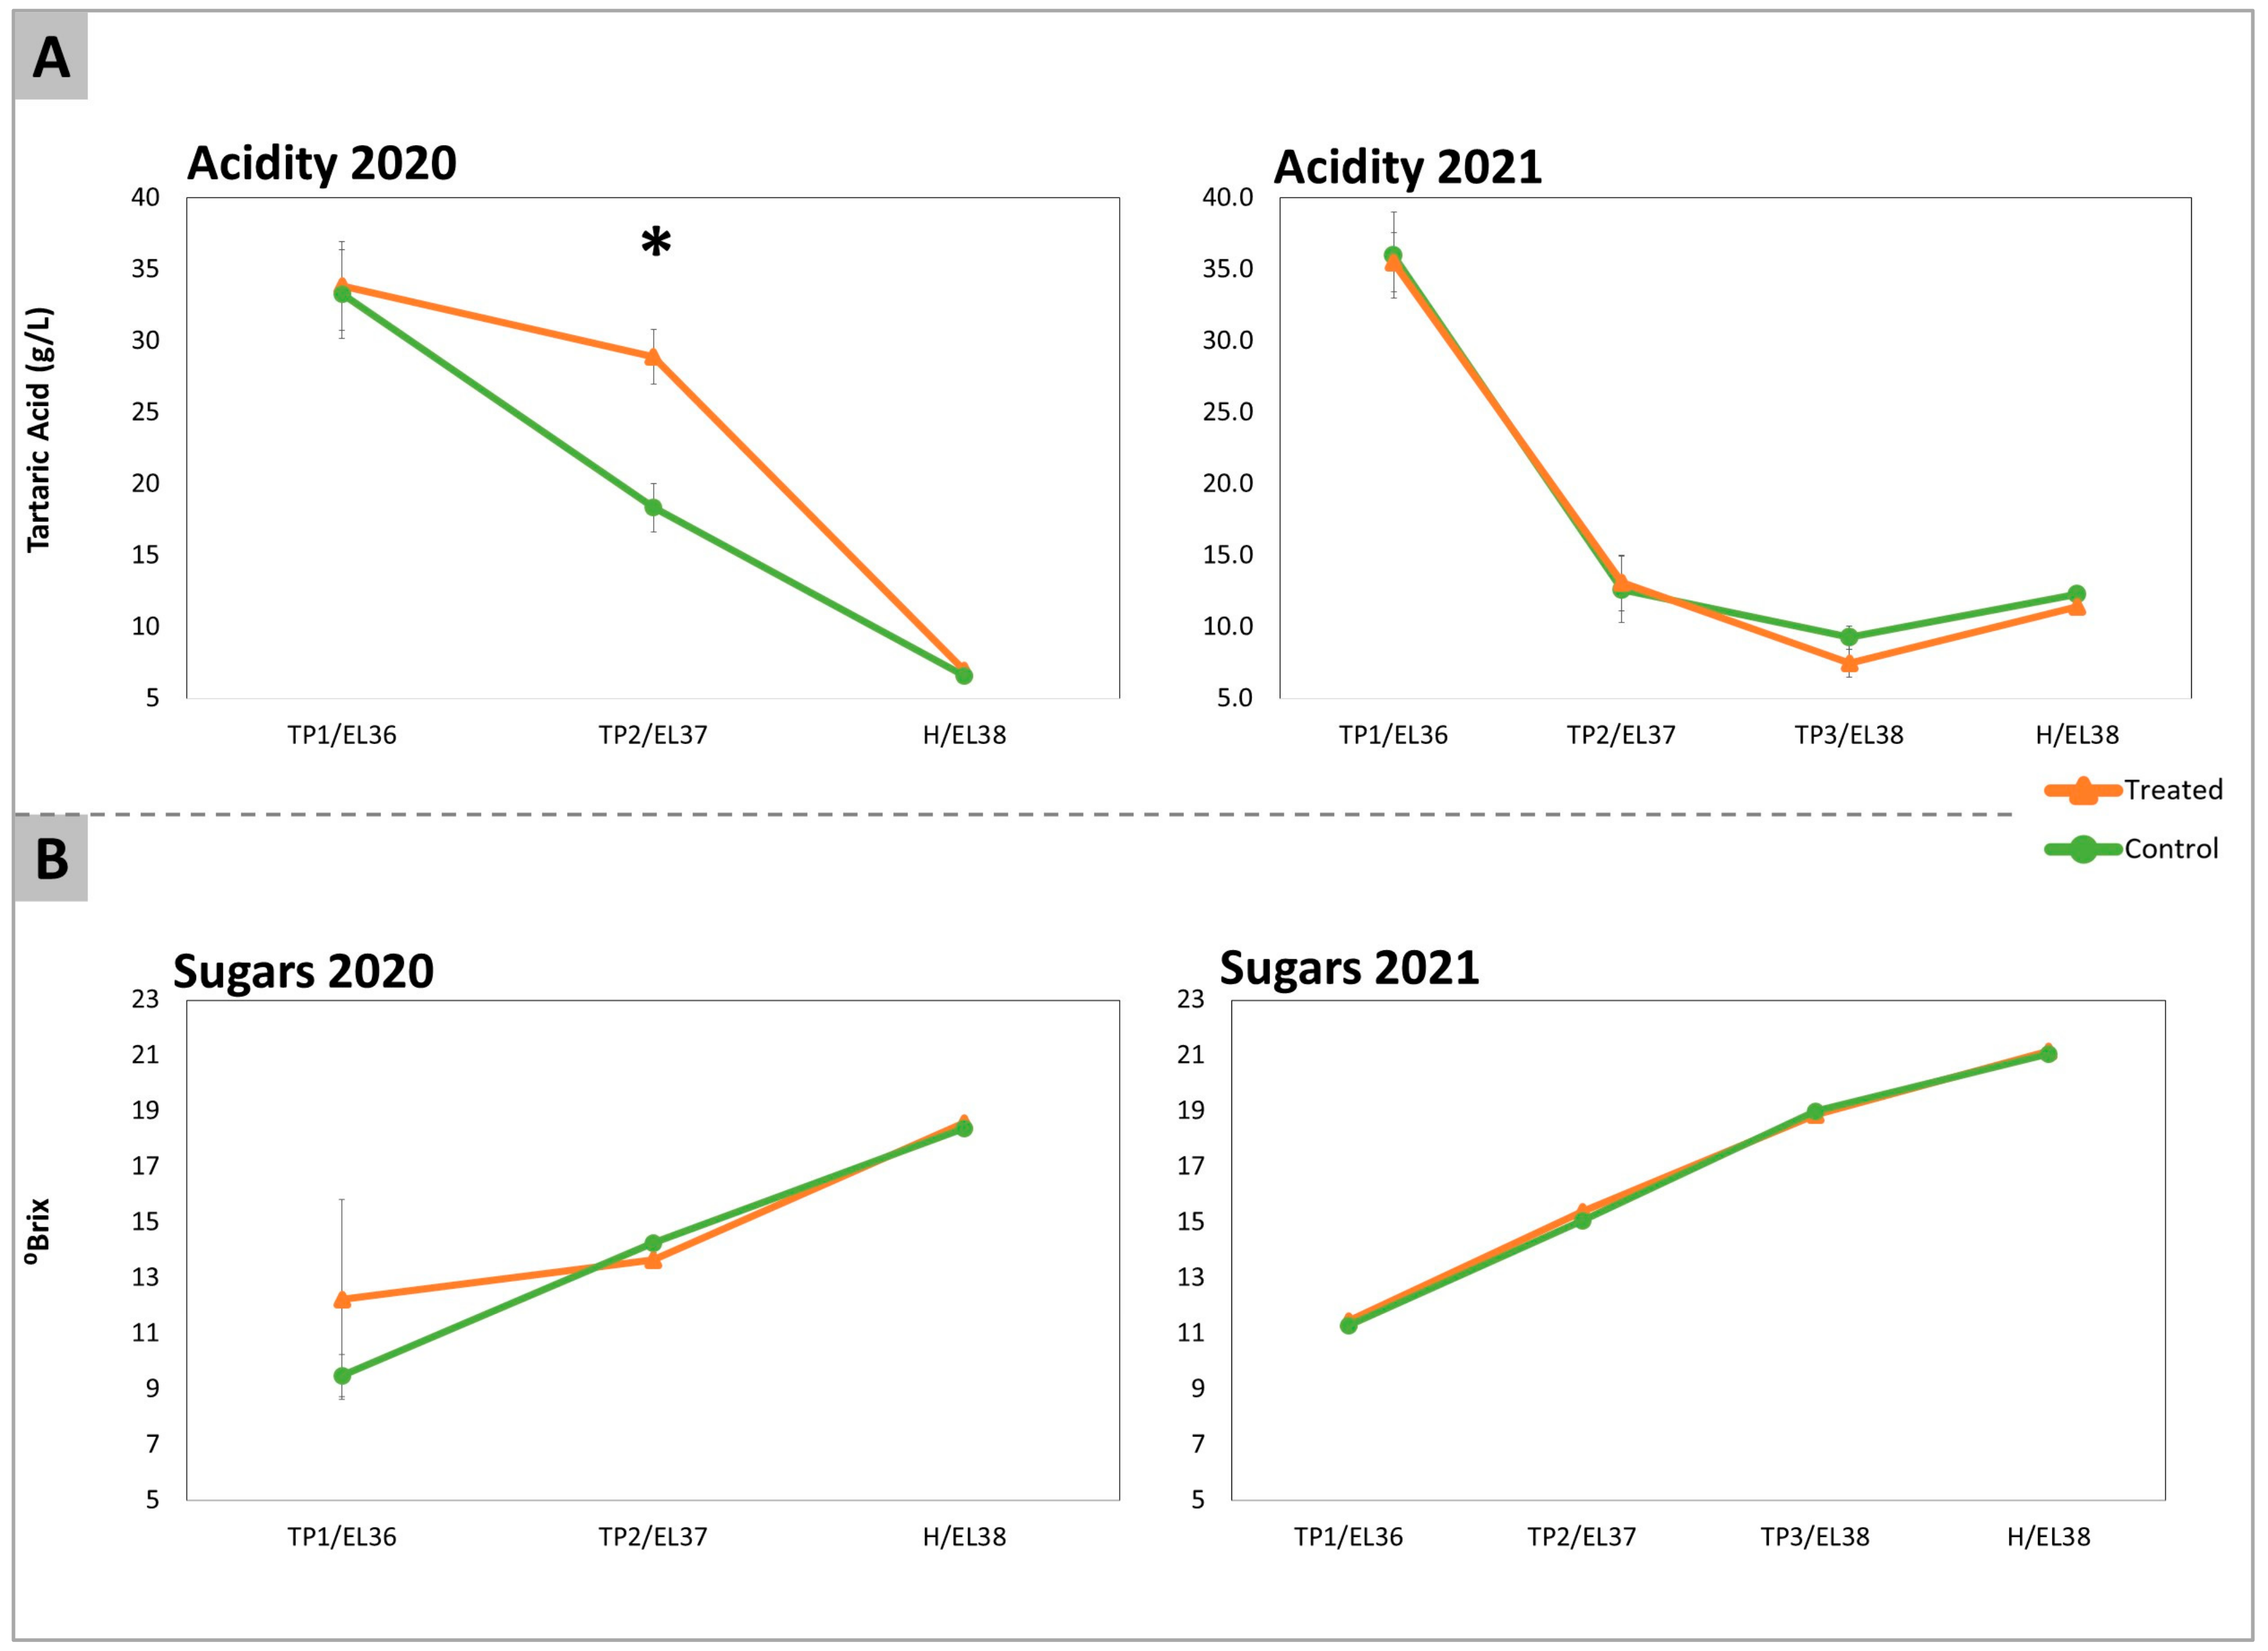
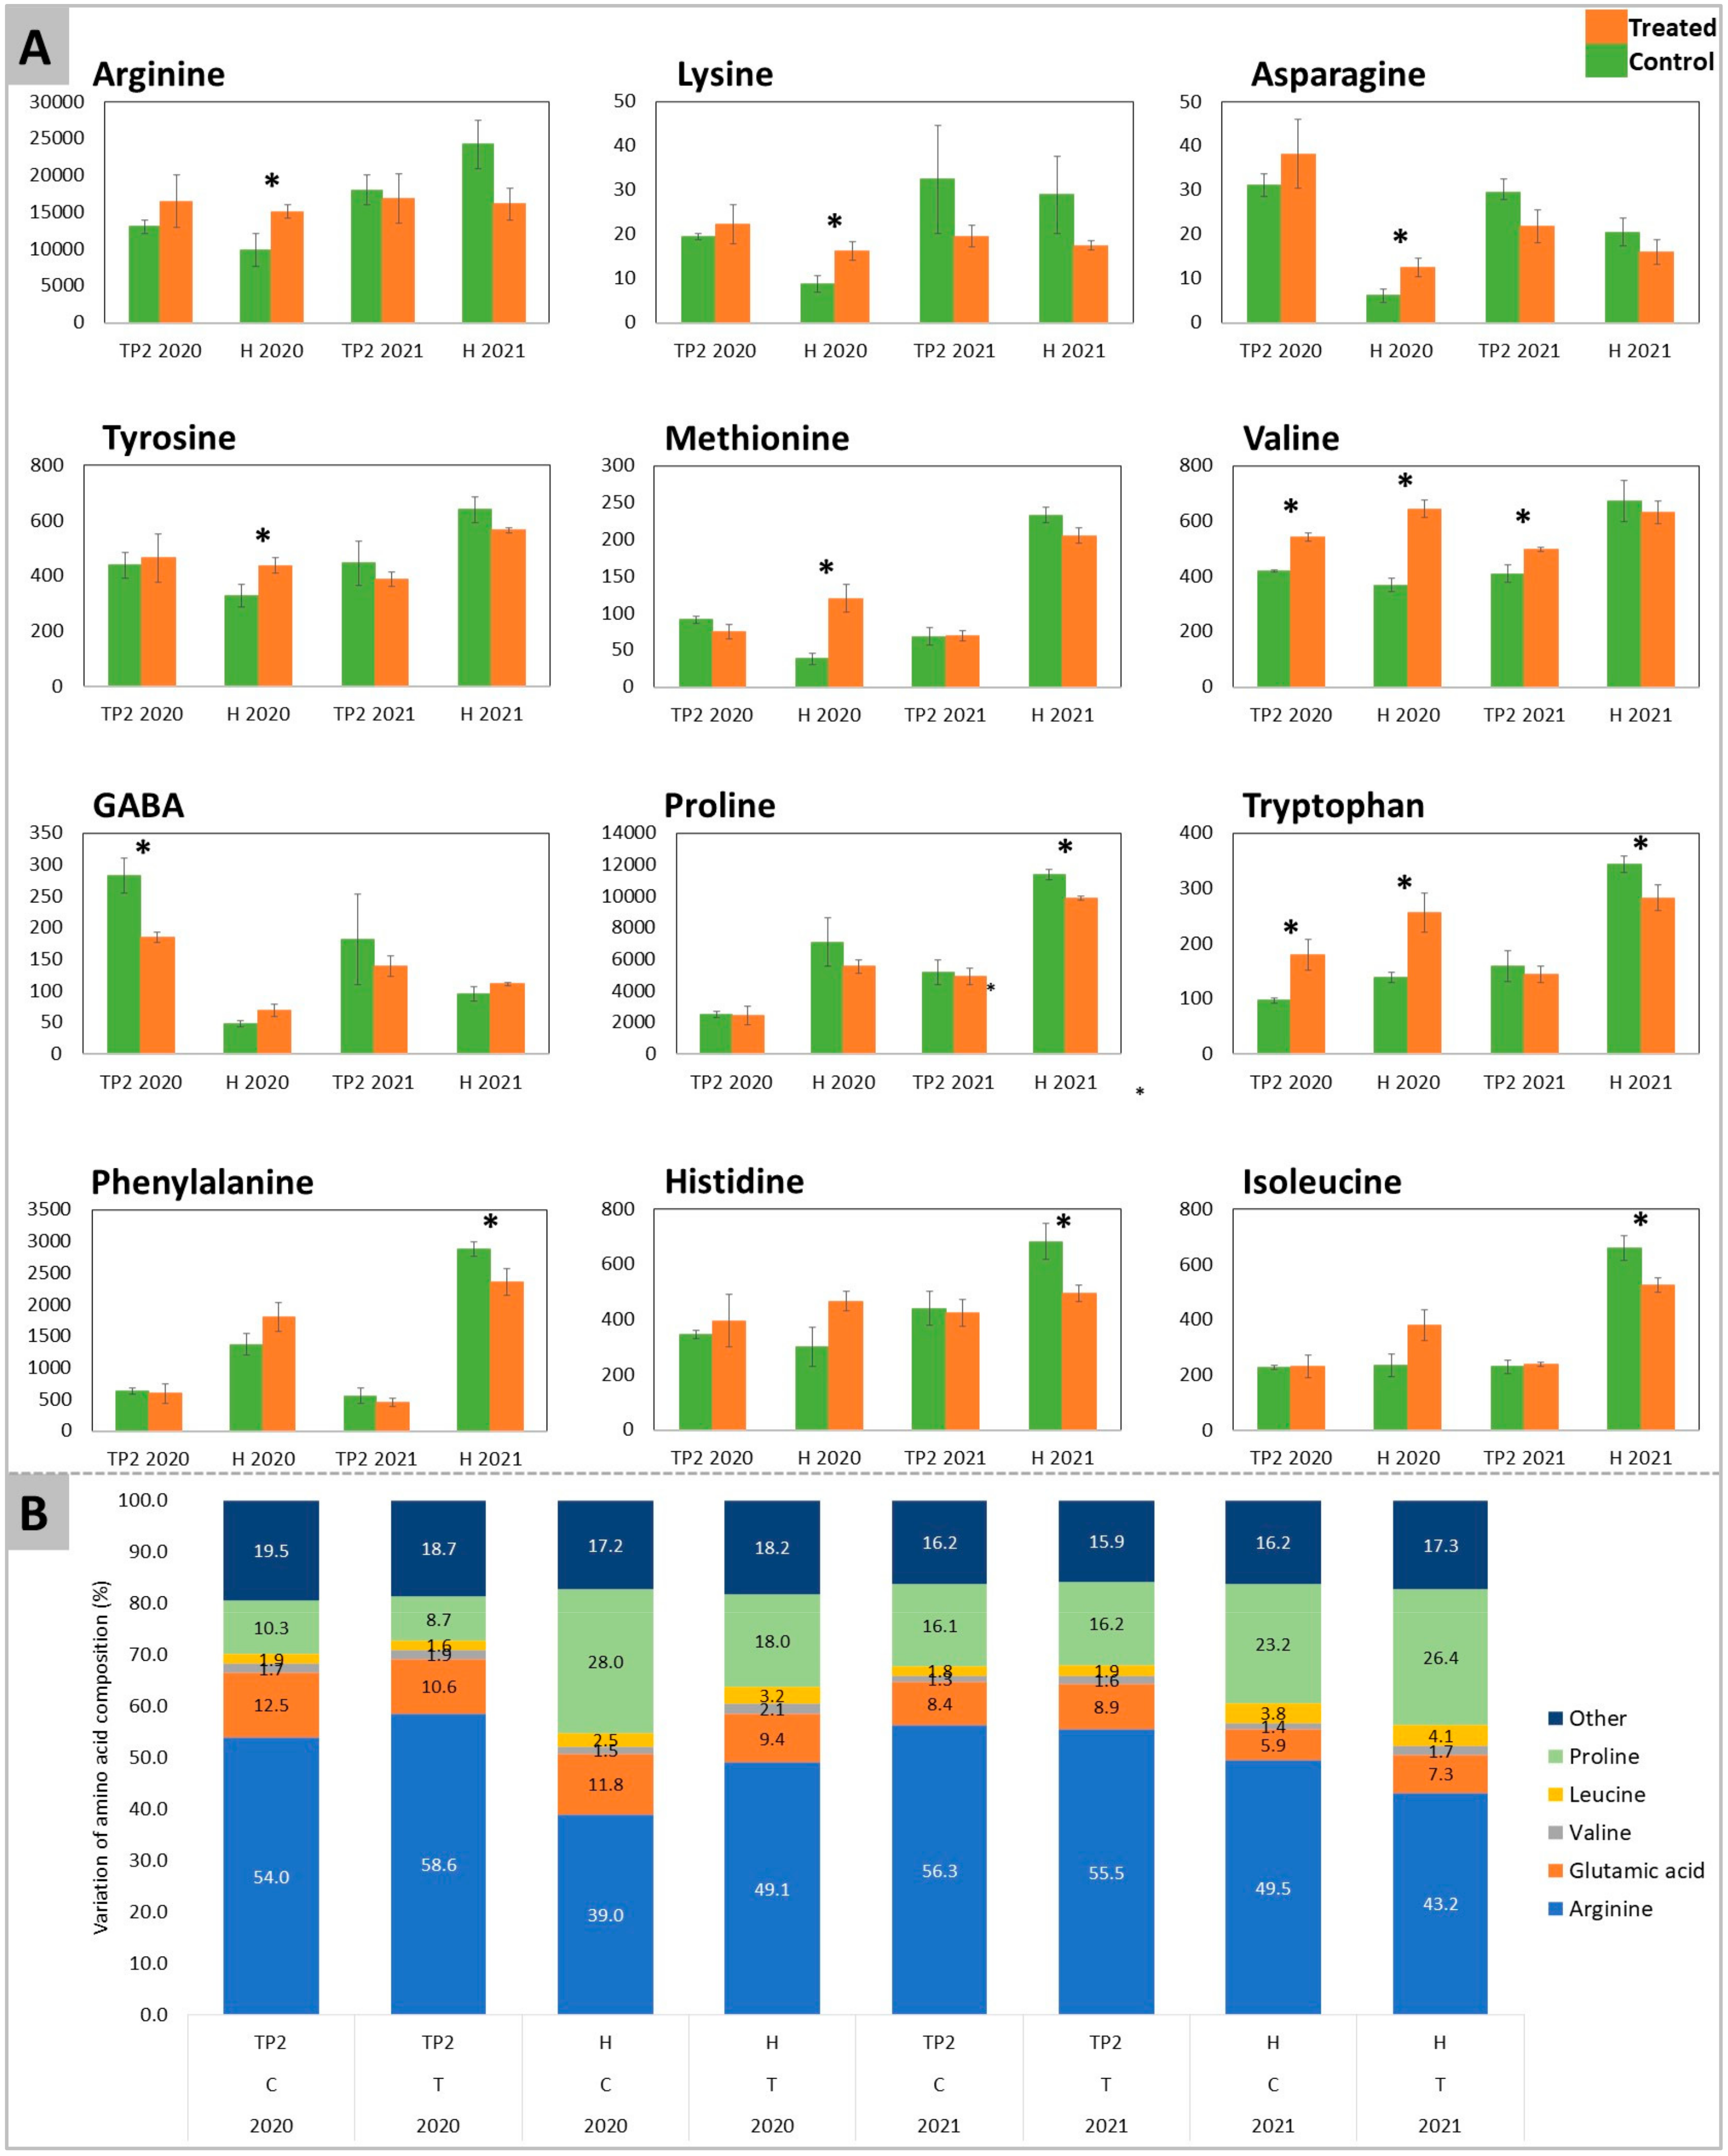
2.1. Acidity, Total Sugars, Amino Acids, and GABA

Acidity and total sugars were used as a proxy for the staging of berry ripening progression in treated and control samples. Total titratable acidity and total sugars were measured at each time point during both vintages (Figure 1). The treatment with DYE did not induce significant differences in terms of total sugar content or in the acidity of berry juice, except for acidity at TP2 in 2020, which appeared to be transiently higher in the treated samples. This effect was not confirmed in 2021. In fact, at H, both treated and control samples showed no differences in these parameters.
The complete amino acid profile, as well as GABA (gamma-aminobutyric acid) and other secondary metabolites, have been determined at TP2 and at H in both 2020 and 2021 (the complete dataset is provided in Table S1). The collective average data is shown in Figure 2.
According to Figure 2A, the greatest differences among samples were observed between control samples at TP2 and at H. The effect of ripening was in fact evidenced by higher contents of cysteine, proline, hydroxyproline, phenylalanine, pipecolic acid, cis- and trans-piceid, and viniferin, and by lower contents of methionine, asparagine, and GABA, independently from the treatment. At H, the DYE application resulted in higher levels of valine, leucine, methionine, isoleucine, and tryptophan and a less marked decrease of arginine, asparagine, and GABA, or, conversely, a less marked increase of cis- and trans-piceid and viniferin. For some of these compounds (valine, tryptophan, and cysteine), this effect was already evident at TP2. At maturity, as a consequence of these amino acid trends, the arginine to proline ratio, a commonly used marker for evaluating berry maturity [17], was higher in treated berries (2.7-fold) in comparison to the control ones (1.4-fold) in the 2020 season.
Figure 2A was confirmed by PCA analysis, which highlighted the separation of samples according to their ripening stage along dimension 1 (accounting for 43.0% of variability) and positioning samples at H on the left side and TP2 samples on the right side of the graph (Figure 2B). Conversely, the second dimension (describing 25.4% of variability) of the PCA enabled the separation of control and treated samples at H, while treated and untreated samples grouped together at TP2, consistent with the previous analysis (Figure 2B). Figure 2C reports the loading plot driving the observed sample clustering, showing that the metabolites contributing the most to the separation of the grouping samples collected at H from the ones sampled at TP2 were the secondary metabolites viniferin, cis- and trans-piceid and pipecolic acids, and the amino acids proline, hydroxyproline, and phenylalanine. On the contrary, leucine, isoleucine, tryptophan, valine, histidine, and methionine were the amino acids contributing the most to the separation of treated and control samples at H along the y axis.
A targeted T-test analysis carried out on the above-identified amino acids (affected by the treatment in PCA of Figure 2B and significantly different in Figure 2C) pointed out significant differences between treated and control samples (Figure 3).
The accumulation of arginine, lysine, asparagine, tyrosine, and methionine was similarly induced by the treatment with DYE in 2020, displaying significant differences at H. On the other hand, in 2021, the mentioned amino acids showed no significant differences between treated and control samples. At H of the 2021 vintage, proline, phenylalanine, histidine, and isoleucine were significantly reduced by the DYE spraying. Valine and tryptophan had consistent results, with a significant increase in the content of both amino acids at TP2 and H in 2020. The increase in valine content was maintained at TP2 in 2021, while at H, no significant differences could be detected. A significant decrease in tryptophan was recorded at H in 2021. GABA was higher in control samples at TP2 of both years, where in 2020 the decrease exerted by the treatment was significant and in 2021 this trend was maintained even though not significantly. Conversely, at H, GABA had no significant differences in both years.

2.2. Aromatic Profile

The aromatic profile has been investigated on the samples at all time points (free volatiles) and at H (bound and thiol aroma precursors) by GC-MS and LC-MS, respectively. In total, 16 free aromas and 20 bound aromas were detected and quantified (Tables S2 and S3, respectively). In Figure 4, only the aromas that were significantly affected or that showed a specific trend in response to DYE treatment are reported.
In both years, the treatment with DYE improved the contents of cys-3-Mercaptohexanol (cys-3MH) and GSH-3MH in grapes, even though these differences were not significant (Figure 4A). Glutathione (GSH), an antioxidant and a precursor of GSH-3MH (through a reaction with hexenal) and of Cys-3MH [16], was not significantly affected by the treatment.
Terpenes such as nerol and geranic acid appeared to increase significantly after DYE treatment in 2020 and 2021, respectively. The treatment also affected the LOX pathway by significantly increasing hexanal and decreasing the amount of 2-hexenal (non-significantly), an effect that was especially evident at H. DYE spraying also changed the benzenoid pathway through a slight stimulatory effect on methyl salicylate (Figure 4A) and a significant positive effect on benzeneacetaldehyde (Figure 4B).

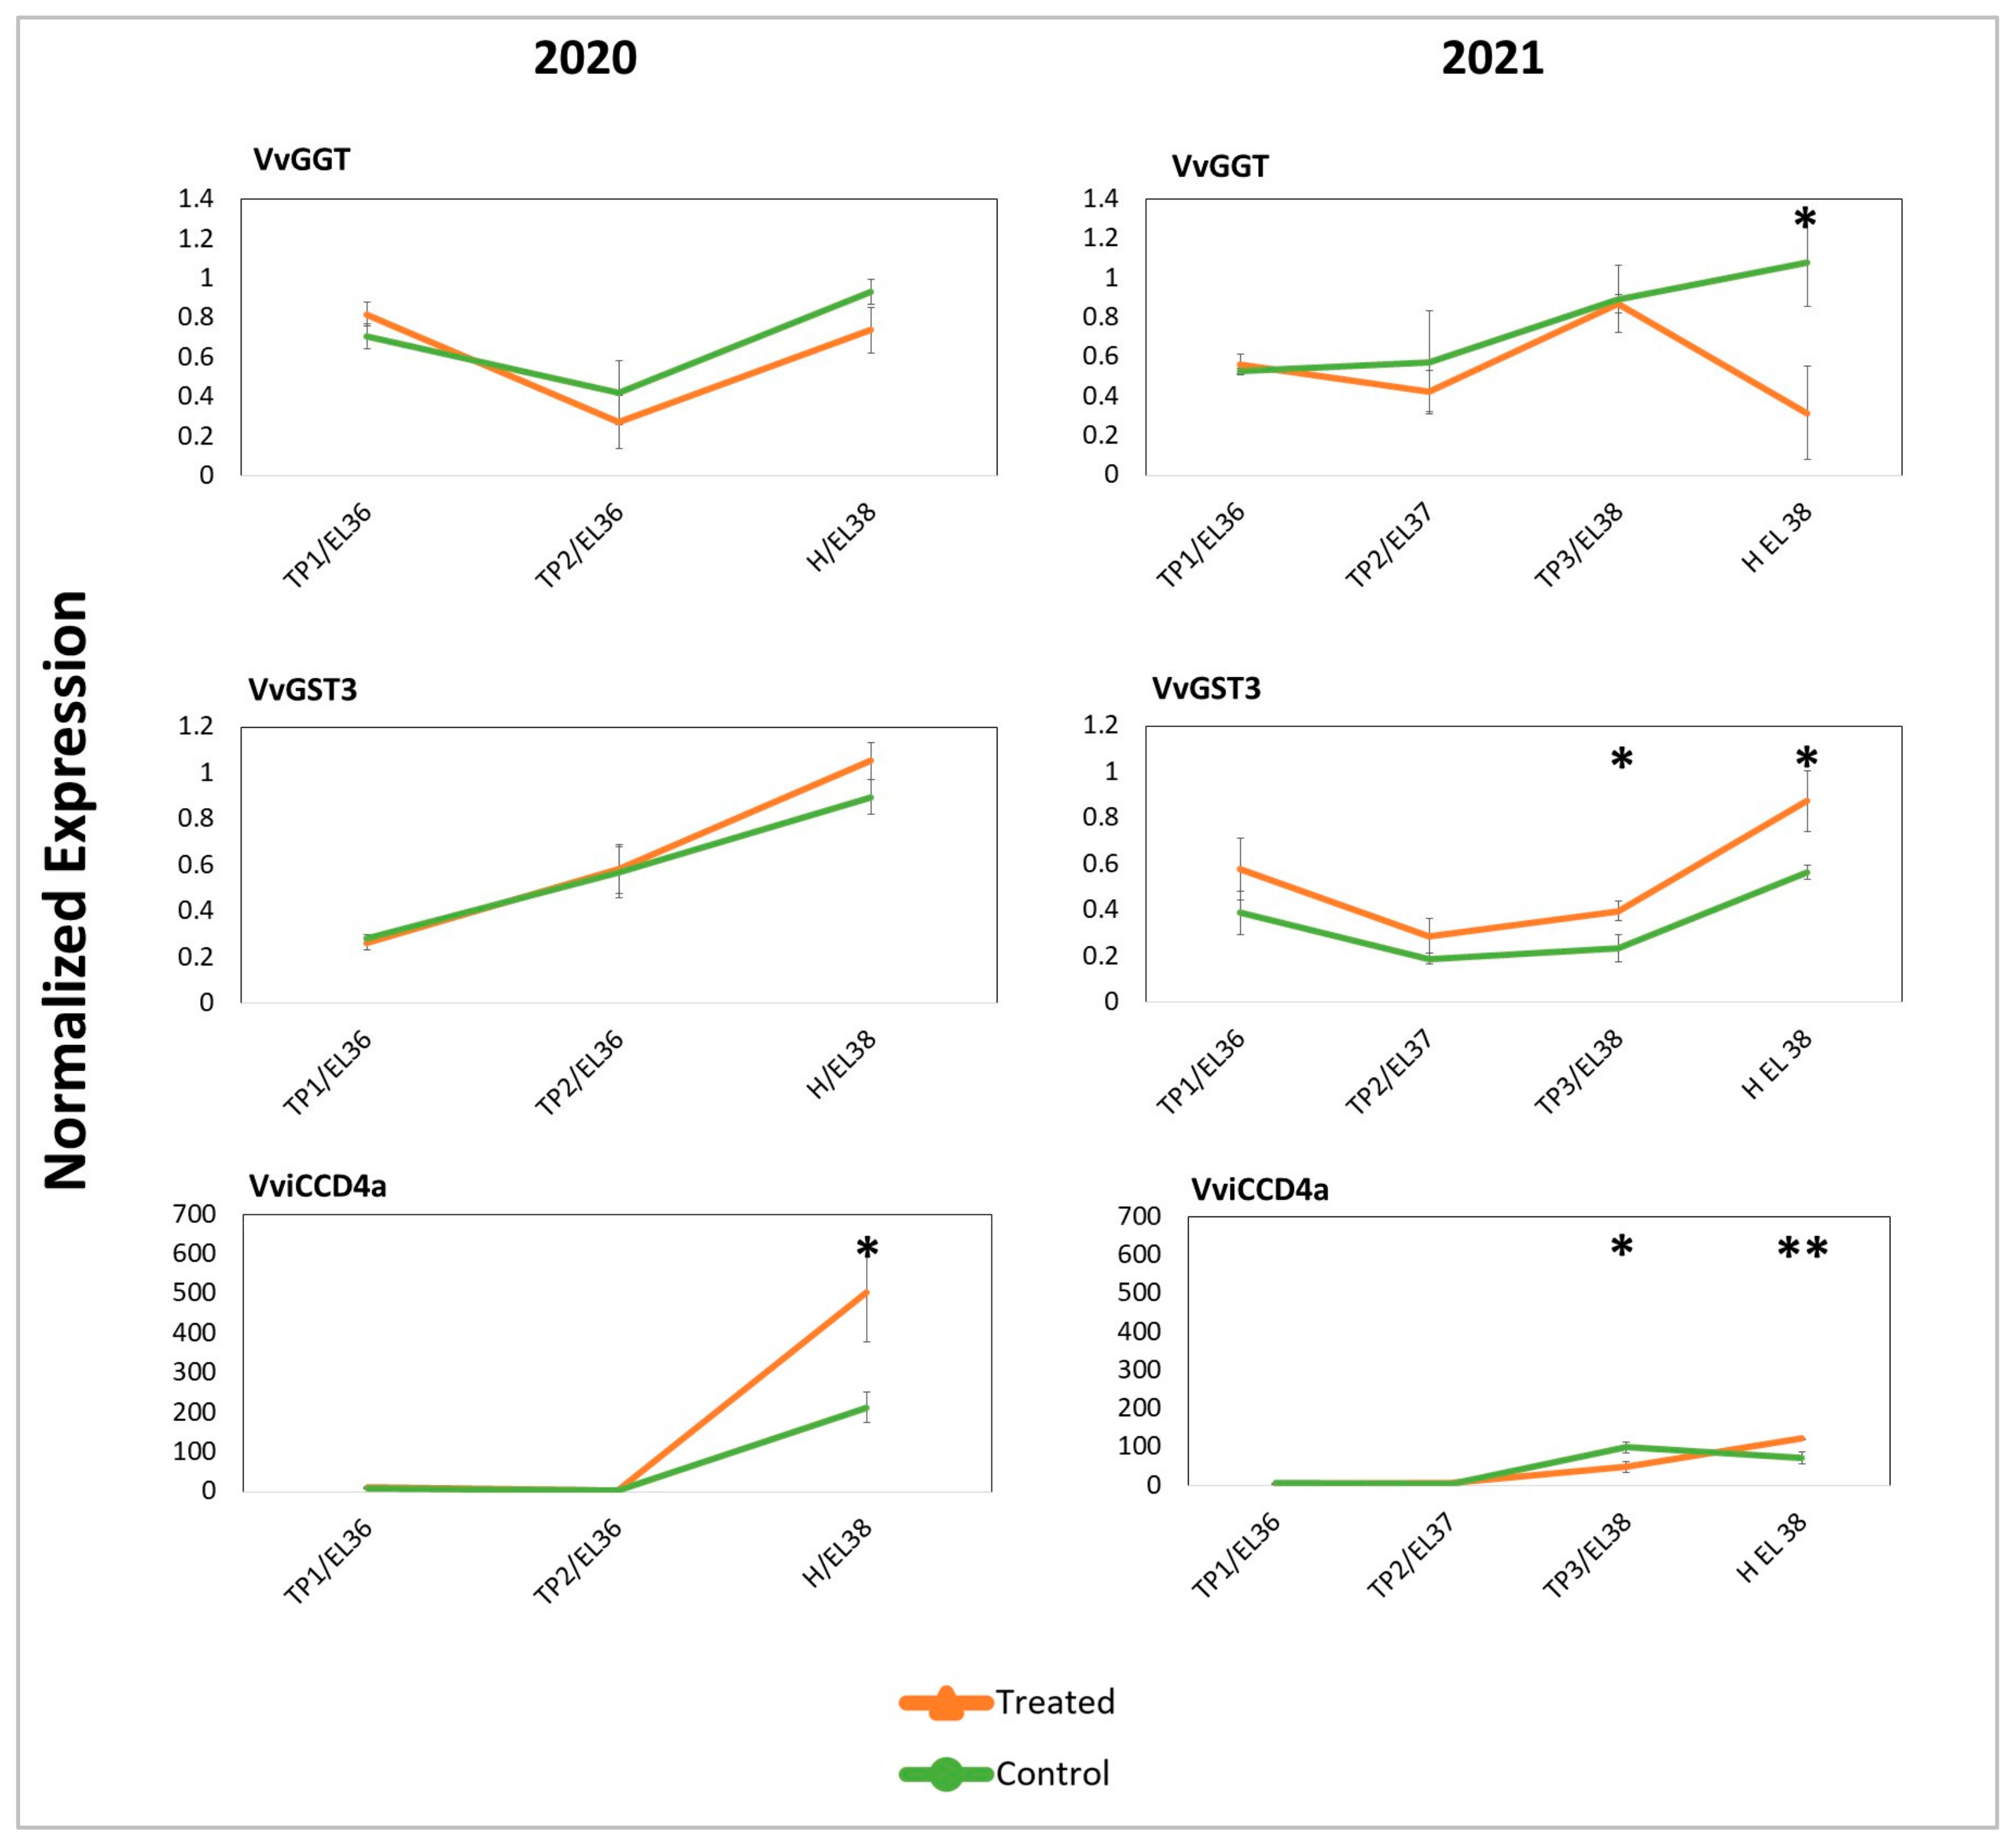
2.3. Targeted and Untargeted Molecular Responses: Comparison of DYE-Treated versus Untreated Berries

Since DYE treatments result in the enhancement of some aroma components, the transcriptional expression of the main genes involved in berry aroma development [1,12,18] was determined through a targeted approach (RT-qPCR) on berries collected from both years to gain a first characterization of DYE molecular effects. Several genes (in total eight genes) were studied, including those encoding VvGGT (Gamma-Glutamyl Transferase) (one gene) and VvGST (Glutathione S-transferase) (one gene), selected on the basis of their role in the biosynthesis and metabolization of GSH- and cysteine-bound thiol precursors [12,18]. VviCCD (Carotenoid Cleavage Dioxygenase) (one gene) was studied for its role in the biosynthesis of norisoprenoids precursors from apocarotenoids [1,19]. Among these, some displayed a specific expression trend and responsiveness to DYE treatment (shown in Figure 5) (all expression data are reported in Table S4).
All the considered genes showed an increasing level of expression along with the progression of ripening, reaching a maximum at H. Some of them displayed further increases or decreases of expression in response to DYE, but no interferences with the overall expression dynamics were noticed. In fact, in treated grapes, the transcript levels of the VvGST3 gene (involved in the biosynthesis of GSH-MH) [18] appeared tendentially higher than those found in control grapes for both years. Conversely, VvGGT (responsible for the conversion of GSH-3MH into cys-3MH) [12] showed always more abundant transcripts in control samples, even though more evidently at H in 2021, and VviCCD4a was more abundantly transcribed in treated grapes at H in both years.
To have a comprehensive, untargeted overview of the transcriptional profiles induced or repressed by the treatment with DYE, RNA-Seq analysis was performed at TP2 and H in berries collected from the year 2020 (Table S5). The selection of the samples to analyze was based on the more prominent effects exerted by the DYE treatment on the overall amino acid (Figure 2 and Figure 3) and aroma precursor (Figure 4) profiles in this vintage.
At first, a very stringent analysis was carried out, comparing treated versus control samples at each time point taken independently, to highlight the effects of the treatment without considering the effects of time (ripening). This analysis showed that there were more differentially expressed genes (DEGs) between treated and control samples at H (448 DEGs) rather than at TP2 (118 DEGs), and most DEGs at H were upregulated (301 DEGs) by the treatment, while at TP2 the number of up- or down-regulated genes was similar (54 and 64, respectively) (Figure 6). The majority of DEGs showed differences in the order of 0.6 < log2 < 1 (upregulated) and −1 < log2 < −0.6 (downregulated). Most of the genes identified as DEGs at TP2 were not conserved as DEGs at H (data not shown).
Gene ontology enrichment analysis was carried out to highlight the pathways mainly affected by the DYE treatment by using three different approaches, namely G:Profiler, Mapman, and KEGG. Among the categories identified by G:Profiler within the upregulated genes at H, terms related to protein stability (“unfolded protein binding”, “chaperone binding”, and “protein folding”), transcriptional regulation (e.g., “regulation of transcription” and “DNA-binding transcription factor activity”), stress hormone action (“ethylene-activated signaling pathway”), and abiotic stress (“response to heat” and “response to hypoxia”) were abundantly represented. Among the downregulated genes at H, the categories “ADP and ATP binging”, “protein binding”, “cellular glucan metabolic process”, and “xyloglucan-xylo-glucosyl transferase”, and “defence response” were enriched (Figure 7A,B).
Mapman analyses also identified most of the DEG enrichments at H (Figure 7C). Briefly, “Secondary metabolism of terpenoids: terpene biosynthesis”, “cell division”, “protein homeostasis proteolysis: aspartic-type peptidase activity”, “solute transport: transport channels and primary active transport ABC superfamily”, “response to pathogens and effector triggered immunity”, and “transferases” were downregulated at this time point. Conversely, “Phytohormone action: jasmonic acid”, “RNA biosynthesis: transcriptional regulation AP2/ERF transcription factor superfamily”, “protein homeostasis: protein quality control and ubiquitin-proteasome system”, “protein homeostasis: serine type peptidase activities”, “External response to temperature: cold response and ICE-CBF cold acclimation transcriptional cascade”, were upregulated at H. The enriched categories “Secondary metabolism of terpenoids: terpene biosynthesis” and “protein homeostasis proteolysis: aspartic-type peptidase activity” were downregulated both at TP2 and at H.
KEGG analyses highlighted several biochemical pathways underpinning the previously identified enrichments (data not shown). As far as glutathione and sulphur metabolisms were concerned, an upregulation of glutathione peroxidase (EC 1.111.9), responsible for the conversion of reduced GSH into its oxidized version GSSG, and a downregulation of adenylyl-sulphate reductase (EC 1.8.4.9), leading to cysteine production, were observed. Regarding the regulation of genes potentially involved in plant-pathogen interaction, the transcription of CDPKs (calcium-dependent protein kinase), CaM/CML (calcium sensors involved in the regulation of plant development and stress responses), HSP90 (heat shock protein 90), and RBOHs (respiratory burst oxidase, responsible for ROS generation) was upregulated. Within the same pathway, the upstream components CNGSs (cyclic nucleotide gated channels) and RPM1 (NBS-LRR protein) were downregulated. Furthermore, a gene encoding WRKY229 and involved in the MAPK signaling pathway, linked to H2O2 production and leading to programmed cell death, was upregulated.
The treatment clearly impacted plant hormonal signaling by downregulating the transcription of two genes encoding a protein homologous to AUX1 (auxin influx transporter) and CRE1 (cytokinin receptor 1), respectively [20,21], while a gene encoding a putative ABA receptor (PYR/PYL) was upregulated. Carotenoid biosynthesis and metabolism, connected with ABA biosynthesis, were affected through the downregulation of a gene encoding zeaxanthin epoxidase and the upregulation of a gene encoding an epoxicarotenoid dioxygenase, the latter enzyme being the limiting step responsible for producing xanthoxin and, consequently, abscisic acid (ABA). The transcription of a gene encoding jasmonate o-methyltransferase was upregulated, meaning that the conversion of jasmonate into methyl-jasmonate may be favored. Several genes encoding ABC transporters were differentially regulated: ABCB (participating in the mediation of polar auxin transport and multidrug resistance), ABCC (associated with detoxification), and ABCG (PDR5) subfamily members were down-regulated, while an ABCG subfamily member (responsible for secondary metabolite transport) was up-regulated (Table S5).
Besides the previously mentioned pathways, KEGG analysis also highlighted transcriptional changes related to amino acids. Genes encoding acetolactate synthase and L-proline dehydrogenase, which are involved in the pathway of biosynthesis of L-valine, L-leucine, and L-isoleucine and in the conversion of proline into arginine, respectively, were downregulated. Moreover, the biosynthetic pathway of mugineic acid (an iron chelating compound) from methionine was altered after the DYE application through the upregulation of nicotianamide synthase. The gene encoding hydroxypyruvate reductase, belonging to the serine biosynthetic pathway and responsible for the transformation of hydroxypyruvate into glycerate, was upregulated. Finally, in the nucleotide metabolism, the transformation of uridine (a by-product of L-glutamine) into uracil was upregulated (Table S5).

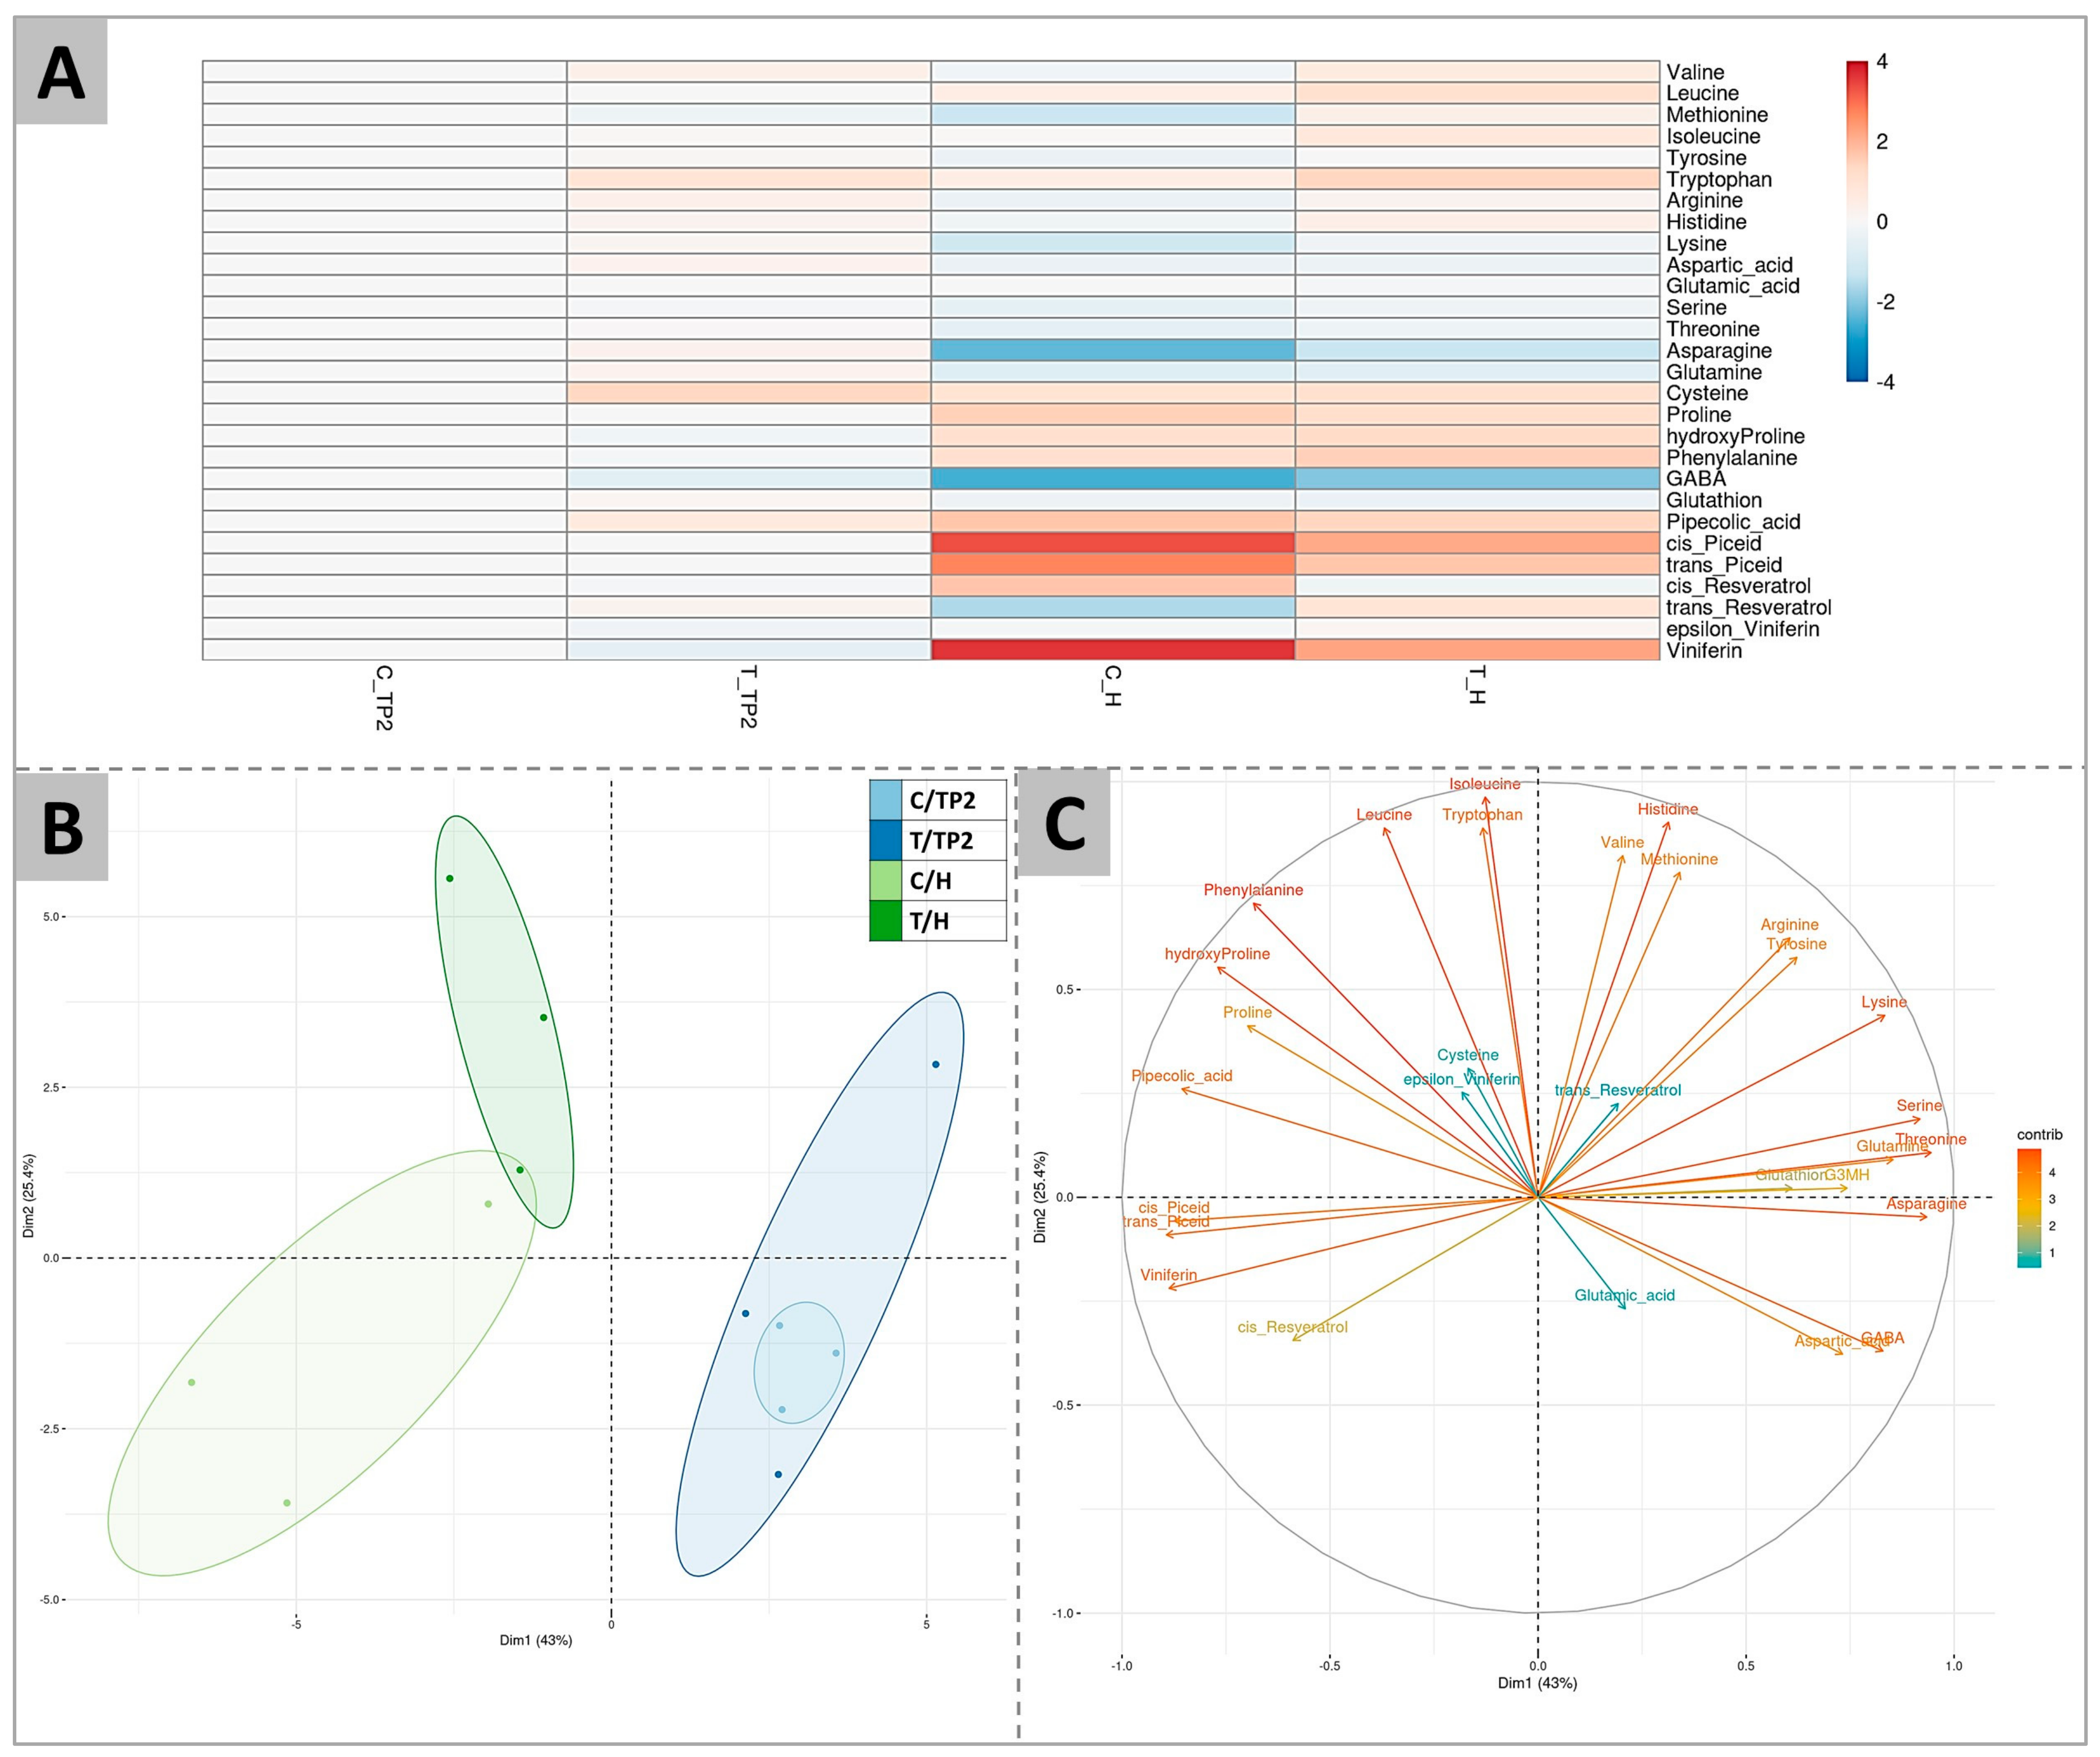
2.4. Untargeted Analysis of Molecular Responses to DYE Application: Combined Effects of Time and Treatment

The effect of the treatment on the overall time-course expression of genes during the ripening of the berry was analyzed by comparing the dynamics of the transcriptional profiles from TP2 to H in treated and control samples using the likelihood ratio test (LRT) in DESeq2. LRT allowed the identification of all genes that showed a change of expression across the different timepoints as a function of the effect of treatment with DYE on their expression trends during berry ripening.
After statistical analysis (Figure 8), it was possible to cluster the genes into four groups according to their transcriptional expression behavior. In the three groups 1, 2, and 4, genes that, in untreated berries, displayed an intrinsically slightly decreasing (groups 1 and 4) or clearly decreasing (group 2) expression trend along with the ripening of the fruit were included. Conversely, group 3 included genes that displayed an upregulation from TP2 towards ripening (H) (Figure 8A,B). The treatment with DYE interfered with these naturally occurring gene expression trends by smoothing or even reversing them. Genes belonging to groups 1 and 2 were in fact up-regulated by the treatment at both time points in comparison to untreated berries, and their decreasing expression trend towards H was prevented for group 2 while it was reverted for group 1, the latter displaying a progressively increasing expression trend at H in the DYE-treated berries (Figure 8A,B). For groups 3 and 4, which included genes that displayed an up or downregulation from TP2 to H, respectively, the treatment resulted in an overall downregulation of the transcriptional expression level of the genes in comparison to their untreated control counterparts. This effect did not evidence a substantial interference of the treatment, with the expression trends over time remaining a progressive downregulation towards ripening for genes belonging to group 4 and an upregulation for genes belonging to group 3. An enrichment analysis was performed for each group. Group 1 (including 225 DEGs) showed significant enrichments for the terms “response to chitin” and “respiratory burst involved in defence response” (Figure 8C). Group 2, probably due to a lower number of genes (41 DEGs), did not highlight any enrichment results. Group 3 (64 DEGs) evidenced the significantly enriched terms “terpene synthase activity” and “terpenoid biosynthetic process”, “lyase activity”, and “magnesium ion binding”. Finally, group 4 was enriched for the term “vacuolar membrane”.
An in-depth analysis of the putative function of the DEGs belonging to the four groups pointed out a selective transcriptional modulation of several genes playing a role in abiotic and biotic stress responses and in specific hormonal metabolic and transduction processes in response to DYE treatments (listed in Table 1). In fact, two genes (Vitvi08g02053, Vitvi08g02051, group 1) were identified that encode proteins with homology to E3 Ubiquitin Ligases (U-box 23), are putatively involved in the regulation of responses to drought stress and to PAMP-triggered immunity [22,23], and belong to the “response to chitin” and “respiratory burst involved in defence response” enriched categories of group 1. A third U-box protein encoding gene (U-box 17) (Vitvi12g00139, group 4), possibly involved in defenses against pathogens [24], appeared to be downregulated. Group 1 also included two WRKY transcription factors, namely WRKY30 (Vitvi15g01003) and WRKY33 (Vitvi08g00793), identified in Arabidopsis as positive regulators of abiotic responses and resistance to Botrytis, respectively [25,26]. Remarkably and consistently, with the activation of biotic and abiotic stress responses, several genes involved in the modulation of ROS homeostasis were upregulated. These include one gene encoding a glutathione peroxidase (Vitvi02g00332, group 1), counteracting oxidative damage [27], one encoding a redox-responsive AP2/ERF transcription factor (ERF109) (Vitvi03g00500, group 1) required for activation of ROS quenching genes and proteins, and a respiratory burst oxidase (RBOHB) (Vitvi14g00183, group 2) encoding a gene required for the H2O2-dependent induction of thermotolerance through the stimulation of heat shock proteins [28,29]. Accordingly, several abiotic stress- and ROS-inducible genes encoding heat shock proteins, with putative roles in thermotolerance, were upregulated (e.g., HSP 17.4 (Vitvi13g00491, group 1), HSP 70.1 (Vitvi06g00443, group 2; Vitvi08g02189, group 1) and HSP 90.1 (Vitvi02g00025 and Vitvi16g01103, group 2)) together with a heat shock transcription factor A2 (Vitvi04g00092, group 1), putatively involved in the activation of heat stress memory genes [30], a heat shock transcription factor A6B (Vitvi07g00078, group 1), involved in ABA inducible thermotolerance [31] and a histone chaperone protein (anti silencing function ASF1 (Vitvi01g00372, group 1)) responsible for the activation of heat stress responses through histone modifications [32] (Table 1).
Interestingly, the DEGs upregulated by DYE treatment (included in groups 1 and 2) also comprised several genes encoding key enzymes of the main biosynthetic steps of jasmonic acid (JA) and ethylene, which act synergistically in response to abiotic and biotic stress, and, to some extent, of ABA and IAA. As far as JA biosynthesis is concerned, two genes encoding lipoxygenase (LOX) (Vitvi13g01780 and Vitvi09g00085, group 1), involved in the early biosynthetic steps of the hormone through metabolism of free fatty acids [43,44], were up-regulated in concert with genes encoding two GDSL-like lipases (Vitvi09g00038 and Vitvi10g00669, group 1) [48], a DAD1-like lipase (Vitvi07g00039, group 1) [49], and a phospholipase (Vitvi15g00298, group 1) [50]. These may likely control the upstream degradation of lipid molecules to provide free fatty acid substrates for subsequent LOX action. JA-responsive genes were also upregulated by the treatment, including genes encoding a jasmonic acid carboxyl methyltransferase (Vitvi04g02169, group 1), catalyzing the methylation of JA [46,47], and one gene encoding sulfotransferase 2A (Vitvi13g00864, group 1), involved in the sulfonation of hydroxy-JA [51]. Among the downregulated genes (groups 3 and 4) putatively involved in JA responses, a second gene encoding a sulfotransferase 2A (Vitvi13g01379, group 3) and a JA-responsive gene encoding proline dehydrogenase (PDH2) (Vitvi14g01283, group 4) [52], together with genes encoding a MAPK kinase (Vitvi12g02545, group 4), which negatively regulate wound responses [53], and a leucine rich repeat receptor kinase (Vitvi11g01479, group 4), which represses ethylene and JA signaling pathways [54], were identified. Consistently, a synergic co-regulation of ethylene-related genes could be evidenced, with the upregulation of a gene encoding the ethylene-forming enzyme ACO4 (Vitvi10g02409, group 1) [55] as well as various ERF transcription factors encoding genes, showing homology to ERF4 (Vitvi19g01784, group 1) (ethylene and JA inducible) [59], ERF5 (Vitvi16g01438, group 1) (a positive regulator of JA/ethylene responsive genes to enhance resistance to Botrytis) [56,57], ERF9 (Vitvi12g00274, group 1) (regulating defense mechanisms against necrotic fungi through the ethylene/JA signaling pathway), ERF105 (Vitvi16g01444, Vitvi17g00787, Vitvi16g01434, Vitvi16g01432, Vitvi18g00295 and Vitvi16g01423, group 1) (regulator of cold responses) [66], and ERF71 (Vitvi07g00357, group 1) (hypoxia responsive) [62]. In addition, a phosphatase (AP2C1) (Vitvi06g00667, group 1) negatively regulating the ethylene signaling kinases MPK4 and MPK6 [60] and two hypoxia-inducible WRKY-encoding genes (WRKY22 (Vitvi15g01090, group 1) and WRKY33 (Vitvi08g00793, group 1)) [63,64,65] were upregulated. The DYE treatment also displayed effects on ABA biosynthetic and signaling genes, triggering the upregulation of ABA responsive genes such as a LEA encoding gene (Vitvi15g01084, group 1) [75], a cystatin gene (Vitvi18g03100, group 1) [79], a DREB subfamily A-1 of the ERF/AP2 transcription factor gene (CBF3) (Vitvi16g00941, group 1), and a sulphate transporter gene (Vitvi05g00548, group 1) required for the activity of the ABA biosynthetic enzyme aldehyde oxidase [78], a receptor-like kinase gene (LRK10) (Vitvi01g00353, group 2) [80], and an SNF1-related kinase (Vitvi17g00116, group 1) [67] positively regulate ABA responses. Further positive regulators of ABA signaling that were upregulated by DYE treatment included a gene encoding a WRKY6 (Vitvi10g00063, group 1) [73] and a WRKY44 transcription factor (Vitvi08g00793, group 1) [69], and an NCED4 carotenoid cleavage dioxygenase (Vitvi02g01288, group 2), the latter probably not involved in the direct generation of ABA [77], as well as a cytokinin responsive factor that was claimed to play a role in nitrogen uptake [93]. On the other hand, genes encoding a putative ABA biosynthetic enzyme NCED6 (Vitvi05g00963, group 3) [83], the ABA transporter ABCG25 (Vitvi18g01703, group 3) required for fine-tuning ABA export from cells, the ABA importer ABCG40 (Vitvi04g00423, group 3) [82], and the ABA antagonistic and gibberellin inducible gene GASA6 (Vitvi17g00601, group 3) [84], as well as a gene encoding a cytokinin receptor histidine kinase (Vitvi12g00685, group 4), a negative regulator of ABA sensitivity, were downregulated by DYE treatment. Finally, DYE treatment resulted in the overall downregulation, in comparison to untreated berries, of a gene encoding an AUX1 auxin influx carrier (Vitvi13g00019, group 4) [90] and one gene encoding a PIN1 auxin efflux carrier (Vitvi17g00210, group 3) [94], and in the upregulation of an Aux/IAA encoding gene (AUX/IAA7) (Vitvi11g00394, group 2) [86] and a Ca2+-dependent transducer of auxin responses (Vitvi12g00594, group 1) [87].
The most relevant functional results of the untargeted molecular analysis of genes listed in Table 1 are schematically represented in Figure 9. Overall, DYE treatment actively changed the expression (down and/or upregulated) of genes participating in sulphur and glutathione metabolism, plant-pathogen interaction, ROS signaling, hormone biosynthesis and signal transduction, and hormone transporters.

3. Discussion

Aromatic development in white grapes is the result of the activity of a wide range of metabolic pathways balanced by the interplay between developmental and environmental cues [1]. Several parameters play crucial roles in determining the final grape composition in terms of sugars, acidity, and the accumulation of secondary metabolites and, consequently, in wine quality. These include genetic factors, vineyard management, soil physico-chemical composition, and climatic factors. Secondary metabolites have a great impact on wine aroma, which in turn is recognized as one of the main factors in wine’s quality [1,5]. The evident impacts of climate change on grape berry aroma and composition are complex and vary depending on the specific components of the aromatic profiles [6,7]. Maintaining suitable compositional characteristics for later transformation into wines with well-defined and recognizable sensory attributes is an urgent need for wine makers and markets, requiring the implementation of effective mitigation strategies. The adoption of naturally derived molecules to enhance the overall aroma complexity of grapes or to keep it at acceptable levels even in the presence of the negative effects of adverse climatic conditions represents an important tool for viticulturists [6,7,8]. The use of DYE applications on grapes has been recently proven to be an effective strategy to ensure the maintenance of secondary metabolite content. For example, in Merlot grapes, Tomasi et al. (2021) [95] have shown that DYE treatments increased overall flavonoids and anthocyanin contents and their extractability [95]. Consistently, Pastore et al. (2020) [14] have reported that DYE treatments stimulated the biosynthesis of anthocyanins in the berries of Sangiovese potted plants, leading the authors to conclude that DYE may be an effective mitigation strategy to counteract the detrimental effects of high temperatures on anthocyanin biosynthesis [14]. Similarly, additional studies performed on white grapes demonstrated that the DYE application on grapes may also be effective in improving or better maintaining the aromatic precursors in Glera [96]. In Sauvignon Blanc (SB), these effects included a stimulation of GSH and of the thiol aroma precursors of 3-mercaptohexanol (3MH) typical of Sauvignon Blanc grapes, such as cysteine- and glutathione-bound cys-3MH and GSH-3MH, respectively [10]. Even though Pastore et al. (2020) [14] have shown that in red grapes, DYE exerts its action through the upregulation of the key genes involved in the anthocyanin biosynthetic pathway (e.g., PAL (phenylalanine ammonia lyase), CHS and CHI (chalcone synthase and isomerase), and F3H (flavanone 3-hydroxylase)), the mechanisms of action of DYE are still only partially clarified [14].
In this manuscript, we have aimed at reaching a more comprehensive view of the physiological and molecular mode of action of DYE in white grapes. To this end, we have treated SB’s vineyards for two consecutive years (2020 and 2021) with specific inactive dry yeast extracts. Following the application, we have characterized as comprehensively as possible the evolution of ripening, the contents of the main berry metabolites, and the transcriptional profiles. Our data confirmed previous findings suggesting that DYE did not interfere with the overall technological ripening in that, at H, acidity and total sugars showed no significant differences between treated and control samples [15]. Therefore, DYE treatments did not significantly interfere with the overall ripening process of SB grapes in the years considered. Thus, DYE action seems to depend on more specific effects on selected metabolic pathways.
In fact, cys-3MH and GSH-3MH (the precursors strongly influencing the aromatic profile of SB’s wine), terpenes (nerol and geranic acid), and benzenoids (methyl salicylate) increased in the berries of DYE-treated SB grapevines, in agreement with the findings of Šuklje et al. (2016) [15]. Conversely, GSH content slightly decreased after DYE treatment, even though no significant differences were observed. In plants, glutathione contributes to sulfur metabolism, redox control, and detoxification, and in SB berries, it contributes to the biosynthesis of the above-mentioned 3MH precursors by glutathionylation of trans-2-hexenal, a product of the LOX pathway [18]. Gamma glutamyl transpeptidase (GTT) is responsible for the conversion of GSH-MH into Cys-MH [12]. Indeed, the higher and lower expression, respectively, of the VvGST3 and VvGGT encoding genes (Figure 5), and the above-described levels of the respective metabolites, may support the hypothesis of a stimulation of GSH conjugation with trans-2-hexenal in response to DYE. LOX pathway-derived products are often described as having an herbaceous, leafy “green” aroma in wine [97], thus the stimulation of their conjugation with GSH may also result in a reduced herbaceous character. Thus, our findings suggest for the first time that DYE treatment may increase the activity of the LOX pathway and induce a faster turnover of 2-hexenal and GSH through the regulation of GST and GGT.
The analysis of the complete profiles of amino acids showed that the treatment with DYE overall did not strongly interfere with the evolution trends of the amino acid contents during ripening, which showed a progressive increase towards later ripening stages (from TP2 to H) for valine, methionine, proline, and tryptophan and a progressive decrease for arginine, asparagine, and GABA (Figure 3). When analyzing the single compounds, arginine and proline remained the most representative amino acids, accounting for 67% of total amino acids both in control and treated berries at ripening, although with different percentages in the two theses (Figure 3B). Nevertheless, DYE induced a delay in arginine decrease as well as in proline increase, resulting in a higher arginine-to-proline ratio at H. A higher arginine-to-proline ratio means a balanced proportion of the yeast-assimilable amino acids that are required to carry on a satisfying fermentation, particularly when a yeast strain with high nitrogen requirements is used [98]. Similarly, valine was more accumulated at most time points after DYE spraying during both years (2020 and 2021). According to Stribny et al. (2015) [99], valine is degraded into isobutyl alcohol, an aliphatic alcohol that is fermented by yeast, giving a desired fruity and floral aroma to wines [99]. The increase of this amino acid in grapes after DYE treatment may result in an improvement in wine aroma and is consistent with the effects suggested by Šuklje et al. (2016) [15], reporting specifically on the effects exerted by DYE on berry amino acidic composition and its potential consequences on yeast fermentation [15]. Similarly, benzeneacetaldahyde, which is synthesized from phenylalanine and appreciated in the sensory profile of wines, providing sweet flowery notes [100,101], significantly increased in response to DYE. The downregulation of phenylalanine in one vintage may be explained because of its transformation into benzeneacetaldahyde. Proline has been suggested to play an adaptive role in plant stress tolerance, acting as a ROS scavenger, stabilizing proteins’ structures, and signaling stress [102]. The observed reduction in proline levels induced by DYE treatment may be an indication of reduced berry stress. Similarly, GABA is a molecule associated with responses to abiotic and biotic stress factors [35,103]. The decrease in GABA may further confirm the above findings and suggest that DYE could improve the overall health of the vine.
These hypotheses were also supported by the untargeted RNA-Seq molecular analyses carried out on samples of the 2020 vintage, through: (1) the comparison of treated versus untreated berries at each time-point (TP2 and H); and (2) the evaluation of the DYE effects on the dynamics of ripening-associated genes. The latter analysis allowed the identification of four different groups of DEGs clustered according to their ripening specific expression profiles and significantly affected by the treatment in terms of either an increased or decreased expression level (Figure 8). For one group of genes (Group 1, Figure 8), the DYE treatment, besides resulting in a significant stimulation of transcription at both TP2 and H, reverted the trend of expression along ripening from a downregulation into an upregulation. Indeed, one of the main findings of this work was the identification of several genes involved in abiotic and biotic stress responses, highlighted as differentially expressed in later analyses. The identification of the term “response to chitin” in the upregulated DEG enrichment strategy suggests the elicitor-like mode of action of DYE, as well as the enrichment terms “response to heat”, “response to hypoxia”, and “response to pathogens and effector triggered immunity” clearly indicated the stimulation by DYE of responses that recalled those typical of abiotic and biotic stresses (Figure 7 and Figure 8). Since chitin is a ubiquitous cell wall structural component of fungi and is contained in DYEs, plants have chitin-specific receptors that activate defense mechanisms, relying on phenolics, terpenes, and ROS production [104,105]. Our RNA-seq data support the hypothesis that DYE affected ROS homeostasis in the berries, as testified by the upregulation of a gene encoding glutathione peroxidase (Vitvi02g00332, group 1), responsible for the transformation of glutathione (GSH) into its oxidized form glutathione disulfide (GSSG) to scavenge H2O2 in excess. The GSH:GSSG ratio is in fact an important bioindicator of cellular oxidative stress [27,106]. The DYE treatment also stimulated sulfate metabolism by activating the transcription of the gene encoding APS (adenosine phosphosulfate), which is involved in the production of cysteine, which in turn contributes to GSH levels. This is in accordance with the tendentially higher (even though not significantly higher) contents of cysteine observed in treated samples in the 2020 vintage (supporting data, Table S1). Furthermore, as reported above, the concomitant upregulation of several genes involved in the modulation of ROS homeostasis, such as that encoding the Redox Responsive AP2/ERF transcription factor ERF109 (Vitvi03g00500, group 1) (activator of ROS quenching genes) and a respiratory burst oxidase (RBOHB) (Vitvi14g00183, group 2) generating H2O2, led us to conclude that DYE is able to trigger an augmented ROS biosynthesis/scavenging loop and, consequently, an improved abiotic stress tolerance of berries (Table 1). This protective effect could depend on the downstream upregulation of a subset of ROS-inducible genes encoding proteins involved in controlling thermotolerance, such as heat shock proteins that were previously shown to be ROS-inducible (e.g., HSP 17.4, 70.1, and 90.1) (Vitvi13g00491, Vitvi08g02189, Vitvi09g00045, group 1; Vitvi06g00443, Vitvi02g00025, Vitvi16g01103, group 2) [36,38,40], NO-inducible (heat shock transcription factor A2) (Vitvi01g01846, group 1) [30], ABA-inducible (A6B) (Vitvi07g00078, group 1), or heat stress-inducible (anti silencing function ASF1) (Vitvi01g00372, group 1) [42]. These genes share a common transcriptional responsiveness in the presence of ROS, so this may be considered a downstream consequence of the above-mentioned increased ROS homeostatic levels evoked by the DYE treatment. In addition, the same genes are involved in the long-term regulation of heat stress responses and thermotolerance through the activation of heat stress memory genes and histone modifications [32].
Considering these data together, our findings provide for the first time significant molecular evidence for the previously hypothesized (Pastore et al., 2020) [14] elicitor-like mode of action of DYE on grapevine berries. At the same time, our data also highlight the putative signaling pathways of DYE responses by identifying several transcription factors, some of which appear to be ROS-responsive, that may be responsible for the downstream regulation of specific metabolic genes.
In addition, our data would support the hypothesis that the berries of plants subjected to DYE treatment display increased resilience to abiotic stress. This effect may be accomplished through a finer regulation of ROS levels and a reduced oxidative stress that may be testified by a diminished proline content, assumed as a proxy for oxidative stress [102], and by the upregulation of the VviCCD4a encoding gene, most likely not involved in ABA biosynthesis but rather in the generation of signaling molecules [77]. In fact, preventing the oxidation of aroma precursors in grapevine berry fruits, especially when they are exposed to heat or drought, either alone or in combination, has been claimed by several authors to be essential to favor better later maintenance in the wine [4,5,14].
Moreover, we found that the treatment with DYE specifically induced a subset of hormonal responses, a novel, unpredicted aspect that has not been evidenced by previous studies dealing with DYE. In particular, the upregulation of several genes encoding key enzymes of the main biosynthetic steps of jasmonic acid (JA) and ethylene strengthens the hypothesis of a selective “priming” action of DYE. This priming action depends on the increase of these two stress hormones, which notoriously act in synergism in the regulation of stress responses. It can be speculated that these hormones may be possibly involved in reinforcing those responses falling within the functional categories of “response to chitin” and “response to pathogen”, while leaving unaffected the main ripening processes. Regarding JA biosynthesis, the upregulation of three types of lipases (Vitvi09g00038, Vitvi10g00669, and Vitvi15g00298, group 1) [48,49,50] and of two LOX genes (Vitvi13g01780, Vitvi09g00085, group 1) [44,45] supports the view of stimulation of several key biosynthetic steps of the hormone. The upregulation of JA-responsive genes like hydroxy-JA sulfotransferase 2A (Vitvi13g00864, group 1) [51] may be a feedback control response induced by the increased JA levels. The activation of JA responses was also confirmed by the downregulation of negative regulators of JA signaling (Table 1). The co-regulation of the ethylene biosynthetic gene ACO4 (Vitvi10g02409, group 1) [55] as well as various ethylene and JA inducible ERF transcription factors encoding genes (ERF4 (Vitvi19g01784, group 1) [59], ERF5 (Vitvi16g01438, group 1) [56,57], ERF9 (Vitvi12g00274, group 1), and ERF105 (Vitvi16g01444, Vitvi17g00787, Vitvi16g01434, Vitvi16g01432, Vitvi18g00295 and Vitvi16g01423, group 1) [66]) further suggests the simultaneous enhanced action of the two hormones induced by DYE treatment. It is interesting to note that some of these genes, together with WRKY encoding genes (WRKY22 (Vitvi15g01090, group 1) and WRKY33 (Vitvi08g00793, group 1)) [63,64,65], were reported in Arabidopsis to be putatively associated with hypoxia responses and with JA- and ethylene-inducible resistance to necrotrophic pathogens (Botrytis), further supporting the hypothesis of a “priming” effect exerted by DYE.
ABA responses appeared to also be affected, although the final readout of such effects seems less univocally interpretable since both positive and negative regulators were induced by the treatment. The upregulation of ABA responsive genes (Table 1), as well as the increased transcription of a sulphate transporter gene (Vitvi05g00548, group 1) required for ABA biosynthesis [78] and of an SNF1-related kinase gene (Vitvi17g00116, group 1) [68], and the downregulation of a gene encoding a cytokinin receptor histidine kinase (Vitvi12g00685, group 4) negatively regulating ABA sensitivity, would support an overall positive regulation of ABA responses by DYE supply. However, this hypothesis may be contrasted by the downregulation of a gene encoding the rate-limiting step of ABA biosynthesis, NCED6 (Vitvi05g00963, group 3) [83]. It is interesting to note that the DYE treatment also probably interfered with the transport of two hormones: of ABA, by down-regulating the expression of genes with similarities with two ABA transporters (the ABA export carrier ABCG25 (Vitvi18g01703, group 3) and the ABA importer ABCG40 (Vitvi04g00423, group 3) [82]), and of auxin, by down-regulating genes encoding proteins with similarity to the auxin influx carrier AUX1 (Vitvi13g00019, group 4) [90] and the efflux carrier PIN1 carrier (Vitvi17g00210, group 3) [94]. An interesting effect of DYE is also the reversion of declining expression of a cytokinin-responsive factor (CRF4) (Vitvi16g01201) from TP2 to H (Table 1). This gene has been claimed to be a master regulator of nitrogen uptake by controlling more than half of the genes associated with nitrogen uptake and assimilation [107]. By considering that nitrogen regulation can effectively promote the improvement of berry components and the formation of flavor compounds in wine grapes [108], the fact that DYE treatment can modulate the expression of CRF4 is a topic that should be further investigated.
Overall, with these data, we provide the first comprehensive picture of the transcriptional signaling pathways that are modulated by the treatment with DYE in grapevine berries. We identified for the first time several DYE-responsive transcription factors that may be responsible for the activation of the downstream metabolic responses of berries selectively modulated by DYE without interfering with the main ripening parameters, sugars, and acidity. In addition, our data also provide novel and significant insights supporting the role of DYE in the modulation of ROS stress and, unexpectedly, of specific subsets of the signaling components of the JA and ethylene hormonal pathways, activated to modulate stress adaptation through molecular priming. Finally, both the molecular and metabolic evidence provided in this work point out a specific effect of DYE on the LOX pathway that may be coupled to a faster turnover of GSH, explaining the DYE-dependent increase of GSH- and Cys-bound 3MH precursors.

4. Materials and Methods

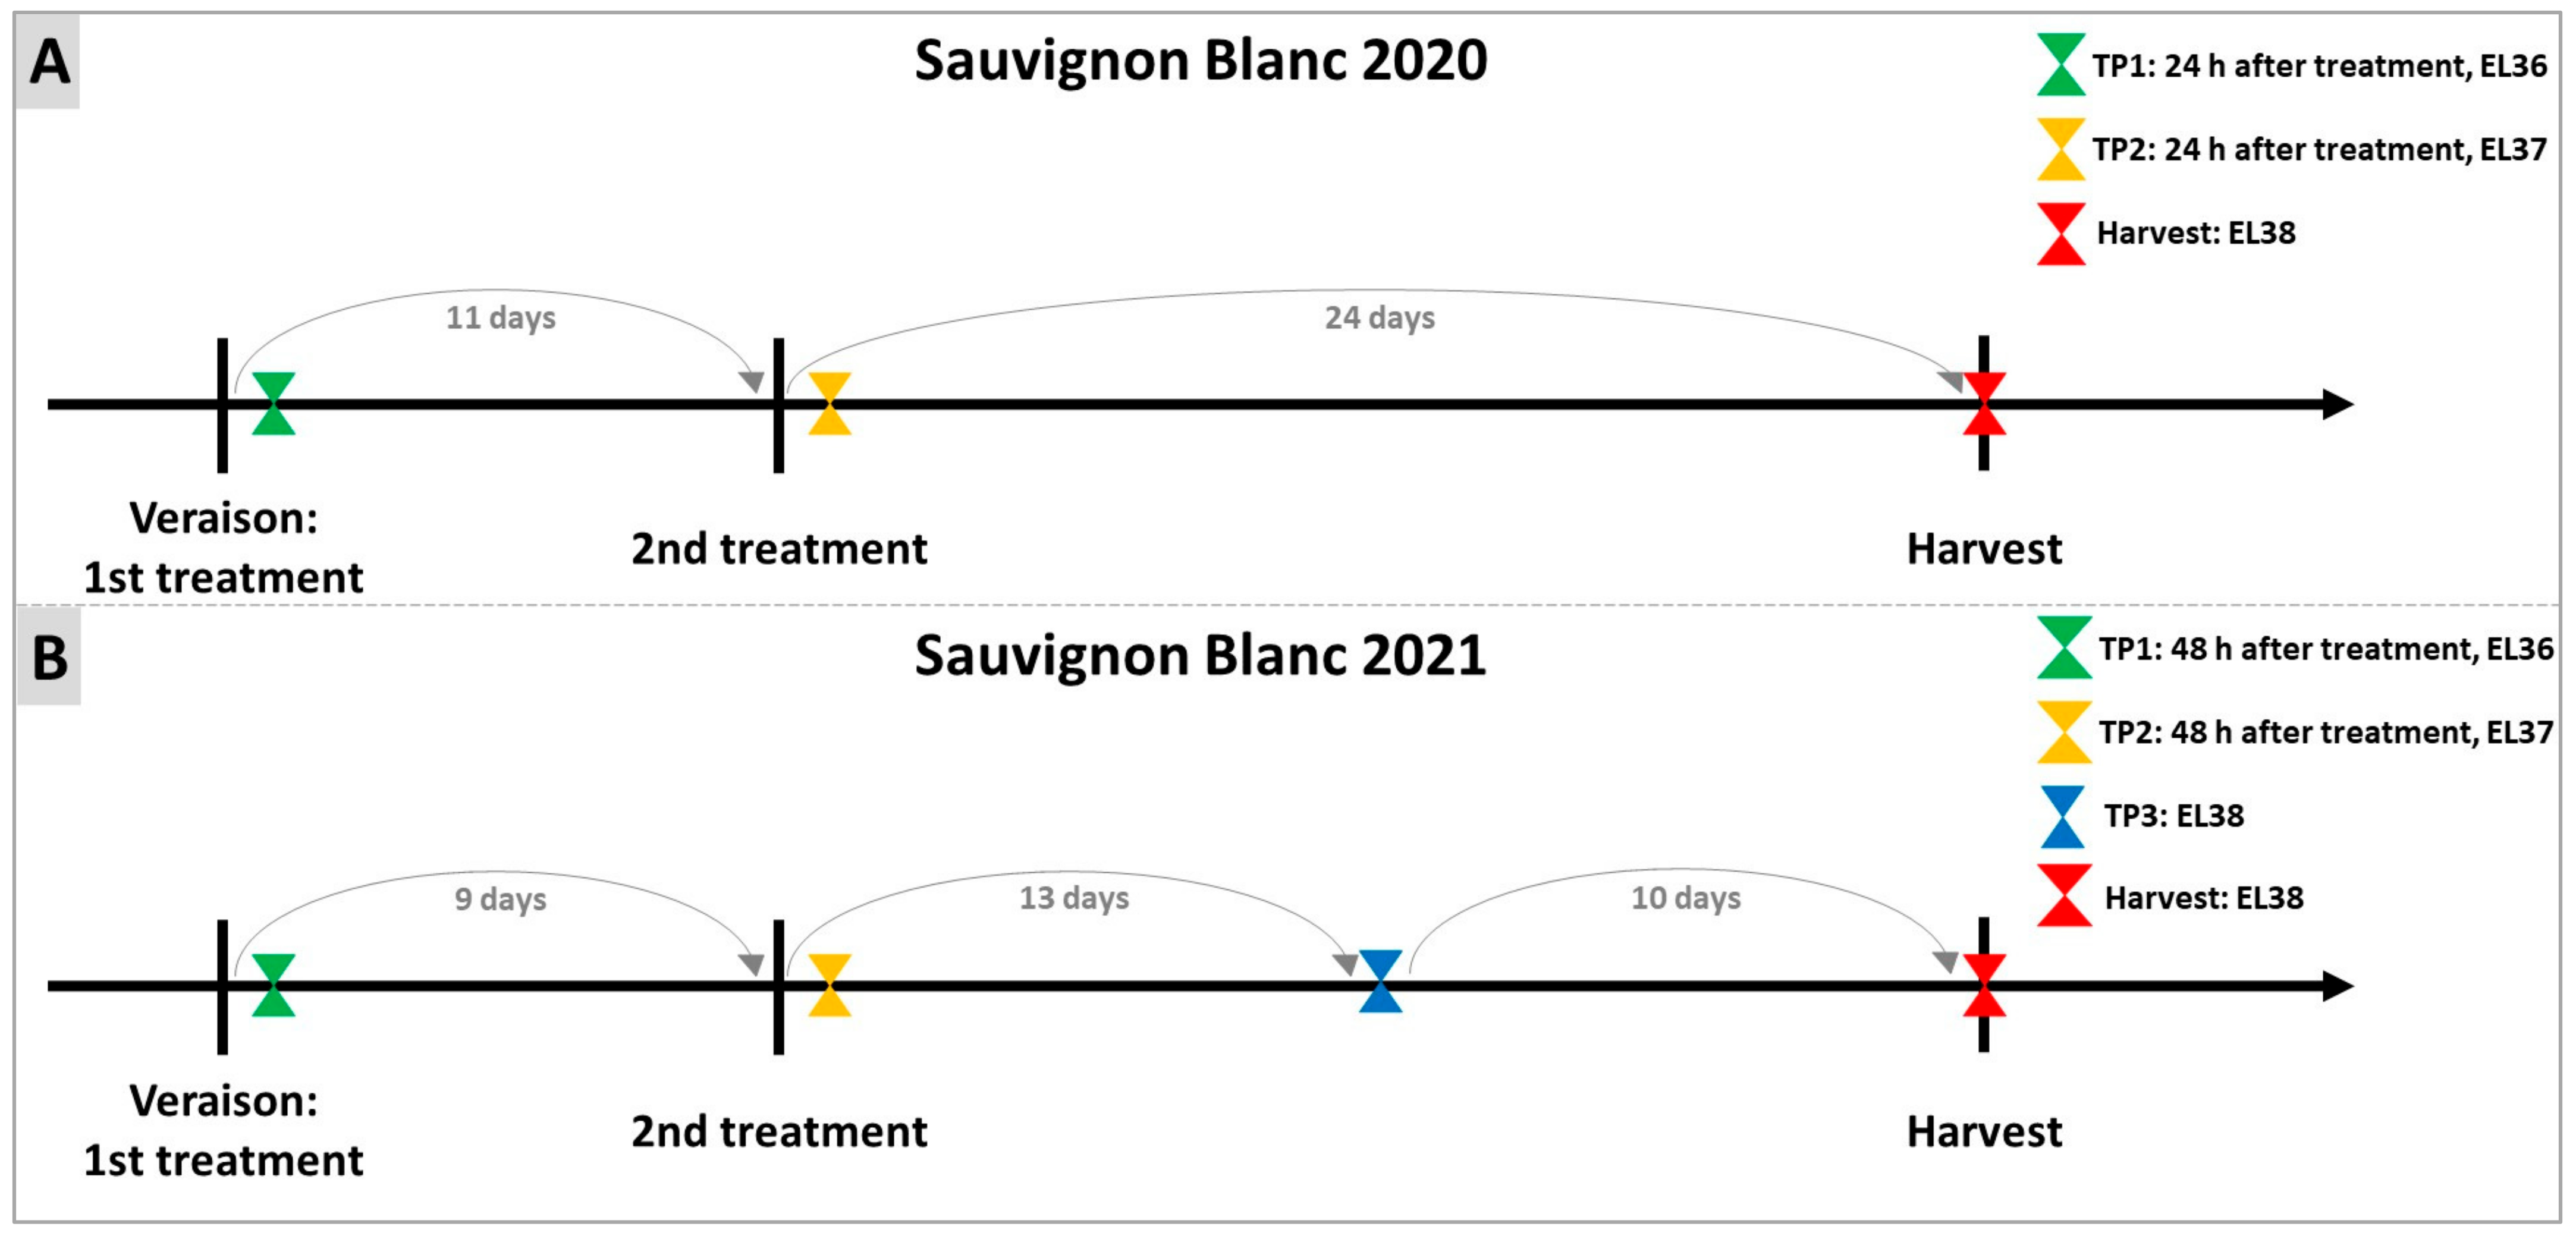
4.1. Experimental Design and Plant Material

A commercial vineyard (La Madunina), located in northern-east Italy (Friuli-Venezia Giulia region, Sequals, PN), of Sauvignon Blanc (Vitis vinifera L.) was chosen to test a commercial DYE product (“LalVigne™ AROMA”, Lallemand Inc., Montreal, QC, Canada) in 2020 and 2021. The choice of the experimental sites was based on the high degree of homogeneity of the vineyards, on the presence of long rows (200 m) allowing sampling from several independent plants arranged in randomized blocks without impacting the fruit load, and on the fully mechanized conduction of the vineyard, further ensuring homogeneity. The meteorological data (Figure S1) in Sequals was evaluated and determined to show no significant differences in terms of temperature or annual precipitation between the years 2020 and 2021 (1941 and 1971 mm, respectively). During the summer months (July to September), there was a slight change in precipitation during the two vintages (in 2020, approximately 500 mm, while in 2021, around 370 mm).
Six rows were treated, and an additional six rows were kept without treatment and used as a control. The two groups of six rows were separated by an additional two rows to avoid the drift effect of the product. All the treatments were carried out in the early hours of the morning through a double tunnel recovery atomizer adopting the recommended dosage (10g/L; 3 Kg/Ha) [109].
The treatments with DYE were performed as indicated in Figure 10. In 2020, the first treatment was carried out when 5% of grapes reached veraison (⁰Brix ≥ 7) [109]; the second treatment was carried out 11 days later, and the sampling was performed 24 h after each treatment. Finally, a further sampling was carried out on the day of harvest (H). In 2021, as in 2020, the first treatment was executed at the beginning of veraison. A second DYE treatment (TP2) was performed 10 days after the first treatment, and sampling occurred 48 h after each treatment and at H. In this latter vintage, a third sampling was performed between the second treatment and H.
Three biological replicates were sampled for each experimental condition (DYE-treated and control) at each time point (TP). Each replicate was composed of a mix of berries sampled from three independent blocks, each consisting of two rows: the first and second row, the third and fourth row, and the fifth and sixth rows originated from replicates one, two, and three, respectively. From each block, five bunches were collected from each row, so that each replicate was finally obtained from a mixture of berries from ten bunches. Bunches were always collected from the same side of the row, guaranteeing that they were grown under identical sun exposure conditions. The samples were frozen with liquid nitrogen immediately after collection in the field, transported on dry ice, and then stored at −80 °C for further analysis.

4.2. Acidity and Total Sugars

Total sugars were measured for each experimental condition individually on 60 berries belonging to each replica/treatment at each sampling date. The measurements were performed in the field using a digital refractometer (Pocket Refractometer Pal-1, Atago (Tokyo, Japan)).
Acidity was determined by titration. For each replica, 20 randomly collected berries were manually pressed, and their juice was collected. Titration was performed in triplicate for each replica, and the total acidity was expressed in grams of tartaric acid per liter as described by Thermo Fisher (Waltham, MA, USA) [110].

4.3. Aroma Precursors

4.3.1. Free Precursors

Free volatile aroma precursors have been analyzed at Scuola Superiore Sant’Anna (Pisa, Italy) employing gas chromatography coupled with mass spectrometry (GC-MS) equipment. The solid-phase micro extraction (SPME) technique has been used to analyze the head space of grape samples, applying an untargeted analytical approach to achieve grape berry volatile profiling. Grapes were homogenized with 1 M NaCl buffer solution (1:1 ratio in weight) by using an UltraTurrax (Mod. T25, IKA) and thawed at 15 °C for 15 min. 10 g of sample were transferred to a 20 mL glass crimp vial for headspace analysis and sealed. The vials were incubated under agitation for 45 min at 40 °C, and volatiles were sampled using an SPME fiber (50/30 µm, DVB/CAR/PDMS, 1 cm long; Supelco, Bellefonte, PA, USA). Sample analysis, as well as compound identification and quantification, have been performed according to Modesti et al. (2023) [111]. A Clarus 680 gas chromatograph equipped with a split/splitless injector (PerkinElmer®, Waltham, MA, USA) was used for the analysis. Volatiles were separated on a fused silica capillary column (DBWax, 60 m, 0.32 mm ID, 0.25 µm film thickness; Restek, Bellefonte, PA, USA), using helium as carrier gas with a flow rate of 1 mL/min. Compounds were identified using a mass spectrometer (Clarus 500 mass spectrometer, PerkinElmer®, Waltham, MA, USA) coupled to the GC.

4.3.2. Bound Precursors and Thiol Precursors

Bound aromas and thiol precursors were determined at Fondazione Edmund Mach (FEM, San Michele all’Adige, Italy). Bound aromas were extracted and quantified by gas chromatography, according to Paolini et al. (2018) [112]. The extraction was performed by adsorption on an SPE cartridge (ENV+, 1 g) previously conditioned with 20 mL of methanol and 20 mL of Milli-Q water. The sample was loaded onto the cartridge, which was washed with 20 mL of Milli-Q water and eluted with 30 mL of methanol. This solution was evaporated and then dissolved in 4 mL of citrate buffer at pH 5. 200 μl of a glycosidic enzyme with strong glycosidase activity (AR 2000 at 70 mg/mL in water) were added, and the solution was kept in a 40 °C water bath overnight. After the addition of 1-heptanol (0.1 mL) as an internal standard, the free volatiles released were extracted using an SPE cartridge (ENV+, 200 mg) previously conditioned with 10 mL of methanol and 10 mL of Milli-Q water and eluted with 4 mL of dichloromethane. The organic phase was dried. Volatile organic compound analysis was performed using an Agilent Intuvo 9000 fast GC system coupled with an Agilent 7000 Series Triple Quadrupole MS equipped with an electron ionization source operating at 70 eV. The filament current was 50 μA. Separation was obtained by injecting 2 μL in split mode (1:5) into a 20-m DB-Wax Ultra Inert (0.18 mm ID × 0.18 μm film thickness) with He as carrier gas (at a flow of 0.8 mL/min). The oven temperature was programmed starting at 40 °C for 2 min, raised to 55 °C by 10 °C/min, then raised to 165 °C by 20 °C/min, and finally raised to 240 °C by 40 °C/min and held at this temperature for 5 min. The mass spectra were acquired in multiple reaction monitoring modes, setting the instrument within the dynamic system. Nitrogen was used as the collision gas, with a flow of 1.5 mL/min. The transfer line and source temperature were set at 250 °C and 230 °C, respectively.
Thiol precursors were estimated using liquid chromatography, according to Tonidandel et al. (2021) [113]. The QuEChERS method was used to extract the sample with an extraction buffer composed of acetonitrile. After incubation at 8 °C for 2 h, a 1ml aliquot of the supernatant sample extract was transferred to an autosampler vial (volume 2 mL), and 75 μL of Ebselen (ACN solution at 500 mg/L) was added. The vial was then stirred for 10 min. The derivatized sample was filtered (0.22 μm PTFE) and then transferred into an auto-sampler vial before the injection. A Waters Acquity UPLC (Waters Corporation, Milford, MA), coupled to a Xevo TQ MS mass spectrometer equipped with an electrospray ion source (Waters), was used. The chromatographic module consisted of an Acquity UPLC BEH C18 column (1.7 μm, 2.1 mm ×100 mm) working at 40 °C. 0.1% (v/v), aqueous formic acid (solvent A), and 0.1% (v/v) formic acid in MeOH (solvent B) were used at a flow rate of 0.45 mL/min. The gradient conditions of the LC mobile phase were as follows, based on times (t): t = 0–0.25 min, hold 80% A, 20% B; t = 0.25–7 min, ramp linearly to 100% B; t = 7–8.5 min, hold 100% B. The sample (2 μL) was injected using the partial loop needle overfill’ function. The mass spectrometer was used in positive electrospray ionization mode (ESI+), and the source conditions were set as follows: capillary voltage 0.6 kV; source temperature 150 °C; cone gas flow (nitrogen, 20 L/h); desolvation gas flow (nitrogen, 1000 L/h); desolvation temperature 500 °C. Argon, used as collision gas, was set at 0.20 mL/min.

4.4. Relative Quantification of Amino Acids, GABA, and Secondary Metabolites

Metabolites were analyzed by UHPLC using an adapted methodology from Schilling et al. (2022) [114]. Metabolites from powdered grape samples (300 mg fresh weight, obtained through the grinding to a fine powder of grape berry skin and pulp with liquid nitrogen) were extracted using 1200 µL of methanol containing 5 µg/mL of chloramphenicol as an internal standard. The extract was then incubated in an ultrasound bath for 10 min before centrifugation at 13,000 g at 10 °C for 10 min. Supernatants were analyzed using a Vanquish Flex binary UHPLC system (Thermo Scientific, Waltham, MA, USA) equipped with a diode array detector (DAD). Chromatographic separation was performed on an Acquity HSS T3 Column (100 × 2.1 mm, 1.8 μm particle size, 100Å pores; Waters) maintained at 30 °C. The mobile phase consisted of acetonitrile/formic acid (0.1%, v/v) (eluant A) and water/formic acid (0.1%, v/v) (eluant B) at a flow rate of 0.33 mL/min. The gradient elution program was as follows: 0–1 min at 85% B; 1–4 min, 85–70% B; 4–5 min, 70–50% B; 5–6.5 min, 50–40% B; 6.5–8.0 min, 40–1% B; 8.0–10 min, 1%B isocratic; 10–11 min, 1–85% B. The injected volume of the sample was 1 μL. The liquid chromatography system was coupled to an Exploris 120 Q-Orbitrap MS system (Thermo Scientific, Waltham, MA, USA). The mass spectrometer was operated with a heated electrospray ionization source in positive and negative ion modes. The key parameters were as follows: spray voltage, +3.5 and −3.5 kV; sheath-gas flow rate, 40 arbitrary units (arb. unit); auxiliary-gas flow rate, 10 arb. unit; sweep-gas flow rate, 1 arb. unit; capillary temperature, 360 °C; and auxiliary-gas-heater temperature, 300 °C. The scan modes were full MS with a resolution of 60,000 fwhm (at m/z 200) and ddMS2 with a resolution of 60,000 fwhm; the normalized collision energy was 30 V; and the scan range was m/z 85−1200. Internal mass calibration was operated using an EASY-IC internal calibration source, allowing single mass calibration for the full mass range. Data acquisition and processing were carried out with Xcalibur 4.5 and Free Style 1.7 (Thermo Scientific, Waltham, MA, USA), respectively.

4.5. RNA Extraction, cDNA Synthesis and RT-qPCR Expression Analysis

Before extraction, seeds were removed, and the pulp and skin were ground into a fine powder in liquid nitrogen. Total RNA was extracted from 1.2g of previously ground tissue, according to Nonis et al. (2012) [115]. Total RNA was resuspended in 30 µL of nuclease-free water. Subsequently, DNase digestion was performed with the On-Column DNase Digestion Set (Sigma–Aldrich, (Burlington, VT, USA)). The sample’s quantification was determined with a Qubit 4 fluorometer (Thermo Fisher). The purity of the samples was measured using NanoDrop 2000 (Thermo Fisher). RNA integrity was confirmed by a 1% agarose gel.
cDNA was reverse transcribed from one µg of total RNA using the M-MLV enzyme (Promega) according to the manufacturer’s instructions following the procedure described by Nonis et al. (2012) [115].
Quantitative real-time PCR was then performed using 1.2 µL of primer mix, 3.8 µL of cDNA, and 5 µL of PowerUp SYBR Green Master Mix (Applied Biosystems (Foster City, CA, USA)). Samples were amplified following the manufacturer’s instructions, and fluorescence was monitored with the step-one plus real-time PCR system (applied biosystems). Three technical replicates were carried out for each biological replicate. The primer sequences of the marker genes are reported in Table 2.
The automated Excel spreadsheet Q-Gene and modifications to the delta Ct method were used to perform the final calculations [117]. The housekeeping genes VvTCPB and VvAIG1 were used to normalize gene expression [116]. Then, using equation 2 from the Q-Gene spreadsheet, levels of expression were calculated and expressed as arbitrary units of mean normalized expression.

4.6. RNA-Seq Analysis and Data Processing

Three biological replicates for each time point an experimental thesis were used for global transcriptomic analyses. Illumina directional sequencing of mRNA was performed at the Centro di Ricerca Interdipartimentale per le Biotecnologie Innovative (CRIBI—University of Padova, Italy) on a NovaSeq 6000 instrument (Illumina, San Diego, CA, USA). For each sample x replicate combination, 25–35 M paired-end reads of 150 nucleotides were generated. The quality of the reads was assessed using FastQC. The sequenced reads were pre-processed for low-quality sequence filter and adapter trimming with ERNEFILTER 2.1.1 [118] and Trimmomatic [119], respectively. High-quality reads were mapped to the Vitis vinifera PN40024.v4 genome obtained from the Ensembl Plants database using the spliced aligner HISAT2 [120]. Gene expression counts were generated using FeatureCounts software [121]. The differential expression analysis was carried out using DESeq2 [122], applying both the default Wald test for pairwise comparisons and the likelihood ratio test (LRT) for time-course analyses. Gene ontology enrichment analysis was performed using g:Profiler (https://biit.cs.ut.ee/gprofiler/gost (accessed on 28 November 2022)) while specific pathways were determined with KEGG Mapper (https://www.genome.jp/kegg/ (accessed on 28 November 2022)). Heatmaps were built based on information collected from MapMan software.

4.7. Data Treatment

Figures were prepared with Microsoft Excel, while statistical significance was determined using R software, version 4.0.3. Venn diagrams were built using Interactive Venn (http://www.interactivenn.net/ (accessed on 29 November 2022) and heatmaps were developed using Morpheus (https://software.broadinstitute.org/morpheus/ (accessed on 29 November 2022).

5. Conclusions

This manuscript provides an in-depth, comprehensive overview of the biochemical and molecular effects of inactivated dry yeast extracts (DYE) on white grapes (var. Sauvignon Blanc). Our results demonstrated that DYE treatment did not interfere with the overall berry ripening process, as it did not affect sugars or acidity. Its action was, instead, more specifically and effectively directed towards selected metabolic and hormonal pathways. Specific aroma precursors, especially those related to sulphur and GSH metabolism, cys-3MH and GSH-3MH, typically contributing to Sauvignon Blanc aroma, were found at higher levels in grapes from vines sprayed with the DYE. Furthermore, the complete profile of amino acids as well as the RNA-seq transcriptional profiles strongly indicated that the treatment with DYE was able to trigger an unequivocal “priming” effect on berries by affecting the ROS balance and reducing oxidative damage, thus improving the stress tolerance, particularly heat stress. The DYE also stimulated a subset of ethylene and JA responses while interfering with some ABA and auxin-related genes, an aspect that will need further characterization for its functional relationships with the activation of stress responses exerted by the DYE.

Supplementary Materials

The following are available online at https://www.mdpi.com/article/10.3390/plants12193423/s1, Table S1: Amino acids and glutathione determined in samples from 2020 and 2021. Table S2: Free aroma precursors (µg/kg) determined at all time points in samples collected in 2020. Table S3: Bound aroma precursors (µg/kg) quantitated at harvest in the two years 2020 and 2021. Table S4: Targeted approach (RT-qPCR) on berries collected from both years to reach a first molecular characterization of the samples. Table S5: Untargeted molecular responses of DYE-treated versus untreated berries at TP2 and harvest in 2020. Arabidopsis function obtained from NCBI. Figure S1: Meteorological data (air temperature and rainfall) in 2020 and 2021 in Sequals, Friuli-Venezia Giulia, Italy.

Author Contributions

Conceptualization, M.R., S.Q., M.M., D.P., C.B., F.B. and B.R.; methodology, M.R., P.H., R.B., A.R., V.C., P.C., S.B., D.P. and B.R.; software, M.R., C.F., L.R. and F.M.; data curation, M.R., C.F., L.R., P.H., F.M. and B.R.; writing—original draft, M.R. and B.R.; writing—review and editing, M.R., P.H., S.Q., C.B. and B.R.; supervision, B.R.; funding acquisition, F.B. and B.R. All authors have read and agreed to the published version of the manuscript.

Funding

This research was funded by Lallemand Italia (Italy)—Danstar Ferment AG (Switzerland) project RUPE_COMM21_01. M.R. was supported by a PhD grant from “Fondazione Cassa di Risparmio di Padova e Rovigo”—cycle 36.

Data Availability Statement

The datasets generated during and/or analyzed during the current study are listed in the text and its additional files.

Acknowledgments

The authors would like to thank the company managing the vineyard where the experiments were performed: Azienda Agricola La Madunina, Sequals, Italy.

Conflicts of Interest

This research was partially funded by Lallemand Italia, responsible for the development and commercialization of the DYE product “LalVigne™ AROMA” used in the experiments.

References

  1. Lin, J.; Massonnet, M.; Cantu, D. The Genetic Basis of Grape and Wine Aroma. Hortic. Res. 2019, 6, 81. [Google Scholar] [CrossRef] [PubMed]
  2. Gattullo, C.E.; Mezzapesa, G.N.; Stellacci, A.M.; Ferrara, G.; Occhiogrosso, G.; Petrelli, G.; Castellini, M.; Spagnuolo, M. Cover Crop for a Sustainable Viticulture: Effects on Soil Properties and Table Grape Production. Agronomy 2020, 10, 1334. [Google Scholar] [CrossRef]
  3. Pons, A.; Allamy, L.; Schüttler, A.; Rauhut, D.; Thibon, C.; Darriet, P. What Is the Expected Impact of Climate Change on Wine Aroma Compounds and Their Precursors in Grape? Oeno One 2017, 51, 141–146. [Google Scholar] [CrossRef]
  4. Van Leeuwen, C.; Destrac-Irvine, A. Modified Grape Composition under Climate Change Conditions Requires Adaptations in the Vineyard. Oeno One 2016, 51, 147–154. [Google Scholar] [CrossRef]
  5. Giacosa, S.; Ossola, C.; Botto, R.; Río Segade, S.; Paissoni, M.A.; Pollon, M.; Gerbi, V.; Rolle, L. Impact of Specific Inactive Dry Yeast Application on Grape Skin Mechanical Properties, Phenolic Compounds Extractability, and Wine Composition. Food Res. Int. 2019, 116, 1084–1093. [Google Scholar] [CrossRef]
  6. Droulia, F.; Charalampopoulos, I. Future Climate Change Impacts on European Viticulture: A Review on Recent Scientific Advances. Atmosphere 2021, 12, 495. [Google Scholar] [CrossRef]
  7. Santos, J.A.; Fraga, H.; Malheiro, A.C.; Moutinho-Pereira, J.; Dinis, L.T.; Correia, C.; Moriondo, M.; Leolini, L.; Dibari, C.; Costafreda-Aumedes, S.; et al. A Review of the Potential Climate Change Impacts and Adaptation Options for European Viticulture. Appl. Sci. 2020, 10, 3092. [Google Scholar] [CrossRef]
  8. Mira de Orduña, R. Climate Change Associated Effects on Grape and Wine Quality and Production. Food Res. Int. 2010, 43, 1844–1855. [Google Scholar] [CrossRef]
  9. Crupi, P.; Santamaria, M.; Vallejo, F.; Tomás-Barberán, F.A.; Masi, G.; Caputo, A.R.; Battista, F.; Tarricone, L. How Pre-Harvest Inactivated Yeast Treatment May Influence the Norisoprenoid Aroma Potential in Wine Grapes. Appl. Sci. 2020, 10, 3369. [Google Scholar] [CrossRef]
  10. Vanzo, A.; Janeš, L.; Požgan, F.; Velikonja Bolta, Š.; Sivilotti, P.; Lisjak, K. UHPLC-MS/MS Determination of Varietal Thiol Precursors in Sauvignon Blanc Grapes. Sci. Rep. 2017, 7, 13122. [Google Scholar] [CrossRef]
  11. Ruiz, J.; Kiene, F.; Belda, I.; Fracassetti, D.; Marquina, D.; Navascués, E.; Calderón, F.; Benito, A.; Rauhut, D.; Santos, A.; et al. Effects on Varietal Aromas during Wine Making: A Review of the Impact of Varietal Aromas on the Flavor of Wine. Appl. Microbiol. Biotechnol. 2019, 103, 7425–7450. [Google Scholar] [CrossRef] [PubMed]
  12. Kobayashi, H.; Takase, H.; Suzuki, Y.; Tanzawa, F.; Takata, R.; Fujita, K.; Kohno, M.; Mochizuki, M.; Suzuki, S.; Konno, T. Environmental Stress Enhances Biosynthesis of Flavor Precursors, S-3-(Hexan-1-Ol)-Glutathione and S-3-(Hexan-1-Ol)-L-Cysteine, in Grapevine through Glutathione S-Transferase Activation. J. Exp. Bot. 2011, 62, 1325–1336. [Google Scholar] [CrossRef] [PubMed]
  13. Paciello, P.; Mencarelli, F.; Palliotti, A.; Ceccantoni, B.; Thibon, C.; Darriet, P.; Pasquini, M.; Bellincontro, A. Nebulized Water Cooling of the Canopy Affects Leaf Temperature, Berry Composition and Wine Quality of Sauvignon Blanc. J. Sci. Food Agric. 2017, 97, 1267–1275. [Google Scholar] [CrossRef]
  14. Pastore, C.; Allegro, G.; Valentini, G.; Pizziolo, A.; Battista, F.; Spinelli, F.; Filippetti, I. Foliar Application of Specific Yeast Derivative Enhances Anthocyanins Accumulation and Gene Expression in Sangiovese Cv (Vitis vinifera L.). Sci. Rep. 2020, 10, 11627. [Google Scholar] [CrossRef] [PubMed]
  15. Šuklje, K.; Antalick, G.; Buica, A.; Coetzee, Z.A.; Brand, J.; Schmidtke, L.M.; Vivier, M.A. Inactive Dry Yeast Application on Grapes Modify Sauvignon Blanc Wine Aroma. Food Chem. 2016, 197, 1073–1084. [Google Scholar] [CrossRef]
  16. Coombe, B.G. Growth Stages of the Grapevine: Adoption of a System for Identifying Grapevine Growth Stages. Aust. J. Grape Wine Res. 1995, 1, 104–110. [Google Scholar] [CrossRef]
  17. Spayd, S.; Andersen-Bagge, J. Free Amino Acid Composition of Grape Juice From 12 Vitis Vinifera Cultivars in Washington. Am. J. Enol. Vitic. 1996, 47, 389–402. [Google Scholar] [CrossRef]
  18. Pérez-Díaz, R.; Madrid-Espinoza, J.; Salinas-Cornejo, J.; González-Villanueva, E.; Ruiz-Lara, S. Differential Roles for VviGST1, VviGST3, and VviGST4 in Proanthocyanidin and Anthocyanin Transport in Vitis Vinífera. Front. Plant Sci. 2016, 7, 1166. [Google Scholar] [CrossRef]
  19. Martin, D.M.; Aubourg, S.; Schouwey, M.B.; Daviet, L.; Schalk, M.; Toub, O.; Lund, S.T.; Bohlmann, J. Functional Annotation, Genome Organization and Phylogeny of the Grapevine (Vitis vinifera) Terpene Synthase Gene Family Based on Genome Assembly, FLcDNA Cloning, and Enzyme Assays. BMC Plant Biol. 2010, 10, 226. [Google Scholar] [CrossRef]
  20. Swarup, R.; Bhosale, R. Developmental Roles of AUX1/LAX Auxin Influx Carriers in Plants. Front. Plant Sci. 2019, 10, 1306. [Google Scholar] [CrossRef]
  21. Franco-Zorrilla, J.M.; Martín, A.C.; Leyva, A.; Paz-Ares, J. Interaction between Phosphate-Starvation, Sugar, and Cytokinin Signaling in Arabidopsis and the Roles of Cytokinin Receptors CRE1/AHK4 and AHK3. Plant Physiol. 2005, 138, 847–857. [Google Scholar] [CrossRef]
  22. Seok, K.C.; Moon, Y.R.; Song, C.; Kwak, J.M.; Woo, T.K. Arabidopsis PUB22 and PUB23 Are Homologous U-Box E3 Ubiquitin Ligases That Play Combinatory Roles in Response to Drought Stress. Plant Cell 2008, 20, 1899–1914. [Google Scholar] [CrossRef]
  23. Trujillo, M.; Ichimura, K.; Casais, C.; Shirasu, K. Negative Regulation of PAMP-Triggered Immunity by an E3 Ubiquitin Ligase Triplet in Arabidopsis. Curr. Biol. 2008, 18, 1396–1401. [Google Scholar] [CrossRef] [PubMed]
  24. Wang, Y.S.; Pi, L.Y.; Chen, X.; Chakrabarty, P.K.; Jiang, J.; De Leon, A.L.; Liu, G.Z.; Li, A.; Benny, U.; Oard, J.; et al. Rice XA21 Binding Protein 3 Is a Ubiquitin Ligase Required for Full Xa21-Mediated Disease Resistance. Plant Cell 2006, 18, 3635–3646. [Google Scholar] [CrossRef] [PubMed]
  25. Scarpeci, T.E.; Zanor, M.I.; Mueller-Roeber, B.; Valle, E.M. Overexpression of AtWRKY30 Enhances Abiotic Stress Tolerance during Early Growth Stages in Arabidopsis thaliana. Plant Mol. Biol. 2013, 83, 265–277. [Google Scholar] [CrossRef] [PubMed]
  26. Liu, S.; Kracher, B.; Ziegler, J.; Birkenbihl, R.P.; Somssich, I.E. Negative Regulation of ABA Signaling By WRKY33 Is Critical for Arabidopsis Immunity towards Botrytis Cinerea 2100. eLife 2015, 4, e07295. [Google Scholar] [CrossRef]
  27. Gaber, A.; Ogata, T.; Maruta, T.; Yoshimura, K.; Tamoi, M.; Shigeoka, S. The Involvement of Arabidopsis Glutathione Peroxidase 8 in the Suppression of Oxidative Damage in the Nucleus and Cytosol. Plant Cell Physiol. 2012, 53, 1596–1606. [Google Scholar] [CrossRef]
  28. Wang, K.; Zhang, X.; Goatley, M.; Ervin, E. Heat Shock Proteins in Relation to Heat Stress Tolerance of Creeping Bentgrass at Different N Levels. PLoS ONE 2014, 9, e102914. [Google Scholar] [CrossRef]
  29. Müller, K.; Carstens, A.C.; Linkies, A.; Torres, M.A.; Leubner-Metzger, G. The NADPH-Oxidase AtrbohB Plays a Role in Arabidopsis Seed after-Ripening. New Phytol. 2009, 184, 885–897. [Google Scholar] [CrossRef]
  30. Friedrich, T.; Oberkofler, V.; Trindade, I.; Altmann, S.; Brzezinka, K.; Lämke, J.; Gorka, M.; Kappel, C.; Sokolowska, E.; Skirycz, A.; et al. Heteromeric HSFA2/HSFA3 Complexes Drive Transcriptional Memory after Heat Stress in Arabidopsis. Nat. Commun. 2021, 12, 3426. [Google Scholar] [CrossRef]
  31. Huang, Y.C.; Niu, C.Y.; Yang, C.R.; Jinn, T.L. The Heat Stress Factor HSFA6b Connects ABA Signaling and ABA-Mediated Heat Responses. Plant Physiol. 2016, 172, 1182–1199. [Google Scholar] [CrossRef]
  32. Lario, L.D.; Ramirez-Parra, E.; Gutierrez, C.; Spampinato, C.P.; Casati, P. ANTI-SILENCING FUNCTION1 Proteins Are Involved in Ultraviolet-Induced DNA Damage Repair and Are Cell Cycle Regulated by E2F Transcription Factors in Arabidopsis. Plant Physiol. 2013, 162, 1164–1177. [Google Scholar] [CrossRef] [PubMed]
  33. Reiner, T.; Hoefle, C.; Huesmann, C.; Ménesi, D.; Fehér, A.; Hückelhoven, R. The Arabidopsis ROP-Activated Receptor-like Cytoplasmic Kinase RLCK VI_A3 Is Involved in Control of Basal Resistance to Powdery Mildew and Trichome Branching. Plant Cell Rep. 2015, 34, 457–468. [Google Scholar] [CrossRef] [PubMed]
  34. Zhang, G.; Zhao, F.; Chen, L.; Pan, Y.; Sun, L.; Bao, N.; Zhang, T.; Cui, C.X.; Qiu, Z.; Zhang, Y.; et al. Jasmonate-Mediated Wound Signalling Promotes Plant Regeneration. Nat. Plants 2019, 5, 491–497. [Google Scholar] [CrossRef]
  35. Li, L.; Dou, N.; Zhang, H.; Wu, C. The Versatile GABA in Plants. Plant Signal. Behav. 2021, 16, 1862565. [Google Scholar] [CrossRef] [PubMed]
  36. Sewelam, N.; Kazan, K.; Hüdig, M.; Maurino, V.G.; Schenk, P.M. The ATHSP17.4c1 Gene Expression Is Mediated by Diverse Signals That Link Biotic and Abiotic Stress Factors with Ros and Can Be a Useful Molecular Marker for Oxidative Stress. Int. J. Mol. Sci. 2019, 20, 3201. [Google Scholar] [CrossRef]
  37. McLoughlin, F.; Basha, E.; Fowler, M.E.; Kim, M.; Bordowitz, J.; Katiyar-Agarwal, S.; Vierling, E. Class I and II Small Heat Shock Proteins Together with HSP101 Protect Protein Translation Factors during Heat Stress. Plant Physiol. 2016, 172, 1221–1236. [Google Scholar] [CrossRef]
  38. Tiwari, L.D.; Khungar, L.; Grover, A. AtHsc70-1 Negatively Regulates the Basal Heat Tolerance in Arabidopsis thaliana through Affecting the Activity of HsfAs and Hsp101. Plant J. 2020, 103, 2069–2083. [Google Scholar] [CrossRef]
  39. Lee, T.A.; Bailey-Serres, J. Integrative Analysis from the Epigenome to Translatome Uncovers Patterns of Dominant Nuclear Regulation during Transient Stress. Plant Cell 2019, 31, 2573–2595. [Google Scholar] [CrossRef]
  40. Wang, R.; Zhang, Y.; Kieffer, M.; Yu, H.; Kepinski, S.; Estelle, M. HSP90 Regulates Temperature-Dependent Seedling Growth in Arabidopsis by Stabilizing the Auxin Co-Receptor F-Box Protein TIR1. Nat. Commun. 2016, 7, 10269. [Google Scholar] [CrossRef]
  41. Fu, Q.; Li, S.; Yu, D. Identification of an Arabidopsis Nodulin-Related Protein in Heat Stress. Mol. Cells 2010, 29, 77–84. [Google Scholar] [CrossRef] [PubMed]
  42. Weng, M.; Yang, Y.; Feng, H.; Pan, Z.; Shen, W.H.; Zhu, Y.; Dong, A. Histone Chaperone ASF1 Is Involved in Gene Transcription Activation in Response to Heat Stress in Arabidopsis thaliana. Plant Cell Environ. 2014, 37, 2128–2138. [Google Scholar] [CrossRef] [PubMed]
  43. Jang, J.H.; Shang, Y.; Kang, H.K.; Kim, S.Y.; Kim, B.H.; Nam, K.H. Arabidopsis Galactinol Synthases 1 (AtGOLS1) Negatively Regulates Seed Germination. Plant Sci. 2018, 267, 94–101. [Google Scholar] [CrossRef] [PubMed]
  44. De Jesús Chávez Martínez, Á. Altered Levels of Glycosylated Sterols Affect Tomato Development and Stress Response. Ph.D. Thesis, University of Barcelona, Barcelona, Spain, 2020. [Google Scholar]
  45. Yang, X.; Chen, L.; Yang, Y.; Guo, X.; Chen, G.; Xiong, X.; Dong, D.; Li, G. Transcriptome Analysis Reveals That Exogenous Ethylene Activates Immune and Defense Responses in a High Late Blight Resistant Potato Genotype. Sci. Rep. 2020, 10, 21294. [Google Scholar] [CrossRef]
  46. Kim, E.H.; Kim, Y.S.; Park, S.H.; Koo, Y.J.; Choi, Y.D.; Chung, Y.Y.; Lee, I.J.; Kim, J.K. Methyl Jasmonate Reduces Grain Yield by Mediating Stress Signals to Alter Spikelet Development in Rice1. Plant Physiol. 2009, 149, 1751–1760. [Google Scholar] [CrossRef] [PubMed]
  47. Wu, J.; Wang, L.; Baldwin, I.T. Methyl Jasmonate-Elicited Herbivore Resistance: Does MeJA Function as a Signal without Being Hydrolyzed to JA? Planta 2008, 227, 1161–1168. [Google Scholar] [CrossRef]
  48. Oh, I.S.; Park, A.R.; Bae, M.S.; Kwon, S.J.; Kim, Y.S.; Lee, J.E.; Kang, N.Y.; Lee, S.; Cheong, H.; Park, O.K. Secretome Analysis Reveals an Arabidopsis Lipase Involved in Defense against Altemaria brassicicola. Plant Cell 2005, 17, 2832–2847. [Google Scholar] [CrossRef]
  49. Dervisi, I.; Valassakis, C.; Agalou, A.; Papandreou, N.; Podia, V.; Haralampidis, K.; Iconomidou, V.A.; Kouvelis, V.N.; Spaink, H.P.; Roussis, A. Investigation of the Interaction of DAD1-LIKE LIPASE 3 (DALL3) with Selenium Binding Protein 1 (SBP1) in Arabidopsis thaliana. Plant Sci. 2020, 291, 110357. [Google Scholar] [CrossRef]
  50. Krčková, Z.; Brouzdová, J.; Daněk, M.; Kocourková, D.; Rainteau, D.; Ruelland, E.; Valentová, O.; Pejchar, P.; Martinec, J. Arabidopsis Non-Specific Phospholipase C1: Characterization and Its Involvement in Response to Heat Stress. Front. Plant Sci. 2015, 6, 928. [Google Scholar] [CrossRef]
  51. Gidda, S.K.; Miersch, O.; Levitin, A.; Schmidt, J.; Wasternack, C.; Varin, L. Biochemical and Molecular Characterization of a Hydroxyjasmonate Sulfotransferase from Arabidopsis thaliana. J. Biol. Chem. 2003, 278, 17895–17900. [Google Scholar] [CrossRef]
  52. Funck, D.; Eckard, S.; Müller, G. Non-Redundant Functions of Two Proline Dehydrogenase Isoforms in Arabidopsis. BMC Plant Biol. 2010, 10, 70. [Google Scholar] [CrossRef] [PubMed]
  53. Kong, F.; Wang, J.; Cheng, L.; Liu, S.; Wu, J.; Peng, Z.; Lu, G. Genome-Wide Analysis of the Mitogen-Activated Protein Kinase Gene Family in Solanum lycopersicum. Gene 2012, 499, 108–120. [Google Scholar] [CrossRef] [PubMed]
  54. Gursanscky, N.R.; Jouannet, V.; Grünwald, K.; Sanchez, P.; Laaber-Schwarz, M.; Greb, T. MOL1 Is Required for Cambium Homeostasis in Arabidopsis. Plant J. 2016, 86, 210–220. [Google Scholar] [CrossRef] [PubMed]
  55. Moon, J.; Park, Y.J.; Son, S.H.; Roh, J.; Youn, J.H.; Kim, S.Y.; Kim, S.K. Brassinosteroids Signaling via BZR1 Down-Regulates Expression of ACC Oxidase 4 to Control Growth of Arabidopsis thaliana Seedlings. Plant Signal. Behav. 2020, 15, 1734333. [Google Scholar] [CrossRef] [PubMed]
  56. Son, G.H.; Wan, J.; Kim, H.J.; Nguyen, X.C.; Chung, W.S.; Hong, J.C.; Stacey, G. Ethylene-Responsive Element-Binding Factor 5, ERF5, Is Involved in Chitin-Induced Innate Immunity Response. Mol. Plant-Microbe Interact. 2012, 25, 48–60. [Google Scholar] [CrossRef]
  57. Moffat, C.S.; Ingle, R.A.; Wathugala, D.L.; Saunders, N.J.; Knight, H.; Knight, M.R. ERF5 and ERF6 Play Redundant Roles as Positive Regulators of JA/Et-Mediated Defense against Botrytis cinerea in Arabidopsis. PLoS ONE 2012, 7, e35995. [Google Scholar] [CrossRef] [PubMed]
  58. Maruyama, Y.; Yamoto, N.; Suzuki, Y.; Chiba, Y.; Yamazaki, K.; Sato, T.; Yamaguchi, J. The Arabidopsis Transcriptional Repressor ERF9 Participates in Resistance against Necrotrophic Fungi. Plant Sci. 2013, 213, 79–87. [Google Scholar] [CrossRef]
  59. Yang, Z.; Tian, L.; Latoszek-Green, M.; Brown, D.; Wu, K. Arabidopsis ERF4 Is a Transcriptional Repressor Capable of Modulating Ethylene and Abscisic Acid Responses. Plant Mol. Biol. 2005, 58, 585–596. [Google Scholar] [CrossRef]
  60. Chen, W.H.; Li, P.F.; Chen, M.K.; Lee, Y.I.; Yang, C.H. FOREVER YOUNG FLOWER Negatively Regulates Ethylene Response DNA-Binding Factors by Activating an Ethylene-Responsive Factor to Control Arabidopsis Floral Organ Senescence and Abscission. Plant Physiol. 2015, 168, 1666–1683. [Google Scholar] [CrossRef]
  61. Schweighofer, A.; Kazanaviciute, V.; Scheikl, E.; Teige, M.; Doczi, R.; Hirt, H.; Schwanninger, M.; Kant, M.; Schuurink, R.; Mauch, F.; et al. The PP2C-Type Phosphatase AP2C1, Which Negatively Regulates MPK4 and MPK6, Modulates Innate Immunity, Jasmonic Acid, and Ethylene Levels in Arabidopsis. Plant Cell 2007, 19, 2213–2224. [Google Scholar] [CrossRef]
  62. Licausi, F.; Van Dongen, J.T.; Giuntoli, B.; Novi, G.; Santaniello, A.; Geigenberger, P.; Perata, P. HRE1 and HRE2, Two Hypoxia-Inducible Ethylene Response Factors, Affect Anaerobic Responses in Arabidopsis thaliana. Plant J. 2010, 62, 302–315. [Google Scholar] [CrossRef] [PubMed]
  63. Birkenbihl, R.P.; Diezel, C.; Somssich, I.E. Arabidopsis WRKY33 Is a Key Transcriptional Regulator of Hormonal and Metabolic Responses toward Botrytis Cinerea Infection. Plant Physiol. 2012, 159, 266–285. [Google Scholar] [CrossRef] [PubMed]
  64. Tang, Y.; Guo, J.; Zhang, T.; Bai, S.; He, K.; Wang, Z. Genome-Wide Analysis of WRKY Gene Family and the Dynamic Responses of Key WRKY Genes Involved in Ostrinia Furnacalis Attack in Zea Mays. Int. J. Mol. Sci. 2021, 22, 13045. [Google Scholar] [CrossRef] [PubMed]
  65. Hsu, F.C.; Chou, M.Y.; Chou, S.J.; Li, Y.R.; Peng, H.P.; Shih, M.C. Submergence Confers Immunity Mediated by the WRKY22 Transcription Factor in Arabidopsis. Plant Cell 2013, 25, 2699–2713. [Google Scholar] [CrossRef]
  66. Bolt, S.; Zuther, E.; Zintl, S.; Hincha, D.K.; Schmülling, T. ERF105 Is a Transcription Factor Gene of Arabidopsis thaliana Required for Freezing Tolerance and Cold Acclimation. Plant Cell Environ. 2017, 40, 108–120. [Google Scholar] [CrossRef]
  67. Lehti-Shiu, M.D.; Uygun, S.; Moghe, G.D.; Panchy, N.; Fang, L.; Hufnagel, D.E.; Jasicki, H.L.; Feig, M.; Shiu, S.H. Molecular Evidence for Functional Divergence and Decay of a Transcription Factor Derived from Whole-Genome Duplication in Arabidopsis thaliana. Plant Physiol. 2015, 168, 1717–1734. [Google Scholar] [CrossRef]
  68. Van Dingenen, J.; Vermeersch, M.; De Milde, L.; Hulsmans, S.; De Winne, N.; Van Leene, J.; Gonzalez, N.; Dhondt, S.; De Jaeger, G.; Rolland, F.; et al. The Role of HEXOKINASE1 in Arabidopsis Leaf Growth. Plant Mol. Biol. 2019, 99, 79–93. [Google Scholar] [CrossRef]
  69. Ding, Z.J.; Yan, J.Y.; Li, G.X.; Wu, Z.C.; Zhang, S.Q.; Zheng, S.J. WRKY41 Controls Arabidopsis Seed Dormancy via Direct Regulation of ABI3 Transcript Levels Not Downstream of ABA. Plant J. 2014, 79, 810–823. [Google Scholar] [CrossRef]
  70. AbuQamar, S.; Chen, X.; Dhawan, R.; Bluhm, B.; Salmeron, J.; Lam, S.; Dietrich, R.A.; Mengiste, T. Expression Profiling and Mutant Analysis Reveals Complex Regulatory Networks Involved in Arabidopsis Response to Botrytis Infection. Plant J. 2006, 48, 28–44. [Google Scholar] [CrossRef]
  71. Xie, Z.; Li, D.; Wang, L.; Sack, F.D.; Grotewold, E. Role of the Stomatal Development Regulators FLP/MYB88 in Abiotic Stress Responses. Plant J. 2010, 64, 731–739. [Google Scholar] [CrossRef]
  72. Yang, S.D.; Seo, P.J.; Yoon, H.K.; Park, C.M. The Arabidopsis NAC Transcription Factor VNI2 Integrates Abscisic Acid Signals into Leaf Senescence via the COR/RD Genes. Plant Cell 2011, 23, 2155–2168. [Google Scholar] [CrossRef]
  73. Chen, Y.F.; Li, L.Q.; Xu, Q.; Kong, Y.H.; Wang, H.; Wu, W.H. The WRKY6 Transcription Factor Modulates PHOSPHATE1 Expression in Response to Low Pi Stress in Arabidopsis. Plant Cell 2009, 21, 3554–3566. [Google Scholar] [CrossRef]
  74. Yu, X.C.; Zhu, S.Y.; Gao, G.F.; Wang, X.J.; Zhao, R.; Zou, K.Q.; Wang, X.F.; Zhang, X.Y.; Wu, F.Q.; Peng, C.C.; et al. Expression of a Grape Calcium-Dependent Protein Kinase ACPK1 in Arabidopsis thaliana Promotes Plant Growth and Confers Abscisic Acid-Hypersensitivity in Germination, Postgermination Growth, and Stomatal Movement. Plant Mol. Biol. 2007, 64, 531–538. [Google Scholar] [CrossRef] [PubMed]
  75. Candat, A.; Paszkiewicz, G.; Neveu, M.; Gautier, R.; Logan, D.C.; Avelange-Macherel, M.H.; Macherel, D. The Ubiquitous Distribution of Late Embryogenesis Abundant Proteins across Cell Compartments in Arabidopsis Offers Tailored Protection against Abiotic Stress. Plant Cell 2014, 26, 3148–3166. [Google Scholar] [CrossRef] [PubMed]
  76. Yamaguchi-Shinozaki, K.; Shinozaki, K. Improving Plant Drought, Salt and Freezing Tolerance by Gene Transfer of a Single Stress-Inducible Transcription Factor. Novartis Found. Symp. 2001, 236, 176–189. [Google Scholar] [CrossRef] [PubMed]
  77. Bruno, M.; Koschmieder, J.; Wuest, F.; Schaub, P.; Fehling-Kaschek, M.; Timmer, J.; Beyer, P.; Al-Babili, S. Enzymatic Study on AtCCD4 and AtCCD7 and Their Potential to Form Acyclic Regulatory Metabolites. J. Exp. Bot. 2016, 67, 5993–6005. [Google Scholar] [CrossRef]
  78. Cao, M.J.; Wang, Z.; Zhao, Q.; Mao, J.L.; Speiser, A.; Wirtz, M.; Hell, R.; Zhu, J.K.; Xiang, C. Bin Sulfate Availability Affects ABA Levels and Germination Response to ABA and Salt Stress in Arabidopsis thaliana. Plant J. 2014, 77, 604–615. [Google Scholar] [CrossRef]
  79. Song, C.; Kim, T.; Chung, W.S.; Lim, C.O. The Arabidopsis Phytocystatin AtCYS5 Enhances Seed Germination and Seedling Growth under Heat Stress Conditions. Mol. Cells 2017, 40, 577–586. [Google Scholar] [CrossRef]
  80. Lim, C.W.; Yang, S.H.; Shin, K.H.; Lee, S.C.; Kim, S.H. The AtLRK10L1.2, Arabidopsis Ortholog of Wheat LRK10, Is Involved in ABA-Mediated Signaling and Drought Resistance. Plant Cell Rep. 2015, 34, 447–455. [Google Scholar] [CrossRef]
  81. Kuromori, T.; Sugimoto, E.; Shinozaki, K. Brachypodium BdABCG25 is a homolog of Arabidopsis AtABCG25 involved in the transport of abscisic acid. FEBS Lett. 2021, 595, 954–959. [Google Scholar] [CrossRef]
  82. Kang, J.; Hwang, J.U.; Lee, M.; Kim, Y.Y.; Assmann, S.M.; Martinoia, E.; Lee, Y. PDR-Type ABC Transporter Mediates Cellular Uptake of the Phytohormone Abscisic Acid. Proc. Natl. Acad. Sci. USA 2010, 107, 2355–2360. [Google Scholar] [CrossRef] [PubMed]
  83. Seo, M.; Hanada, A.; Kuwahara, A.; Endo, A.; Okamoto, M.; Yamauchi, Y.; North, H.; Marion-Poll, A.; Sun, T.P.; Koshiba, T.; et al. Regulation of Hormone Metabolism in Arabidopsis Seeds: Phytochrome Regulation of Abscisic Acid Metabolism and Abscisic Acid Regulation of Gibberellin Metabolism. Plant J. 2006, 48, 354–366. [Google Scholar] [CrossRef] [PubMed]
  84. Qu, J.; Kang, S.G.; Hah, C.; Jang, J.C. Molecular and Cellular Characterization of GA-Stimulated Transcripts GASA4 and GASA6 in Arabidopsis thaliana. Plant Sci. 2016, 246, 1–10. [Google Scholar] [CrossRef] [PubMed]
  85. Wulfetange, K.; Lomin, S.N.; Romanov, G.A.; Stolz, A.; Heyl, A.; Schmülling, T. The Cytokinin Receptors of Arabidopsis Are Located Mainly to the Endoplasmic Reticulum. Plant Physiol. 2011, 156, 1808–1818. [Google Scholar] [CrossRef]
  86. Cui, F.; Wu, S.; Sun, W.; Coaker, G.; Kunkel, B.; He, P.; Shan, L. The Pseudomonas Syringae Type III Effector AvrRpt2 Promotes Pathogen Virulence via Stimulating Arabidopsis Auxin/Indole Acetic Acid Protein Turnover. Plant Physiol. 2013, 162, 1018–1029. [Google Scholar] [CrossRef]
  87. Hazak, O.; Mamon, E.; Lavy, M.; Sternberg, H.; Behera, S.; Schmitz-Thom, I.; Bloch, D.; Dementiev, O.; Gutman, I.; Danziger, T.; et al. A Novel Ca2+-Binding Protein That Can Rapidly Transduce Auxin Responses during Root Growth. PLoS Biol. 2019, 17, e3000085. [Google Scholar] [CrossRef]
  88. Zwack, P.J.; Compton, M.A.; Adams, C.I.; Rashotte, A.M. Cytokinin Response Factor 4 (CRF4) Is Induced by Cold and Involved in Freezing Tolerance. Plant Cell Rep. 2016, 35, 573–584. [Google Scholar] [CrossRef]
  89. Banasiak, A.; Biedroń, M.; Dolzblasz, A.; Berezowski, M.A. Ontogenetic Changes in Auxin Biosynthesis and Distribution Determine the Organogenic Activity of the Shoot Apical Meristem in Pin1 Mutants. Int. J. Mol. Sci. 2019, 20, 180. [Google Scholar] [CrossRef]
  90. Bennett, M.J.; Marchant, A.; Green, H.G.; May, S.T.; Ward, S.P.; Millner, P.A.; Walker, A.R.; Schulz, B.F.K. Arabidopsis AUX1 Gene: A Permease-Like Regulator of Root Gravitropism. Science 1996, 273, 948–950. [Google Scholar] [CrossRef]
  91. Hanzawa, Y.; Takahashi, T.; Komeda, Y. ACL5: An Arabidopsis Gene Required for Internodal Elongation after Flowering. Plant J. 1997, 12, 863–874. [Google Scholar] [CrossRef]
  92. Morita, M.T.; Sakaguchi, K.; Kiyose, S.I.; Taira, K.; Kato, T.; Nakamura, M.; Tasaka, M. A C2H2-Type Zinc Finger Protein, SGR5, Is Involved in Early Events of Gravitropism in Arabidopsis Inflorescence Stems. Plant J. 2006, 47, 619–628. [Google Scholar] [CrossRef] [PubMed]
  93. Hallmark, H.T.; Rashotte, A.M. Review—Cytokinin Response Factors: Responding to More than Cytokinin. Plant Sci. 2019, 289, 110251. [Google Scholar] [CrossRef] [PubMed]
  94. Gälweiler, L.; Guan, C.; Müller, A.; Wisman, E.; Mendgen, K.; Yephremov, A.; Palme, K. Regulation of Polar Auxin Transport by AtPIN1 in Arabidopsis Vascular Tissue. Science 1998, 282, 2226–2230. [Google Scholar] [CrossRef] [PubMed]
  95. Tomasi, D.; Lonardi, A.; Boscaro, D.; Nardi, T.; Marangon, C.M.; De Rosso, M.; Flamini, R.; Lovat, L.; Mian, G. Effects of Traditional and Modern Post-Harvest Withering Processes on the Composition of the Vitis v. Corvina Grape and the Sensory Profile of Amarone Wines. Molecules 2021, 26, 5198. [Google Scholar] [CrossRef]
  96. Tomasi, D.; Panighel, A.; Flamini, R.; Lovat, L.; Battista, F. Foliar Application of Specific Inactivated Yeast with Action on Phenolic and Aromatic Metabolism of Grapes. In Proceedings of the 40th World Vine and Wine Congress, OIV, Sofia, Bulgaria, 29 May 2017; p. 40. [Google Scholar]
  97. Mozzon, M.; Savini, S.; Boselli, E.; Thorngate, J.H. The Herbaceous Character of Wines. Ital. J. Food Sci. 2016, 28, 190–207. [Google Scholar]
  98. Stines, A.P.; Grubb, J.; Gockowiak, H.; Henschke, P.A.; Høj, P.B.; Van Heeswijck, R. Proline and Arginine Accumulation in Developing Berries of Vitis vinifera L. in Australian Vineyards: Influence of Vine Cultivar, Berry Maturity and Tissue Type. Aust. J. Grape Wine Res. 2000, 6, 150–158. [Google Scholar] [CrossRef]
  99. Stribny, J.; Gamero, A.; Pérez-Torrado, R.; Querol, A. Saccharomyces Kudriavzevii and Saccharomyces Uvarum Differ from Saccharomyces Cerevisiae during the Production of Aroma-Active Higher Alcohols and Acetate Esters Using Their Amino Acidic Precursors. Int. J. Food Microbiol. 2015, 205, 41–46. [Google Scholar] [CrossRef]
  100. Monforte, A.R.; Martins, S.I.F.S.; Silva Ferreira, A.C. Strecker Aldehyde Formation in Wine: New Insights into the Role of Gallic Acid, Glucose, and Metals in Phenylacetaldehyde Formation. J. Agric. Food Chem. 2018, 66, 2459–2466. [Google Scholar] [CrossRef]
  101. Tadmor, Y.; Fridman, E.; Gur, A.; Larkov, O.; Lastochkin, E.; Ravid, U.; Zamir, D.; Lewinsohn, E. Identification of Malodorous, a Wild Species Allele Affecting Tomato Aroma That Was Selected against during Domestication. J. Agric. Food Chem. 2002, 50, 2005–2009. [Google Scholar] [CrossRef]
  102. Verbruggen, N.; Hermans, C. Proline Accumulation in Plants: A Review. Amino Acids 2008, 35, 753–759. [Google Scholar] [CrossRef]
  103. Pereira, G.E.; Gaudillere, J.P.; Pieri, P.; Hilbert, G.; Maucourt, M.; Deborde, C.; Moing, A.; Rolin, D. Microclimate Influence on Mineral and Metabolic Profiles of Grape Berries. J. Agric. Food Chem. 2006, 54, 6765–6775. [Google Scholar] [CrossRef] [PubMed]
  104. Sharp, R.G. A Review of the Applications of Chitin and Its Derivatives in Agriculture to Modify Plant-Microbial Interactions and Improve Crop Yields. Agronomy 2013, 3, 757–793. [Google Scholar] [CrossRef]
  105. Wojtaszek, P. Oxidative Burst: An Early Plant Response to Pathogen Infection. Biochem. J. 1997, 322, 681–692. [Google Scholar] [CrossRef] [PubMed]
  106. Owen, J.B.; Butterfield, D.A. Measurement of Oxidized/Reduced Glutathione Ratio. In Protein Misfolding and Cellular Stress in Disease and Aging; Humana Press: Totowa, NJ, USA, 2010; pp. 269–277. [Google Scholar]
  107. Varala, K.; Marshall-Colón, A.; Cirrone, J.; Brooks, M.D.; Pasquino, A.V.; Léran, S.; Mittal, S.; Rock, T.M.; Edwards, M.B.; Kim, G.J.; et al. Temporal Transcriptional Logic of Dynamic Regulatory Networks Underlying Nitrogen Signaling and Use in Plants. Proc. Natl. Acad. Sci. USA 2018, 115, 6494–6499. [Google Scholar] [CrossRef] [PubMed]
  108. Hui, Y.; Wang, J.; Jiang, T.; Ma, T.; Wang, R. Effect of Nitrogen Regulation on Berry Quality and Flavonoids during Veraison Stage. Food Sci. Nutr. 2021, 9, 5448–5456. [Google Scholar] [CrossRef]
  109. Lallemand LalVigne AROMA. Available online: https://lalvigne.com/it/italy/our-products/product-details/aroma-it/ (accessed on 28 May 2021).
  110. Thermo Fisher Scientific. Thermo Fisher Scientific Titratable Acidity of Red Wine by Manual Titration (Potentiometric) Application Note AN010; Thermo Fisher Scientific: Waltham, MA, USA, 2022. [Google Scholar]
  111. Modesti, M.; Brizzolara, S.; Forniti, R.; Ceccantoni, B.; Bellincontro, A.; Catelli, C.; Mencarelli, F.; Tonutti, P. Postharvest Ozone Fumigation of Grapes (Cv Sangiovese) Differently Affects Volatile Organic Compounds and Polyphenol Profiles of Berries and Wine. Aust. J. Grape Wine Res. 2023, 2023, 8244309. [Google Scholar] [CrossRef]
  112. Paolini, M.; Tonidandel, L.; Moser, S.; Larcher, R. Development of a Fast Gas Chromatography–Tandem Mass Spectrometry Method for Volatile Aromatic Compound Analysis in Oenological Products. J. Mass Spectrom. 2018, 53, 801–810. [Google Scholar] [CrossRef]
  113. Tonidandel, L.; Larcher, R.; Barbero, A.; Jelley, R.E.; Fedrizzi, B. A Single Run Liquid Chromatography-Tandem Mass Spectrometry Method for the Analysis of Varietal Thiols and Their Precursors in Wine. J. Chromatogr. A 2021, 1658, 462603. [Google Scholar] [CrossRef]
  114. Schilling, M.; Maia-Grondard, A.; Baltenweck, R.; Robert, E.; Hugueney, P.; Bertsch, C.; Farine, S.; Gelhaye, E. Wood Degradation by Fomitiporia Mediterranea M. Fischer: Physiologic, Metabolomic and Proteomic Approaches. Front. Plant Sci. 2022, 13, 988709. [Google Scholar] [CrossRef]
  115. Nonis, A.; Vezzaro, A.; Ruperti, B. Evaluation of RNA Extraction Methods and Identification of Putative Reference Genes for Real-Time Quantitative Polymerase Chain Reaction Expression Studies on Olive (Olea europaea L.) Fruits. J. Agric. Food Chem. 2012, 60, 6855–6865. [Google Scholar] [CrossRef]
  116. González-Agüero, M.; García-Rojas, M.; Di Genova, A.; Correa, J.; Maass, A.; Orellana, A.; Hinrichsen, P. Identification of Two Putative Reference Genes from Grapevine Suitable for Gene Expression Analysis in Berry and Related Tissues Derived from RNA-Seq Data. BMC Genom. 2013, 14, 878. [Google Scholar] [CrossRef] [PubMed]
  117. Pfaffl, M.W. A New Mathematical Model for Relative Quantification in Real-Time RT-PCR. Nucleic Acids Res. 2001, 29, 2002–2007. [Google Scholar] [CrossRef] [PubMed]
  118. Del Fabbro, C.; Scalabrin, S.; Morgante, M.; Giorgi, F.M. An Extensive Evaluation of Read Trimming Effects on Illumina NGS Data Analysis. PLoS ONE 2013, 8, e85024. [Google Scholar] [CrossRef] [PubMed]
  119. Bolger, A.M.; Lohse, M.; Usadel, B. Trimmomatic: A Flexible Trimmer for Illumina Sequence Data. Bioinformatics 2014, 30, 2114–2120. [Google Scholar] [CrossRef] [PubMed]
  120. Kim, D.; Langmead, B.; Salzberg, S.L. HISAT: A Fast Spliced Aligner with Low Memory Requirements. Nat. Methods 2015, 12, 357–360. [Google Scholar] [CrossRef]
  121. Liao, Y.; Smyth, G.K.; Shi, W. FeatureCounts: An Efficient General Purpose Program for Assigning Sequence Reads to Genomic Features. Bioinformatics 2014, 30, 923–930. [Google Scholar] [CrossRef]
  122. Love, M.I.; Huber, W.; Anders, S. Moderated Estimation of Fold Change and Dispersion for RNA-Seq Data with DESeq2. Genome Biol. 2014, 15, 550. [Google Scholar] [CrossRef]
Figure 1. Total acidity (A) expressed in g/L of tartaric acid and total sugars (B) expressed in °Brix, determined in the samples of Sauvignon Blanc berries in the years 2020 and 2021 that had been collected from treated (orange lines) and control untreated (green lines) vines. Sugars were measured for each experimental condition individually on 60 berries belonging to each replica/treatment at each sampling date. The EL stages at each time point (TP1, TP2, and Harvest, H) were identified on the basis of the average sugar levels according to the modified EL system described by Coombe (1995) [16] as EL36, 37, and 38, respectively. Acidity was determined by titration of the juice obtained from 20 randomly collected berries. The significant differences (*) were determined with a t-test with a p-value < 0.05.
Plants 12 03423 g001
Figure 2. Amino acids and secondary metabolites profiling of berries at TP2 (EL37) and H (EL38) in 2020 and 2021 in control (C) and treated (T) samples. (A) is a heatmap of the log2 ratios of metabolite contents compared to control samples at TP2 (C_TP2), indicated by shades of red or blue according to the scale bar. (B) is a PCA showing the separation of samples according to ripeness (H vs. TP2) (x axis, dimension 1, explaining 43% of variability) or to the DYE treatment (y axis, dimension 2, explaining 25.4% of the variability). (C) shows the variable correlation plot of the PCA.
Plants 12 03423 g002
Figure 3. Relative quantitation of amino acids and GABA determined in Sauvignon Blanc’s berries for both years 2020 and 2021. In (A) the amino acids and GABA show significant differences between DYE-treated (orange) and untreated control (green) fruits (numbers represent the area of the peak). These compounds were determined in both years at time-point 2 (EL37) (after the second treatment) and at harvest. The significant differences (*) were determined with a t-test with a p-value < 0.05. (B) reports the variation (%) of amino acid composition throughout the experiment.
Plants 12 03423 g003
Figure 4. Aroma precursors determined in DYE-treated and untreated control Sauvignon Blanc’s berries. (A) shows bound aroma precursors and glutathione quantitated at harvest in the two years 2020 and 2021, while (B) represents free aroma precursors determined at all time points in samples collected in 2020. The significant differences were determined with a t-test with p-value < 0.1 (*) and with p-value < 0.05 (**).
Plants 12 03423 g004
Figure 5. Normalized expression of genes encoding enzymes involved in the biosynthesis of berry aromas or of aroma precursors. The gene expression was evaluated in both years in treated and untreated control samples at subsequent developmental ripening stages (EL-36 to EL-38) and time points. VvGGT (Gamma-Glutamyl transferase) and VvGST (Glutathione S-transferase) are involved in glutathione metabolism, while VviCCD4a (Carotenoid Cleavage Dioxygenase) is involved in carotenoid metabolism and in the generation of norisoprenoids. Significant differences (*) (p-value < 0.1) and very significant differences (**) (p-value < 0.05) were determined with a t-test.
Plants 12 03423 g005
Figure 6. Overview of RNA-seq results of samples collected at TP2 and H in 2020. (A) symbolizes the differentially expressed genes (DEGs) between treated and control samples, observed at each time point (TP2 or H) separately. The two colors represent downregulated (blue) and upregulated (red) genes. (B) categorizes the DEGs to differentiate between highly differentially expressed (red and dark blue) (−2 > log2FC > 2) and slightly differentially expressed (yellow and light blue) (0.6 < log2FC < 1 and −1 < log2FC < −0.6, respectively) genes identified amongst the significant differential expressions.
Plants 12 03423 g006
Figure 7. Enrichment analysis obtained with G:Profiler (A,B) and Mapman (C) softwares. (A) shows upregulated and downregulated pathways for TP2 (left panel) and H (right panel). (B) represents the number of DEGs involved in each pathway at TP2 (left panel) and H (right panel). (C) reports in a heatmap the pathways identified by Mapman as up- (red squares) or down-regulated (blue squares) at TP2 or at H.
Plants 12 03423 g007
Figure 8. Results of the untargeted analysis considering the interaction of time per treatment on the modulation of ripening-related genes in the berry. (A) is a heatmap showing the clustering of four groups according to gene’s behavior throughout ripening from TP2 to H. (B) shows the dynamics of expression of each group of genes indicated in the corresponding clusters identified in (A). (C) reports the enrichment analysis made with G:Profiler for each group. Group 2 is not shown since no enrichment could be identified due to the low number of genes for this group.
Plants 12 03423 g008
Figure 9. Schematic overview of the transcriptional effects of DYE treatment during berry ripening, determined with KEGG analysis. Highlighting of genes in blue and blue arrows indicates downregulation, while genes and arrows marked in red indicate upregulation. Sulphur/glutathione (GSH) metabolism: APS, adenosine 5′-phosphosulfate. Plant-pathogen interactions: CNGSs, cyclic nucleotide gated channels; RPM1, disease resistance protein 1; CDPK, calcium-dependent protein kinase; Rboh: respiratory burst oxidase homolog; CaM/CML, calmodulin and calmodulin-like; HSP, heat shock proteins. ROS signaling pathway: WRKYs, workies; ERFs; ETS2 repressor factors. Plant hormone biosynthesis and signal transduction: ACO, 1-aminocyclopropane-1-carboxylic acid oxidase; ACC, 1-aminocyclopropane-1-carboxylic acid; LOX, lipoxygenase; ABA, abscisic acid; PYR/PYL, Pyrabactin resistance/Pyrabactin resistance-like; CRE1, cytokinin response 1. Hormone transporters: AUX1, auxin transporter 1; PIN1, auxin efflux carrier.
Plants 12 03423 g009
Figure 10. Experimental design of treatments of Sauvignon Blanc with DYE and sampling for the two years 2020 (A) and 2021 (B). On both years, Sauvignon Blanc vineyards were sprayed with the DYE at the beginning of veraison and again after a period of 9–11 days from the first treatment. Sampling was performed 24/48 h after each treatment (TP1 (EL36, 10.1–14 ⁰Brix) and TP2 (EL37, 14.1–18 ⁰Brix)) and at H (EL38, 18.1–22 ⁰Brix). In the year 2021, an additional sampling, TP3 (EL38, 18.1–22 ⁰Brix), was performed between TP2 and H.
Plants 12 03423 g010
Table 1. Genes differently expressed in the analysis of the combined effects of time per treatment with DYE. The columns in the table report the gene ID in Vitis vinifera, the closest corresponding Arabidopsis homologue and its biochemical function identified in Arabidopsis, the group into which they clustered (groups of Figure 8), and their putative biological role as identified by the literature.
Grapevine GeneArabidopsis HomologueFunction in Arabidopsis GroupReferencePutative Role
Response to chitin and regulatory burst involved in defence response
Vitvi08g02053AT2G35930Plant U-box 231Cho et al., 2008 [22]
Trujillo et al., 2008 [23]
Ubiquitin ligase homologous to U-Box E3 playing a role in response to drought stress.
Vitvi08g02051AT2G35930Plant U-box 231Cho et al., 2008 [22]
Trujillo et al., 2009 [23]
Ubiquitin ligase homologous to U-Box E3 playing a role in response to drought stress.
Vitvi12g00139AT1G29340Plant U-box 174Wang et al., 2006 [24]In tobacco: ubiquitin-proteasome system in defences against pathogens.
Vitvi15g01003AT5G24110WRKY Transcription Factor Group III1Scarpeci et al., 2013 [25]AtWRKY30, putative role in the activation of defence responses.
Vitvi07g03110AT5G65530Protein kinase superfamily protein1Reiner et al., 2015 [33]RLCK VI, regulating basal resistance to powdery mildew.
ROS Homeostasis
Vitvi02g00332AT1G63460Glutathione peroxidase 81Gaber et al., 2012 [27]Involvement in the suppression of oxidative damage.
Vitvi03g00500AT4G34410ERF1091Zhang et al., 2019 [34]
Li et al., 2021 [35]
Wounding, JA and salt stress inducible; regulates ROS production and stress adaptation.
Vitvi13g00097AT5G58530Glutathione oxidoreductase2No referenceReduction of thiol groups in proteins.
Vitvi14g00183AT1G09090RBohB2Wang et al., 2014 [28]
Müller et al., 2009 [29]
ABA inducible in seed after ripening and involved in conferring thermotolerance.
Heat Shock Proteins
Vitvi13g00491AT3G46230Heat shock protein 17.41Sewelam et al., 2019 [36]
McLoughlin et al., 2016 [37]
Response to ROS and several abiotic stresses, including cold and heat.
Vitvi06g00443AT5G02500Heat shock cognate protein 70.12Tiwari et al., 2020 [38]Negative regulator of basal heat tolerance.
Vitvi08g02189AT5G02500Heat shock cognate protein 70.11Tiwari et al., 2020 [38]Negative regulator of basal heat tolerance.
Vitvi09g00045AT1G54050HSP20-like chaperones superfamily1Lee and Bailey-Serres, 2019 [39]Hypoxia related stress induction.
Vitvi02g00025AT5G52640Heat shock-like protein 90.12Wang et al., 2016 [40]Interacts with disease resistance signaling components and is required for RPS2-mediated resistance.
Vitvi16g01103AT5G52640Heat shock-like protein 90.12Wang et al., 2016 [40]Interacts with disease resistance signaling components and is required for RPS2-mediated resistance.
Vitvi01g01846AT2G03440Nodulin-related protein 11Fu et al., 2010 [41]Negative regulation of ABA response and abiotic stress (cold) inducible.
Vitvi04g00092AT2G26150Heat shock transcription factor A21Friedrich et al., 2021 [30]Regulating heat stress memory genes and thermotolerance.
Vitvi07g00078AT3G22830Heat shock transcription factor A6B1Huang et al., 2016 [31]Positive mediator of ABA dependent thermotolerance and drought resistance.
Vitvi01g00372AT5G38110Anti- silencing function 1b1Lario et al., 2013 [32]
Weng et al., 2014 [42]
A positive regulator of basal and acquired thermotolerance.
Vitvi14g02461AT2G47180Galactinol synthase 1313Jang et at., 2018 [43]Role in improving oxidative stress tolerance by increasing galactinol biosynthesis in Arabidopsis.
Hormone biosynthesis and signalling—Lipid metabolism, JA biosynthesis and Response
Vitvi13g01780AT3G45140Lipoxygenase 21No referenceLipoxygenase involved in JA biosynthesis.
Vitvi09g00085AT1G17420Lipoxygenase 31Chávez-Martínez et al., 2020 [44]
Yang et al., 2020 [45]
Lipoxygenase involved in JA biosynthesis.
Vitvi04g02169AT1G19640Jasmonic acid carboxyl methyltransferase1Kim et al., 2009 [46]
Wu et al., 2008 [47]
Catalyses the formation of methyl jasmonate from JA.
Vitvi09g00038AT3G14225GDSL-motif lipase 4 hydrolase1Oh et al., 2005 [48]Lipase involved in resistance to necrotrophic pathogens.
Vitvi10g00669AT5G45670GDSL-like Lipase/Acylhydrolase1No referenceLipase. Unknown role.
Vitvi07g00039AT2G30550Alpha/beta-Hydrolases superfamily protein1Dervisi et al., 2020 [49]Role in JA biosynthesis. Lipase hydrolysing phosphatidylcholine, glycolipids, triacylglycerol.
Vitvi15g00298AT3G03520Phospholipase C31Krčková et al., 2015 [50]Positive regulator of thermotolerance, induced by phosphate starvation and abiotic stresses.
Vitvi13g00864AT5G07010Sulfotransferase 2A1Gidda et al., 2003 [51]Acts on 11- and 12-hydroxyjasmonic acid. Involved in reducing excess JA levels.
Vitvi13g01379AT5G07010Sulfotransferase 2A3Gidda et al., 2003 [51]Acts on 11- and 12-hydroxyjasmonic acid. Involved in reducing excess JA levels.
Vitvi14g01283AT5G38710Proline Dehydrogenase4Funck et al., 2010 [52]Upregulated during salt stress.
Vitvi12g02545AT4G08500MAPK/ERK kinase 1 4Kong et al., 2012 [53]Negative regulator of wound and immune responses.
Vitvi11g01479AT5G51350Leucine-rich repeat transmembrane protein kinase4Gursanscky et al., 2016 [54]Represses genes associated with ethylene and JA.
Hormone biosynthesis and signalling—Ethylene Biosynthesis and signaling and hypoxic responses
Vitvi10g02409AT1G05010Ethylene-forming enzyme ACO41Moon et al., 2020 [55]BR repressible ethylene biosynthetic gene involved in inhibition of growth.
Vitvi16g01438AT5G47230ERF51Son et al., 2012 [56]
Moffat et al., 2012 [57]
Involved in chitin-induced innate immunity and a positive regulator of JA/ethylene-responsive genes.
Vitvi12g00274AT5G44210ERF91Maruyama et al., 2013 [58]Regulator of plant defence against necrotrophic fungi mediated by the DEAR1-dependent ethylene/JA signaling pathway.
Vitvi19g01784AT3G15210ERF41Yang et al., 2005 [59]Modulates ethylene and ABA responses.
Vitvi18g02240AT1G71450Integrase-type DNA-binding superfamily1Chen et al., 2015 [60]Negatively regulates ethylene response.
Vitvi06g00667AT2G30020AP2C11Schweighofer et al., 2007 [61]Negative regulator of ethylene and JA synthesis and responses of resistance to Botrytis c.
Vitvi07g00357AT2G47520ERF B-2 of ERF/AP2 transcription factor family1Licausi et al., 2010 [62]Hypoxia responsive ERF.
Vitvi08g00793AT2G38470WRKY33 1Birkenbihl et al., 2012 [63]
Tang et al., 2021 [64]
WRKY transcription factor regulator of Botrytis resistance and hypoxia responses by direct regulation of RAP2.2.
Vitvi15g01090AT4G01250WRKY22 1Hsu et al., 2013 [65]WRKY22 family transcription factor, hypoxia inducible and regulating innate immunity in hypoxia.
Vitvi16g01444AT5G51190ERF1051Bolt et al., 2017 [66]Transcription factor required for freezing tolerance and cold acclimation.
Vitvi17g00787AT1G60190ERF1051Bolt et al., 2017 [66]Transcription factor required for freezing tolerance and cold acclimation.
Vitvi16g01434AT1G60190ERF1051Bolt et al., 2017 [66]Transcription factor required for freezing tolerance and cold acclimation.
Vitvi16g01432AT1G60190ERF1051Bolt et al., 2017 [66]Transcription factor required for freezing tolerance and cold acclimation.
Vitvi18g00295AT1G60190ERF1051Bolt et al., 2017 [66]Transcription factor required for freezing tolerance and cold acclimation.
Vitvi16g01423AT1G60190ERF1051Bolt et al., 2017 [66]Transcription factor required for freezing tolerance and cold acclimation.
Vitvi02g00407AT1G63030Integrase-type DNA-binding superfamily1Lehti-Shiu et al., 2015 [67]Negative regulator of gibberellic acid biosynthesis.
Hormone biosynthesis and signalling—ABA biosynthesis and signaling
Vitvi17g00116AT3G48530SNF1-related protein kinase regulatory subunit gamma 11Van Dingenen et al., 2019 [68]Regulates responses to sugar availability, negative regulator of HXK1.
Vitvi02g00114AT4G11070WRKY family transcription factor1Ding et al., 2014 [69]Regulation of ABI3 independent from ABA, positive regulating ABA sensitivity.
Vitvi13g00058AT2G40140Zinc finger (CCCH-type) family protein1AbuQamar et al., 2006 [70]Positive regulator of Botrytis resistance and negative regulator of ABA.
Vitvi01g00956AT2G02820MYB domain protein 881Xie et al., 2010 [71]Sensing and/or transducing drought and saline stress.
Vitvi14g01499AT5G13180NAC domain containing protein 831Yang et al., 2011 [72]Molecular link integrating plant responses to environmental stresses and leaf longevity.
Vitvi10g00063AT1G62300WRKY family transcription factor1Chen et al., 2009 [73]Regulates the ABA responsive gene Phosphate1 (Pho1) expression in response to low phosphate.
Vitvi08g00793AT2G38470WRKY transcription factor family. 1Liu et al., 2015 [26]Negative regulator of ABA signalling and positive regulator of resistance to Botrytis.
Vitvi08g00298AT5G04870CDPK11Yu et al., 2007 [74]Positive regulator of ABA responses in grape berry.
Vitvi15g01084AT2G46140Late embryosis abundant protein1Candat et al., 2014 [75]Involved in protection from abiotic stress: desiccation and cold.
Vitvi16g00941AT4G25480DREB subfamily A-1 of ERF/AP2 transcription factor family (CBF3)1Kasuga et al., 1999 [76]Involved in conferring resistance to drought and freezing stress.
Vitvi02g01288AT4G191709-cis-epoxycarotenoid dioxygenase 4 2Bruno et al., 2016 [77]Production of acyclic regulatory metabolites.
Vitvi05g00548AT3G51895Sulphate transporter 3;11Cao et al., 2014 [78]Co-regulation of S-metabolism and ABA biosynthesis.
Vitvi18g03100AT5G47550Cystatin/monellin superfamily protein1Song et al., 2017 [79]Positive role in the heat shock-responsive expression of AtCYS5.
Vitvi01g00353AT1G18390Serine/Threonine kinase 2Lim et al., 2015 [80]Involved in ABA-mediated signaling and drought resistance.
Vitvi18g01703AT1G71960ATP-binding cassette family G25 ABCG253Kuromori et al. 2021 [81]Involved in intercellular ABA import inside cells.
Vitvi04g00423AT1G15520ATP-binding cassette family G40 ABCG403Kang et al., 2015 [82]Necessary for ABA export from cells.
Vitvi05g00963AT3G242209-cis-epoxycarotenoid dioxygenase 63Seo et al., 2006 [83]ABA biosynthetic gene.
Vitvi17g00601AT1G74670GASA63Qu et al., 2016 [84]ABA repressible and GA inducible; cell wall regulator.
Vitvi12g00685AT5G35750Histidine kinase 24Wulfetange et al., 2011 [85]Negative regulator of ABA sensitivity in stomata.
Hormone biosynthesis and signalling—Auxin and CK Response
Vitvi11g00394AT3G23050Indole-3-acetic acid 72Cui et al., 2013 [86]AUX/IAA family factor. Negative regulator of pathogenicity, through regulation of auxin response.
Vitvi12g00594AT4G27280Calcium-binding EF-hand family protein1Hazak et al., 2019 [87]Ca2+ dependent transducer of auxin-regulated gene expression.
Vitvi16g01201AT4G27950Cytokinin response factor 41Zwack et al., 2016 [88]Cytokinin response factor 4 (CRF4) is a positive regulator of freezing tolerance
Vitvi17g00210AT1G73590PIN1 auxin efflux carrier 3Banasiak et al., 2019 [89]Auxin efflux transporter.
Vitvi13g00019AT2G38120AUX14Bennet et al., 1996 [90]Auxin influx transporter.
Vitvi05g00476AT5G19530Spermine synthase4Hanzawa et al., 2003 [91]Biosynthesis of polyamine spermine, promoting growth of organs.
Vitvi17g00157AT2G01940C2H2-like zinc finger protein4Morita et al., 2006 [92]Transcription factor involved in shoot gravitropism and gravity perception.
Table 2. Sequences of primers used for targeted real-time PCR expression analysis. VvTCPB and VvAIG1 are the reference genes [116]; VvGGT (Gamma-Glutamyltransferase) [12] and VvGST (Glutathione S-transferase) [12] are involved in glutathione metabolism; VviCCD4a (Carotenoid Cleavage Dioxygenase) [1] is a gene putatively involved in carotenoid metabolism and generation of norisoprenoids; VviLinNer1 is a Linalool synthase [19].
GenePrimerPrimer FPrimer RReference
VvTCPB
(Vitvi18g00138)
TCPBCAGACAGTGATTGACAGCCGAGTTATCCCTGCGTGGCTTTCTTCC[116]
VvAIG1
(Vitvi18g02131)
AIG1GGAAGATTATTTGGGCCGTGAGACTTCTTGGCTTCATCCTTGGTC[116]
VviLinNer1 (Vitvi10g02128)Ner1GTGGGCGAGTTTATGCAACGCCCTGAACTAACGGCCCCAT[19]
VviCCD4a (Vitvi02g01286)CCD4aCGAGGCATCCGCTATCCACACACGTCCAGCTTCACCACTCC[1]
VvGGT (Vitvi11g00234)GGTTGGCAACAGCTTAGAGGCAGTACCCACCTGCCTTTCTCACAT[12]
VvGST3
(Vitvi17g01467)
GST3TGCAAAGGTGTTGGACATCTATGTGTGAATGGAAGGTGGCTAAGA[12]
Disclaimer/Publisher’s Note: The statements, opinions and data contained in all publications are solely those of the individual author(s) and contributor(s) and not of MDPI and/or the editor(s). MDPI and/or the editor(s) disclaim responsibility for any injury to people or property resulting from any ideas, methods, instructions or products referred to in the content.

