Article

Maize Production under Drought Stress: Nutrient Supply, Yield Prediction

1
Institute of Land Use, Engineering and Precision Farming Technology, Faculty of Agricultural and Food Sciences and Environmental Management, University of Debrecen, Böszörményi Str. 138, H-4032 Debrecen, Hungary
2
Institute of Statistics and Methodology, Faculty of Economics and Business, University of Debrecen, Böszörményi Str. 138, H-4032 Debrecen, Hungary
*
Author to whom correspondence should be addressed.
Plants 2023, 12(18), 3301; https://doi.org/10.3390/plants12183301
Submission received: 14 August 2023 / Revised: 7 September 2023 / Accepted: 9 September 2023 / Published: 18 September 2023

Abstract

:
Maize yield forecasting is important for the organisation of harvesting and storage, for the estimation of the commodity base and for the provision of the country’s feed and food demand (export–import). To this end, a field experiment was conducted in dry (2021) and extreme dry (2022) years to track the development of the crop to determine the evolution of the relative chlorophyll content (SPAD) and leaf area index (LAI) for better yield estimation. The obtained results showed that SPAD and LAI decreased significantly under drought stress, and leaf senescence had already started in the early vegetative stage. The amount of top dressing applied at V6 and V12 phenophases did not increase yield due to the low amount of rainfall. The 120 kg N ha−1 base fertiliser proved to be optimal. The suitability of SPAD and LAI for maize yield estimation was modelled by regression analysis. Results showed that the combined SPAD-LAI was suitable for yield prediction, and the correlation was strongest at the VT stage (R2 = 0.762).

1. Introduction

Maize is the world’s leading staple cereal crop with an average annual production of 1070 million tonnes (2011–2021) [1,2]. The European Union contributed 72,987 thousand tonnes to world maize production in 2021. Hungary is one of the most important maize producers in the EU, with a production of 6424 thousand tonnes, ranking 4th. However, there are significant extremes in the average yield. Over the last 30 years, the national average yield of Hungary has been 6.05 Mg ha−1 with a lower value of 3.7 Mg ha−1 and an upper value of 8.63 Mg ha−1 [3].
Weather extremes due to climate change pose a challenge. Hungary has an annual mean temperature of 10–11.5 °C, and an average annual precipitation of 500–800 mm (1991–2020), with a significantly different spatial distribution [4]. July is the warmest month of the year with an average of 21.2 °C. Based on climate model results, Hungary will continue to experience a rise in average temperature both on an annual and seasonal basis. By 2050, the annual average temperature is expected to increase by 1–2 °C and by 2071–2100, it is expected to increase 3–4 °C. The average summer temperature increase is 3.5–4.5 °C, reaching up to 6 °C in August. Precipitation is projected to decrease nationally, especially in July and August, but may increase in the northeast and northwest [5].
Constantly decreasing rainfall in summer and more frequent temperature rises lead to more intense summer droughts. Drought is one of the most severe environmental stresses [6,7], causing significant damage to plants. It inhibits growth and development [8,9,10] especially during the silking and grain-filling stages [11]. It affects chlorophyll synthesis, accelerates chlorophyll decomposition and inhibits photosynthetic activity [12,13,14]. It causes an 8–10% reduction in chlorophyll content during the vegetative stage and 18% reduction during the reproductive stage [15,16]. It also alters genetic properties [17] and causes yield reduction [18,19,20,21,22,23]. Maize yield loss can vary from 30 to 90% depending on the intensity and duration of drought stress. Drought stress during the silking and grain filling stages may cause yield losses of 50 and 21%, respectively [24].
Another major limiting factor for maize yield and yield loss is fertiliser use, especially N fertiliser. It is a key element for proper growth and development, is involved in chlorophyll formation and photosynthesis, and is closely related to grain yield [25,26,27,28]. The correct timing of N application improves yield parameters, which increases grain yield [29,30]. However, improper optimisation of the rate and proportion of nitrogen application causes a number of problems in cultivation [31], slows growth rate, reduces grain yield and increases nitrogen loss, thereby affecting environmental quality [32,33,34,35].
Numerous systems have been developed for the N supply of crops, including methods based on chlorophyll measurement, such as SPAD. The principle of the method is that the N status of leaves is reflected in leaf greenness [36]. There is a significant difference in SPAD values for maize of different ages and leaves, with significantly higher values before silking and decreasing values 2 weeks after silking [37]. The correlations between the SPAD value and N content per leaf area and yield are strongly influenced by the crop year, phenological stage, leaf thickness, leaf position and measurement point on the leaf [38,39,40].
Leaf area index (LAI), an indicator of plant growth and physiological development, is highly modified by different stress effects (environmental and technological conditions) [41], especially by the extent of water and fertilizer stress [42]. Water stress reduces LAI, as it limits canopy development by inhibiting leaf number and leaf growth [43]. N deficiency also significantly reduces LAI, as leaves are narrower, resulting in a loss of radiation absorption and utilisation (photosynthesis) [44].
For the dynamic monitoring of yields, the timely observation of plant ecophysiological status (e.g., leaf area, chlorophyll and nitrogen content) and assessment of N requirements have become key to ensure successful maize yields at different growth stages, to improve yield [45,46,47], and to forecast yields [48,49].
In the small plot field experiment of the University of Debrecen, the average maize yield in previous years was 14–15 Mg ha−1, which is much higher than the yield in these two years. Therefore, maize growers need as much information as possible on how weather and different rates and timing of N fertilisation affect maize yield and the vegetative and reproductive phenophases to make informed decisions.
To achieve this goal, the authors aim to address the following research objectives: (1) What is the effect of drought stress on SPAD and LAI values? (2) In which phenophase does chlorophyll degradation start under drought stress? (3) How does drought affect the uptake of N applied as a top-dressing nutrient? (4) What are the economically optimal fertilizer rates in dry and extreme dry periods? (5) Which variable(s) can be used to most accurately estimate yield? (6) Which phenophase characteristics show the strongest correlation with yield?

2. Materials and Methods

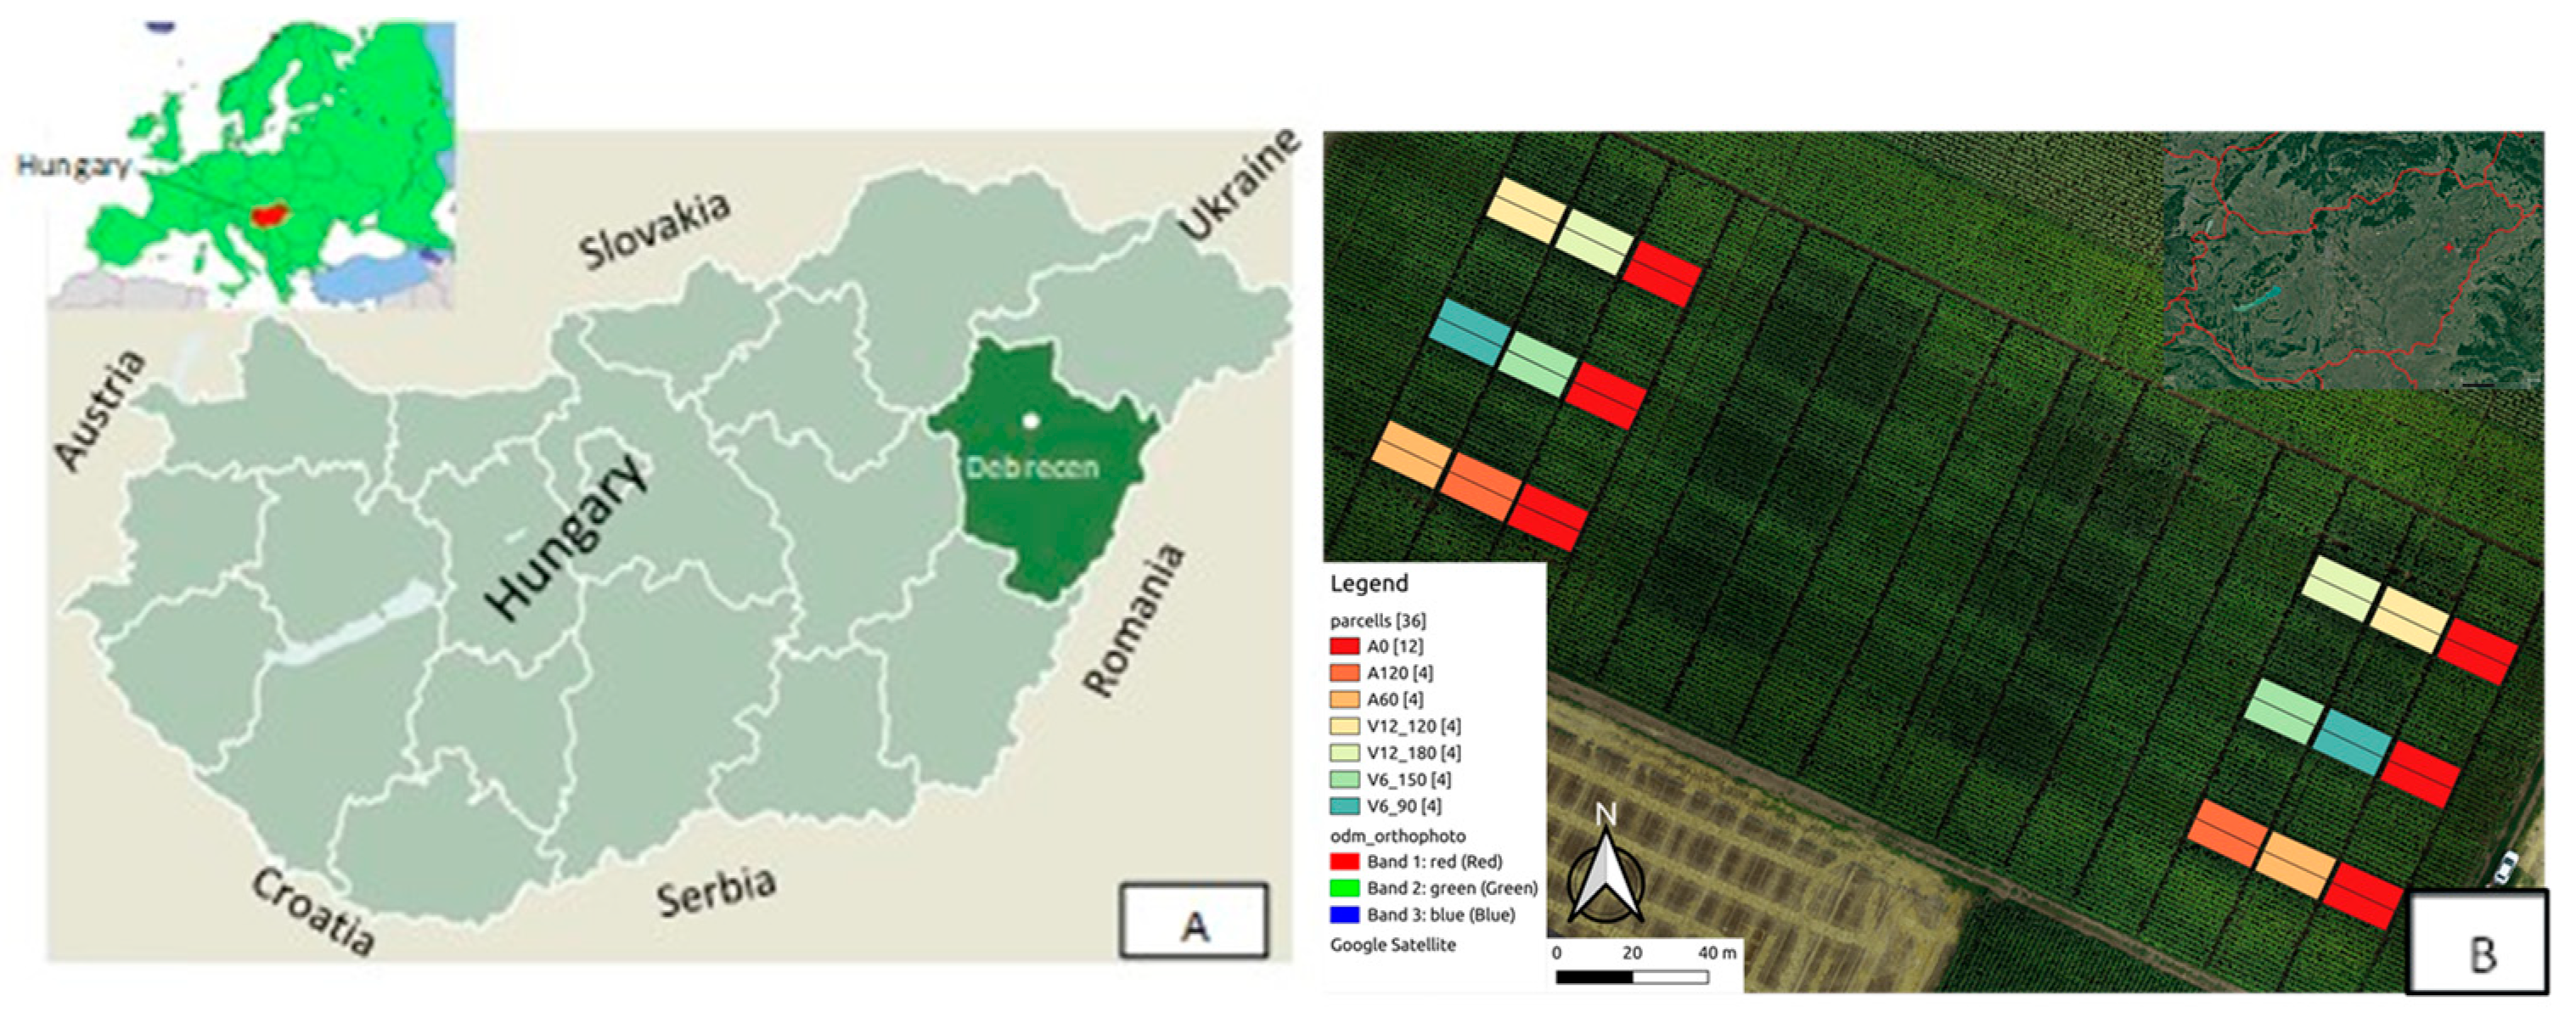
2.1. Experiment Site

Our experiments were conducted in Hungary, at the Experimental Station of the University of Debrecen (47°33′ N, 21°26′ E, altitude 111 m), in a split-strip-plot field experiment (180 plots) set up in 2011 with two replications of small plots. In the present study, the measurement results of two hybrids (Merida and Armagnac) were evaluated under natural precipitation conditions in 2021 and 2022 (Figure 1).

2.2. Soil Data

The soil of the experiment is a deep humic layer of medium-compaction, lowland calcareous chernozem soil (Mollisol-Calciustoll or Vermustoll, clay loam (KA = 42); USDA) with a good condition, an average pHKCl of 6.6, a humus content of 2.6% and a humus layer thickness of 80–100 cm. The soil is calcareous in the upper 80 cm but moderately calcareous (12%) from 100 cm. The original AL-soluble PO25 content of the soil is 130 mg/kg, and the AL-soluble K2O content is 240 mg/kg.

2.3. Experiment Design and Treatments

The fertiliser rates were divided into basal and top-dressing treatments.
Fertiliser treatments:
NameTreatment
A0Unfertilised control;
A6060 kg N ha−1 before sowing;
A120120 kg N ha−1 before sowing;
V69060 kg N ha−1 before sowing + 30 kg N ha−1 during the V6 phenophase;
V6150120 kg N ha−1 before sowing + 30 kg N ha−1 during the V6 phenophase;
V1212060 kg N ha−1 before sowing + 30 kg N ha−1 during the V6 phenophase + 30 kg N ha−1 during the V12 phenophase;
V12180120 kg N ha−1 before sowing + 30 kg N ha−1 during the V6 phenophase + 30 kg N ha−1 during the V12 phenophase.
The maize was sown on 8 April 2021 and 14 April 2022 with a Wintersteiger grain plot seeder. Harvesting of the plots was carried out on 24 September 2021 and 5 October 2022 using a Sampo 2010 plot harvester equipped with an automatic weighing system and an Oros 2011 two-row maize adapter. The plots have 4 rows, row spacing: 76 cm. The area is 27.6 m2 (width: 3 m, length: 9.2 m). There are 1.5 m paths between the fertilized plots. Plant density was 73 thousand plants/ha. Harvested grain yield (Mg ha−1) was corrected for 14% moisture content. Number of plots involved in the study annually: 36.

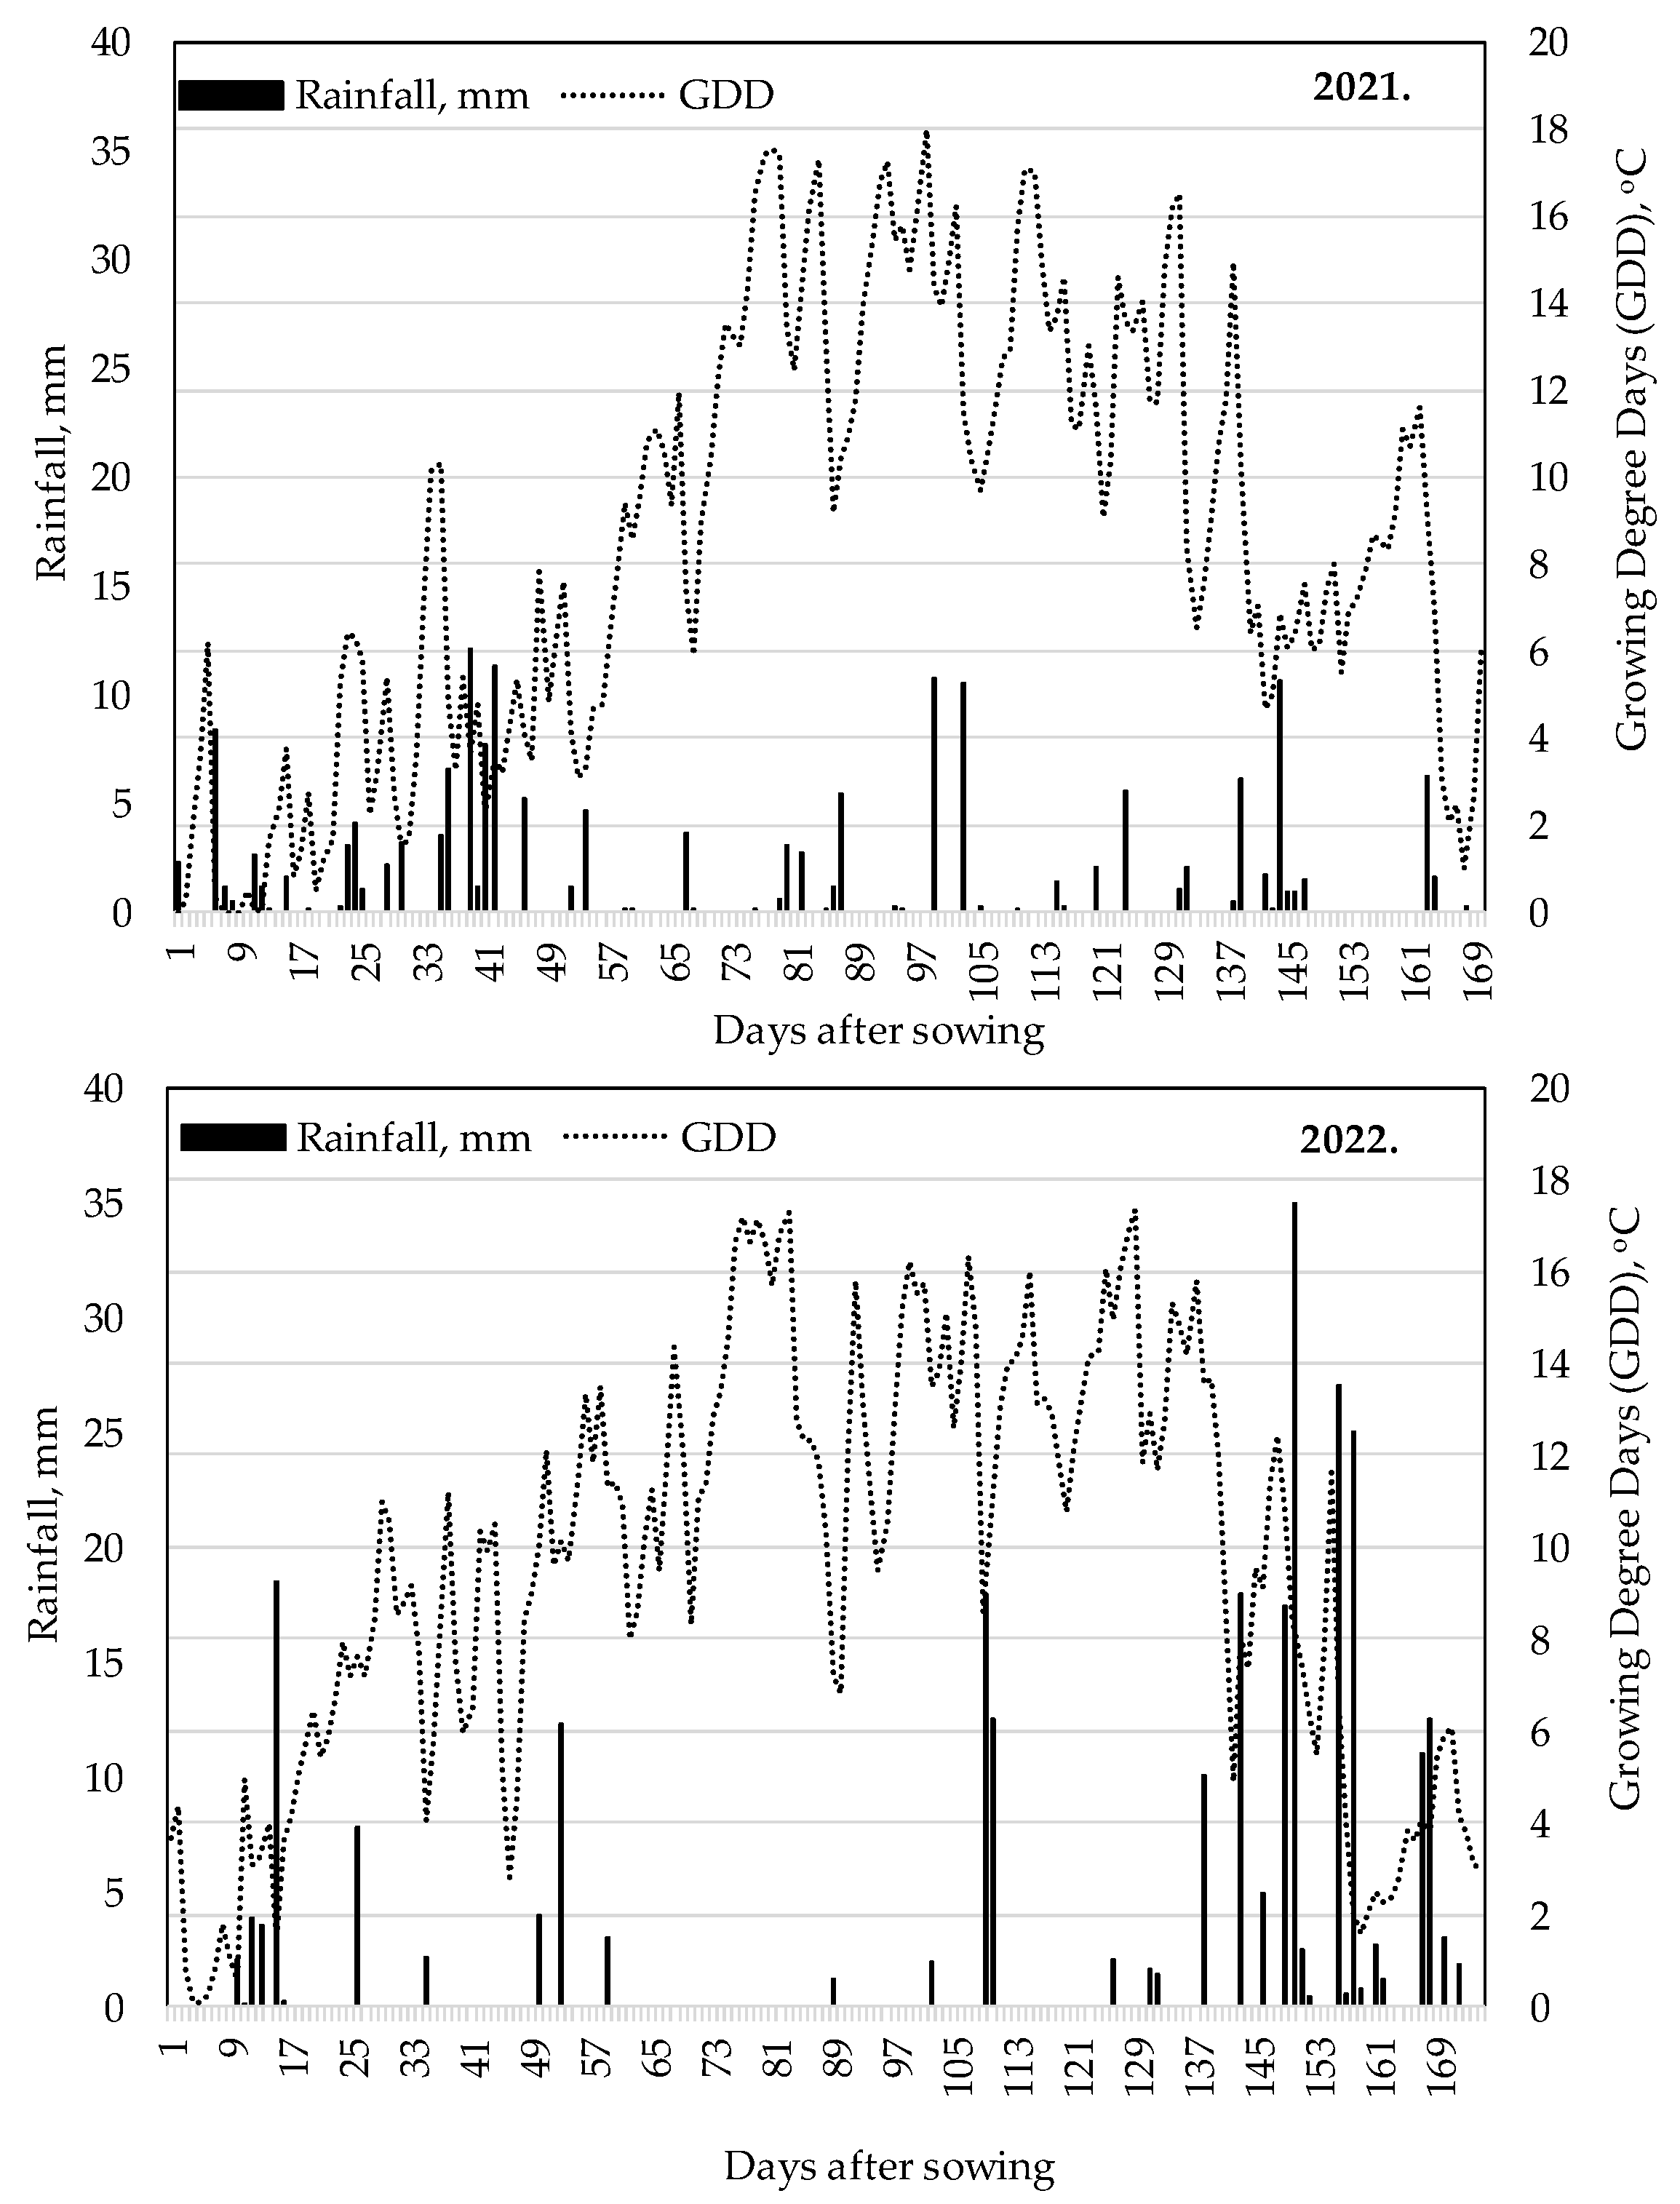
2.4. Climatic Data at the Experiment Site

An automatic weather station located and operated at the University of Debrecen Experimental Station provided the utilised daily meteorological data. The climate data from the National Meteorological Service of the Debrecen Airport station for the period 1981–2010 were used to show deviations from the multi-year average [4].
Growing degree days (GDD) during the growing season were calculated according to the following formula:
GDD = T max + T min 2 T b
where Tmax (°C) is the daily maximum temperature, Tmin (°C) is the daily minimum temperature, and Tb (°C) is the base temperature. For a daily mean temperature lower than the base temperature, i.e., if T max + T min 2 < T b , then T max + T min 2 = T b is used, and the given daily value of the thermal unit of heat is 0 [50]. Tb is the temperature below which the rate of development is considered to be 0. In accordance with the technical literature, the heat sum was calculated using T = 10b °C [51,52].
Under natural precipitation conditions, the accumulated Growing Degree Days (GDDs) from post-emergence (VE) to silking (R1) were nearly similar in both years, with 711 °C in 2021 and 707 °C in 2022. The GDD accumulated between R1 and physiological maturity (R6) in 2022 was 771 °C GDD, which was 68 °C higher than in the same period in 2021. In terms of precipitation, 44 mm less precipitation fell between the VE and R1 phenophase in 2022 (51 mm), and 14 mm more precipitation fell between the R1 and R6 growth stage (67 mm) than in 2021.
Overall, the GDD accumulated between VE and R6 was higher in both years (2021: 1414 °C, 2022: 1478 °C) than the multi-year average for the area: 1200–1280 °C [53], and the precipitation was much lower (2021: 148 mm, 2022: 118 mm) compared to the average (346 mm) (Figure 2). The drought in 2022 was exacerbated by the fact that the previous year 2021 was also very poor in rainfall. The year 2022 was the worst drought year in Hungary in the last 40 years.

2.5. Measuring Instruments and Test Methods

A Minolta SPAD-502 portable device (Minolta Camera Ltd., Osaka, Japan) was used to assess leaf chlorophyll concentration (SPAD). Several studies have shown that SPAD measurements provide non-destructive, rapid and accurate information on the N and chlorophyll concentration of maize leaves [25,54,55,56]. The instrument is based on the absorption of radiation from leaves in the red (650 nm) and near-infrared (940 nm) range. The calculation is based on the ratio of the intensity of the infrared and red light transmitted through the leaf. This ratio is higher the more red light is absorbed by the leaves of the plant, which is closely related to the chlorophyll concentration. The SPAD value ranges from 0 to over 100 [57]. Measurements were taken per N treatment on the 6th, 7th and 8th plants of the second row from the left of each plot. It was considered that chlorophylls are not homogeneously distributed on the leaf blade [58,59]; thus, measurements were taken at the most suitable location: at the midpoint of the leaf tip and the leaf stem, an equal distance from the leaf margin and the midrib. Between V8 and R1 phenophases, fully developed leaves appeared; between the R1 and R6 phenophases, these were on the leaf next to the ear [60].
In order to quickly and reliably estimate leaf area index (LAI), the SunScan canopy analysis system was applied, which provides information on maize LAI using photosynthetically active radiation (PAR) measured in the plant canopy. The SunScan probe estimates LAI indirectly from measurements of radiation above and below the canopy, which is based on a theoretical relationship between the leaf area and canopy transmittance [61]. The system consists of a probe, a sunlight sensor and a data logger. The 1000 × 13 mm probe contains 64 PAR optical sensors spaced 15.6 mm apart. The data collected by the sensors are stored on the data carrier. Spectral resolution: 400–700 nm. Measurements were evenly spaced between rows 2 and 3. The LAI value for a given plot was calculated from the average of 5 measurements. Measurements were performed in the phenophases V8, V10, V12, Vn, Vt, R1, R3, R6.

2.6. Statistical Analysis

Statistical analysis and plots were performed using R 4.3.1. RStudio version 421 was used as the graphical interface [62].
The split-plot design experiment was evaluated using multi-factor analysis of variance. The dependent variables were SPAD, LAI and grain yield. Grouping variables: years (weather), fertilisation and phenophase. The significance level was set at 5%. For significant effects, calculated p-values were also given. Multiple comparisons of means were performed using Duncan’s test. The purpose of these tests was to characterise the evolution of the independent variables in the subsequent regression model and the effects of their shaping factors.
Bivariate and multiple linear regression analysis were used for yield estimation. The dependent variable was yield, and the independent variables were SPAD and LAI. The goodness of fit was characterised by the multiple R2 and RMSE values. SPAD and LAI values implicitly included the effects of weather, fertilisation and phenophases.

3. Results

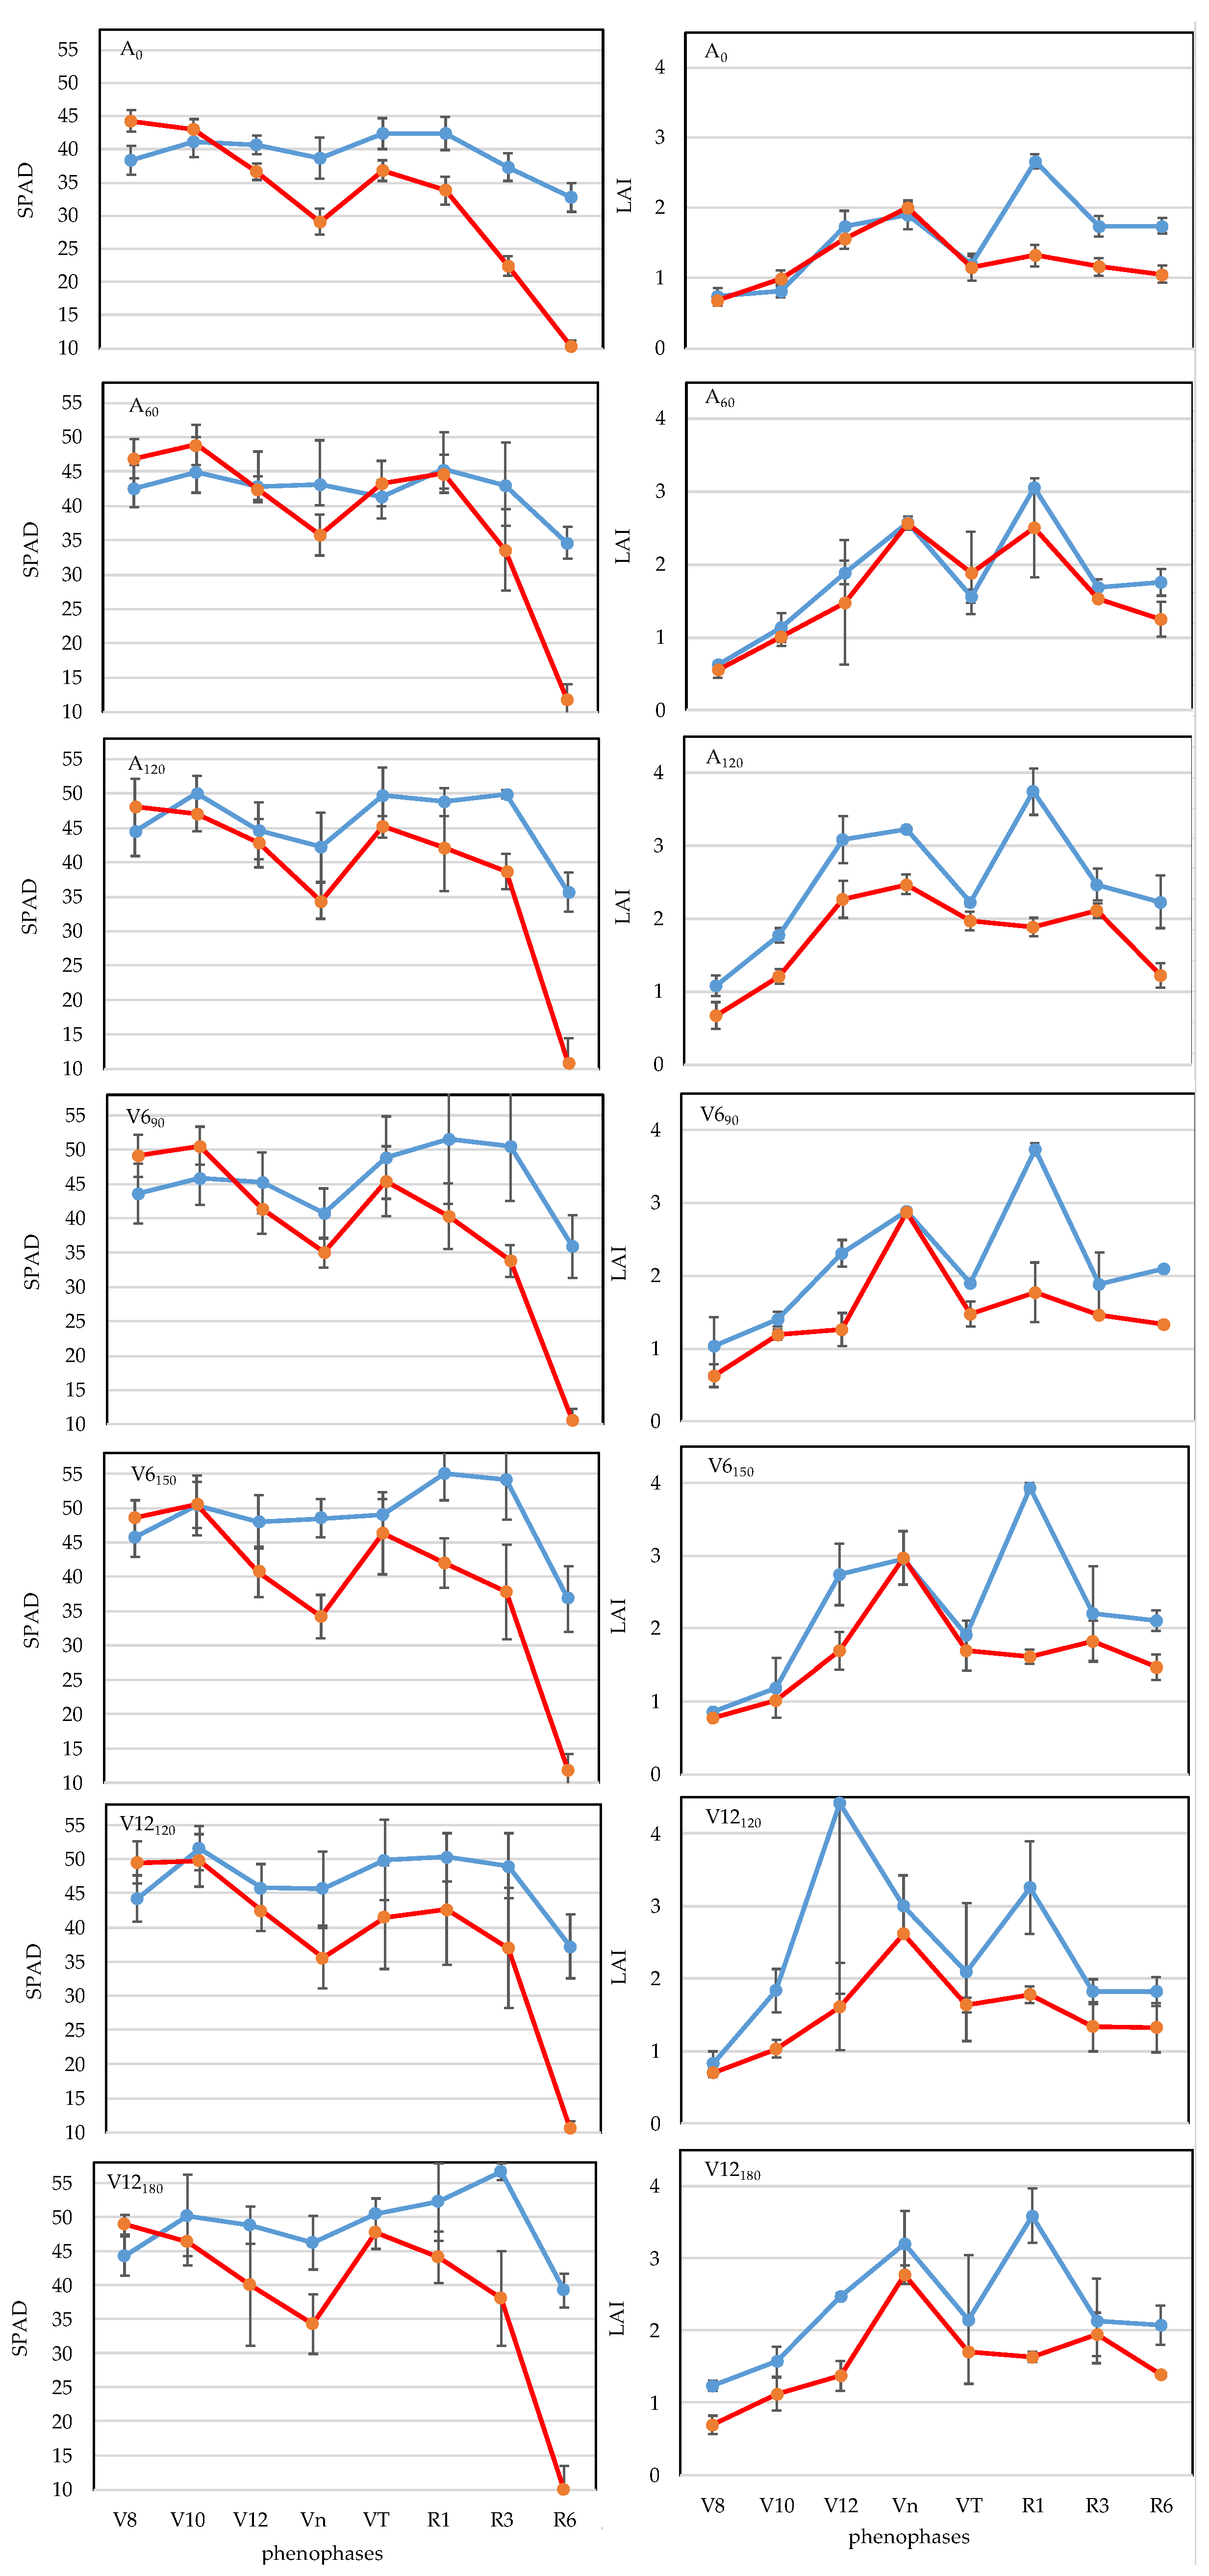
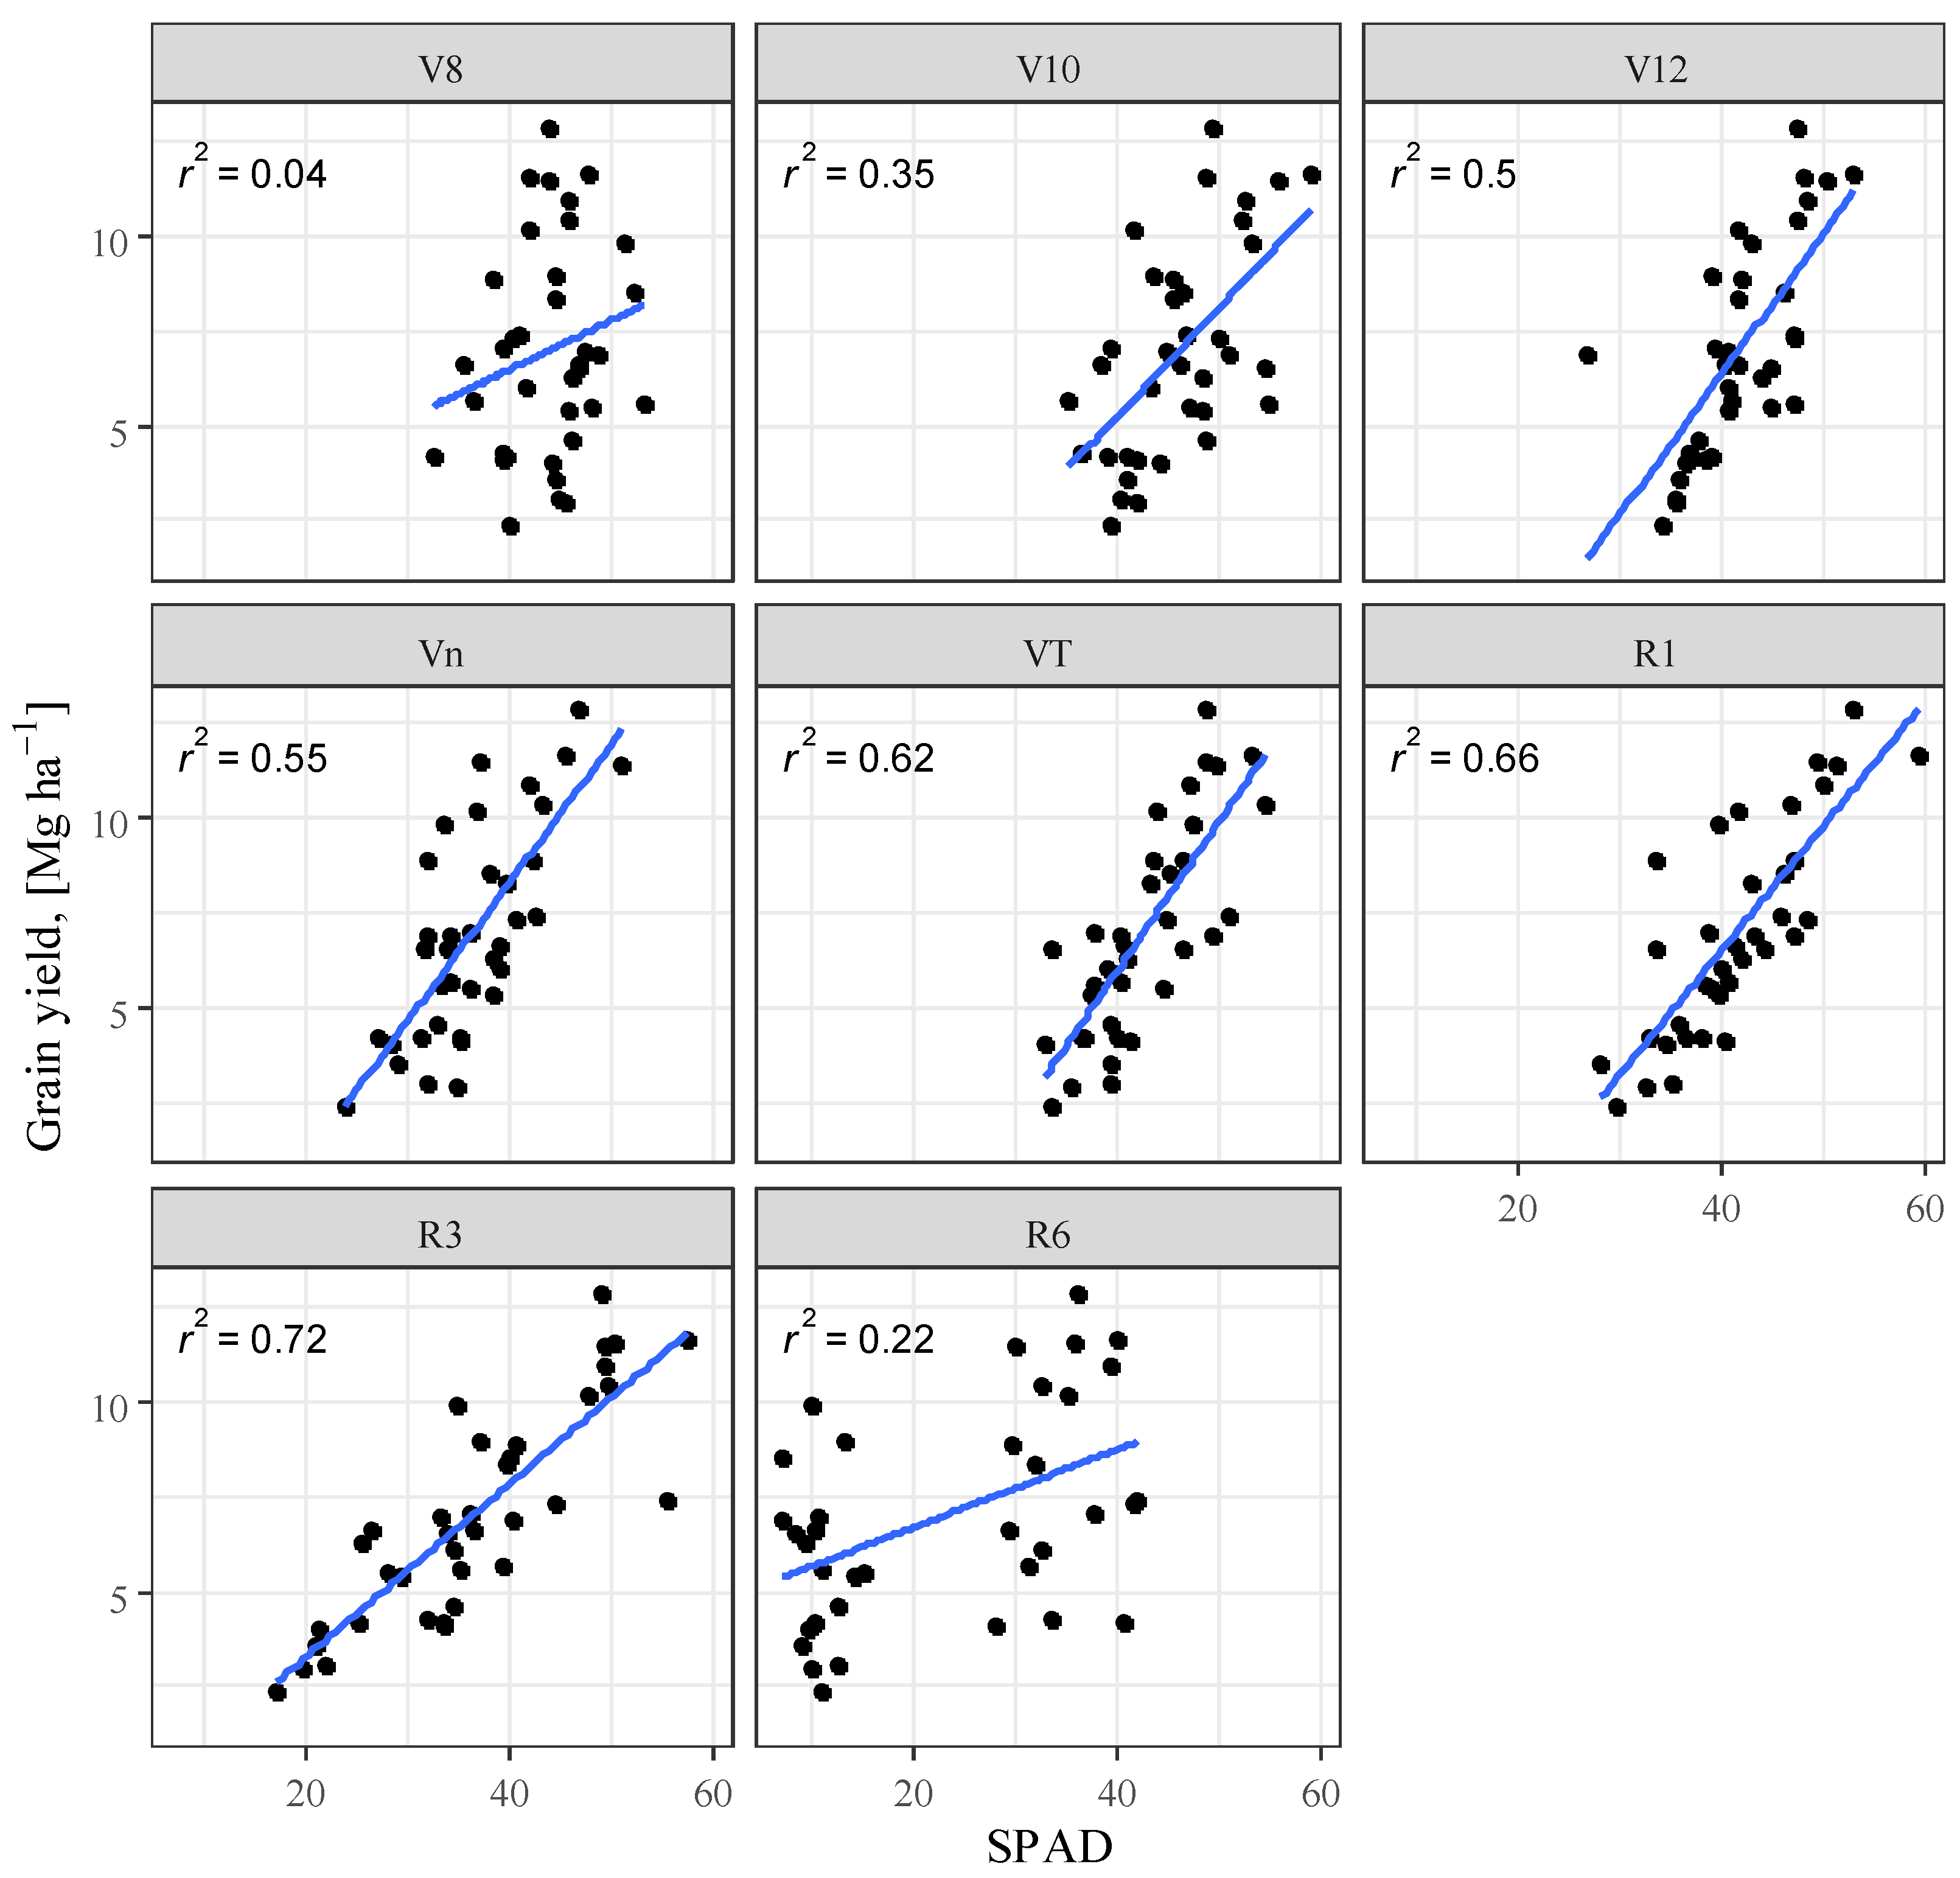
3.1. Chlorophyll Concentration (SPAD)

A pooled analysis of variance of treatments (fertilisation, phenophase and years) showed that all the main factors had an effect (p < 0.001) on SPAD. Crop year had the greatest effect, which was followed by phenophase, and fertilisation had the least influence. All the interactions were verified (p < 0.001). ANOVA by year at the 0.1% level showed the effect of the main factors (phenophase, fertilisation) on SPAD in both years. Fertilisation had the largest effect on SPAD in 2021 and phenophase in 2022. The phenophase × fertilisation interaction was significant at the 5% level in 2021 and 0.1% level in 2022.
In the year 2021, the highest SPAD values (p < 0.05) were detected in different phenophases in the applied fertilizer treatments (Figure 3). The highest SPAD values in the case of the A0 treatment were measured in the VT phenopahse (42.4), in the A60 treatment, they were measured in phenophase V8 (42.6) in the A120 (50.0) and V12120 (51.6) treatments, they were measured in phenophase V10, in V690 (51.5) and V6150 (55.0) top-dressing treatments, they were measured in phenophase R1, and in V12180 treatment, they were measured in phanophase R3 (56.7). There was no significant change compared to the verified maximum SPAD values for the R1 phase, while a decrease in SPAD value was verified at the 5% level for the R6 phenophase. Top-dressing treatments showed the largest decrease of around 30%. In the studied growing period (V8-R6), the A0 treatment had the lowest SPAD value (39.2), while in comparison, the highest SPAD value was ensured by the treatment with 120 kg N ha−1 applied as basal fertilizer with an additional 30 kg N ha−1 fertilizer dose in the V6 phenophase (V6150) (48.5; p < 0.05), with an increase of 23.7%.
In the year 2022, the highest SPAD value (p < 0.05) was detected in the V8 phenophase (p < 0.05) in all fertilizer treatments except for the 60 kg N ha−1 treatment (A60) (Figure 3). For the R1 phenophase, the A0 treatment showed the largest reduction of 23.7% (p < 0.05), while for the R6 phenophase, all treatments showed a reduction of 76–79% (p < 0.05). For the studied growing period (V8-R6), a 20% increase in SPAD was achieved with the lowest 60 kg N ha−1 basal treatment (A60; p < 0.05) compared to the very low SPAD value of the A0 treatment (32.0). The higher 120 kg N ha−1 (N120) treatment or the application of additional top dressing did not significantly increase SPAD.
Averaged over two years, the highest SPAD values were detected in the V8 phenophase in treatments A0 (41.4), A120 (46.3) and V12180 (46.5) (p < 0.05), while the highest SPAD values were detected in treatments A60 (46.9), V690 (48.2), V6150 (50.5) and V12120 (50.7) top dressing in the V10 phenophase (p < 0.05). For R1 phenophase, compared to the highest SPAD value verified at the 5% level, the lowest SPAD value reduction was detected in the A120 treatment (1.9%; not significant), and for R6 phenophase, it was detected in the V12180 (47.1%; (p < 0.05) treatment. For both phenophases (R1, R6), the largest reduction was detected in the V12120 top-dressing treatment (8.3%, p < 0.05; 52.9%, p < 0.05). For the growing period (V8-R6), A0 treatment had the lowest SPAD value (35.6), with A60 providing the highest SPAD value at the 5% level in comparison, with an increase of 13.5%.
The crop year had a significant effect (p < 0.001) on the relative chlorophyll content (SPAD). The average SPAD value for the two dry years was 40.1. In 2021, an above average SPAD value of 43.8 was detected, while in the exceptionally dry year of 2022, a critically low SPAD value of 36.4 was measured, with the difference verified at the 0.1% level. In 2022, the average SPAD value of fertiliser treatments was lower (p < 0.001) than in 2021 for all development stages except the V8 phenophase. The results obtained support the findings of [63] and [64] that drought limits photosynthesis, water and nutrient uptake, thereby reducing development. The largest difference between the examined years was observed in the R3 and R6 phenophases, representing a reduction of SPAD values of 14.4 (p < 0.001) and 24.6 (p < 0.001), respectively. Averaged over the examined phenophases (V8-R6), all fertiliser treatments had significantly lower SPAD values in 2022. The smallest difference was found in the V690 (7.0; p < 0.05) treatment and the largest was found in the V6150 (9.8; p < 0.001) treatment (Figure 3).

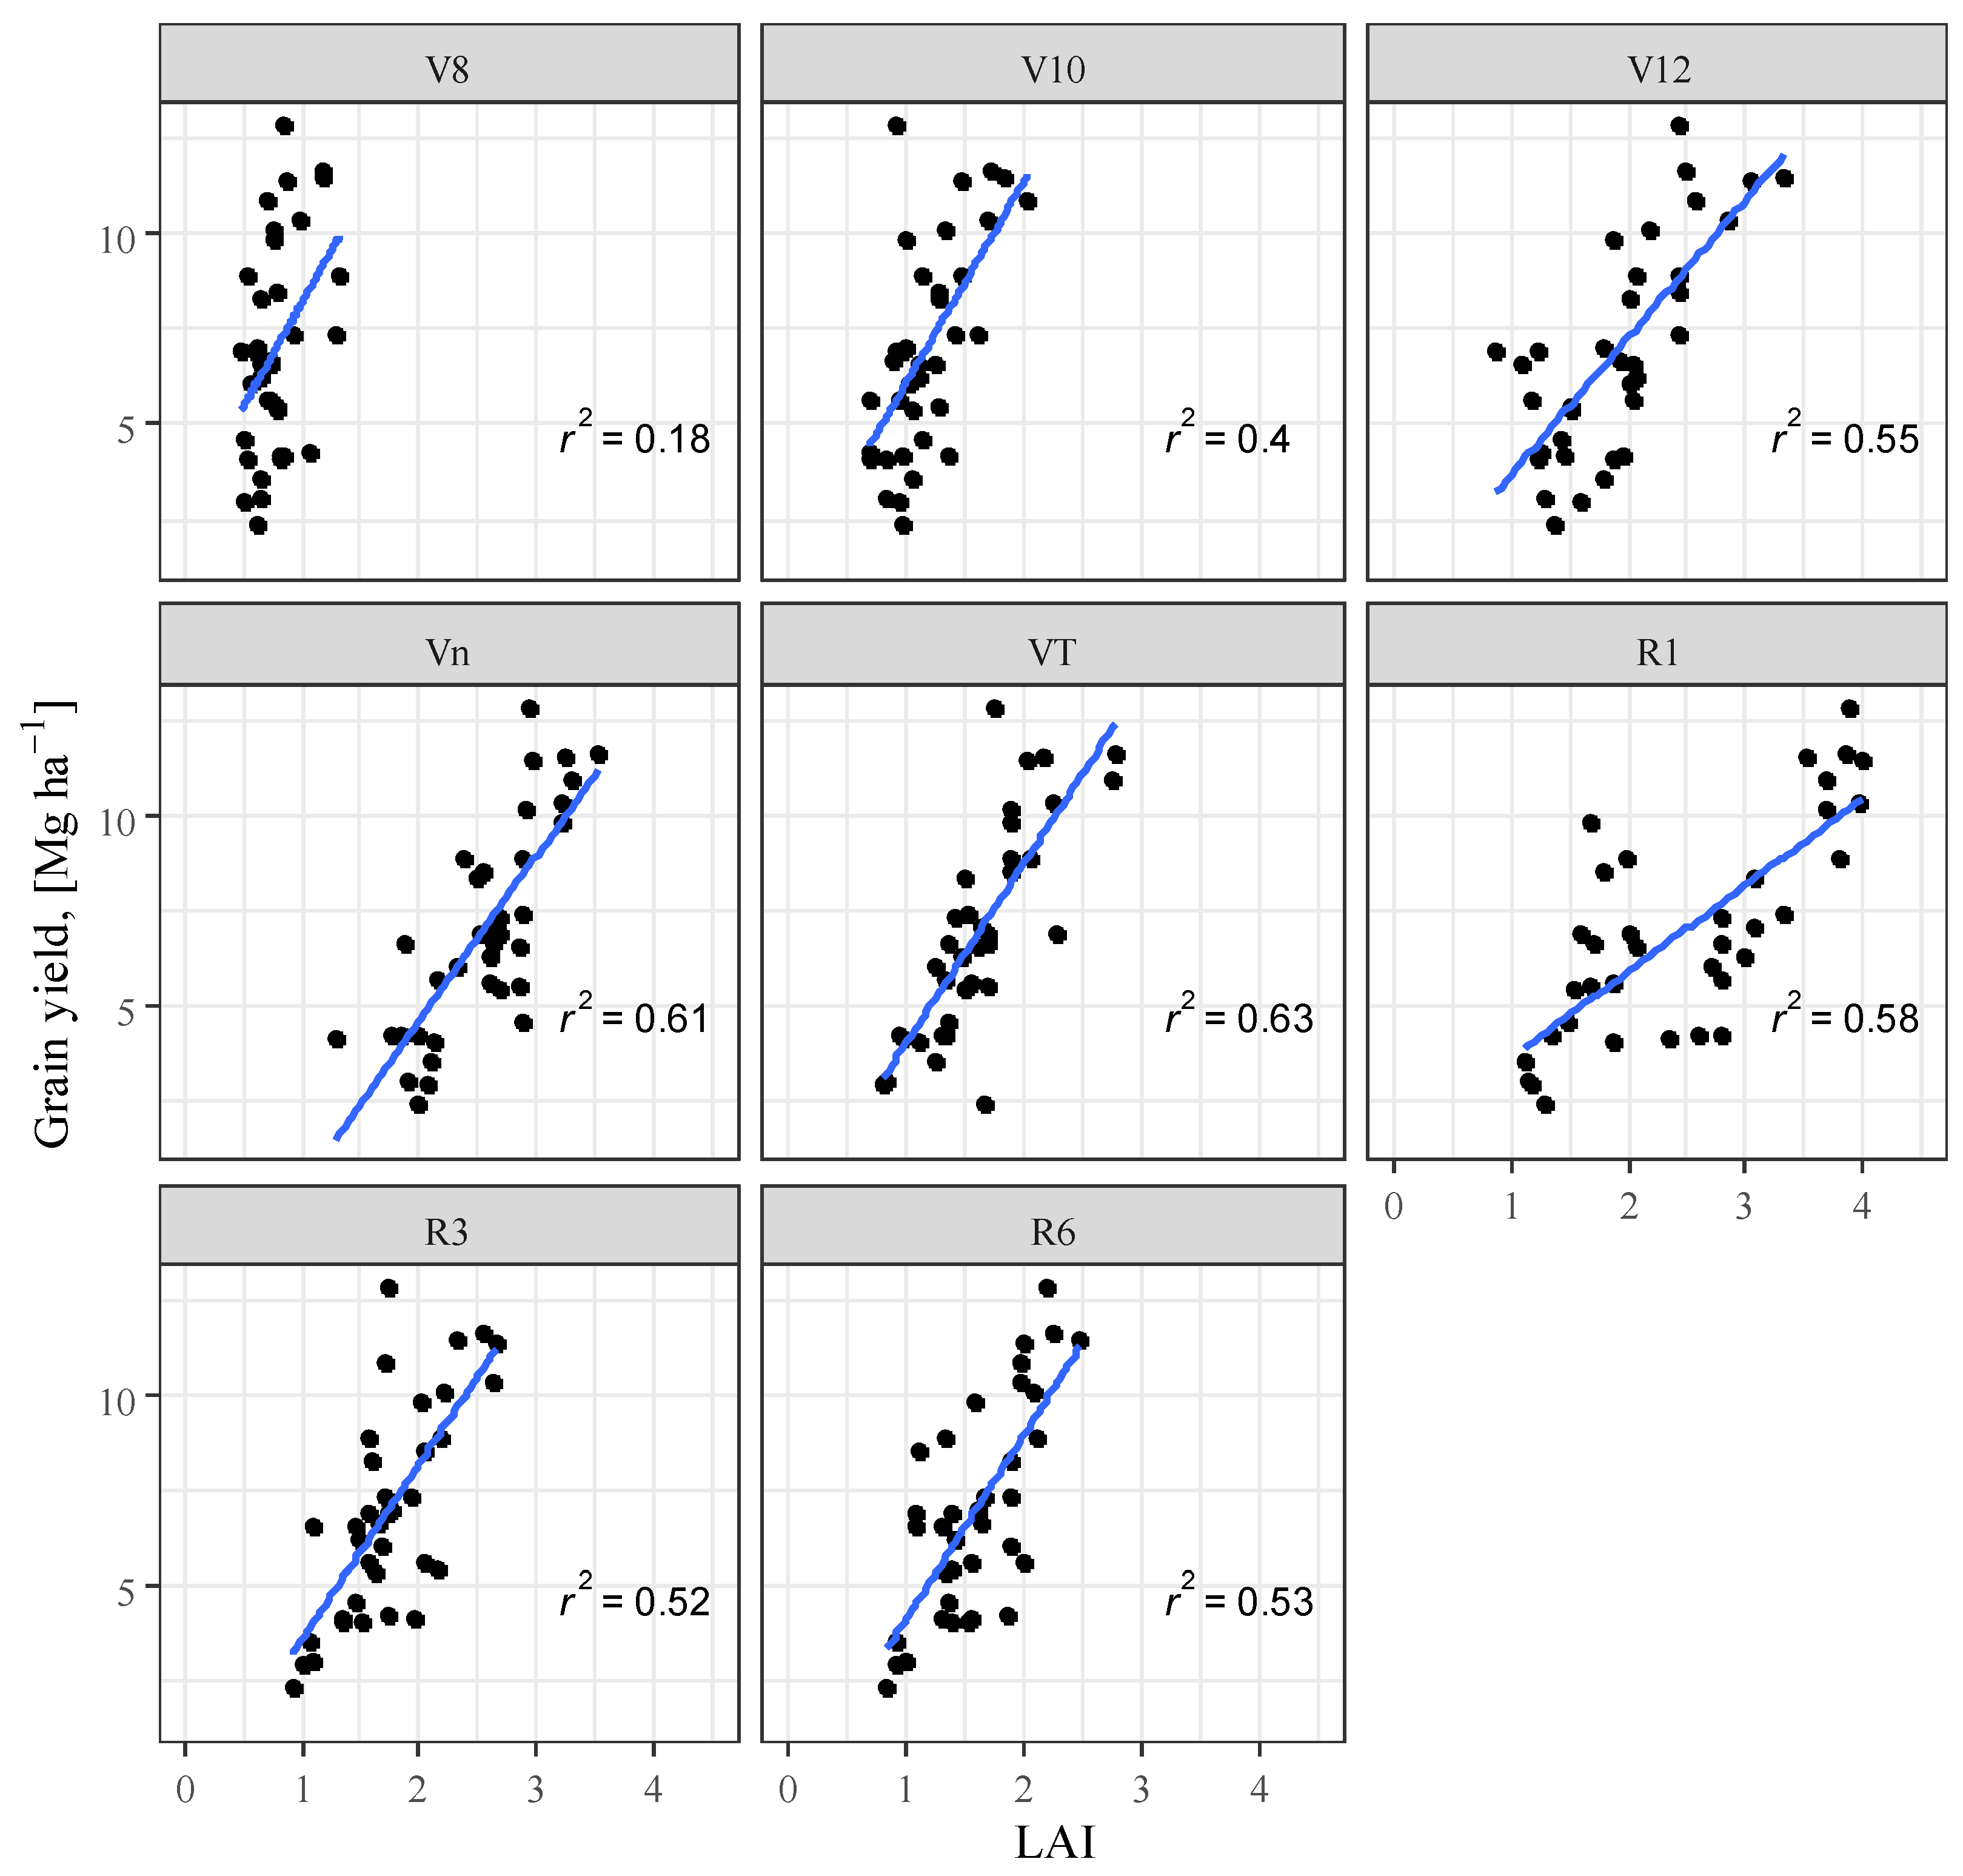
3.2. Leaf Area Index (LAI)
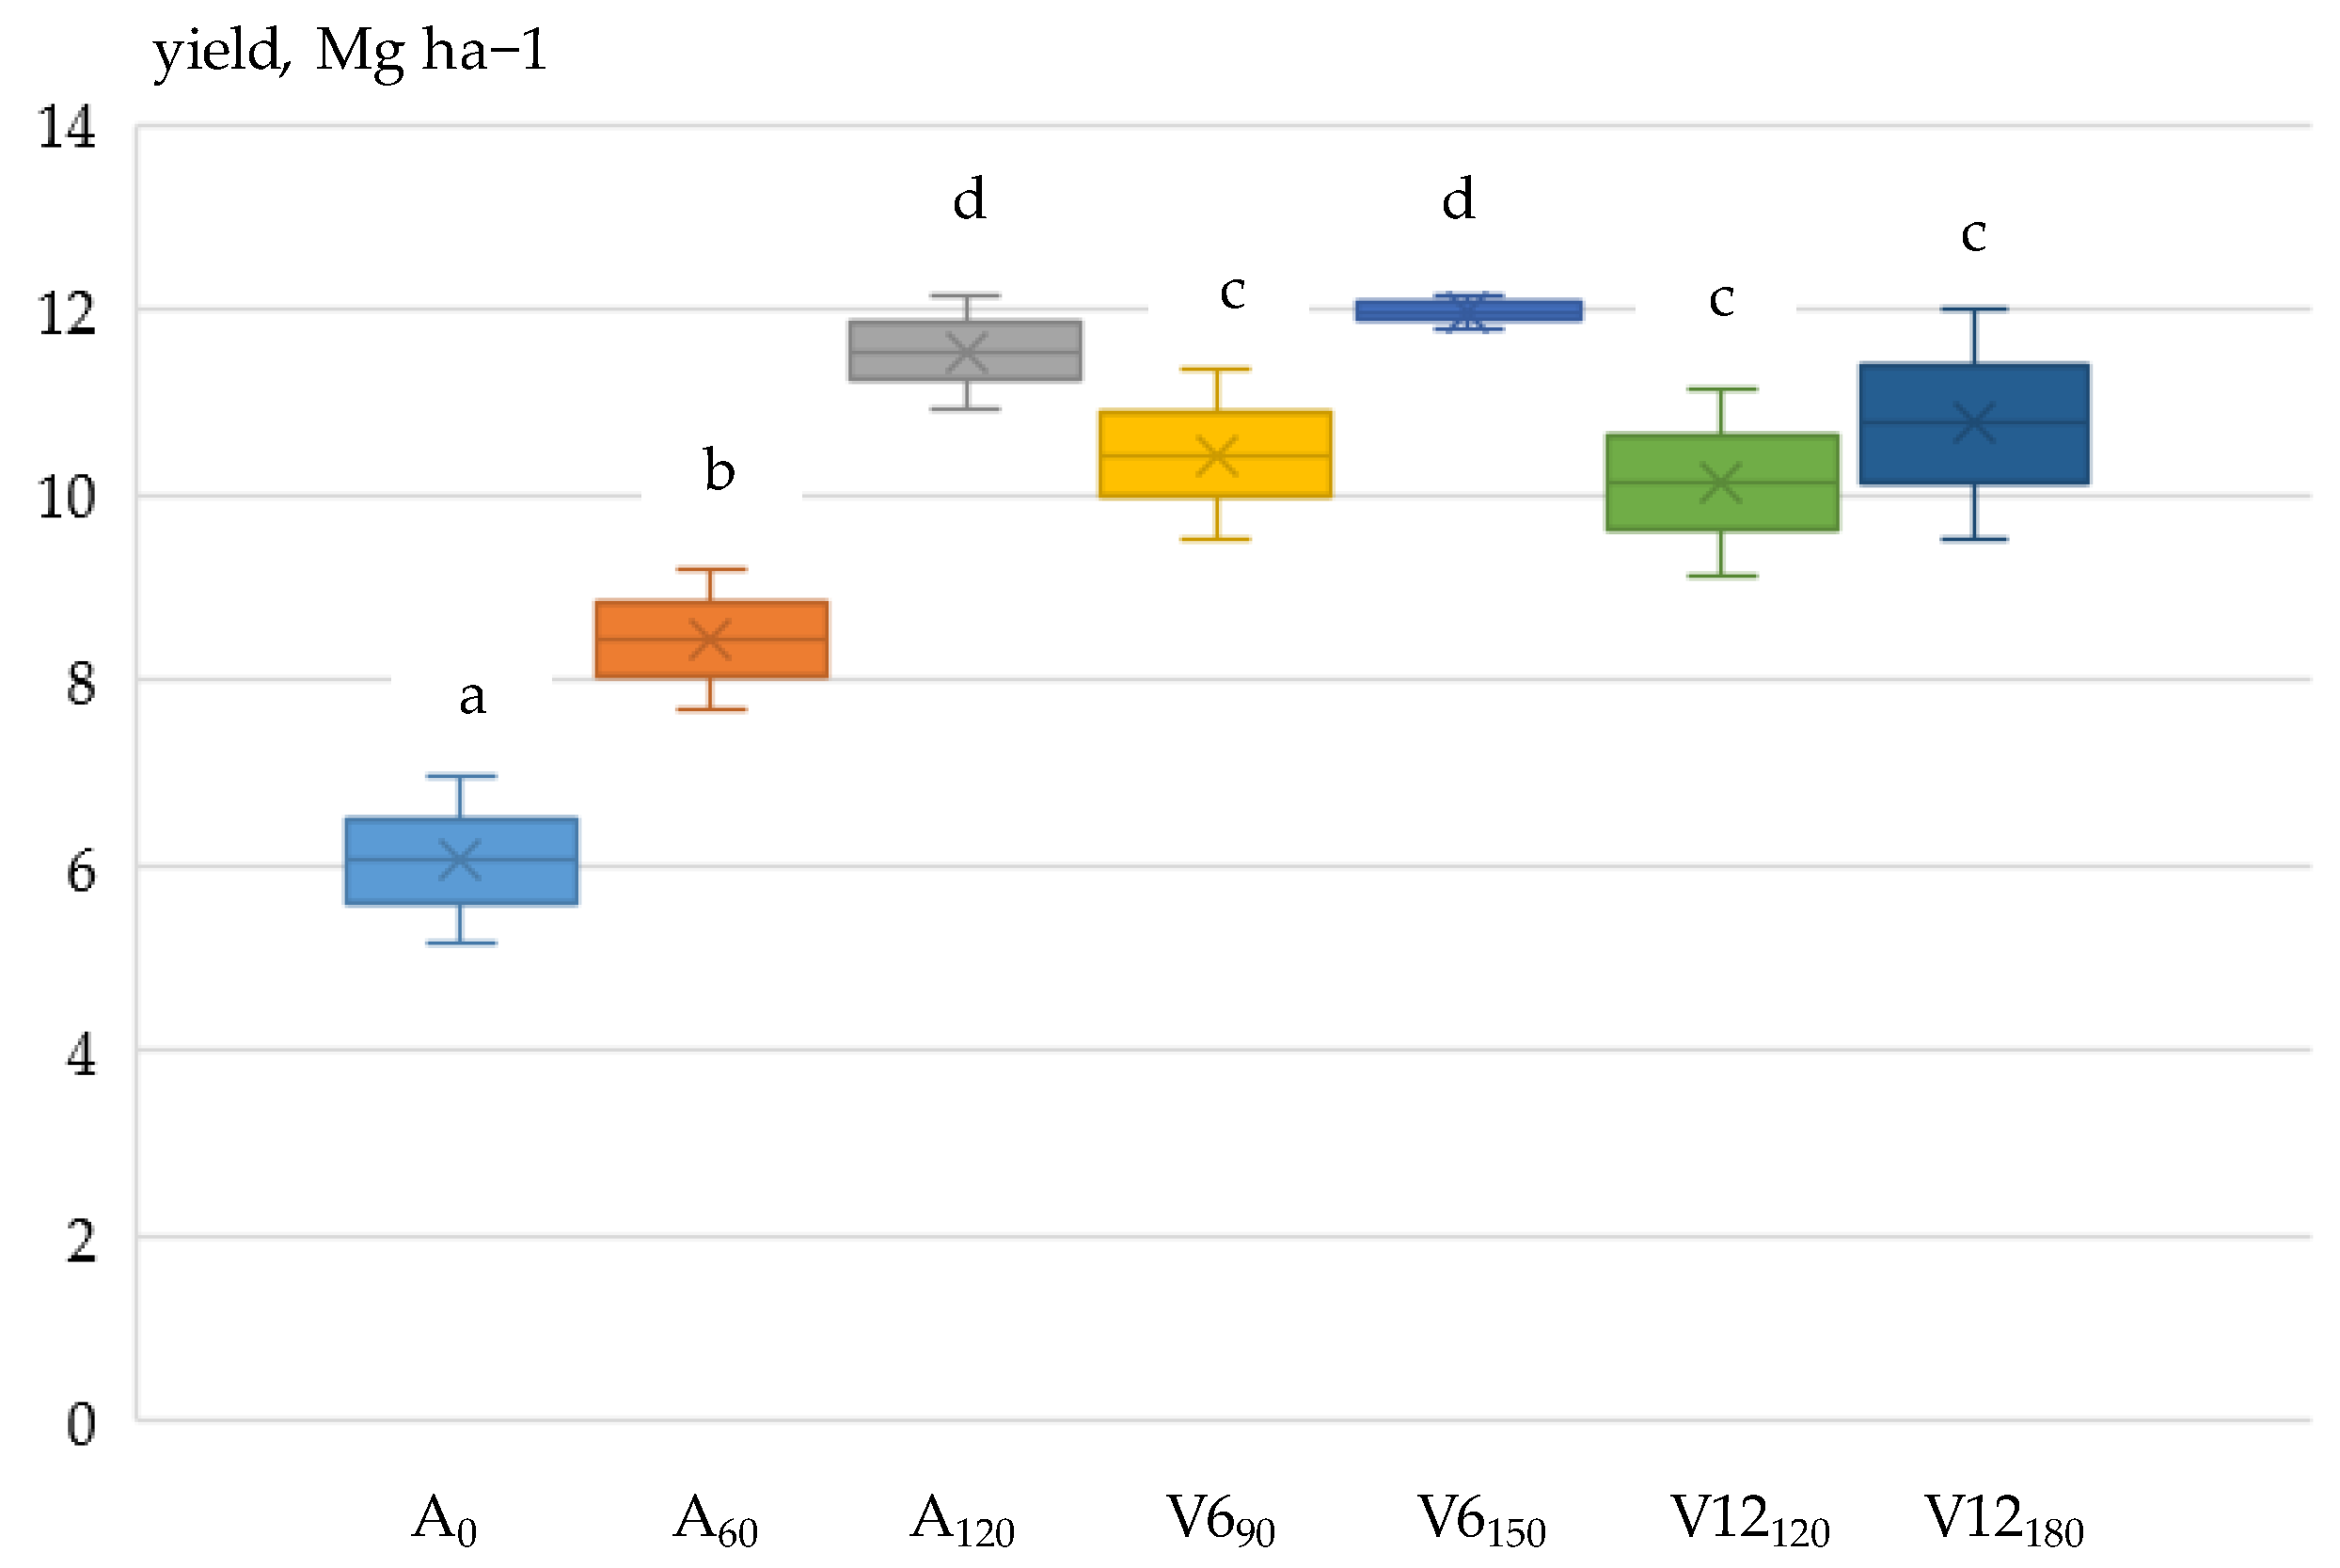
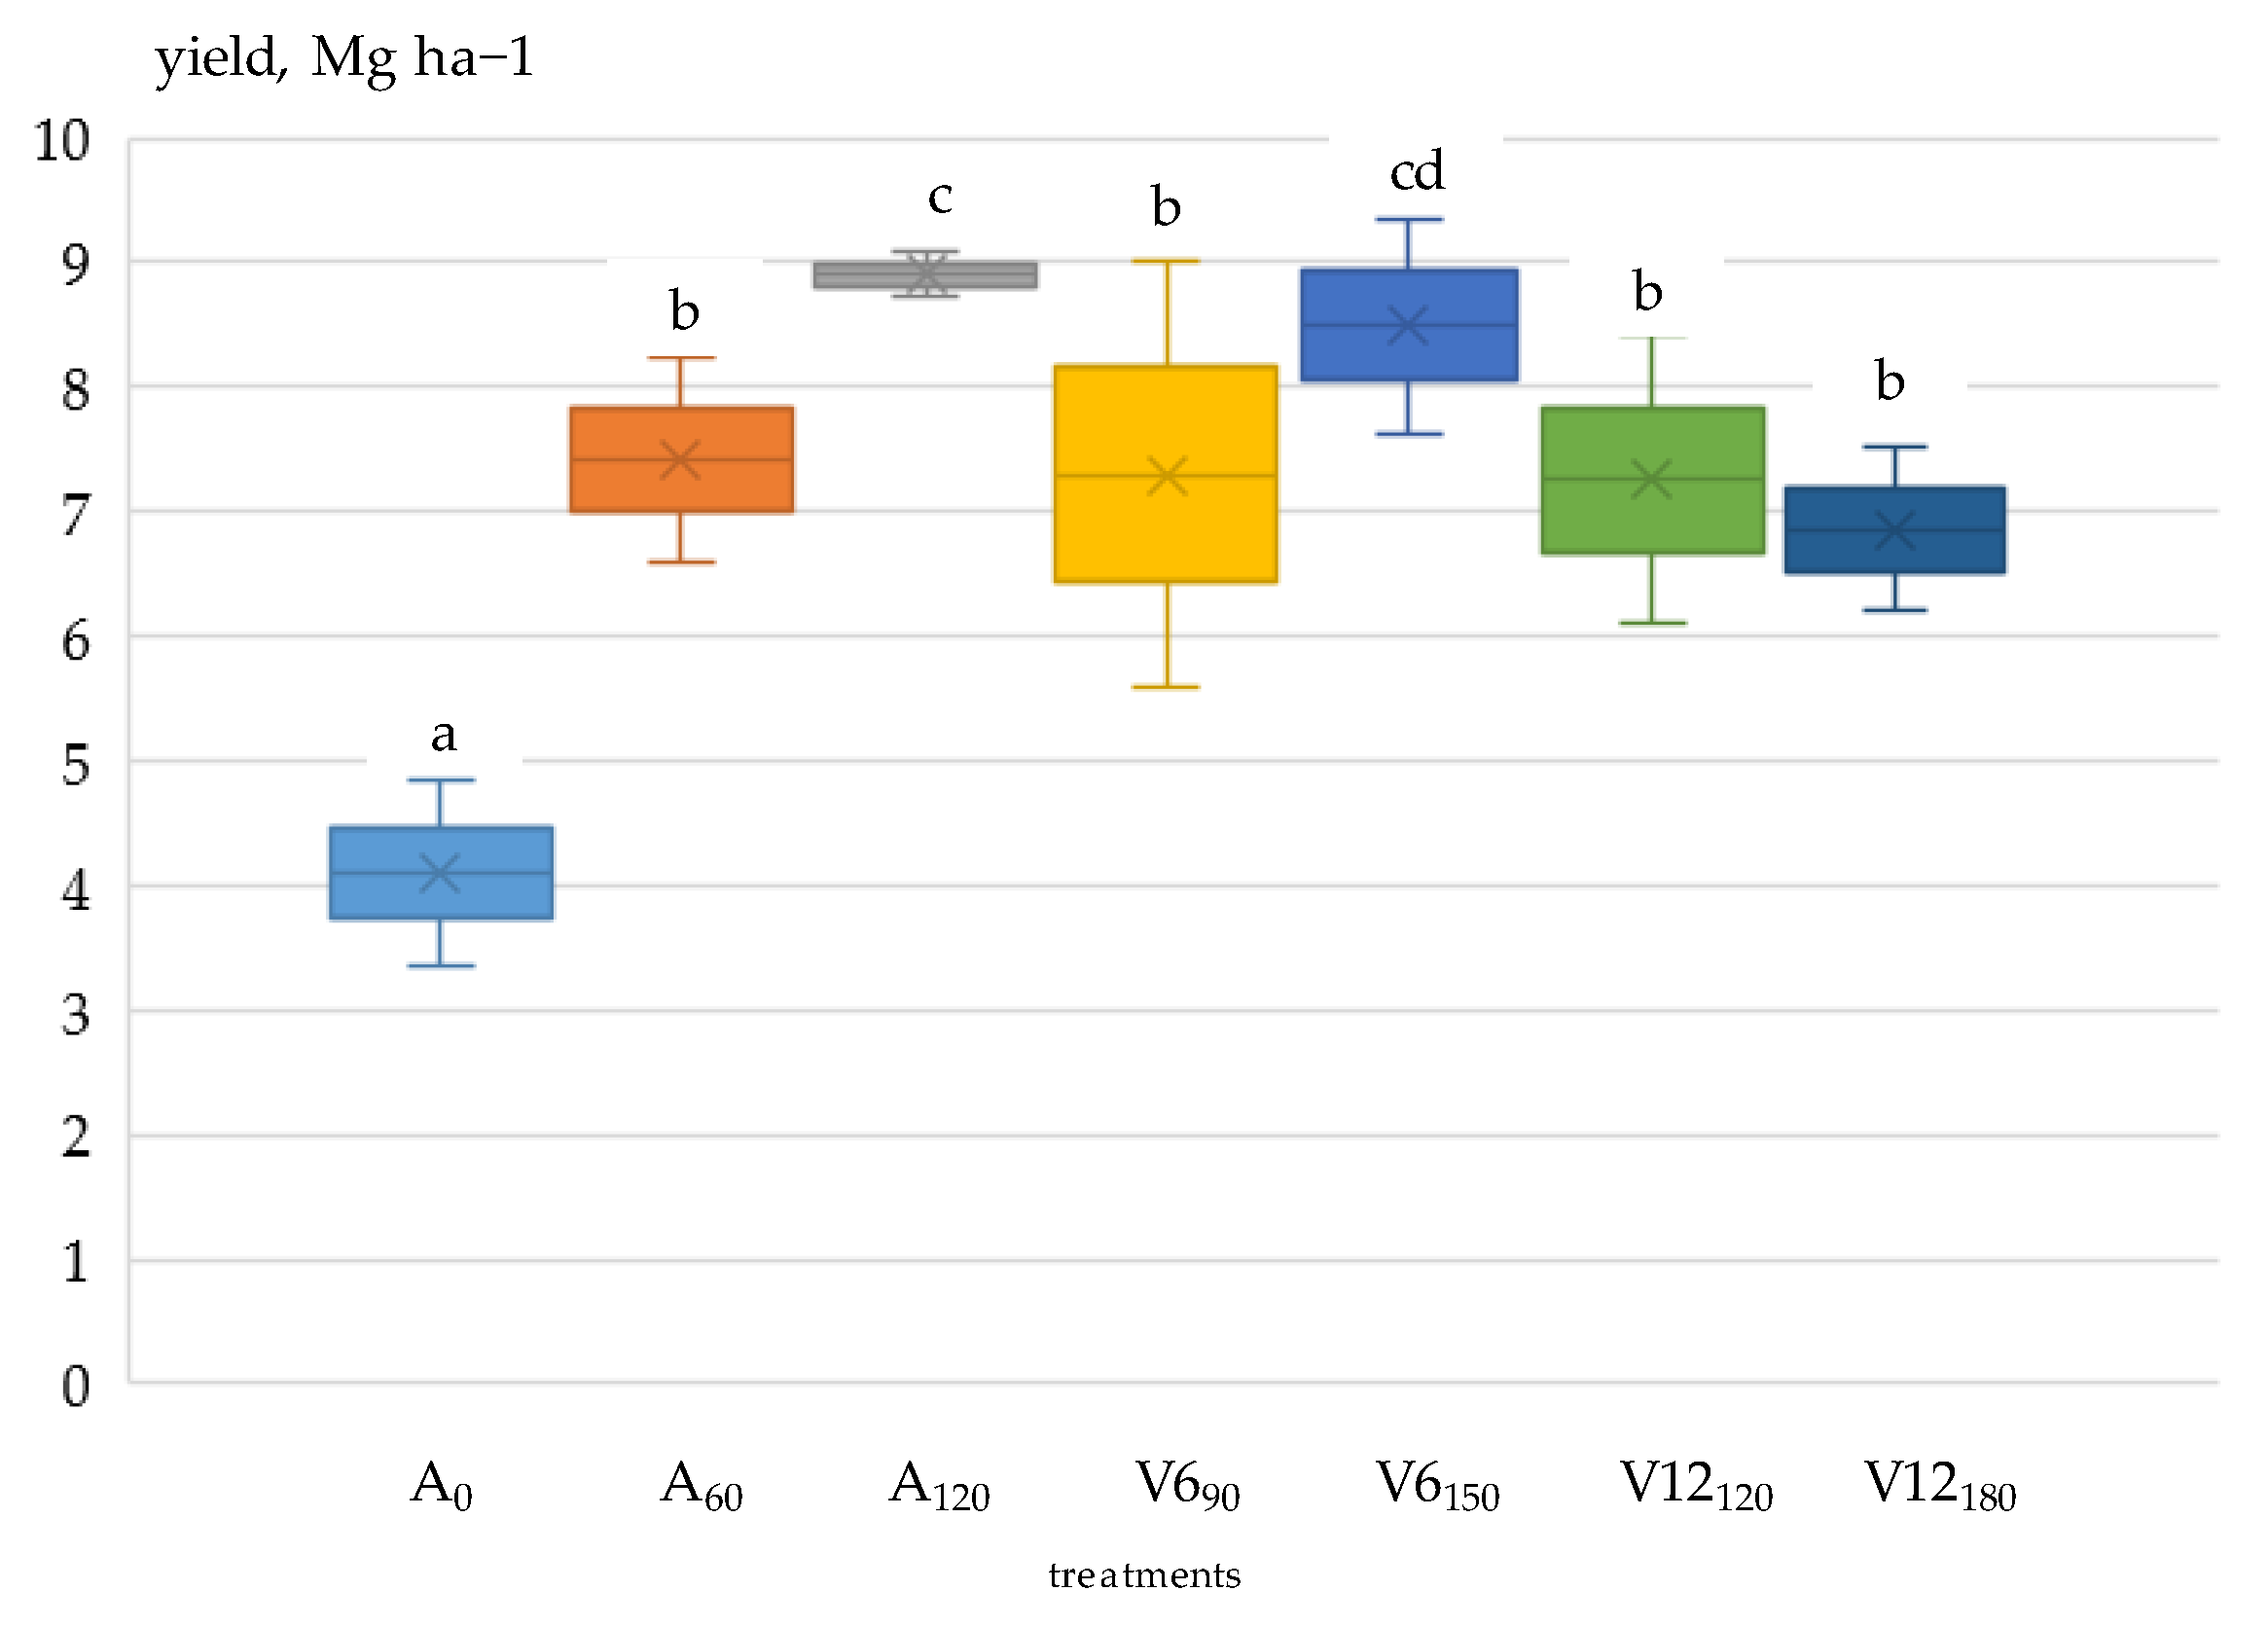
In this study, the authors investigated the interaction of phenophase, fertiliser, and crop year and the interaction of these factors on the LAI of maize. The pooled analysis of variance (ANOVA) and the yearly performed ANOVA showed that all main factors had an effect (p < 0.001) on maize LAI. The interaction between phenophase and fertiliser application was confirmed in both years (2021 p < 0.05; 2022 p < 0.001).
LAI dynamics of maize plants varied each year and in each fertiliser treatment (Figure 3). Evaluating the fertilizer treatments, it was confirmed that in 2021, except for the V12120 treatment (V12), the maximum LAI was detected in the R1 phenophase (p < 0.05), while in 2022, in all treatments, it was detected in the Vn phenophase (p < 0.05). Then, as the leaves aged, it gradually decreased by the time of the phenophase of physiological maturity (R6). The decrease in LAI was lower in 2021 (41.1%) than in 2022 (50%), confirming the result of [65] that leaf maturity depends on LAI. In both growing seasons (V8-R6), the 120 kg N ha−1 (N120) treatment applied as basal fertilizer had the maximum LAI value (2.48 and 1.73). Compared to the non-fertilized treatment (A0), the LAI increase was 58.0% (p < 0.05) in 2021 and 39.5% (p < 0.05) in 2022 (p < 0.05).
Evaluating the average of two years, the highest LAI value, with the exception of A120 and V12120 treatments, was detected in the Vn phase. In the studied growing period (V8-R6), the A0 treatment had the lowest LAI value (1.41), while in comparison, the highest LAI value (2.10; p < 0.05) was detected in the case of the treatment with 120 kg N ha−1 fertilizer (A120) applied as a base fertilizer, with an increase of 48.9%.
Of the three main factors, ANOVA mean squares (MS) data showed that the crop year had the greatest influence on the LAI of maize leaves. Averaged over the two years, the main mean value of LAI was 1.74, increasing by 14.9% in 2021 and decreasing by 26.5% in 2022. Regarding the phenophases, LAI was lower in all phenophases in 2022, but this difference was not significant in the V10, Vn and VT development stages. The largest difference (1.57) was detected in the silking (R1) period (p < 0.001). The LAI-reducing effect of the extremely dry year was reliably detected in all treatments except A60. The largest differences were observed for the effects of the V12120 (0.88; p < 0.05) and V12180 (0.72; p < 0.01) top-dressing treatments.

3.3. Grain Yield

The pooled results of ANOVA showed that maize grain yield was influenced by two main factors, year (p < 0.001) and fertiliser application (p < 0.001), with the effect of crop year being more significant. Of the interactions, year x fertilisation was significant (p < 0.001); i.e., grain yield was differently affected by year and fertilisation. A significant (p < 0.001) effect of fertiliser application on grain yield was also found in the analysis of variance performed each year.
Yield loss depends on the development period of the crop and the length of the dry period [66,67,68]. The dry period around R1 (silking) is the most sensitive period for maize [69,70,71], which is confirmed by the authors’ own results. Between the V6 and V12 phenophases in 2021, only 10 mm of precipitation fell, and from the V12 phenophase to the R1 (silking) period, 18 mm of precipitation was recorded. The drought in 2021 continued in 2022. Between phenophases V6 and V12, 19 mm of precipitation fell, while between V12 and R1, there was no precipitation.
In both years, due to dry conditions, nitrogen applied in the V6 and V12 phenophases resulted in lower grain yields (2021:10.830 Mg ha−1; 2022:7.476 Mg ha−1) than a single pre-sowing application (120 kg N ha−1) of nitrogen (p < 0.001), demonstrating the importance of matching water and nitrogen supply levels [72,73,74,75]. Compared to the non-fertilised (A0) treatment (2021: 6.056 Mg ha−1; 2022: 4.101 Mg ha−1), the A120 fertiliser treatment resulted in a 90.7% yield increase in 2021 and 117% in 2022 (Figure 4 and Figure 5).
In 2022, due to a more severe drought, the yield reduction was shown at all nutrient levels (p < 0.001) compared to 2021. In the non-fertilised (A0) and the V690 and V12180 top-dressing treatments, the rate of reduction exceeded 30%. The highest yield reduction was 36.3% in the V12180 treatment, while the lowest was 12.1% in the 60 kg N ha−1 treatment applied before sowing (A60).

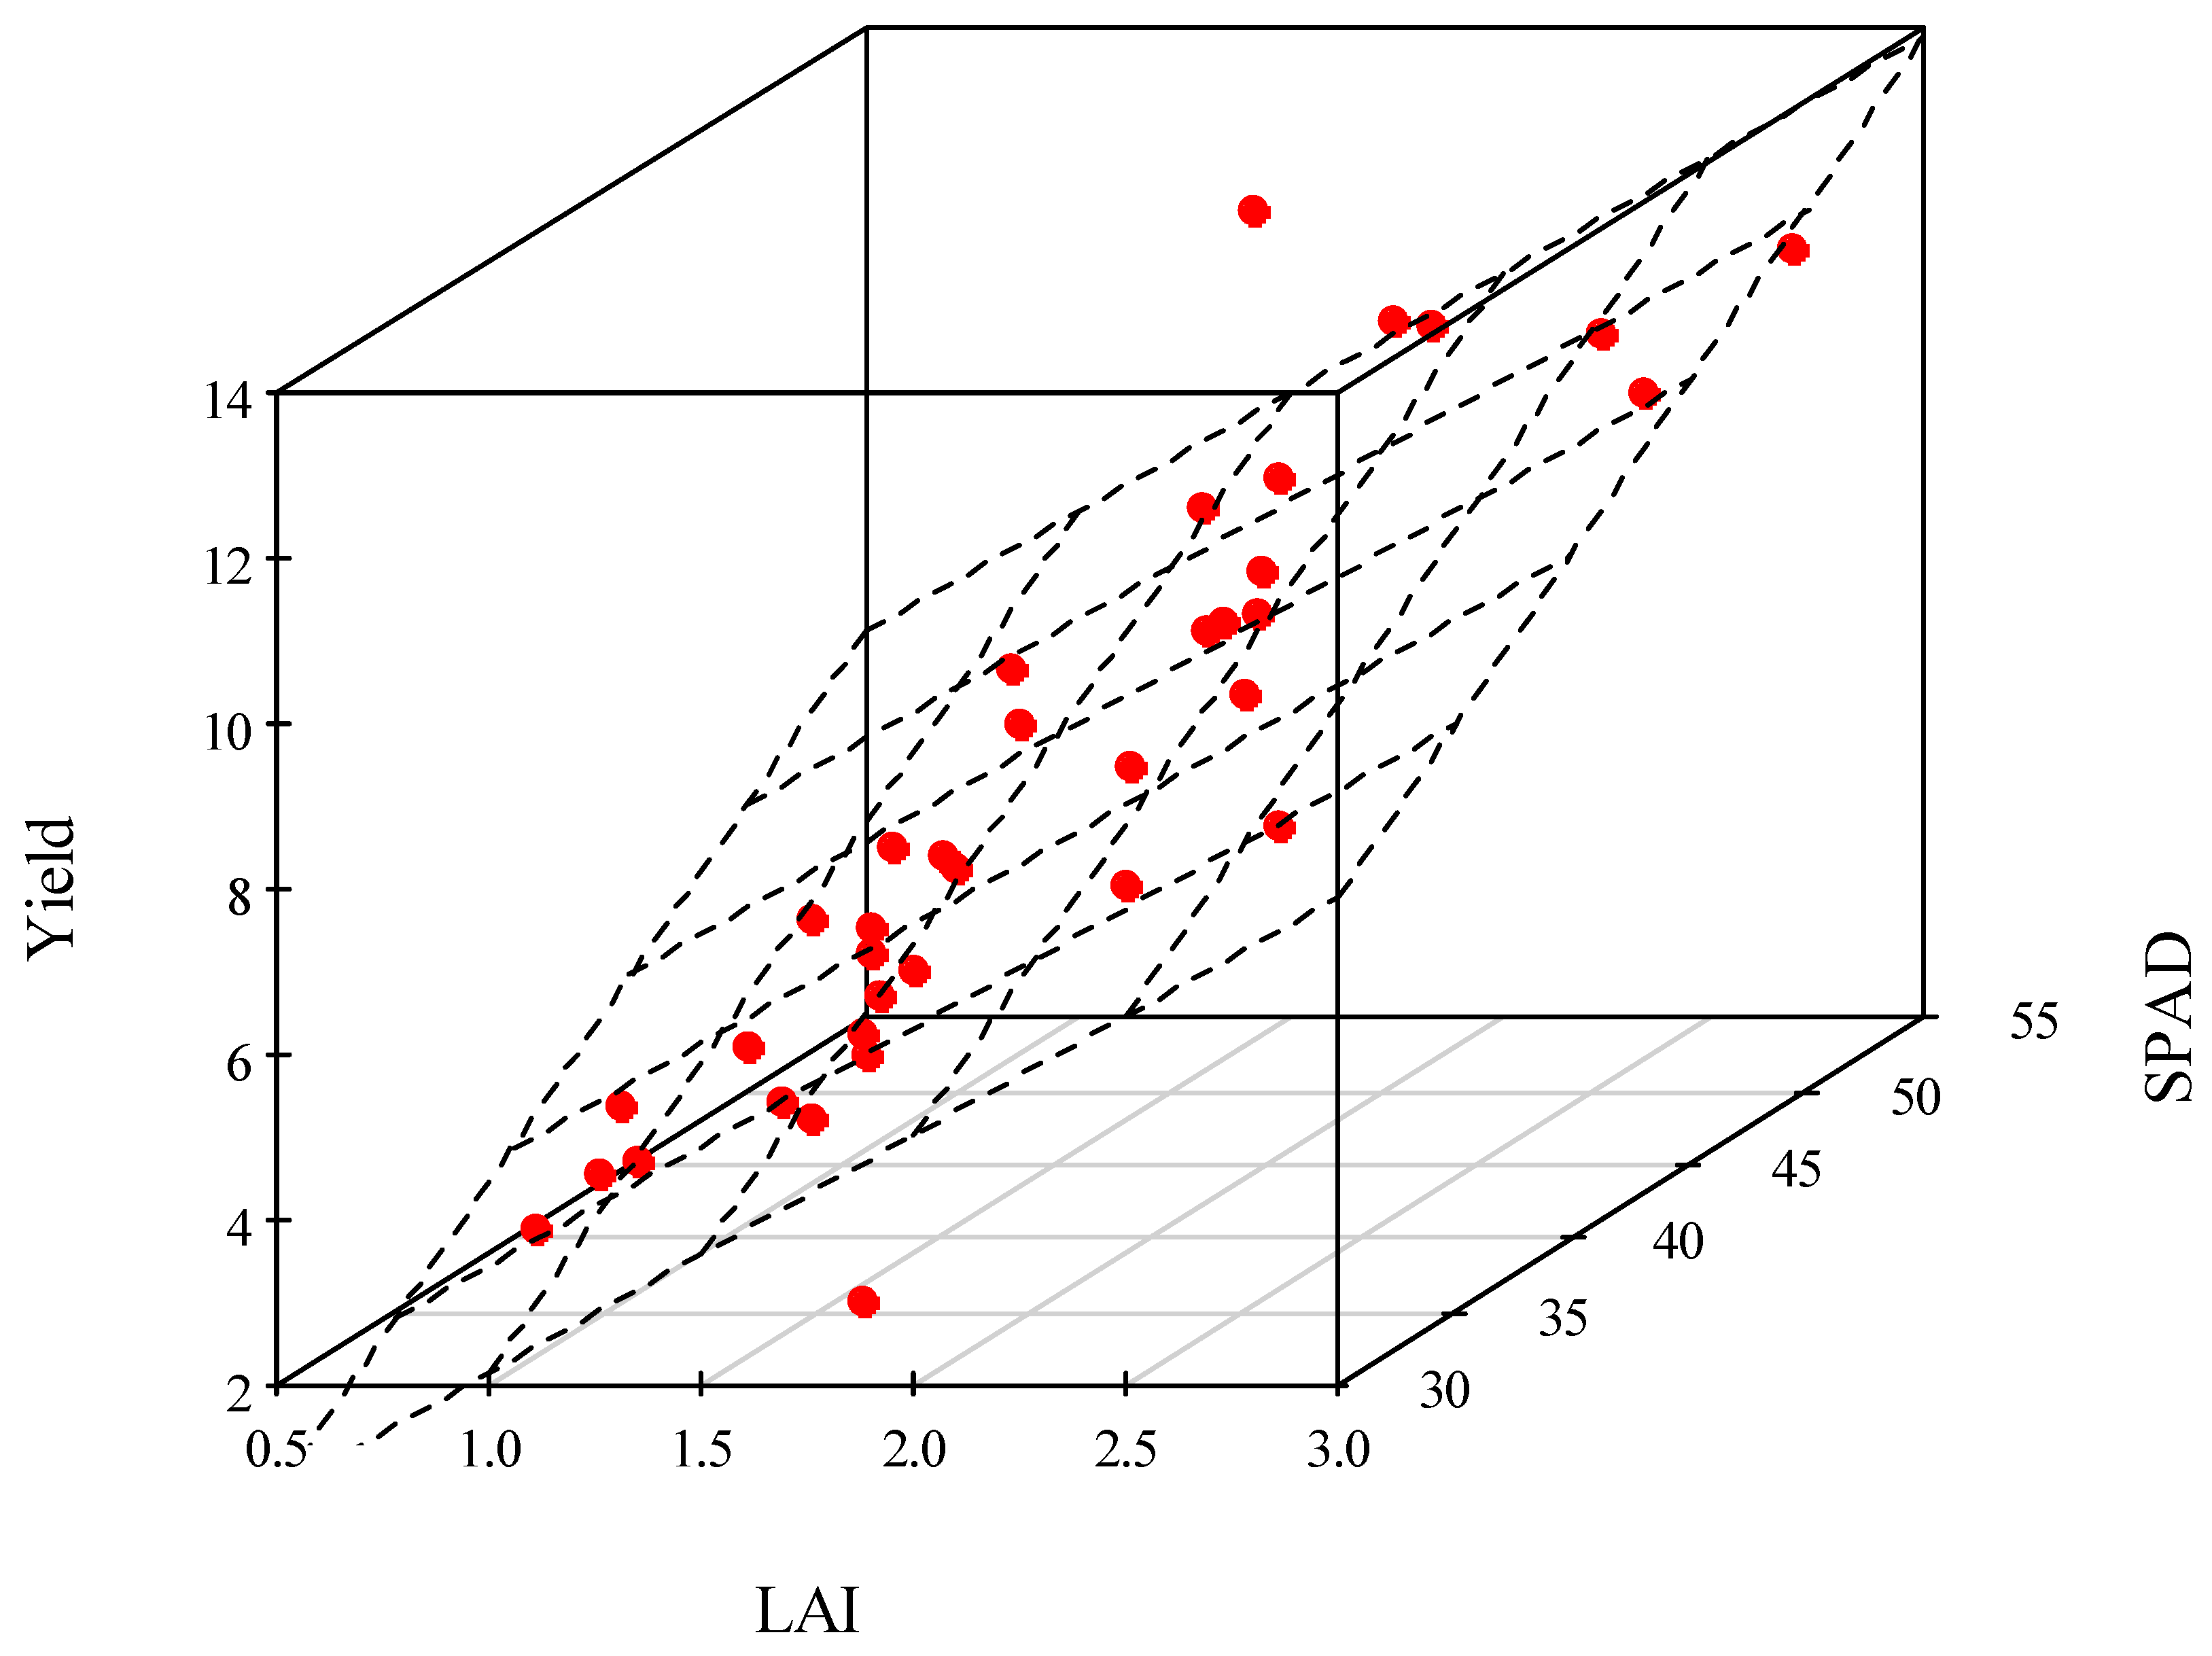
3.4. Correlation Analysis

Several studies confirm the correlation between chlorophyll concentration and nitrogen [76,77,78,79,80]. When examining the correlation between SPAD and yield, the best fit was obtained for the R3 phenophase (R2 = 0.716) (Table 1). In the R6 phase, on the other hand, this relationship virtually disappears. The analysis shows that from the V8 phenophase, the correlation becomes stronger until the R3 phase (Figure 6). The obtained results confirm the research of [81] that the longer maize remains green and photosynthesis is uninterrupted the higher the yield.
Analysis of the correlation between LAI and yield showed a significant positive correlation, which is in agreement with the findings of several researchers [82,83,84,85]. The closest correlation was found in the VT phenophase (R2 = 0.627) in contrast to the findings of [86] who found the closest correlation in the R1 phenophase in their experiment. After the VT phase, the relationship between LAI and yield decreased (Figure 7).
Since the SPAD value is related to chlorophyll concentration, it is not by itself an appropriate indicator of the amount of organic matter incorporation. It is necessary to know the surface area that is carrying out photosynthesis, i.e., LAI. The largest amount of biomass is obtained when the values of SPAD and LAI are as high as possible. To assess the combined effect of SPAD and LAI, an estimator model was developed. The estimator model was constructed with Occam’s principle in mind. With few parameters, we aimed to obtain a yield prediction with reasonable accuracy at the earliest possible phenophase. After plotting the measured data, the correlation between SPAD and yield and LAI and yield was found to be linear. By including both explanatory variables in the model, a regression plane was obtained, the parameters of which were estimated using a multiple linear regression model. On the basis of the measurements carried out, analysing the joint effect of SPAD and LAI on yield, the closest correlation was obtained in the VT phenophase (R2 = 0.762). The average error of the function fit is ±1.4 Mg ha−1. The goodness of fit is only slightly smaller in the Vn phase.
The multiple linear regression model estimates the expected yield in the VT phase with appropriate accuracy.
The estimation model in the VT phenophase (Figure 8):
Yield (Mg ha−1) = −7.87 + 2.88 × LAI + 0.24 × SPAD

4. Discussion

Climate change will affect all regions of the world. There will be areas where precipitation will increase or decrease and evapotranspiration rates will increase, resulting in increased drought [87,88,89]. This means that drought and severe water shortages will negatively affect nutrient uptake [75,90,91], which is one of the causes of yield losses.
Relative chlorophyll content (SPAD) and leaf area index (LAI) provide important information on the nutritional status of plants. Monitoring these indicators is crucial for nutrient replenishment, yield and yield prediction in precision agriculture [42,92,93].
The SPAD value was highest in all fertiliser treatments, averaged over the two dry years, at the early vegetative development stage (V8–V10). Due to drought, chlorophyll degradation and leaf senescence started [94,95,96], then gradually decreased and reached its lowest value at phenophase R6. In 2021, due to the performed top-dressing fertilisation treatments, it gradually increased with the progression of the phenophases and reached its maximum value at the early reproductive stage (R1–R3), which was followed by a decrease (35.9–39.2). In the extreme drought year of 2022, SPAD values for all nutrient levels except treatment A60 were at their maximum at the V8 development stage; then, they gradually decreased and showed a minimum value (10.0–11.8) for the R6 phenophase. In these two dry years, with two exceptions (treatments V6150 and V12180 in 2021), the relative chlorophyll content (SPAD) did not reach the maximum range of 52–56 SPAD values recommended by [36].
The annual analysis showed that in both years, treatment A0 resulted in the lowest SPAD value. The obtained results confirmed the findings of [90,97] that drought reduces chlorophyll concentration in maize leaves, thereby reducing nitrogen concentration. Of the two dry years with slightly more rainfall and better rainfall distribution (2021), the top dressing (V6150) had an increasing effect on SPAD, while in the severe drought year (2022), the lowest dose rate of the basal treatment (A60) had an increasing effect on SPAD.
The leaf area index (LAI) was differently affected by water (precipitation) and fertiliser in the studied dry and extreme dry years. The LAI response to water deficit was smaller in 2022 than in 2021. Water deficit reduced LAI to different extents, which was similar to the results of [98]. Due to water deficit, the optimal maximum leaf area index of maize, which is 4.1–5.9 in Hungary, could not be reached in any year due to fertilisation [99,100]. Top-dressing application did not increase LAI; the basic 120 kg N ha−1 treatment (A120) provided the maximum LAI value. The results obtained confirmed the finding [101] that low LAI, indicative of low solar energy use efficiency, is dependent on nitrogen availability [42,102], and low grain yield can be expected as a result.
Water shortages were significant in both years at critical phenophases and throughout the growing season. At 120 kg N ha−1 (A120), the basal fertiliser provided the highest grain yield, while drought stress inhibited further N uptake applied as top dressing in a similar manner [90], leading to grain yield reduction. Water shortages were even more severe in 2022 than in 2021, causing yield reductions of more than 30% in the non-fertilised and top dressing treatments, which was consistent with the results of [103]. This result confirms previous research [104] that further increases in nitrogen fertiliser did not alleviate drought stress.
The timely estimation of SPAD and LAI values is of great importance in precision agriculture. The applied Soil and Plant Analysis Development (SPAD) and SunScan canopy analysis system have been found to be suitable for yield prediction, similarly to several researchers [105,106,107]. We agree with the findings of researchers that the measurements are time consuming, labour intensive and not suitable for large area measurements. The future lies in remote sensing by unmanned aerial vehicles (UAV) as opposed to manual sensors. UAV technology has several advantages, such as fast data acquisition, it is less affected by weather, and it has high spatial and temporal resolution. It has the disadvantages of high investment cost (its professional use requires expertise (training or hiring an expert), which is costly) and short flight time [105,106,107].
Due to the simplicity of our model, it is well applicable in practice, as only SPAD and LAI values are required and an accurate estimate of the yield for a given year can be provided already at the VT stage. A limitation of the model may be the need to have measuring instruments with sufficient accuracy to continuously monitor the development of maize and to have sufficient measurements in the VT phase to make a reliable forecast.

5. Conclusions

Drought stress significantly reduced SPAD and LAI values, and chlorophyll decomposition and leaf senescence started already in the late vegetative stage; it also inhibited the uptake of N applied as top dressing. In dry years, 120 kg N ha−1 applied as a basal fertiliser proved to be the economically optimal fertiliser rate. The most accurate prediction of maize yield was in R3 (R2 = 0.716) in the case of SPAD and VT (R2 = 0.627) in the case of LAI. The combination of SPAD and LAI within the introduced model provided the most accurate yield prediction (VT, R2 = 0.762), which was non-destructive and cost-effective even in dry and extreme dry years. The combined use of the sensors allows farmers to plan their farming in a controlled way and to react in a timely manner to detected problems. Furthermore, it is assumed that by adapting UAV and handheld sensors together, crop growth monitoring and yield forecasting can be further refined; also, further research is required to validate and develop this method.

Author Contributions

Conceptualization, A.S. and L.H.; Methodology, A.S. and L.H.; Formal analysis, É.H. and P.Z.; Investigation, A.S., É.H., P.Z. and K.S.; Resources, A.S., É.H., P.Z., K.S. and L.H.; Data curation, A.S. and L.H.; writing—original draft preparation, A.S. and L.H., writing—review and editing, A.S., É.H., P.Z., K.S. and L.H.; Visualization, A.S. and L.H.; Supervision, A.S., É.H., P.Z., K.S. and L.H. All authors have read and agreed to the published version of the manuscript.

Funding

Project no. TKP2021-NKTA-32 has been implemented with the support provided by the Ministry of Culture and Innovation of Hungary from the National Research, Development and Innovation Fund, financed under the TKP2021-NKTA funding scheme and also by the János Bolyai Research Scholarship of the Hungarian Academy of Sciences.

Data Availability Statement

All data supporting the conclusions of this article are included in this article.

Conflicts of Interest

The authors declare no conflict of interest.

References

  1. Erenstein, O.; Jaleta, M.; Sonder, K.; Mottaleb, K.; Prasanna, B.M. Global maize production, consumption and trade: Trends and R&D implications. Food Secur. 2022, 14, 1295–1319. [Google Scholar] [CrossRef]
  2. FAO (Food and Agriculture Organization of the United Nation). The Future of Food and Agriculture—Drivers and Triggers for Transformation; The Future of Food and Agriculture: Rome, Italy, 2022. [Google Scholar] [CrossRef]
  3. KSH (Hungarian Central Statistical Office). 2022. Available online: https://www.ksh.hu/stadat?lang=hu&theme=mez (accessed on 1 January 2023).
  4. OMSZ (The Hungarian Meteorological Service). 2020. Available online: https://www.met.hu/eghajlat/magyarorszag_eghajlata/eghajlati_adatsorok/Debrecen/adatok/napi_adatok/index.php (accessed on 17 April 2022).
  5. Bihari, Z.; Babolcsai, G.; Bartholy, J.; Ferenczi, Z.; Gerhátné Kerényi, J.; Haszpra, L.; Homokiné Ujváry, K.; Kovács, T.; Lakatos, M.; Németh, Á.; et al. Éghajlat. In Magyarország Nemzeti Atlasza 2. Kötet; Kocsis, K., Horváth, G., Keresztesi, Z., Nemerkényi, Z., Eds.; Természeti környezet; MTA CSFK Földrajztudományi Intézet: Budapest, Hungary, 2018; pp. 58–69. [Google Scholar]
  6. Seleiman, M.F.; Al-Suhaibani, N.; Ali, N.; Akmal, M.; Alotaibi, M.; Refay, Y.; Dindaroglu, T.; Abdul-Wajid, H.H.; Battaglia, M.L. Drought Stress Impacts on Plants and Different Approaches to Alleviate Its Adverse Effects. Plants 2021, 10, 259. [Google Scholar] [CrossRef] [PubMed]
  7. Sheoran, S.; Kaur, Y.; Kumar, S.; Shukla, S.; Rakshit, S.; Kumar, R. Recent Advances for Drought Stress Tolerance in Maize (Zea mays L.): Present Status and Future Prospects. Front. Plant Sci. 2022, 13, 872566. [Google Scholar] [CrossRef]
  8. Zhang, F.; Zhou, G. Estimation of vegetation water content using hyperspectral vegetation indices: A comparison of crop water indicators in response to water stress treatments for summer maize. BMC Ecol. 2019, 19, 18. [Google Scholar] [CrossRef] [PubMed]
  9. Li, L.; Lin, D.; Wang, J.; Yang, L.; Wang, Y. Multivariate Analysis Models Based on Full Spectra Range and Effective Wavelengths Using Different Transformation Techniques for Rapid Estimation of Leaf Nitrogen Concentration in Winter Wheat. Front. Plant Sci. 2020, 11, 755. [Google Scholar] [CrossRef]
  10. Ahmad, S.; Wang, G.Y.; Muhammad, I.; Chi, Y.X.; Zeeshan, M.; Nasar, J.; Zhou, X.B. Interactive Effects of Melatonin and Nitrogen Improve Drought Tolerance of Maize Seedlings by Regulating Growth and Physiochemical Attributes. Antioxidants 2022, 11, 359. [Google Scholar] [CrossRef]
  11. Barnabás, B.; Jäger, K.; Fehér, A. The effect of drought and heat stress on reproductive processes in cereals. Plant Cell Environ. 2008, 31, 11–38. [Google Scholar] [CrossRef] [PubMed]
  12. Gong, F.; Yang, L.; Tai, F.; Hu, X.; Wang, W. “Omics” of maize stress response for sustainable food production: Opportunities and challenges. Omics J. Integr. Biol. 2014, 18, 714–732. [Google Scholar] [CrossRef]
  13. Bhat, M.A.; Kumar, V.; Bhat, M.A.; Wani, I.A.; Dar, F.L.; Farooq, I.; Bhatti, F.; Koser, R.; Rahman, S.; Jan, A.T. Mechanistic Insights of the Interaction of Plant Growth-Promoting Rhizobacteria (PGPR) With Plant Roots Toward Enhancing Plant Productivity by Alleviating Salinity Stress. Front. Microbiol. 2020, 11, 1952. [Google Scholar] [CrossRef] [PubMed]
  14. Grant, R.F.; Jackson, B.S.; Kiniry, J.R.; Arkin, G.F. Water deficit timing effects on yield components in maize. Agron. J. 1989, 81, 61–65. [Google Scholar] [CrossRef]
  15. Ahmad, N.; Malagoli, M.; Wirtz, M.; Hell, R. Drought stress in maize causes differential acclimation responses of glutathione and sulfur metabolism in leaves and roots. BMC Plant Biol. 2016, 16, 247. [Google Scholar] [CrossRef] [PubMed]
  16. Zhu, P.; Jin, Z.N.; Zhuang, Q.L.; Ciais, P.; Bernacchi, C.; Wang, X.H.; Makowski, D.; Lobell, D. The important but weakening maize yield benefit of grain filling prolongation in the US Midwest. Glob. Chang. Boil. 2018, 24, 4718–4730. [Google Scholar] [CrossRef]
  17. Mimić, G.; Brdar, S.; Brkić, M.; Panić, M.; Marko, O.; Crnojević, V. Engineering Meteorological Features to Select Stress Tolerant Hybrids in Maize. Sci. Rep. 2020, 10, 3421. [Google Scholar] [CrossRef]
  18. Salgado-Aguilar, M.; Molnar, T.; Pons-Hernández, J.L.; Covarrubias-Prieto, J.; Ramírez-Pimentel, J.G.; Raya-Pérez, J.C.; Iturriaga, G. Physiological and biochemical analyses of novel drought-tolerant maize lines reveal osmoprotectant accumulation at silking stage. Chil. J. Agric. Res. 2020, 80, 241–252. [Google Scholar] [CrossRef]
  19. Krell, N.T.; Morgan, B.E.; Gower, D.; Caylor, K.K. Consequences of dryland maize planting decisions under increased seasonal rainfall variability. Water Resour. Res. 2021, 57, e2020WR029362. [Google Scholar] [CrossRef]
  20. Sah, R.P.; Chakraborty, M.; Prasad, K.; Pandit, M.; Tudu, V.K.; Chakravarty, M.K.; Narayan, S.C.; Rana, M.; Moharana, D. Impact of water deficit stress in maize: Phenology and yield components. Sci. Rep. 2020, 10, 1–5. [Google Scholar] [CrossRef]
  21. Ványiné Széles, A.; Megyes, A.; Nagy, J. Irrigation and nitrogen effects on the leaf chlorophyll content and grain yield of maize in different crop years. Agric. Water Manag. 2012, 107, 133–144. [Google Scholar] [CrossRef]
  22. Kalaji, H.M.; Dabrowski, P.; Cetner, M.D.; Samborska, I.A.; Lukasik, I.; Brestic, M.; Zivcak, M.; Tomasz, H.; Mojski, J.; Kociel, H.; et al. A comparison between different chlorophyll content meters under nutrient deficiency conditions. J. Plant Nutr. 2017, 40, 1024–1034. [Google Scholar] [CrossRef]
  23. Zhao, B.; Ata-Ul-Karim, S.T.; Duan, A.; Liu, Z.; Wang, X.; Xiao, J.; Liu, Z.; Qin, A.; Ning, D.; Zhang, W.; et al. Determination of critical nitrogen concentration and dilution curve based on leaf area index for summer maize. Field Crops Res. 2018, 228, 195–203. [Google Scholar] [CrossRef]
  24. Liang, L.; Geng, D.; Yan, J.; Qiu, S.; Di, L.; Wang, S.; Xu, L.; Wang, L.; Kang, J.; Li, L. Estimating Crop LAI Using Spectral Feature Extraction and the Hybrid Inversion Method. Remote Sens. 2020, 12, 3534. [Google Scholar] [CrossRef]
  25. Davies, B.; Coulter, J.A.; Pagliari, P.H. Timing and rate of nitrogen fertilization influence maize yield and nitrogen use efficiency. PLoS ONE 2020, 15, e0233674. [Google Scholar] [CrossRef]
  26. Gheith, E.M.S.; El-Badry, O.Z.; Lamlom, S.F.; Ali, H.M.; Siddiqui, M.H.; Ghareeb, R.Y.; El-Sheikh, M.H.; Jebril, J.; Abdelsalam, N.R.; Kandil, E.E. Maize (Zea mays L.) Productivity and Nitrogen Use Efficiency in Response to Nitrogen Application Levels and Time. Front. Plant Sci. 2022, 13, 941343. [Google Scholar] [CrossRef]
  27. Xu, K.; Chai, Q.; Hu, F.; Fan, Z.; Yin, W. N-fertilizer postponing application improves dry matter translocation and increases system productivity of wheat/maize intercropping. Sci. Rep. 2021, 11, 22825. [Google Scholar] [CrossRef] [PubMed]
  28. Hammad, H.M.; Ahmad, A.; Wajid, A.; Akhter, J. Maize response to time and rate of nitrogen application. Pak. J. Bot. 2011, 43, 1935–1942. [Google Scholar]
  29. Walling, E.; Vaneeckhaute, C. Greenhouse gas emissions from inorganic and organic fertilizer production and use: A review of emission factors and their variability. J. Environ. Manag. 2020, 276, 111211. [Google Scholar] [CrossRef] [PubMed]
  30. Kizilgeci, F.; Yildirim, M.; Islam, M.S.; Ratnasekera, D.; Iqbal, M.A.; Sabagh, A.E. Normalized Difference Vegetation Index and Chlorophyll Content for Precision Nitrogen Management in Durum Wheat Cultivars under Semi-Arid Conditions. Sustainability 2021, 13, 3725. [Google Scholar] [CrossRef]
  31. Nosheen, S.; Ajmal, I.; Song, Y. Microbes as biofertilizers, a potential approach for sustainable crop production. Sustainability 2021, 13, 1868. [Google Scholar] [CrossRef]
  32. Saberioon, M.M.; Amin, M.S.M.; Anuar, A.R.; Gholizadeh, A.; Wayayok, A. Assessment of rice leaf chlorophyll content using visible bands at different growth stages at both the leaf and canopy scale. Int. J. Appl. Earth Obs. Geoinf. 2014, 32, 35–45. [Google Scholar] [CrossRef]
  33. Zhao, G.; Miao, Y.; Wang, H.; Su, M.; Fan, M.; Zhang, F.; Jiang, R.; Zhang, Z.; Liu, C.; Liu, P.; et al. A preliminary precision rice management system for increasing both grain yield and nitrogen use efficiency. Field Crops Res. 2013, 154, 10–23. [Google Scholar] [CrossRef]
  34. Sun, X.; Yang, Z.; Su, P.; Wei, K.; Wang, Z.; Yang, C.; Wang, C.; Qin, M.; Xiao, L.; Yang, W.; et al. Non-destructive monitoring of maize LAI by fusing UAV spectral and textural features. Front. Plant Sci. 2023, 14, 1158837. [Google Scholar] [CrossRef] [PubMed]
  35. Huang, J.; Gómez-Dans, J.L.; Huang, H.; Ma, H.; Wu, Q.; Lewis, P.E.; Liang, S.; Chen, Z.; Xue, J.H.; Wu, Y.; et al. Assimilation of remote sensing into crop growth models: Current status and perspectives. Agric. Meteorol. 2019, 276, 107609. [Google Scholar] [CrossRef]
  36. Mateo-Sanchis, A.; Piles, M.; Amorós-López, J.; Muñoz-Marí, J.; Adsuara, J.E.; Moreno-Martínez, Á.; Camps-Valls, G. Learning main drivers of crop progress and failure in Europe with interpretable machine learning. Int. J. Appl. Earth Obs. Geoinf. 2021, 104, 102574. [Google Scholar] [CrossRef]
  37. McMaster, G.S.; Wilhelm, W.W. Growing degree-days: One equation, two interpretations. Agric. Meteorol. 1997, 87, 291–300. [Google Scholar] [CrossRef]
  38. Davidson, H.R.; Campbell, C.A. The effect of temperature, moisture and nitrogen on the rate of development of spring wheat as measured by degree days. Can. J. Plant Sci. 1983, 63, 833–846. [Google Scholar] [CrossRef]
  39. Gallagher, J.N. Field studies of cereal leaf growth: I. Initation and expansion in relation to temperature and ontogeny. J. Exp. Bot. 1979, 30, 625–636. Available online: https://www.jstor.org/stable/23689719 (accessed on 17 April 2022). [CrossRef]
  40. Menyhért, Z. A Kukoricatermesztés Kézikönyve; Mezőgazdasági Kiadó: Budapest, Hungary, 1985. [Google Scholar]
  41. Dwyer, L.M.; Anderson, A.M.; Ma, B.L.; Stewart, D.W.; Tollenaar, M.; Gregorich, E. Quantifying the nonlinearity in chlorophyll meter response to corn leaf nitrogen concentration. Can. J. Plant Sci. 1995, 75, 179–182. [Google Scholar] [CrossRef]
  42. Earl, H.J.; Tollenaar, M. Maize leaf absorptance of photosynthetically active radiation and its estimation using a chlorophyll meter. Crop Sci. 1997, 37, 436–440. [Google Scholar] [CrossRef]
  43. Spitkó, T.; Nagy, Z.; Zsubori, Z.T.; Szőke, C.; Berzy, T.; Pintér, J.; Marton, C.L. Connection between normalized difference vegetation index and yield in maize. Plant Soil Environ. 2016, 62, 293–298. [Google Scholar] [CrossRef]
  44. Konica-Minolta. Chlorophyll Meter SPAD-502 Instruction Manual; Konica Minolta Sensing, Inc.: Plainfield, IL, USA, 1989. [Google Scholar]
  45. Jordan, D.R.; Hunt, C.H.; Cruickshank, A.W.; Borrell, A.K.; Henzell, R.G. The relationship between the stay-green trait and grain yield in elite sorghum hybrids grown in a range of environments. Crop Sci. 2012, 52, 1153–1161. [Google Scholar] [CrossRef]
  46. Gabriel, J.L.; Quemada, M.; Alonso-Ayuso, M.; Lizaso, J.I.; Martín-Lammerding, D. Predicting N status in maize with clip sensors: Choosing sensor, leaf sampling point, and timing. Sensors 2019, 19, 3881. [Google Scholar] [CrossRef]
  47. Costa, C.; Dwyer, L.M.; Dutilleul, P.; Stewart, D.W.; Ma, B.L.; Smith, D.L. Inter-relationships of applied nitrogen, SPAD, and yield of leafy and non-leafy maize genotypes. J. Plant Nutr. 2001, 24, 1173–1194. [Google Scholar] [CrossRef]
  48. Potter, E.; Wood, J.; Nicholl, C. SunScan Canopy Analysis System User Manual SS1-UM-1.05; Delta-T Devices: Cambridge, UK, 1996. [Google Scholar]
  49. R Core Team. A Language and Environment for Statistical Computing; R Foundation for Statistical Computing: Vienna, Austria, 2023; Available online: https://www.R-project.org/ (accessed on 21 March 2023).
  50. Andrade, M.A.F.; Ramos-Cairo, P.A.; Santos, J.L. Water relations and photosynthesis of young coffee plants under two water regimes and different N and K doses. Agrociencia 2015, 49, 153–161. [Google Scholar]
  51. Yordanov, I.; Velikova, V.; Tsonev, T. Plant responses to drought, acclimation, and stress tolerance. Photosynthetica 2000, 38, 171–186. [Google Scholar] [CrossRef]
  52. Sun, J.; Gao, J.; Wang, Z.; Hu, S.; Zhang, F.; Bao, H.; Fan, Y. Maize Canopy Photosynthetic Efficiency, Plant Growth, and Yield Responses to Tillage Depth. Agronomy 2019, 9, 3. [Google Scholar] [CrossRef]
  53. Çakir, R. Effect of water stress at different development stages on vegetative and reproductive growth of corn. Field Crops Res. 2004, 89, 1–16. [Google Scholar] [CrossRef]
  54. Li, Y.; Tao, H.; Zhang, B.; Huang, S.; Wang, P. Timing of Water Deficit Limits Maize Kernel Setting in Association With Changes in the Source-Flow-Sink Relationship. Front. Plant Sci. 2018, 9, 1326. [Google Scholar] [CrossRef]
  55. Guna, A.; Zhang, J.; Tong, S.; Bao, Y.; Han, A.; Li, K. Effect of Climate Change on Maize Yield in the Growing Season: A Case Study of the Songliao Plain Maize Belt. Water 2019, 11, 2108. [Google Scholar] [CrossRef]
  56. Almeida, G.D.; Nair, S.; Borém, A.; Cairns, J.; Trachsel, S.; Ribaut, J.M.; Bänziger, M.; Prasanna, B.M.; Crossa, J.; Babu, R. Molecular mapping across three populations reveals a QTL hotspot region on chromosome 3 for secondary traits associated with drought tolerance in tropical maize. Mol. Breed. 2014, 34, 701–715. [Google Scholar] [CrossRef]
  57. Neiff, N.; Trachsel, S.; Valentinuz, O.R.; Balbi, C.N.; Andrade, F.H. High temperatures around flowering in maize: Effects on photosynthesis and grain yield in three genotypes. Crop Sci. 2016, 56, 2702–2712. [Google Scholar] [CrossRef]
  58. Șimon, A.; Moraru, P.I.; Ceclan, A.; Russu, F.; Chețan, F.; Bărdaș, M.; Popa, A.; Rusu, T.; Pop, A.I.; Bogdan, I. The Impact of Climatic Factors on the Development Stages of Maize Crop in the Transylvanian Plain. Agronomy 2023, 13, 1612. [Google Scholar] [CrossRef]
  59. Di Paolo, E.; Rinaldi, M. Yield response of corn to irrigation and nitrogen fertilization in a Mediterranean environment. Field Crops Res. 2008, 105, 202–210. [Google Scholar] [CrossRef]
  60. Li, S.X.; Wang, Z.H.; Li, S.Q.; Gao, Y.J. Effect of nitrogen fertilization under plastic and non-plastic mulched conditions on water use by maize plants in dryland areas of China. Agric. Water Manag. 2015, 162, 15–32. [Google Scholar] [CrossRef]
  61. Rutkowska, A. Productivity, nitrogen use efficiency and water use efficiency of maize for grain in long term field experiments. Pol. J. Agron. 2019, 37, 11–15. [Google Scholar] [CrossRef]
  62. Plett, D.C.; Ranathunge, K.; Melino, V.J.; Kuya, N.; Uga, Y.; Kronzucker, H.J. The intersection of nitrogen nutrition and water use in plants: New paths toward improved crop productivity. J. Exp. Bot. 2020, 71, 4452–4468. [Google Scholar] [CrossRef]
  63. Schepers, J.S.; Francis, D.D.; Vigil, M.; Below, F.E. Comparison of corn leaf nitrogen concentration and chlorophyll meter readings. Commun. Soil Sci. Plant Anal. 1992, 23, 2173–2187. [Google Scholar] [CrossRef]
  64. Nagy, J. Impact of Fertilization and Irrigation on the Correlation between the Soil Plant Analysis Development Value and Yield of Maize. Commun. Soil Sci. Plant Anal. 2010, 41, 1293–1305. [Google Scholar] [CrossRef]
  65. Rorie, R.L.; Purcell, L.C.; Mozaffari, M.; Karcher, D.E.; King, C.A.; Marsh, M.C.; Longer, D.E. Association of “greenness” in corn with yield and leaf nitrogen concentration. Agron. J. 2011, 103, 529–535. [Google Scholar] [CrossRef]
  66. Ványiné Széles, A.; Nagy, J. Effect of nutrition and water supply on the yield and grain protein content of maize hybrids. Aust. J. Crop Sci. 2012, 6, 290–381. [Google Scholar]
  67. Bai, H.; Purcell, L.C. Evaluation of Soybean Greenness from Ground and Aerial Platforms and the Association with Leaf Nitrogen Concentration in Response to Drought. Crop Sci. 2019, 59, 2763–2773. [Google Scholar] [CrossRef]
  68. Kaler, A.S.; Abdel-Haleem, H.; Fritschi, F.B.; Gillman, J.D.; Ray, J.D.; Smith, J.R.; Purcell, L.C. Genome-wide association mapping of dark green color index using a diverse panel of soybean accessions. Sci. Rep. 2020, 10, 5166. [Google Scholar] [CrossRef]
  69. Tajul, M.I.; Alam, M.M.; Hossain, S.M.; Naher, K.; Rafii, M.Y.; Latif, M.A. Influence of plant population and nitrogen-fertilizer at various levels on growth and growth efficiency of maize. Sci. World J. 2013, 2013, 193018. [Google Scholar] [CrossRef] [PubMed]
  70. Campos-Taberner, M.; García-Haro, F.J.; Camps-Valls, G.; Grau-Muedra, G.; Nutini, F.; Crema, A.; Boschetti, M. Multitemporal and multiresolution leaf area index retrieval for operational local rice crop monitoring. Remote Sens. Environ. 2016, 187, 102–118. [Google Scholar] [CrossRef]
  71. Berdjour, A.; Dugje, I.Y.; Rahman, N.A.; Odoom, D.A.; Kamara, A.Y.; Ajala, S. Direct Estimation of Maize Leaf Area Index as Influenced by Organic and Inorganic Fertilizer Rates in Guinea Savanna. J. Agric. Sci. 2020, 12, 66–76. [Google Scholar] [CrossRef]
  72. Ren, Y.; Li, Q.; Du, X.; Zhang, Y.; Wang, H.; Shi, G.; Wei, M. Analysis of Corn Yield Prediction Potential at Various Growth Phases Using a Process-Based Model and Deep Learning. Plants 2023, 12, 446. [Google Scholar] [CrossRef] [PubMed]
  73. Liu, K.; Wiatrak, P. Corn production and plant characteristics response to N fertilization management in dry-land conventional tillage system. Int. J. Plant Prod. 2012, 5, 405–416. [Google Scholar] [CrossRef]
  74. Kogo, B.K.; Kumar, L.; Koech, R.; Langat, P. Modelling Impacts of Climate Change on Maize (Zea mays L.) Growth and Productivity: A Review of Models, Outputs and Limitations. J. Geosci. Environ. Prot. 2019, 7, 76–95. [Google Scholar] [CrossRef]
  75. Mbaye, M.L.; Sylla, M.B.; Tall, M. Impacts of 1.5 and 2.0 °C Global Warming on Water Balance Components over Senegal in West Africa. Atmosphere 2019, 10, 712. [Google Scholar] [CrossRef]
  76. Adamo, N.; Al-Ansari, N.; Sissakian, V.; Fahmi, K.J.; Abed, S.A. Climate Change: Droughts and Increasing Desertification in the Middle East, with Special Reference to Iraq. Engineering 2022, 14, 235–273. [Google Scholar] [CrossRef]
  77. Bista, D.R.; Heckathorn, S.A.; Jayawardena, D.M.; Mishra, S.; Boldt, J.K. Effects of Drought on Nutrient Uptake and the Levels of Nutrient-Uptake Proteins in Roots of Drought-Sensitive and -Tolerant Grasses. Plants 2018, 7, 28. [Google Scholar] [CrossRef]
  78. Dubey, A.; Kumar, A.; Malla, M.A.; Chowdhary, K.; Singh, G.; Ravikanth, G.; Harish Sharma, S.; Saati-Santamaria, Z.; Menéndez, E.; Dames, J.F. Approaches for the amelioration of adverse effects of drought stress on crop plants. Front. Biosci. 2021, 26, 928–947. [Google Scholar] [CrossRef]
  79. Gitelson, A.A.; Andrés, V.; Arkebauer, T.J.; Rundquist, D.C.; Galina, K.; Bryan, L. Remote estimation of leaf area index and green leaf biomass in maize canopies. Geophys. Res. Lett. 2003, 30, 335–343. [Google Scholar] [CrossRef]
  80. Zhang, Y.Q.; Wang, J.; Gong, S.; Xu, D.; Mo, Y. Straw mulching enhanced the photosynthetic capacity of field maize by increasing the leaf N use efficiency. Agric. Water Manag. 2019, 218, 60–67. [Google Scholar] [CrossRef]
  81. Cheng, Q.; Xu, H.; Fei, S.; Li, Z.; Chen, Z. Estimation of Maize LAI Using Ensemble Learning and UAV Multispectral Imagery under Different Water and Fertilizer Treatments. Agriculture 2022, 12, 1267. [Google Scholar] [CrossRef]
  82. Anjum, S.A.; Xie, X.-y.; Wang, L.-c.; Saleem, M.F.; Man, C.; Lei, W. Morphological, physiological and biochemical responses of plants to drought stress. Afr. J. Agric. Res. 2011, 6, 2026–2032. [Google Scholar]
  83. Karimpour, M. Effect of Drought Stress on RWC and Chlorophyll Content on Wheat (Triticum durum L.) Genotypes. World Essays J. 2019, 7, 52–56. [Google Scholar]
  84. Monteoliva, M.I.; Guzzo, M.C.; Posada, G.A. Breeding for Drought Tolerance by Monitoring Chlorophyll Content. Gene Technol. 2021, 10, 165. [Google Scholar]
  85. Piekielek, W.P.; Fox, R.H.; Toth, J.D.; Macneal, K.E. Use of chlorophyll meter at the early dent stage of corn to evaulate nitrogen sufficiency. Agron. J. 1995, 87, 403–408. [Google Scholar] [CrossRef]
  86. He, M.; Dijkstra, F.A. Drought effect on plant nitrogen and phosphorus: A meta-analysis. New Phytol. 2014, 204, 924–931. [Google Scholar] [CrossRef]
  87. Guo, J.; Fan, J.; Xiang, Y.; Zhang, F.; Yan, S.; Zhang, X.; Zheng, J.; Hou, X.; Tang, Z.; Li, Z. Maize leaf functional responses to blending urea and slow-release nitrogen fertilizer under various drip irrigation regimes. Agric. Water Manag. 2022, 262, 107396. [Google Scholar] [CrossRef]
  88. Menyhért, Z.; Ángyán, J.; Radics, L. A levélfelület-index (LAI), a fényviszonyok és a termés kapcsolata eltérő vetésidejű és tenyészterületű kukorica állományokban. Növénytermelés 1980, 29, 357–369. [Google Scholar]
  89. Berzsenyi, Z. A növényszám hatása a kukorica növekedésének és növekedési jellemzőinek dinamikájára I. Növénytermelés 1989, 38, 395–407. [Google Scholar]
  90. Tong, S.Y.; Song, F.B.; Xu, H.W. Differences of Morphological Senescence of Leaves in Various Maize Varieties during Mature Period of Seed. Acta Agric. Boreali Sin. 2009, 24, 11–15. [Google Scholar] [CrossRef]
  91. Liu, G.Z.; Hou, P.; Xie, R.Z.; Ming, B.; Wang, K.R.; Xu, W.J.; Liu, W.M.; Yang, Y.S.; Li, S.K. Canopy characteristics of high-yield maize with yield potential of 22.5 Mg ha−1. Field Crops Res. 2017, 213, 221–230. [Google Scholar] [CrossRef]
  92. Ocwa, A.; Harsanyi, E.; Széles, A.; Holb, I.J.; Szabó, S.; Rátonyi, T.; Mohammed, S. A bibliographic review of climate change and fertilization as the main drivers of maize yield: Implications for food security. Agric. Food Secur. 2023, 12, 14. [Google Scholar] [CrossRef]
  93. Wang, Y.; Huang, Y.; Fu, W.; Guo, W.; Ren, N.; Zhao, Y.; Ye, Y. Efficient Physiological and Nutrient Use Efficiency Responses of Maize Leaves to Drought Stress under Different Field Nitrogen Conditions. Agronomy 2020, 10, 523. [Google Scholar] [CrossRef]
  94. Martínez, D.E.; Guiamet, J.J. Distortion of the SPAD 502 chlorophyll meter readings by changes in irradiance and leaf water status. Agronomie 2004, 24, 41–46. [Google Scholar] [CrossRef]
  95. Padilla, F.M.; de Souza, R.; Peña-Fleitas, M.T.; Gallardo, M.; Giménez, C.; Thompson, R.B. Different Responses of Various Chlorophyll Meters to Increasing Nitrogen Supply in Sweet Pepper. Front. Plant Sci. 2018, 9, 1752. [Google Scholar] [CrossRef]
  96. Illés, A.; Bojtor, C.; Széles, A.; Mousavi, S.M.N.; Tóth, B.; Nagy, J. Analyzing the Effect of Intensive and Low-Input Agrotechnical Support for the Physiological, Phenometric, and Yield Parameters of Different Maize Hybrids Using Multivariate Statistical Methods. Int. J. Agron. 2021, 2021, 6682573. [Google Scholar] [CrossRef]
  97. Kira, O.; Nguy-Robertson, A.L.; Arkebauer, T.J.; Linker, R.; Gitelson, A.A. Informative spectral bands for remote green LAI estimation in C3 and C4 crops. Agric. Meteorol. 2016, 218–219, 243–249. [Google Scholar] [CrossRef]
  98. Liang, H.Y.; Shen, P.F.; Kong, X.Z.; Liao, Y.C.; Liu, Y.; Wen, X.X. Optimal nitrogen practice in winter wheat-summer maize rotation affecting the fates of 15 N-labeled fertilizer. Agronomy 2020, 10, 521. [Google Scholar] [CrossRef]
  99. Oguntunde, P.G.; Fasinmirin, J.T.; Abiolu, O.A. Performance of the SunScan canopy analysis system in estimating leaf area index of maize. Agric. Eng. Int. CIGR J. 2012, 14, 1–7. [Google Scholar]
  100. Wilhelm, W.; Ruwe, K.; Schlemmer, M.R. Comparison of three leaf area index meters in a corn canopy. Crop Sci. 2000, 40, 1179–1183. [Google Scholar] [CrossRef]
  101. Li, J.; Feng, Y.; Mou, J.; Xu, G.; Luo, Q.; Luo, K.; Huang, S.; Shi, X.; Guan, Z.; Ye, Y.; et al. Construction and Application Effect of the Leaf Value Model Based on SPAD Value in Rice. Sci. Agric. Sin. 2017, 50, 4714–4724. [Google Scholar] [CrossRef]
  102. Zhang, S.; Zhao, G.; Lang, K.; Su, B.; Chen, X.; Xi, X.; Zhang, H. Integrated Satellite, Unmanned Aerial Vehicle (UAV) and Ground Inversion of the SPAD of Winter Wheat in the Reviving Stage. Sensors 2019, 19, 1485. [Google Scholar] [CrossRef]
  103. Croft, H.; Chen, J.M.; Luo, X.Z.; Bartlett, P.; Chen, B.; Staebler, R.M. Leaf chlorophyll content as a proxy for leaf photosynthetic capacity. Glob. Chang. Biol. 2017, 23, 3513–3524. [Google Scholar] [CrossRef]
  104. Xie, C.; Yang, C. A review on plant high-throughput phenotyping traits using UAV-based sensors. Comput. Electron. Agric. 2020, 178, 105731. [Google Scholar] [CrossRef]
  105. Tsouros, D.C.; Bibi, S.; Sarigiannidis, P.G. A Review on UAV-Based Applications for Precision Agriculture. Information 2019, 10, 349. [Google Scholar] [CrossRef]
  106. Hunt, E.R., Jr.; Hively, W.D.; Fujikawa, S.; Linden, D.; Daughtry, C.S.; McCarty, G. Acquisition of NIR-Green-Blue Digital Photographs from Unmanned Aircraft for Crop Monitoring. Remote Sens. 2010, 2, 290–305. [Google Scholar] [CrossRef]
  107. Bouguettaya, A.; Zarzour, H.; Kechida, A.; Taberkit, A.M. Deep learning techniques to classify agricultural crops through UAV imagery: A review. Neural Comput. Appl. 2022, 34, 9511–9536. [Google Scholar] [CrossRef]
Figure 1. Location of the experimental area. ((A): Hungary, Debrecen; (B): layout of the basal and top-dressing fertilisation experiment. Measurements were conducted on plots marked with different colours).
Plants 12 03301 g001
Figure 2. Growing Degree Days and precipitation distribution during the vegetation period, Debrecen, 2021 and 2022.
Plants 12 03301 g002
Figure 3. Changes in relative leaf chlorophyll content (SPAD) and leaf area index (LAI), Debrecen, 2021 and 2022. Note: SPAD (left panel), LAI (right panel), year 2021 is shown in blue, year 2022 is shown in red. Basal and top dressing treatments are shown in rows A0 to V12180.
Plants 12 03301 g003
Figure 4. Effect of basal and top-dressing fertilisation on maize yield, Debrecen, 2021. Note: The fertiliser treatments of the different values in lower case are significantly different from each other according to Duncan’s test at the p < 0.05 probability level.
Plants 12 03301 g004
Figure 5. Effect of basal and top-dressing fertilisation on maize yield, Debrecen, 2022. Note: The fertiliser treatments of the different values in lower case are significantly different from each other according to Duncan’s test at the p < 0.05 probability level.
Plants 12 03301 g005
Figure 6. Maize yield as a function of relative chlorophyll content (SPAD), Debrecen, 2021–2022.
Plants 12 03301 g006
Figure 7. Maize yield as a function of leaf area index (LAI), Debrecen, 2021–2022.
Plants 12 03301 g007
Figure 8. Maize yield as a function of relative chlorophyll content (SPAD) and leaf area index (LAI) in the VT phenophase, Debrecen, 2021–2022.
Plants 12 03301 g008
Table 1. Multiple R-squared and residuals standard error (RMSE).
Maize PhenophaseR2
(SPAD)
R2
(LAI)
R2
(SPAD + LAI)
RMSE (SPAD + LAI)
V8n.s.0.770.2672.469
V100.3520.3960.4752.089
V120.5000.2260.5152.008
Vn0.5450.6110.7341.486
VT0.6240.6270.7621.408
R10.6550.5750.7041.569
R30.7160.5210.7331.489
R60.2210.5260.5621.908
Disclaimer/Publisher’s Note: The statements, opinions and data contained in all publications are solely those of the individual author(s) and contributor(s) and not of MDPI and/or the editor(s). MDPI and/or the editor(s) disclaim responsibility for any injury to people or property resulting from any ideas, methods, instructions or products referred to in the content.

