
Increased Plasticity in Invasive Populations of a Globally Invasive Cactus
 , , , , , and
Abstract
:1. Introduction
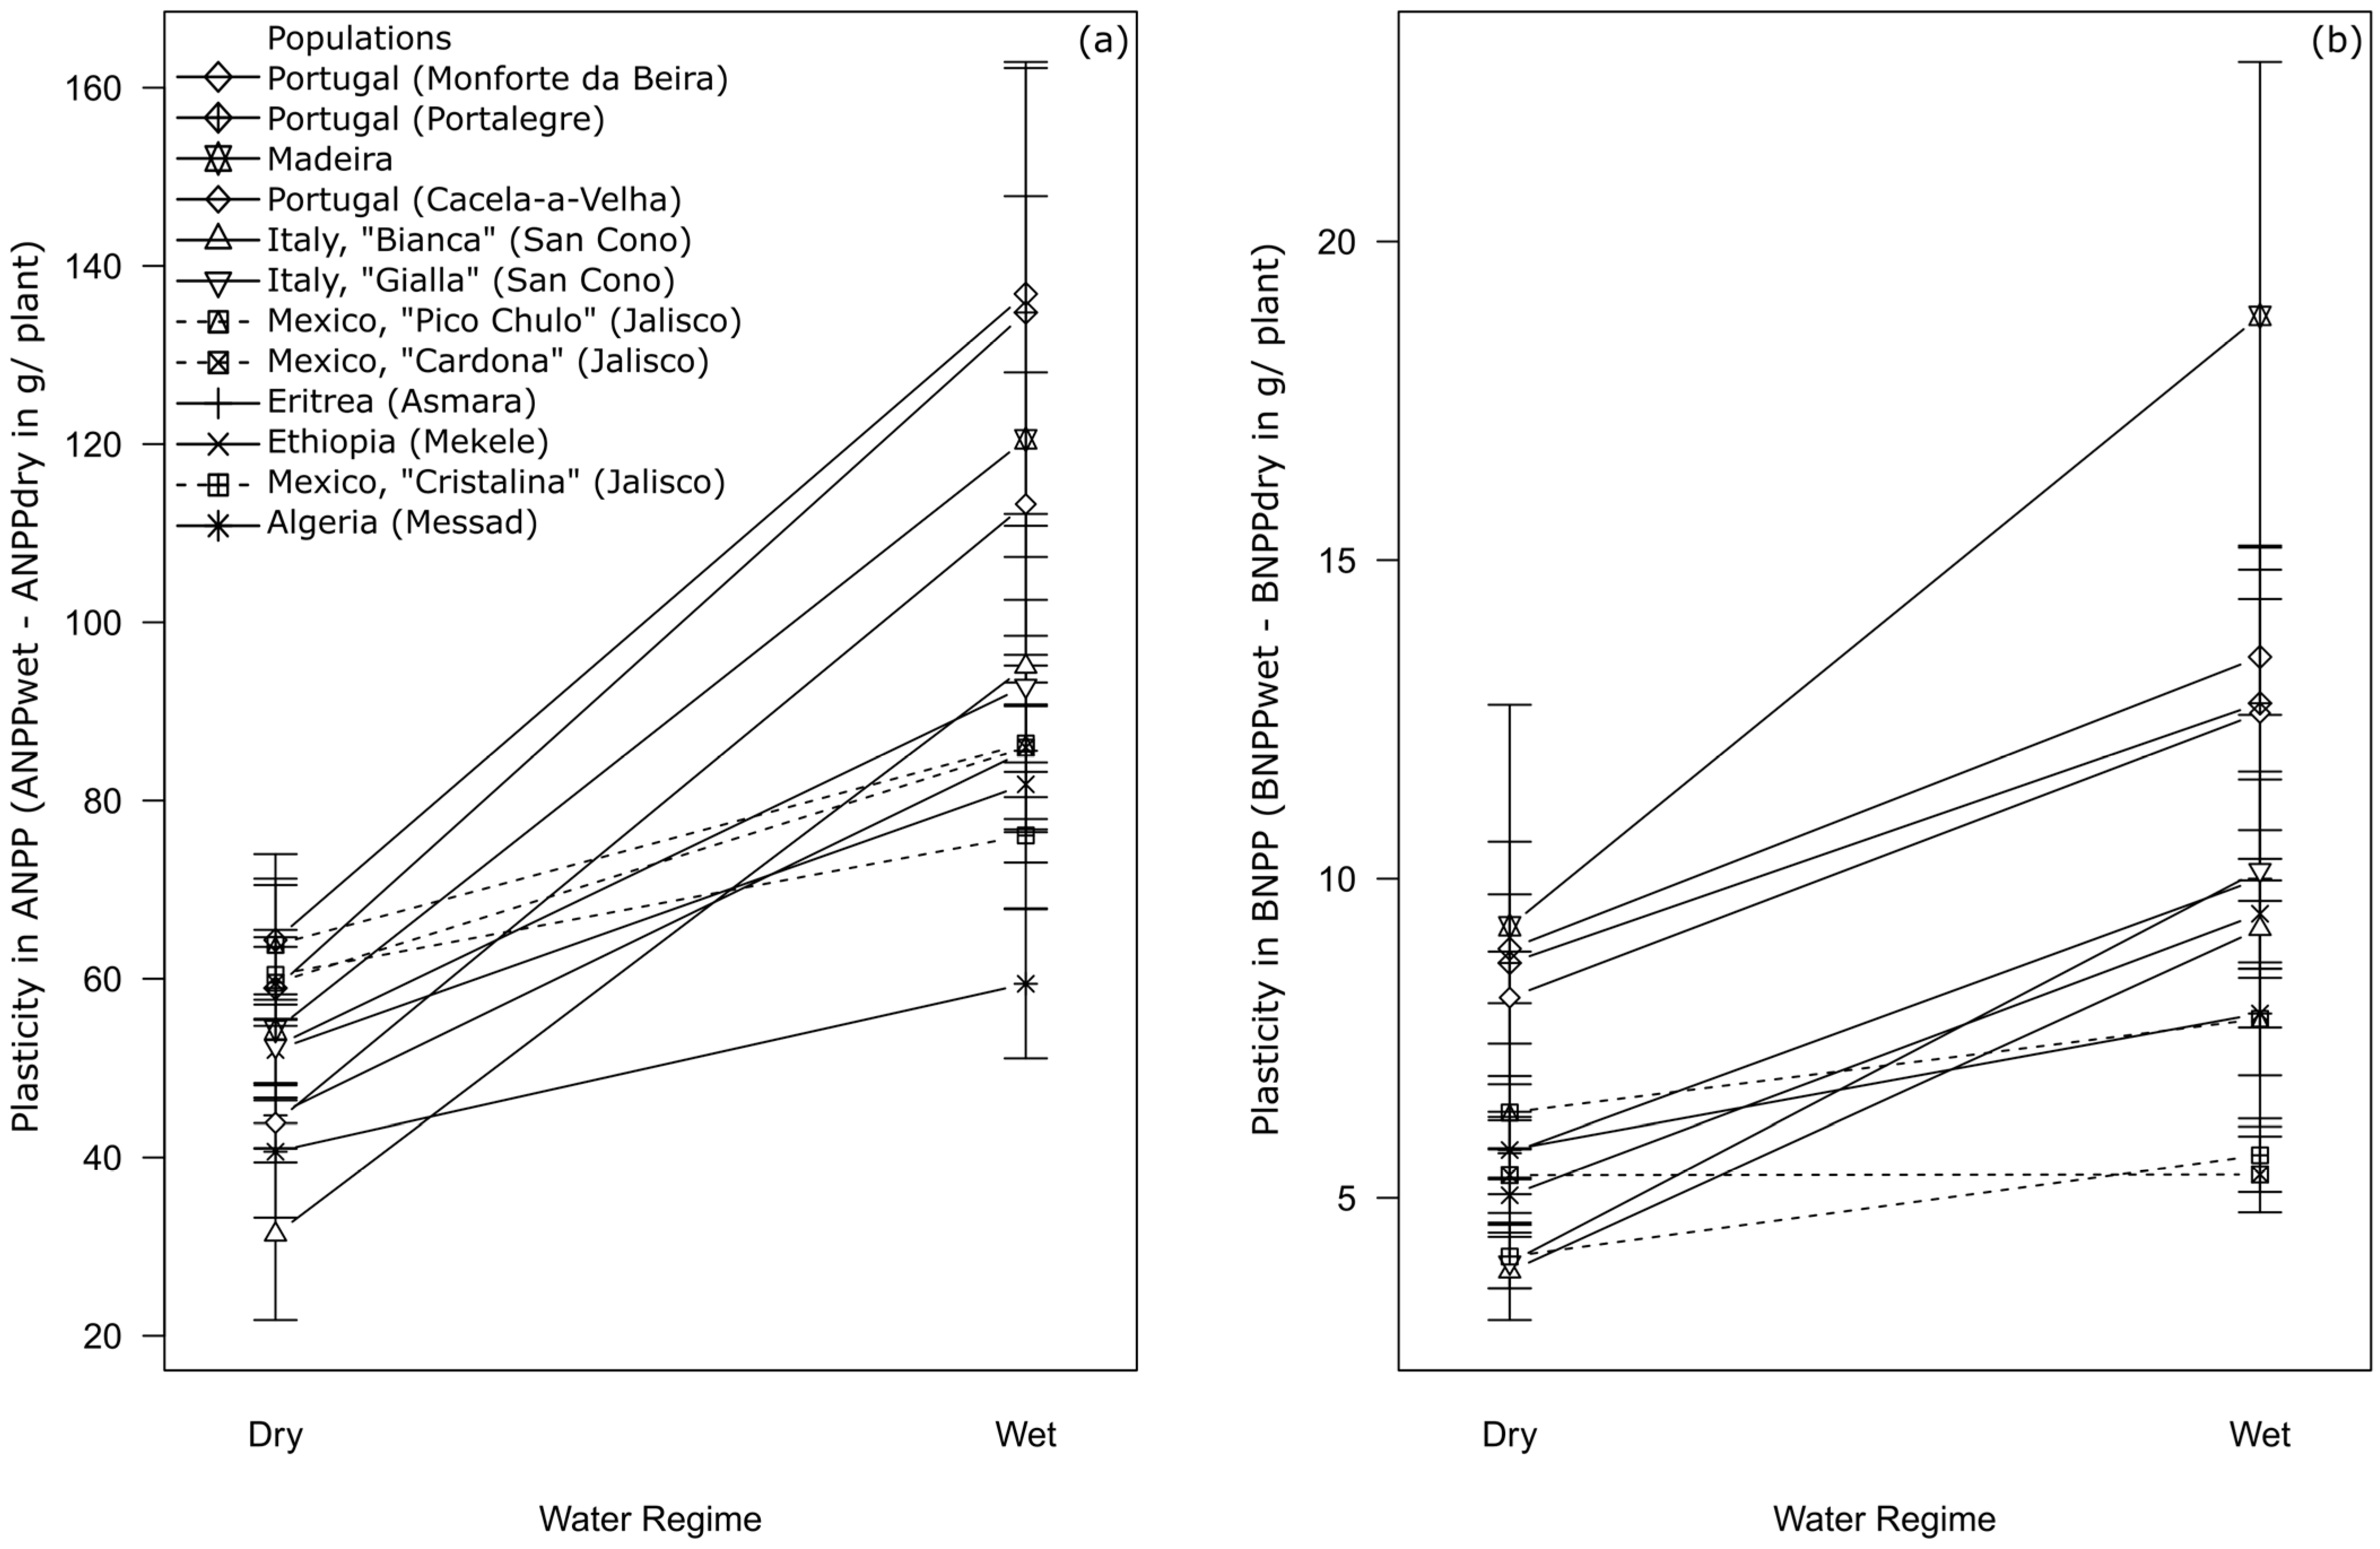
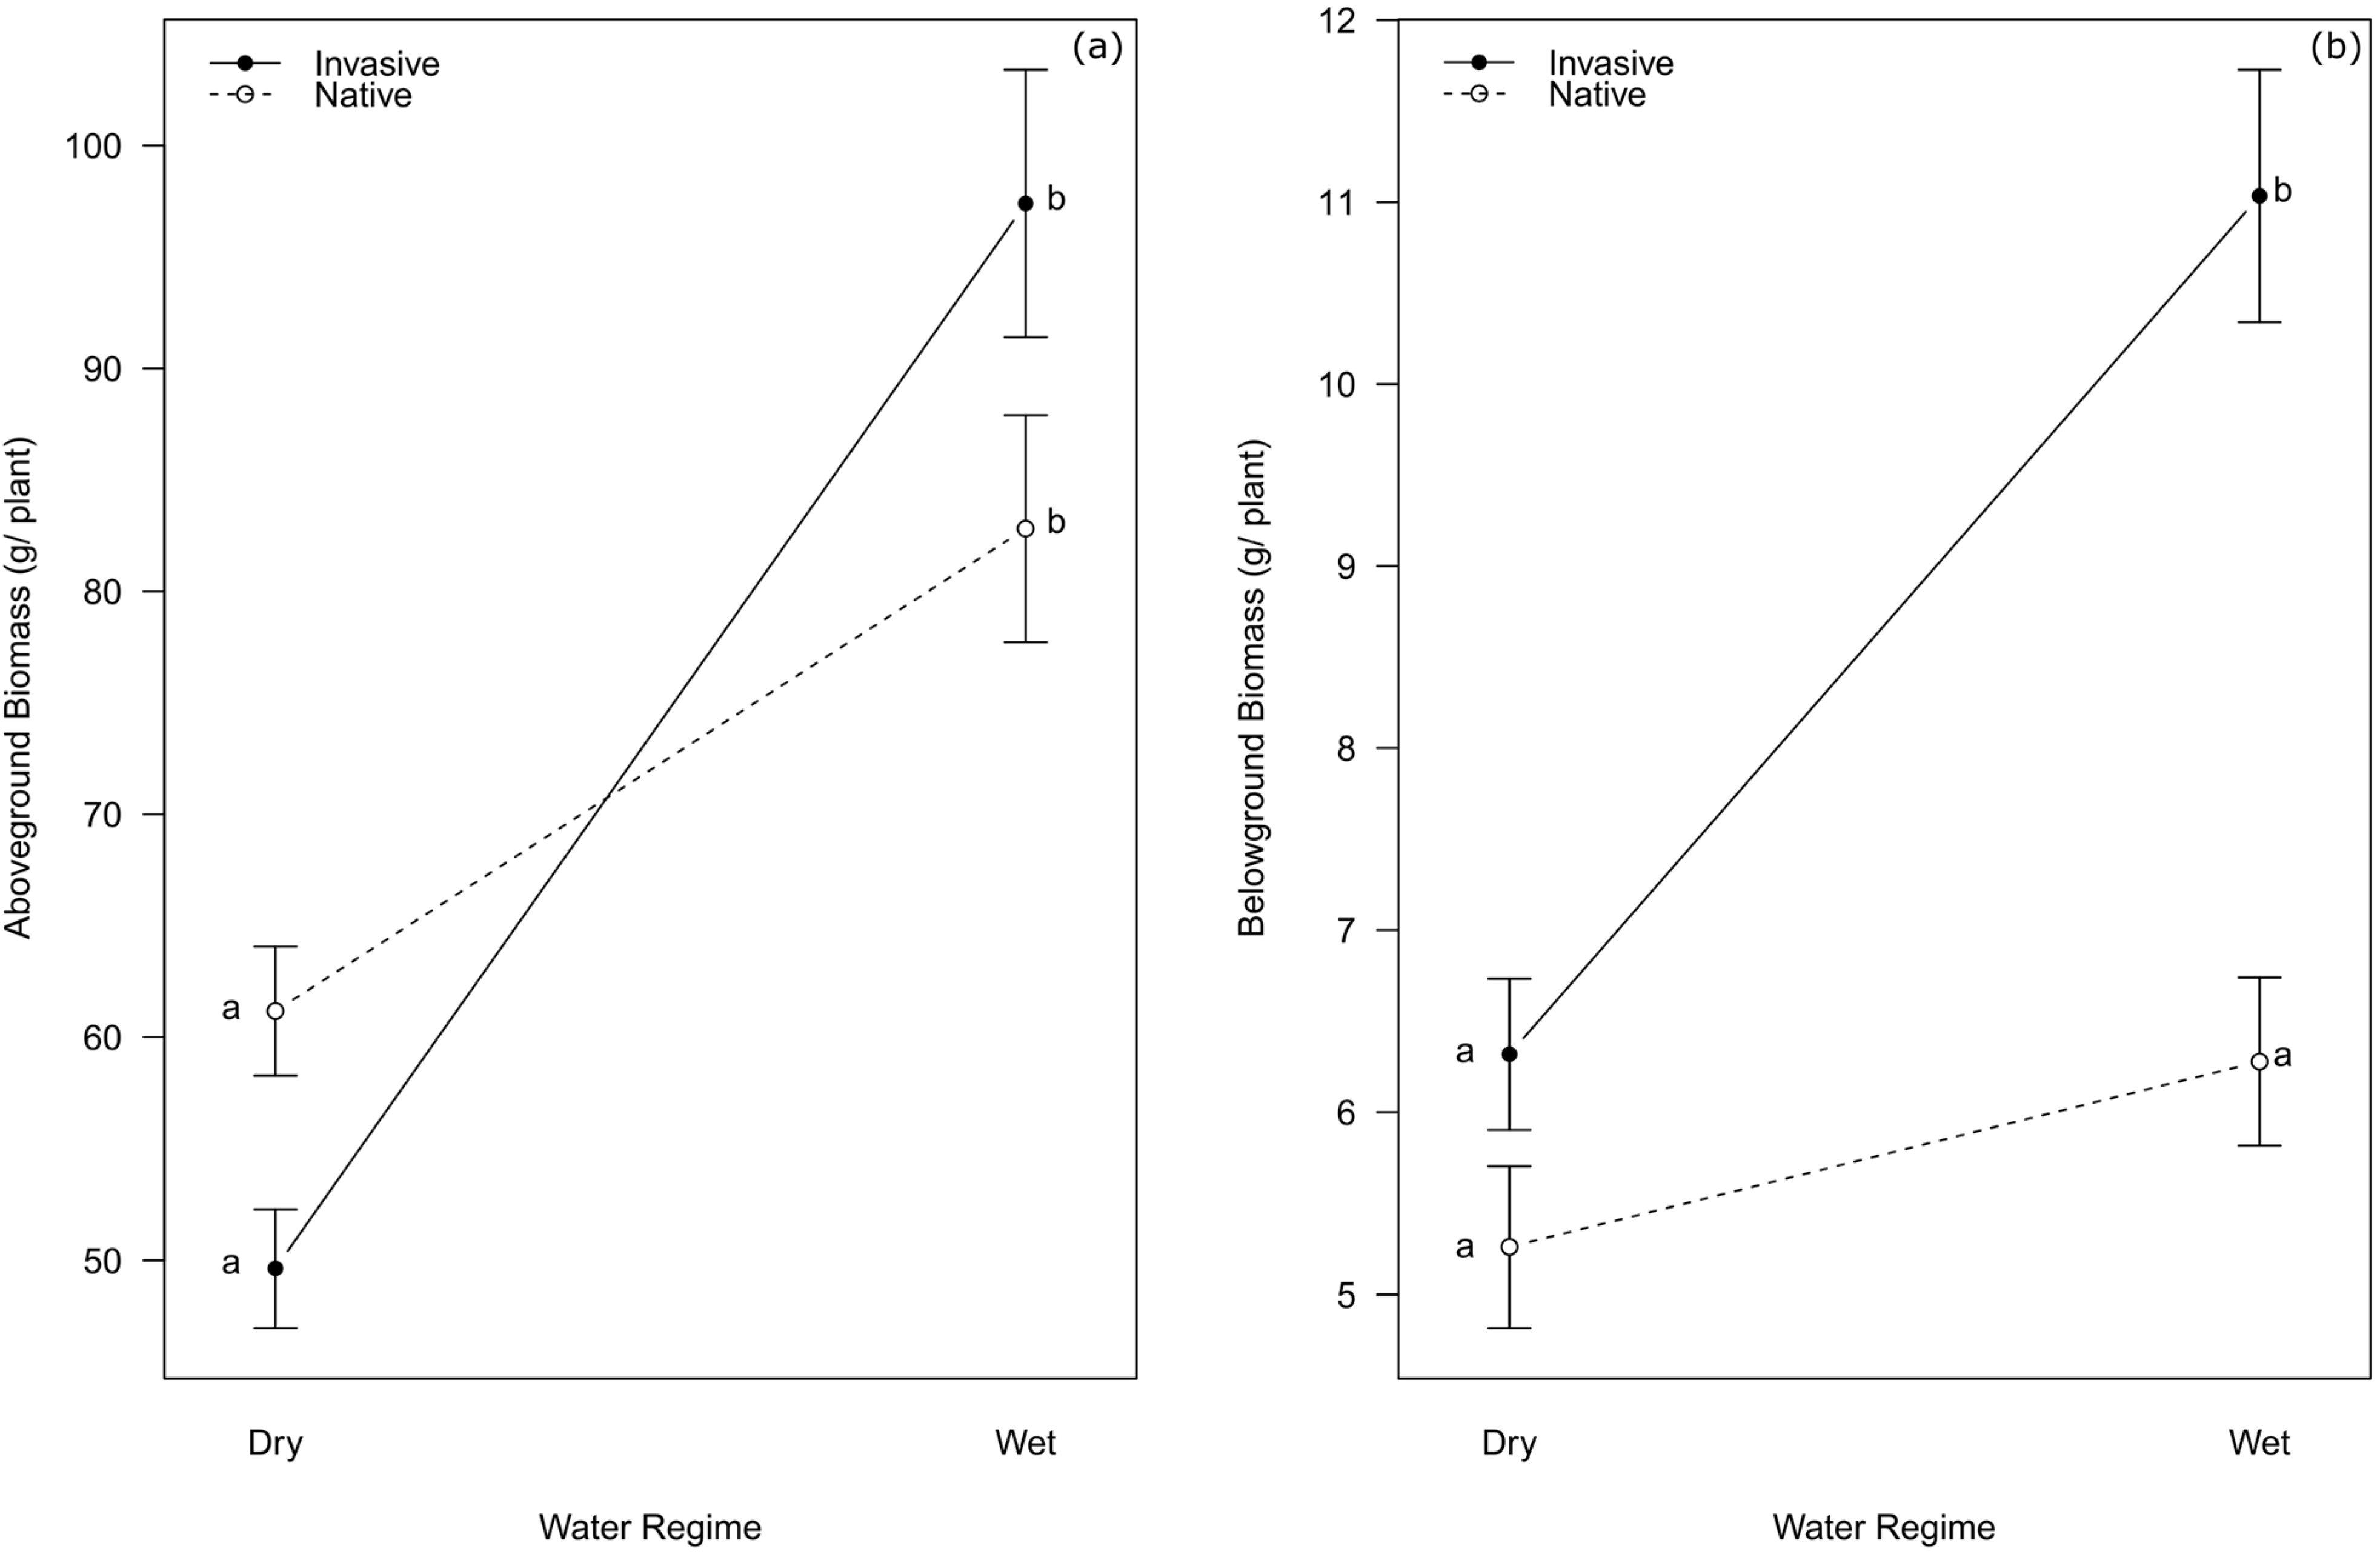
2. Results
3. Discussion
4. Materials and Methods
4.1. Study Species
4.2. Experimental Design
4.3. Response Parameters
4.4. Statistical Analyses
Author Contributions
Funding
Data Availability Statement
Acknowledgments
Conflicts of Interest
Appendix A
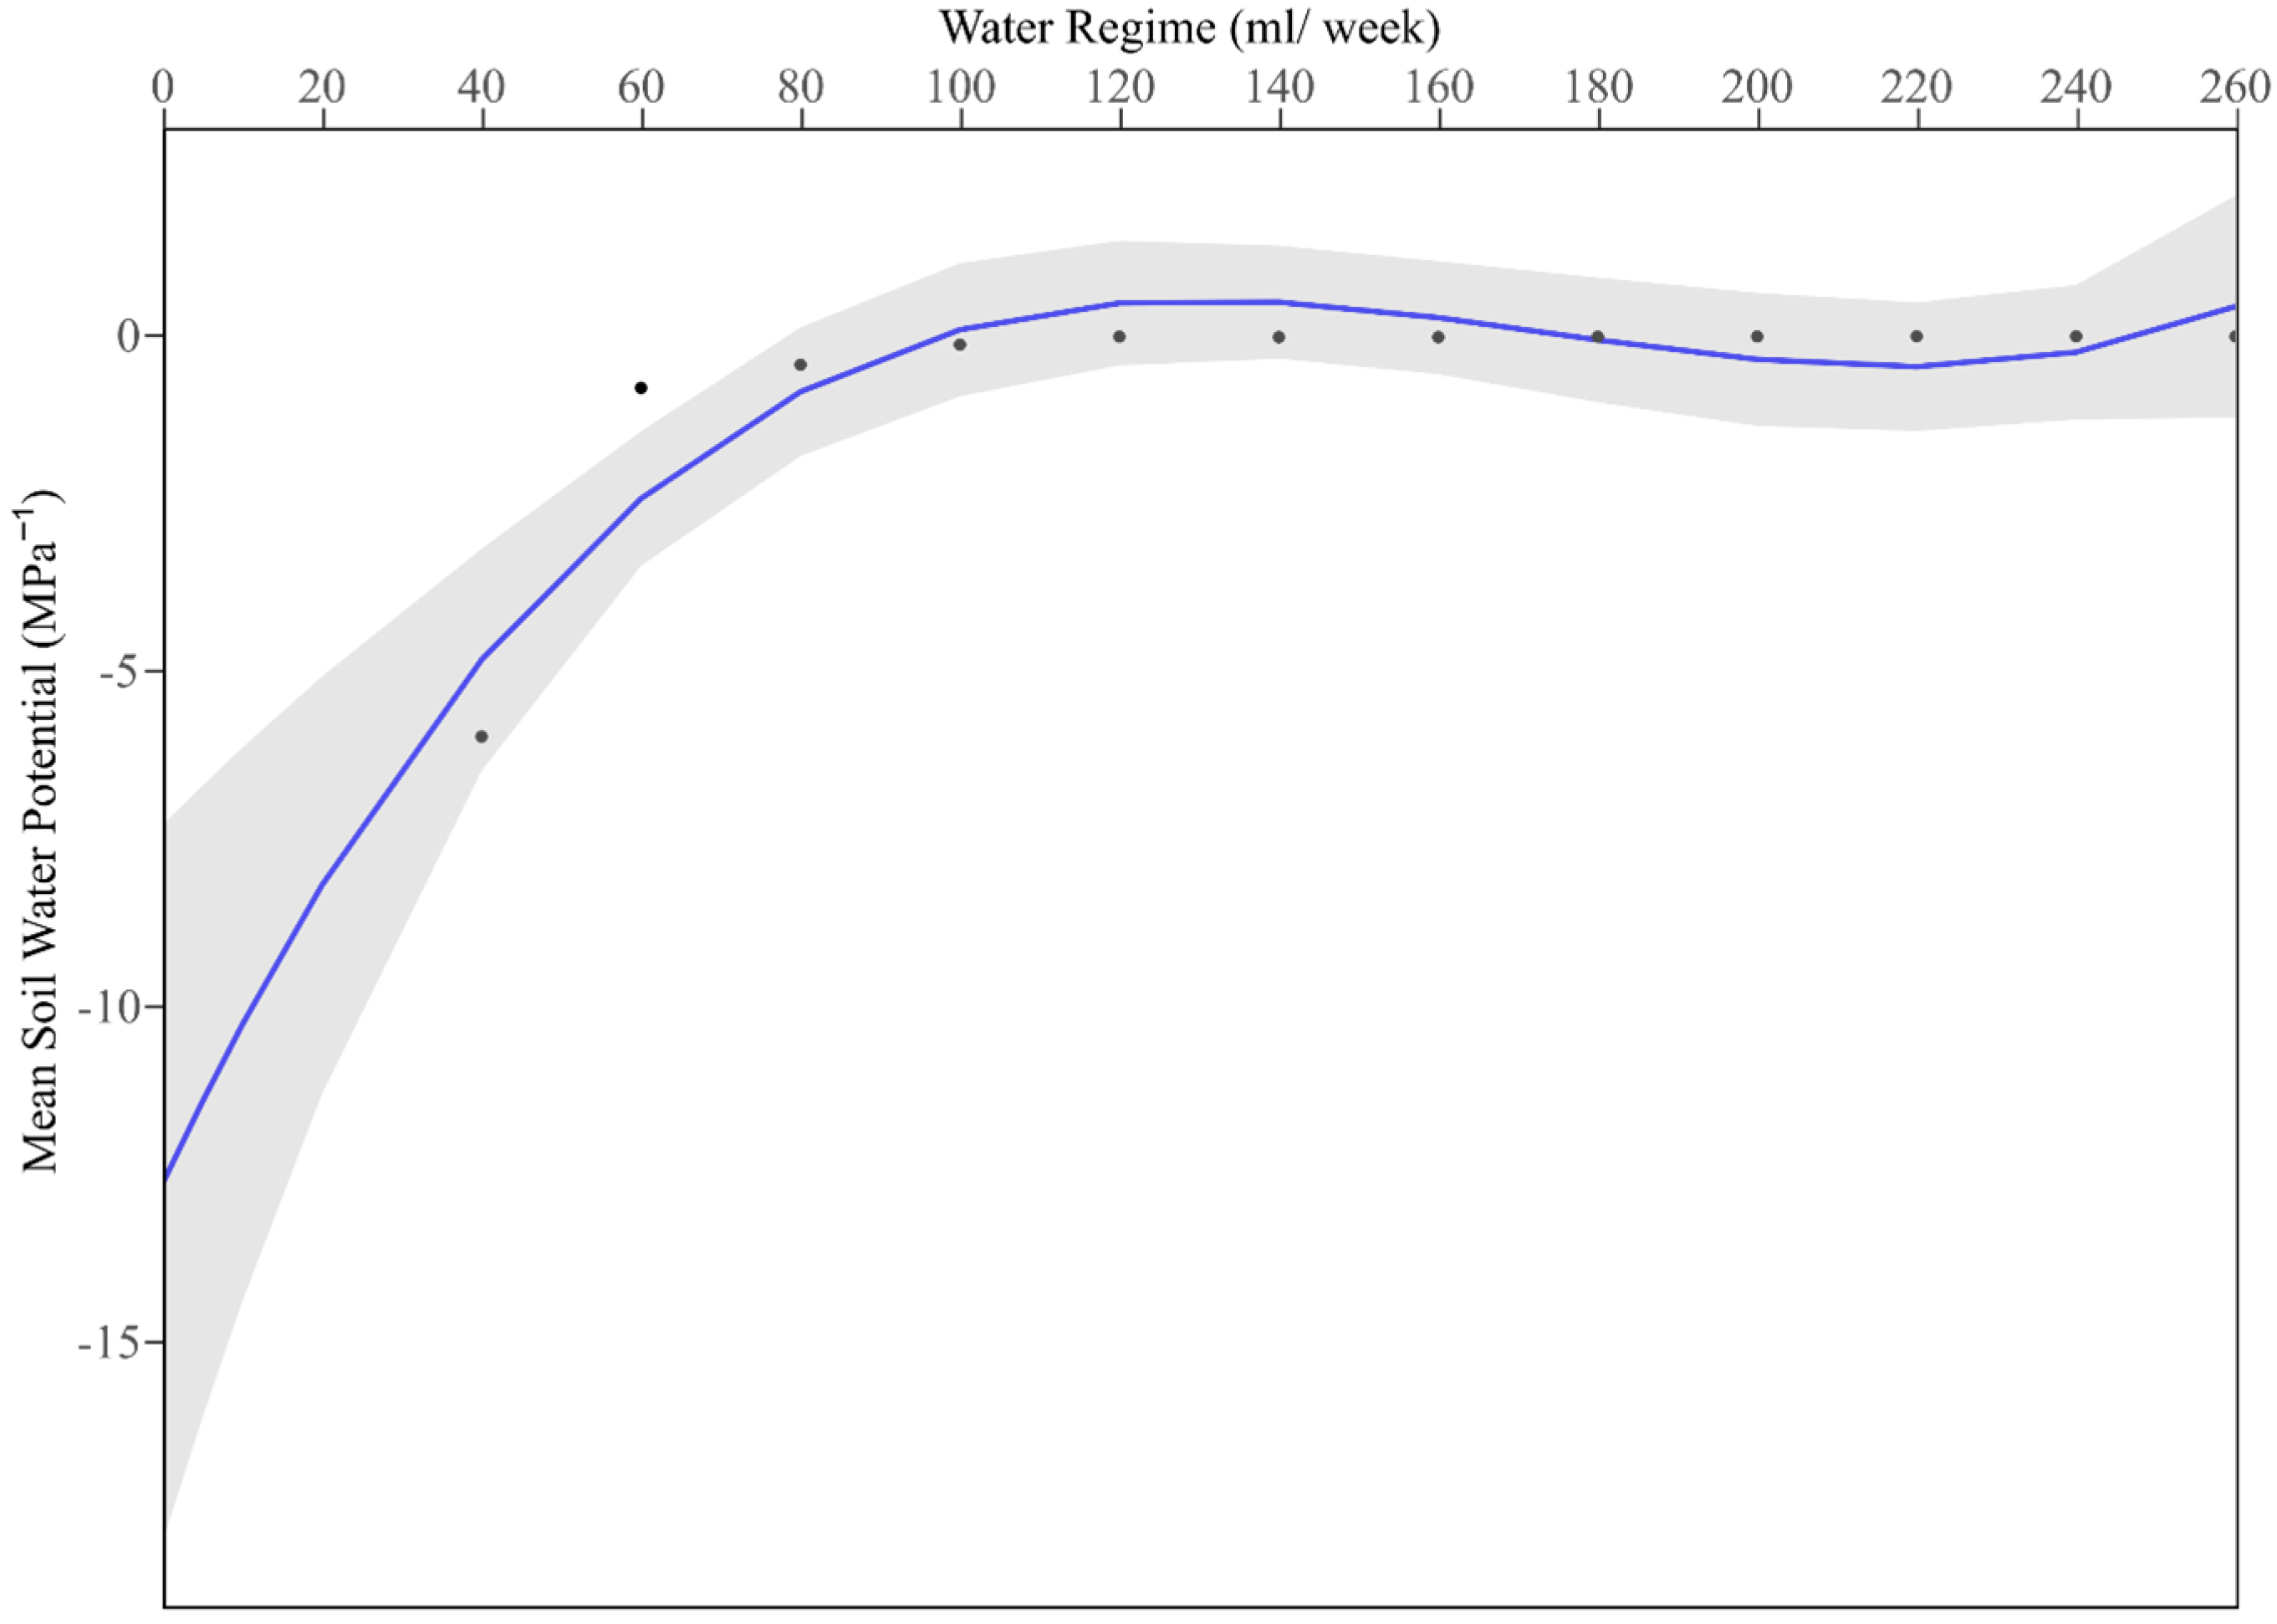
Appendix B. Water Tolerance Limits of the Globally Invasive Cactus Opuntia ficus-indica

References
- Mack, R.N.; Simberloff, D.; Mark Lonsdale, W.; Evans, H.; Clout, M.; Bazzaz, F.A. Biotic Invasions: Causes, Epidemiology, Global Consequences, and Control. Ecol. Appl. 2000, 10, 689–710. [Google Scholar] [CrossRef]
- Early, R.; Bradley, B.A.; Dukes, J.S.; Lawler, J.J.; Olden, J.D.; Blumenthal, D.M.; Gonzalez, P.; Grosholz, E.D.; Ibañez, I.; Miller, L.P.; et al. Global threats from invasive alien species in the twenty-first century and national response capacities. Nat. Commun. 2016, 7, 12485. [Google Scholar] [CrossRef] [PubMed]
- Simberloff, D.; Martin, J.-L.; Genovesi, P.; Maris, V.; Wardle, D.A.; Aronson, J.; Courchamp, F.; Galil, B.; García-Berthou, E.; Pascal, M.; et al. Impacts of biological invasions: What’s what and the way forward. Trends Ecol. Evol. 2013, 28, 58–66. [Google Scholar] [CrossRef] [PubMed]
- Prentis, P.J.; Wilson, J.R.U.; Dormontt, E.E.; Richardson, D.M.; Lowe, A.J. Adaptive evolution in invasive species. Trends Plant Sci. 2008, 13, 288–294. [Google Scholar] [CrossRef]
- Yin, X.; Martinez, A.S.; Sepúlveda, M.S.; Christie, M.R. Rapid genetic adaptation to recently colonized environments is driven by genes underlying life history traits. BMC Genom. 2021, 22, 269. [Google Scholar] [CrossRef]
- Seebens, H.; Blackburn, T.M.; Dyer, E.E.; Genovesi, P.; Hulme, P.E.; Jeschke, J.M.; Pagad, S.; Pyšek, P.; Winter, M.; Arianoutsou, M.; et al. No saturation in the accumulation of alien species worldwide. Nat. Commun. 2017, 8, 14435. [Google Scholar] [CrossRef]
- Vilà, M.; Espinar, J.L.; Hejda, M.; Hulme, P.E.; Jarošík, V.; Maron, J.L.; Pergl, J.; Schaffner, U.; Sun, Y.; Pyšek, P. Ecological impacts of invasive alien plants: A meta-analysis of their effects on species, communities and ecosystems. Ecol. Lett. 2011, 14, 702–708. [Google Scholar] [CrossRef]
- Levine, J.M.; Vilà, M.; D’Antonio, C.M.; Dukes, J.S.; Grigulis, K.; Lavorel, S. Mechanisms underlying the impacts of exotic plant invasions. Proc. R. Soc. Lond. B 2003, 270, 775–781. [Google Scholar] [CrossRef]
- Pyšek, P.; Jarošík, V.; Hulme, P.E.; Pergl, J.; Hejda, M.; Schaffner, U.; Vilà, M. A global assessment of invasive plant impacts on resident species, communities and ecosystems: The interaction of impact measures, invading species' traits and environment. Glob. Chang. Biol. 2012, 18, 1725–1737. [Google Scholar] [CrossRef]
- Davidson, A.M.; Jennions, M.; Nicotra, A.B. Do invasive species show higher phenotypic plasticity than native species and, if so, is it adaptive? A meta-analysis. Ecol. Lett. 2011, 14, 419–431. [Google Scholar] [CrossRef]
- Zenni, R.D.; Lamy, J.-B.; Lamarque, L.J.; Porté, A.J. Adaptive evolution and phenotypic plasticity during naturalization and spread of invasive species: Implications for tree invasion biology. Biol. Invasions 2014, 16, 635–644. [Google Scholar] [CrossRef]
- Gratani, L. Plant Phenotypic Plasticity in Response to Environmental Factors. Adv. Bot. 2014, 2014, 208747. [Google Scholar] [CrossRef]
- Matesanz, S.; Gianoli, E.; Valladares, F. Global change and the evolution of phenotypic plasticity in plants. Ann. N. Y. Acad. Sci. 2010, 1206, 35–55. [Google Scholar] [CrossRef]
- Stotz, G.C.; Salgado-Luarte, C.; Escobedo, V.M.; Valladares, F.; Gianoli, E. Global trends in phenotypic plasticity of plants. Ecol. Lett. 2021, 24, 2267–2281. [Google Scholar] [CrossRef] [PubMed]
- Richards, C.L.; Bossdorf, O.; Muth, N.Z.; Gurevitch, J.; Pigliucci, M. Jack of all trades, master of some? On the role of phenotypic plasticity in plant invasions. Ecol. Lett. 2006, 9, 981–993. [Google Scholar] [CrossRef]
- Bossdorf, O.; Auge, H.; Lafuma, L.; Rogers, W.E.; Siemann, E.; Prati, D. Phenotypic and genetic differentiation between native and introduced plant populations. Oecologia 2005, 144, 1–11. [Google Scholar] [CrossRef] [PubMed]
- Sexton, J.P.; McKay, J.K.; Sala, A. Plasticity and genetic diversity may allow Saltcedar to invade cold climates in north America. Ecol. Appl. 2002, 12, 1652–1660. [Google Scholar] [CrossRef]
- Kaufman, S.R.; Smouse, P.E. Comparing indigenous and introduced populations of Melaleuca quinquenervia (Cav.) Blake: Response of seedlings to water and pH levels. Oecologia 2001, 127, 487–494. [Google Scholar] [CrossRef]
- Kleine, S.; Weissinger, L.; Müller, C. Impact of drought on plant populations of native and invasive origins. Oecologia 2017, 183, 9–20. [Google Scholar] [CrossRef]
- Smith, A.L.; Hodkinson, T.R.; Villellas, J.; Catford, J.A.; Csergő, A.M.; Blomberg, S.P.; Crone, E.E.; Ehrlén, J.; Garcia, M.B.; Laine, A.-L.; et al. Global gene flow releases invasive plants from environmental constraints on genetic diversity. Proc. Natl. Acad. Sci. USA 2020, 117, 4218–4227. [Google Scholar] [CrossRef]
- IPCC. Climate Change 2022: Impacts, Adaptation, and Vulnerability. Contribution of Working Group II to the Sixth Assessment Report of the Intergovernmental Panel on Climate Change; Pörtner, H.-O., Roberts, D.C., Tignor, M., Poloczanska, E.S., Mintenbeck, K., Alegría, A., Craig, M., Langsdorf, S., Löschke, S., Möller, V., et al., Eds.; Cambridge University Press: Cambridge, UK; New York, NY, USA, 2022; 3056p. [Google Scholar] [CrossRef]
- Gouhis, F.; Louhaichi, M.; Nefzaoui, A. Cactus (Opuntia ficus-indica) utilization for rehabilitating rangelands in arid regions of Tunisia. Acta Hortic. 2019, 1247, 95–102. [Google Scholar] [CrossRef]
- Nefzaoui, A. Opuntia ficus-indica productivity and ecosystem services in arid areas. Italus Hortus 2018, 25, 29–39. [Google Scholar] [CrossRef]
- Zettlemoyer, M.A.; Peterson, M.L. Does Phenological Plasticity Help or Hinder Range Shifts under Climate Change? Front. Ecol. Evol. 2021, 9, 689192. [Google Scholar] [CrossRef]
- Milton, S.J.; Dean, W.R.J. Plant invasions in arid areas: Special problems and solutions: A South African perspective. Biol. Invasions 2010, 12, 3935–3948. [Google Scholar] [CrossRef]
- Tesfay, Y.B.; Kreyling, J. The invasive Opuntia ficus-indica homogenizes native plant species compositions in the highlands of Eritrea. Biol. Invasions 2021, 23, 433–442. [Google Scholar] [CrossRef]
- Brutsch, M.; Zimmermann, H. Control and Utilization of Wild Opuntias. FAO Plant Prod. Prot. Pap. 1995, 132, 155–166. [Google Scholar]
- Bakewell-Stone, P. Opuntia Ficus-Indica (Prickly Pear); CABI Compendium: Wallingford, UK, 2022. [Google Scholar] [CrossRef]
- Novoa, A.; Le Roux, J.J.; Robertson, M.P.; Wilson, J.R.U.; Richardson, D.M. Introduced and invasive cactus species: A global review. AoB Plants 2014, 7, plu078. [Google Scholar] [CrossRef]
- Samah, S.; Teodoro Pardo, C.V.d.; Serrato Cruz, M.A.; Valadez-Moctezuma, E. Genetic Diversity, Genotype Discrimination, and Population Structure of Mexican Opuntia sp., Determined by SSR Markers. Plant Mol. Biol. Rep. 2016, 34, 146–159. [Google Scholar] [CrossRef]
- Adli, B.; Touati, M.; Yabrir, B.; Bakria, T.; Bezini, E.; Boutekrabt, A. Morphological characterization of some naturalized accessions of Opuntia ficus-indica (L.) Mill. in the Algerian steppe regions. S. Afr. J. Bot. 2019, 124, 211–217. [Google Scholar] [CrossRef]
- Napier, J.D.; Heckman, R.W.; Juenger, T.E. Gene-by-environment interactions in plants: Molecular mechanisms, environmental drivers, and adaptive plasticity. Plant Cell 2023, 35, 109–124. [Google Scholar] [CrossRef]
- Scalisi, A.; Morandi, B.; Inglese, P.; Lo Bianco, R. Cladode growth dynamics in Opuntia ficus-indica under drought. Environ. Exp. Bot. 2016, 122, 158–167. [Google Scholar] [CrossRef]
- Podda, L.; Santo, A.; Leone, C.; Mayoral, O.; Bacchetta, G. Seed germination, salt stress tolerance and seedling growth of Opuntia ficus-Indica (Cactaceae), invasive species in the Mediterranean Basin. Flora 2017, 229, 50–57. [Google Scholar] [CrossRef]
- Rejmánek, M. Invasive plants: Approaches and predictions. Austral Ecol. 2000, 25, 497–506. [Google Scholar] [CrossRef]
- Baker, H.G. Characteristics and modes of origin of weeds. In The Genetics of Colonizing Species; Baker, H.G., Stebbins, G.L., Eds.; Academic Press: New York, NY, USA, 1965; pp. 147–169. [Google Scholar]
- Sultan, S.E. Phenotypic plasticity for fitness components in Polygonum species of contrasting ecological breadth. Ecology 2001, 82, 328–343. [Google Scholar] [CrossRef]
- Pérez-Ramos, I.M.; Matías, L.; Gómez-Aparicio, L.; Godoy, Ó. Functional traits and phenotypic plasticity modulate species coexistence across contrasting climatic conditions. Nat. Commun. 2019, 10, 2555. [Google Scholar] [CrossRef]
- Mroue, S.; Simeunovic, A.; Robert, H.S. Auxin production as an integrator of environmental cues for developmental growth regulation. J. Exp. Bot. 2018, 69, 201–212. [Google Scholar] [CrossRef] [PubMed]
- Anderson, J.; Song, B.-H. Plant adaptation to climate change—Where are we? J. Syst. Evol. 2020, 58, 533–545. [Google Scholar] [CrossRef] [PubMed]
- Schultheis, E.H.; MacGuigan, D.J. Competitive ability, not tolerance, may explain success of invasive plants over natives. Biol. Invasions 2018, 20, 2793–2806. [Google Scholar] [CrossRef]
- Ghalambor, C.K.; McKay, J.K.; Carroll, S.P.; Reznick, D.N. Adaptive versus non-adaptive phenotypic plasticity and the potential for contemporary adaptation in new environments. Funct. Ecol. 2007, 21, 394–407. [Google Scholar] [CrossRef]
- Lande, R. Adaptation to an extraordinary environment by evolution of phenotypic plasticity and genetic assimilation. J. Evol. Biol. 2009, 22, 1435–1446. [Google Scholar] [CrossRef]
- Snyman, H.A. Growth Rate and Water-Use Efficiency of Cactus Pears Opuntia ficus-indica and O. robusta. Arid. Land Res. Manag. 2013, 27, 337–348. [Google Scholar] [CrossRef]
- Snyman, H.A. Root studies on cactus pears Opuntia ficus-indica and O. robusta along a soil-water gradient. Haseltonia 2007, 13, 64–75. [Google Scholar] [CrossRef]
- Snyman, H.A. A Case Study on in situ Rooting Profiles and Water-Use Efficiency of Cactus Pears, Opuntia ficus-indica and O. robusta. J. Prof. Assoc. Cactus Dev. 2005, 7, 1–21. [Google Scholar]
- Barrientos-Sanhueza, C.; Hormazabal-Pavat, V.; Cuneo, I.F. Extreme drought enhances Opuntia ficus-indica fine root cells elasticity preventing permanent damage. Theor. Exp. Plant Physiol. 2023. [Google Scholar] [CrossRef]
- Snyman, H.A. A greenhouse study on root dynamics of cactus pears, Opuntia ficus-indica and O. robusta. J. Arid Environ. 2006, 65, 529–542. [Google Scholar] [CrossRef]
- Sudzuki, F. Anatomy and morphology. In Agroecology, Cultivation and Uses of Cactus Pear; Barbera, G., Inglese, P., Pimienta-Barrios, E., Eds.; Plant Production and Protection Paper 132; Food and Agriculture Organization of the United Nations: Rome, Italy, 1995; 213p. [Google Scholar]
- Zimmermann, H.G.; Moran, V.C.; Hoffmann, J.H. Biological control in the management of invasive alien plants in South Africa, and the role of the Working for Water Programme: Working for water. S. Afr. J. Sci. 2004, 100, 34–40. [Google Scholar]
- Walters, M.; Figueiredo, E.; Crouch, N.R.; Winter, P.J.D.; Smith, G.F.; Zimmermann, H.G.; Mashope, B.K. Naturalised and Invasive Succulents of Southern Africa. Abc Taxa 2011, 11, 1–370. [Google Scholar]
- Gimeno, I.; Vilà, M. Recruitment of two Opuntia species invading abandoned olive groves. Acta Oecol. 2002, 23, 239–246. [Google Scholar] [CrossRef]
- Barbera, G.; Carimi, F.; Inglese, P. The reflowering of prickly pear Opuntia ficus indica (L.) Miller: Influence of removal time and cladode load on yield and fruit ripening. Adv. Hort. Sci. 1991, 5, 77–80. [Google Scholar] [CrossRef]
- Nieddu, G.; Chessa, I. Distribution of phenotypic characters within a seddling population from Opuntia ficus-indica (cv “Gialla”). Acta Hortic. 1997, 438, 37–44. [Google Scholar] [CrossRef]
- Kiesling, R. Origen, domesticación y distribución de Opuntia ficus-indica. J. Prof. Assoc. Cactus Dev. 1998, 3, 50–60. [Google Scholar]
- Wang, X.; Felker, P.; Burrow, M.; Paterson, A. Assessment of genetic diversityamong Opuntia genotypes, reflected by DNA markers: Wang, Xi., Felker, Pete., Burrow, Michael, D., Paterson, AndrewH. J. Prof. Assoc. Cactus Dev. 1999, 3, 3–14. [Google Scholar]
- De Martonne, E. Aréisme et indice d’aridité. C. R. Acad. Sci. 1926, 182, 1395–1398. [Google Scholar]
- Kuznetsova, A.; Brockhoff, P.B.; Christensen, R.H.B. lmerTest Package: Tests in Linear Mixed Effects Models. J. Stat. Soft. 2017, 82, 1–26. [Google Scholar] [CrossRef]
- Lenth, R. Estimated Marginal Means, aka Least-Squares Means, R Package Emmeans Version 1.8.6; Comprehensive R Archive Network (CRAN): Windhoek, Namibia, 2023. [Google Scholar]
- Fick, S.E.; Hijmans, R.J. WorldClim 2: New 1-km spatial resolution climate surfaces for global land areas. Int. J. Climatol. 2017, 37, 4302–4315. [Google Scholar] [CrossRef]
- Faraway, J.J. Linear Models with R; Chapman and Hall/CRC: Boca Raton, FL, USA, 2004; ISBN 9780429211393. [Google Scholar]
- Morales, M. Sciplot: Scientific Graphing Functions for Factorial Designs. 2020. Available online: https://CRAN.R-project.org/package=sciplot (accessed on 20 June 2023).
- Wickham, H. Ggplot2: Elegant Graphics for Data Analysis/Hadley Wickham; with Contributions by Carson Sievert, 2nd ed.; Springer: Cham, Switzerland, 2016; ISBN 9783319242774. [Google Scholar]
- R Core Team. R: A Language and Environment for Statistical Computing; R Foundation for Statistical Computing: Vienna, Austria, 2022; Available online: https://www.R-project.org/ (accessed on 20 June 2023).
- Kreyling, J.; Schweiger, A.H.; Bahn, M.; Ineson, P.; Migliavacca, M.; Morel-Journel, T.; Christiansen, J.R.; Schtickzelle, N.; Larsen, K.S. To replicate, or not to replicate—That is the question: How to tackle nonlinear responses in ecological experiments. Ecol. Lett. 2018, 21, 1629–1638. [Google Scholar] [CrossRef] [PubMed]
- Gelman, A.; Hill, J. Data Analysis Using Regression and Multilevel; Cambridge University Press: Cambridge, UK, 2007; ISBN 9780521867061. [Google Scholar]


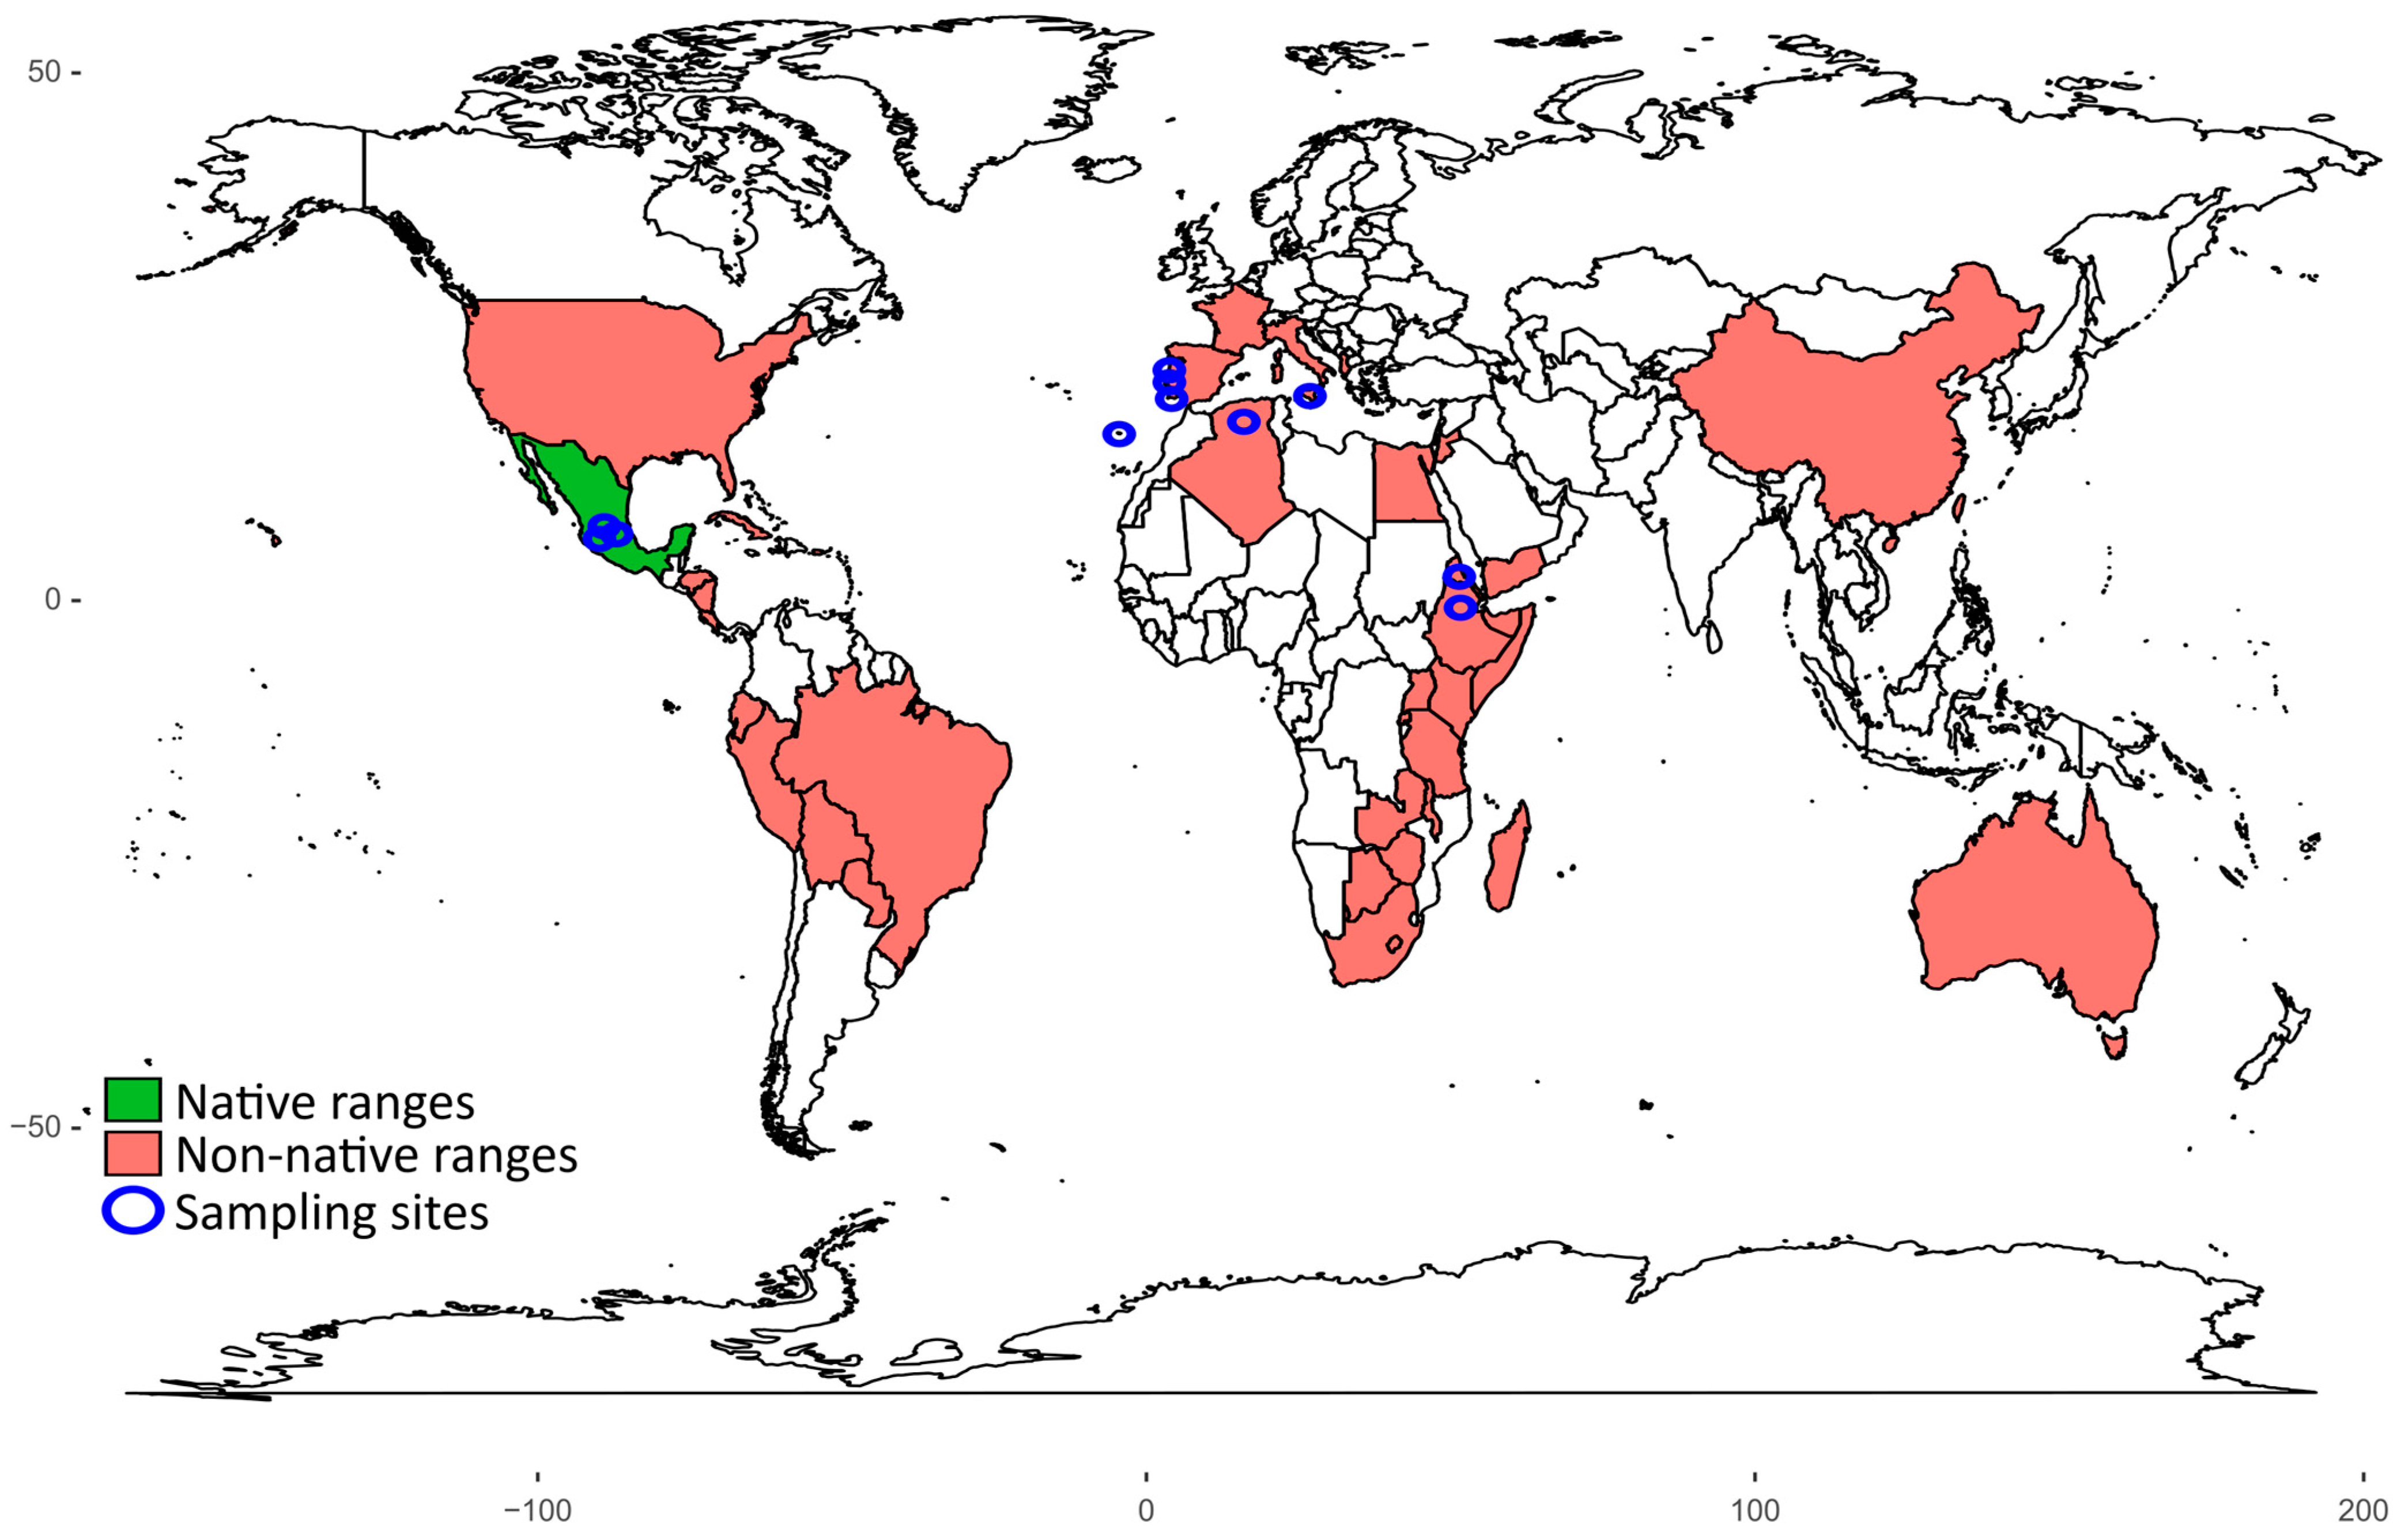
| Range | Area of Origin | Approximate Collection Coordinates | De Martonne Aridity Index (mm/°C) |
|---|---|---|---|
| Non-native | Algeria (Messaad) | 34.15212° N, 3.516667° E | 7 |
| Non-native | Eritrea (Asmara) | 15.23135° N, 38.89911° E | 19 |
| Non-native | Ethiopia (Mekele) | 14.24886° N, 39.43692° E | 22 |
| Non-native | Madeira | 32.64838° N, 16.96288° W | 22 |
| Non-native | Italy, “Gialla” (San Cono) | 37.29390° N, 14.37002° E | 17 |
| Non-native | Italy, “Bianca” (San Cono) | 37.29390° N, 14.37002° E | 17 |
| Non-native | Portugal (Portalegre) | 39.27290° N, 7.436978° W | 30 |
| Non-native | Portugal (Monforte da Beira) | 39.75232° N, 7.281897° W | 28 |
| Non-native | Portugal (Cacela-a-Velha) | 37.15625° N, 7.546661° W | 18 |
| Native | Mexico, “Pico Chulo” (Jalisco) | 21.68530° N, 101.4950° W | 18 |
| Native | Mexico, “Cristalina” (Jalisco) | 22.20615° N, 101.5752° W | 17 |
| Native | Mexico, “Cardona” (Jalisco) | 21.80851° N, 101.3619° W | 17 |
Disclaimer/Publisher’s Note: The statements, opinions and data contained in all publications are solely those of the individual author(s) and contributor(s) and not of MDPI and/or the editor(s). MDPI and/or the editor(s) disclaim responsibility for any injury to people or property resulting from any ideas, methods, instructions or products referred to in the content. |
© 2023 by the authors. Licensee MDPI, Basel, Switzerland. This article is an open access article distributed under the terms and conditions of the Creative Commons Attribution (CC BY) license (https://creativecommons.org/licenses/by/4.0/).
Share and Cite
Tesfay, Y.B.; Blaschke, A.; Ashley, N.; Portillo, L.; Scalisi, A.; Adli, B.; Kreyling, J. Increased Plasticity in Invasive Populations of a Globally Invasive Cactus. Plants 2023, 12, 3287. https://doi.org/10.3390/plants12183287
Tesfay YB, Blaschke A, Ashley N, Portillo L, Scalisi A, Adli B, Kreyling J. Increased Plasticity in Invasive Populations of a Globally Invasive Cactus. Plants. 2023; 12(18):3287. https://doi.org/10.3390/plants12183287
Chicago/Turabian StyleTesfay, Yohannes B., Annika Blaschke, Nathan Ashley, Liberato Portillo, Alessio Scalisi, Benziane Adli, and Juergen Kreyling. 2023. "Increased Plasticity in Invasive Populations of a Globally Invasive Cactus" Plants 12, no. 18: 3287. https://doi.org/10.3390/plants12183287
APA StyleTesfay, Y. B., Blaschke, A., Ashley, N., Portillo, L., Scalisi, A., Adli, B., & Kreyling, J. (2023). Increased Plasticity in Invasive Populations of a Globally Invasive Cactus. Plants, 12(18), 3287. https://doi.org/10.3390/plants12183287