Abstract
Trisomy harbouring an extra copy of the chromosome generally causes a variety of physical and intellectual disabilities in mammals but is an extremely rare and important genetic stock in plants. In this study, a spontaneous trisomy plant in a Chinese kale accession (Brassica oleracea var. alboglabra, CC, 2n = 18) that showed significantly smaller plant architecture when compared to other normal plants was found and subsequently confirmed by cytological analysis in which the chromosome set of 2n = 19 and abnormal chromosome behaviour were observed. Then, based on the gene expression deviation determined by RNA-seq, the extra chromosome copy in this trisomy was identified as chromosome C2 (TC2). Compared to normal plants, TC2 not only showed generally upregulated differentially expressed genes (DEGs) on chromosome C2 (97.21% of 573 DEGs in chromosome C2) but also exhibited a whole-genome expression perturbation, in which 1329 DEGs (69.87% of total DEGs) were observed along two-copy chromosomes (trans-effect). The genes in the high (gene expression value > 100) and medium (100 > gene expression value > 10) groups were more prone to decreased gene expression, but the genes in the low group (10 > gene expression value > 0.1) showed upregulated expression deviation. In addition, GO (Gene ontology) annotation analysis revealed that the upregulated DEGs in the trans-effect group were overrepresented by the genes involved in the response to stress category, while the downregulated DEGs in the trans-effect group were mostly enriched in pathways related to DNA synthesis. In conclusion, we think our results can provide important resources for genetic analysis in B. oleracea and show some novel insights for understanding trisomy plant biology.
1. Introduction
An aneuploid is an organism with an abnormal number of chromosomes that can occur due to errors in cell division during gametogenesis or early embryonic development, resulting in a loss or gain of one or more chromosomes [1,2,3]. Trisomy, as a common type of aneuploidy, is a genetic stock in which an individual has three copies of a particular chromosome instead of the normal two [4]. The extra chromosome generally results in an imbalance of chromosome material that can cause a variety of physical and intellectual disabilities. Therefore, trisomy with extra chromosomes generally shows delayed growth patterns, infertility, and other developmental abnormalities. In humans, some examples of trisomy disorders include Down syndrome (trisomy 21), Edwards syndrome (trisomy 18), and Patau syndrome (trisomy 13). Plants have a higher tolerance to these aneuploids than animals [5]. Based on different types of extra chromosomes, trisomy can be divided into primary, secondary, tertiary, and terminal trisomy in plants [6]. These trisomy plants can be advantageous to deciphering the gene dosage, trans-effect on gene expression, and the function of certain genes on these variant chromosomes. In particular, primary trisomy plants can be used to locate traits and linkage groups to extra chromosomes [7,8], which can be used as an important genetic stock to construct a physical map of genes [9,10,11]. In addition, researchers believe that trisomy in plants can also have implications for genetic diversity because the trisomic individuals in a population can add genetic variation, which can increase the adaptability and resilience of the population in changing environments [12,13,14].
A century ago, Blakeslee (1922) [15] first reported a complete set of primary trisomies in Jimson weed (Datura stramonium L., 2n = 24), in which the 12 trisomic plants showed obvious morphological differences from the diploid parent. After that, the trisomy plants were distinguished in many different plants, including maize (Zea mays L.) [16], Gossypium hirsutum L. [17], broad bean (Vicia faba L.) [18], rice (Oryza sativa L.) [14], Plantago lagopus L. [19], and Populus [6]. Seeds that were exposed to γ-rays have been reported to obtain trisomy in G. hirsutum L. [17]. Microspore culture is believed to be an effective method to generate different trisomy plantlets in some crops [20,21]. In addition, crosses between triploid and diploid species, which are attributed to the irregular segregation of chromosomes at meiosis in triploid parents, have been recognized as a purposeful method to obtain trisomy plants and have been successfully utilized in tomato (Solanum lycopersicum L.) [22], Z. mays L. [23], rice [24], P. lagopus L. [25], and Populus [6]. In addition, as trisomy in D. stramonium L., some trisomy plants which are not prone to take place can be identified in natural variations [26].
Recently, studies have reported that aneuploidy, including trisomy in plants, can affect gene expression that includes not only the genes on the extra chromosome (cis-effects) but also the genes on other normal chromosomes (trans-effects), leading to abundant changes in their phenotype [14,27,28,29,30,31]. Compared to the variations in ploidy, aneuploidy plants, including trisomy, generally produced much greater modulations of global gene expression [14,30,32,33]. Studies have shown that, compared to cis-acting effects on aneuploid chromosomes, trans-acting effects are quite prevalent in the majority of aneuploid organisms [34,35,36]; however, an exception was observed in yeast, in which very few trans-effects were observed in aneuploid yeast [37]. Recently, the work of Sun et al. [14] showed that trisomies in rice caused not only immediate trans-effects on gene expression in trisomy per se but also far-reaching effects on gene expression in their normal offspring.
As a species in the triangle of U [38], Brassica oleracea (CC, 2n = 18), which comprises many cultivars, such as cabbage, kalian, broccoli, cauliflower, kale, and collard greens, has been widely used as an important vegetable because it is rich in a variety of essential nutrients [38,39,40,41]. Intriguingly, a high frequency of trisomy was observed in the offspring of diploid progenitors in cauliflower [42], which resulted in considerable economic loss. However, to our knowledge, trisomy plants have not been observed in other cultivars of B. oleracea. In this study, a trisomy that was spontaneously generated in Kalian was detected. To identify the trisomy type and decipher the gene expression profile in this trisomy, RNA-seq was carried out. The results of RNA sequencing showed that the extra chromosome was C2. In addition, compared to diploid plants, a widespread trans-effect that was obviously overrepresented by upregulated DEGs associated with “response to stress” and by downregulated DEGs involved in “DNA synthesis” was observed. We believe that the trisomy in Chinese kale provides important resources for genetic analysis in B. oleracea and provides some insights for understanding trisomy plant biology.
2. Results
2.1. Cytological Analysis and Characteristics of the Trisomy Plant
In the spring of 2023, we found that a Chinese kale “Chijielan” plant showed obviously smaller architecture, smaller and vimineous leaves, and delayed flower time compared to other plants in the experimental field (Figure 1A,B). The flower of the variant plant (Figure 1C) was similar to that of these sister lines but showed weakened stamens (Figure 1D). The pollen staining ability of the variant plants (87.63% ± 1.24% and 96.57% ± 2.42% in variant and normal plants, respectively) was extremely significantly lower than that of normal plants (t test, p < 0.01) (Figure 1E,F). After checking the chromosome number of the variant plant, this plant had a chromosome set of 2n = 19 (Figure 1G), which showed an extra copy of a chromosome compared to the normal plant (2n = 18, Figure 1H), suggesting that this variant plant should be a trisomy. The explants from the trisomy were used to generate cloned plantlets using MS medium with 6-BA and NAA for further analysis.
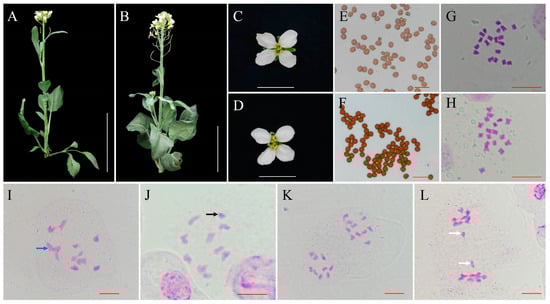
Figure 1.
Morphological analysis of the trisomy and normal B. oleracea plants. (A,B) Plant architectures of trisomy and normal B. oleracea plants at the flowering stage. Bar: 15 cm. (C,D) Flower phenotypes of trisomy and normal B. oleracea plants. Bar: 2 cm. (E,F) Pollen grain stainability of trisomy and normal B. oleracea plants. Bar 50 μm. (G,H) The chromosome number of trisomy (2n = 19) and normal plants (2n = 18). Bar: 10 μm. (I,J) PMCs of trisomy at diakinesis showed a dominant chromosome pair configuration of eight bivalents and a trivalent (blue arrow) and nine bivalents and a univalent (black arrow). Bar: 10 μm. (K,L) PMCs of trisomy at anaphase I showed chromosome segregation of 9:10, and lagging chromosomes (white arrows) exhibiting segregation of 9:9 were observed. Bar: 10 μm.
Then, we checked the chromosome behaviour of the trisomy in meiosis. A total of 67 pollen mother cells (PMCs) with trisomy at diakinesis (DI) were observed and analysed. Among these PMCs, 62.69% (42 PMCs) showed a dominant chromosome pair configuration (Figure 1I) of eight bivalents and a trivalent, whereas a small portion of PMCs (25 PMCs) had a configuration of nine bivalents and a univalent (Figure 1J). In addition, 72 PMCs of trisomy at anaphase I (AI) were observed. The majority of the PMCs (65 PMCs, 90.28%) at AI showed chromosome segregation ratios of 9:10 (Figure 1K). Only 9.72% of PMCs (7 PMCs) with lagging chromosomes exhibiting segregation of 9:9 were observed (Figure 1L).
2.2. Determination of the Genotype of the Trisomy Plant Using RNA-Seq
RNA-seq, which has been used to calculate gene expression profiles, has been demonstrated as a powerful method for determining the genotype of aneuploidy [30,32,43]. In this study, 41.0–65.4 million clean reads were obtained for each replicate with Q30 values of 95.12–95.46% after removing the adapters and trimming the low-quality reads. In addition, 93.09–93.71% clean reads were mapped to the reference genome (Table S1). To determine the extra chromosome in trisomy, the log2 values (FPKM values) of all expressed genes along all nine chromosomes were exhibited using box plots. We noticed that obviously increased gene expression was observed on chromosome C2 in the trisomy when compared to normal plants (Figure 2A), indicating that the extra chromosome is likely C2. To further confirm the result, the distribution of gene expression fold changes (log2-fold change) along each normal chromosome between trisomy and normal plants was determined and smoothed to measure the expression deviation (Figure 2B). The results showed that the genes along chromosome C2 were generally highly expressed, confirming that the trisomy genotype was Trisomy C2, abbreviated as TC2 in this study.
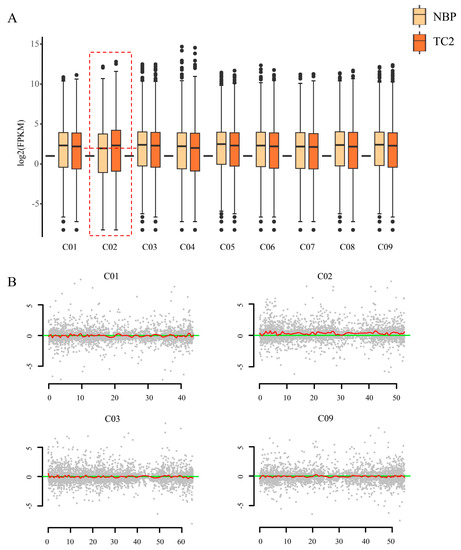
Figure 2.
Determination of the extra chromosome in trisomy. (A) Box plot of log2(FPKM) values of the total expressed genes (FPKM > 0) located on each of chromosomes in NBP and TC2. Chromosome C2 in trisomy showed a significantly high median value of gene expression (dashed box). (B) Gene expression analysis performed on each of chromosomes to measure the expression deviation. Red lines denote the smoothed distribution for the differentially expressed genes in these selected chromosomes. The y axis represents the log2(fold change) value of FPKM between the NBP and TC2. The x axis represents the sorted positions of genes on these chromosomes. Taking chromosomes C01, C02, C03, and C09 as examples.
2.3. DEGs Determination in Trisomy Plants and qRT–PCR Validation
The false discovery rate (FDR) with q < 0.05 and a 1.5 fold change in gene expression were used as a cut-off to determine DEGs in this study, taking into consideration that chromosome C2 in TC2 had a 1.5 fold change in normal B. oleracea plants (abbreviated as NBP in the RNA-seq analysis). In total, 1902 DEGs, comprising 1219 upregulated and 683 downregulated DEGs, were detected in the comparison of NBP vs. TC2. Then, qRTPCR validation of ten selected DEGs was used to confirm the accuracy of RNA-seq, and the results were consistent with those of RNA-seq (Figure 3). The actin gene (LOC106295461) was used as an internal reference, which was stably expressed both in NBP and TC2 (Figure S1).
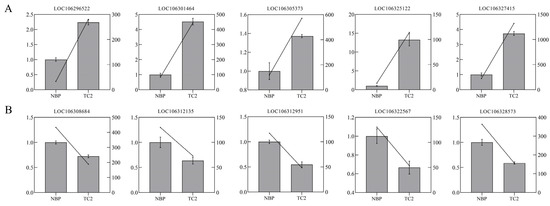
Figure 3.
qRT–PCR verification of the expression levels of 10 randomly selected DEGs. (A) The expression levels of five randomly selected up-regulated genes. (B) The expression levels of five down-regulated genes were randomly selected. The left y-axis represents the relative expression level, and the right y-axis represents the results of RNA-seq (FPKM). The box with error bars indicates the result of qRT–PCR, and the oblique line represents the FPKM value of gene expression.
2.4. Cis- and Trans-Effect DEGs in TC2
Among these DEGs, a total of 573 DEGs, accounting for less than one-third (30.13%) of the total DEGs, were caused by cis-effects, which were attributed to the extra chromosome C2 (Table 1). In addition, the expression level of the majority (557 DEGs, 97.21% of cis-effect DEGs) of the cis-effect DEGs responded to this copy number change, suggesting that these genes showed dose effects. However, 16 DEGs along variant chromosome C2 were downregulated, showing the reverse gene dosage. Additionally, we noticed that TC2 exhibited prevailing trans-effect DEGs after trimming the DEGs along chromosome C2, in which approximately 70% of the total DEGs (1329 DEGs) were along the whole genome. Among these trans-effect DEGs, 667 downregulated DEGs (50.19%) and comparable upregulated DEGs (662 DEGs, 49.81%) were detected (χ2-test, p > 0.05).

Table 1.
Summary of cis- and trans-effect DEGs in the comparison of NBP vs. TC2.
Then, we computed the proportion of trans-effect DEGs in the total genes of each of the normal chromosomes to detect whether trans-effect DEGs randomly or partially affected each chromosome of aneuploidy in TC2. The results (Table 2) showed that 116–224 DEGs per chromosome, occupying 2.15–3.54% of the total genes of each of the chromosomes, were observed. Briefly, chromosome C1 gave rise to the highest proportion of DEGs (179 DEGs, 3.54%), followed by comparable C7 (191 DEGs, 3.51%), C4 (185 DEGs, 3.09%), and C9 (188 DEGs, 3.02%) (χ2-test, p > 0.05). Chromosomes C3 (224 DEGs, 2.79%), C8 (127 DEGs, 2.41%), and C5 (119 DEGs, 2.15%) showed relatively few DEGs, indicating that these chromosomes were less likely to be affected in TC2. Moreover, the upregulated and downregulated DEGs along each chromosome were comparable (χ2-test, p > 0.05), except on chromosomes C1 and C4, in which dominant downregulated DEGs were detected (χ2-test, p < 0.05).
Table 2.
Detailed information on trans-effected dysregulated genes along each of the normal chromosomes in the comparison of NBP vs. TC2.
According to the work of Zhu et al. [32], we divided the genes along normal chromosomes into low (0.1 < FPKM < 10), medium (10 < FPKM < 100), and high (FPKM > 100) groups based on the gene expression values in normal B. oleracea. In total, 21,428, 9433, and 1269 genes could be classified into low, medium, and high groups, respectively (Table 3). In addition, 922, 322, and 47 DEGs that were not significantly different were detected among these groups. Intriguingly, we noticed that upregulated DEGs were significantly higher than downregulated DEGs in the low group (χ2 test, p < 0.05), whereas the downregulated DEGs were extremely dominant in the medium group (χ2 test, p < 0.01), and the downregulated DEGs were higher than upregulated DEGs but not significant in the high group (Table 3; Figure 4A). Then, the whole gene expression fold-change density of NBP vs. TC2 for all groups was determined to check whether the different gene groups showed biased gene expression. The results (Figure 4B) showed that genes in the low group were prone to high expression in the comparison of NBP vs. TC2, whereas genes in the medium and high groups were biased towards downregulation.
Table 3.
The ratio of DEGs distributed in differentially expressed gene level groups.
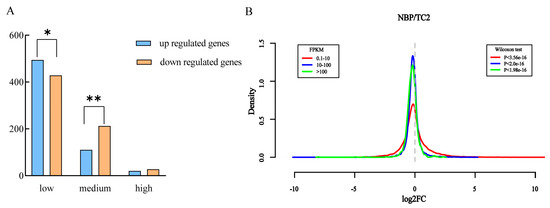
Figure 4.
Impact of extra chromosomes on gene expression changes in different gene expression groups. (A) The gene numbers of different expression groups and trans-effect DEGs in different gene expression groups. “*” and “**” indicate that the DEG groups were significantly different at the levels of p < 0.05 and p < 0.01 (χ2 test). (B) The density of the frequency distribution of log2 (fold change) in NBP vs. TC2 showed that different gene groups exhibited inconsistent response patterns to extra chromosome C2. The x-axis represents the log2 (fold-change) in gene expression levels between the NBP and euploid TC2 cells in three gene groups, and the y-axis represents the frequency distribution of log2 (fold-change) (Wilcoxon test, q < 0.05).
2.5. GO Analysis of Cis- and Trans-Effect DEGs
Based on the GO annotation analysis (Figure 5), the upregulated DEGs caused by the cis-effect were mainly involved in functions related to catabolic processes (Figure 5A), such as “protein-containing complex”, “cellular macromolecule catabolic process”, “modification-dependent macromolecule catabolic process”, and “modification-dependent protein catabolic process”. The few downregulated DEGs caused by the cis-effect were mainly involved in “photosynthesis, dark reaction”, “reductive pentose-phosphate cycle”, and “photorespiration” (Figure 5B), suggesting that these downregulated DEGs were related to photosynthesis. Moreover, the upregulated DEGs in the trans-effect group were over-represented by the genes involved in response to stress (Figure 5C), such as “response to wounding”, “response to oxygen-containing compound”, “response to inorganic substance”, and “response to chemical”. The downregulated DEGs in the trans-effect group were mainly involved in “protein–DNA complex”, “DNA packaging complex”, “nucleosome”, and “structural constituent of chromatin” (Figure 5D), indicating that significantly impaired synthesis of DNA was caused by aneuploidy in TC2.
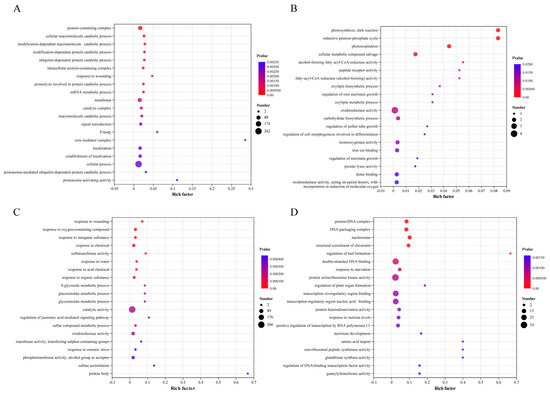
Figure 5.
Top 20 GO enrichment functions of trans-effect and cis-effect DEGs. (A,B) Top 20 GO enrichment functions enriched by upregulated and downregulated cis-effect DEGs, respectively. (C,D) Top 20 GO enrichment functions overrepresented by upregulated and downregulated trans-effect DEGs. The x-axis represents the ratio of the number of DEGs (sample number) enriched (based on the rich factor) in a term to the number of annotated DEGs (background number), and the y-axis represents the term name.
3. Discussion
Trisomic plants generally show a deficient phenotype but can be advantageous to genetic diversity because the trisomic individuals in a population can add genetic variations that likely increase the adaptability and resilience of the population in changing environments [1,3,6,12,32,42]. Recently, researchers detected a high frequency of trisomy in cauliflower, a cultivar variant of B. oleracea; however, the types of these trisomies have not been further identified [42]. Herein, a trisomic plant in Kalian was occasionally obtained, which was subsequently distinguished as trisomy C2 by RNA-seq results. RNA-seq, used to assess gene expression profiles along variant chromosomes, has been demonstrated to be an effective method to identify the type of aneuploidy [14,32,42,43] because the majority of gene expression profiles along variant chromosomes show changes in accordance with copy number changes in chromosomes. With the RNA-seq data, a nullisomic in B. napus [30] and several trisomies in rice [14] were successfully determined. Moreover, trisomic variations are generally homogeneous, resulting in challenges in developing molecular markers to identify trisomy.
Viable aneuploidy generally shows a severely deficient phenotype, likely attributed to disruption of the stoichiometric regulatory network of gene expression [5,30,42,44]. Only trisomy 19 in mice, in which the extra chromosome is the smallest autosome, can evade embryonic lethality [45]. In humans, Down’s syndrome, which is caused by the whole or part of an extra copy of chromosome 21, the smallest autosome, is the most common chromosomal abnormality and the only chromosome syndrome which allows those affected to survive into adulthood [46,47,48]. It is likely that the variant chromosome harbouring fewer genes survives more easily in mammals. Plants have better aneuploidy tolerance than mammals [5,30,41]. In this study, the trisomy plant was eventually demonstrated to harbour a third copy of chromosome C2, which is not the smallest chromosome in B. oleracea. Intriguingly, a nullisomic of chromosome C2 was obtained in natural B. napus during interspecific hybridization between B. napus and Capsella bursa-pastoris [30,49]. In addition, the work of Xiong et al. [50] showed that more than 50% of the lines in the progeny of resynthesized B. napus were aneuploid on chromosome C2. These results indicate that chromosome C2 is likely prone to alteration.
Previous studies have shown that abnormal chromosomes in aneuploid can disrupt the balance of gene expression, causing gene expression perturbation across the whole normal genome (trans-effect), thereby reducing the health and viability of the organism [3,6,14,30,31]. Several studies involving gene expression in different aneuploid organisms showed that the cis-effect greatly exceeded the trans-effect [14,30,31]. This finding can be explained by the hypothesis of genome balance because the strict stoichiometry of all dosage-sensitive genes is disturbed by the altered chromosome in aneuploidy [27,50,51,52]. In this study, a dominant trans-effect (approximately 70%) was also observed in trisomic B. oleracea, reconfirming the reliability of the hypothesis of genome balance. Moreover, we noticed that the trans-effect upregulated DEGs were mainly enriched in the functional terms associated with response to stress. Interestingly, a study involving different aneuploidies of yeast showed a signature characteristic of the Environmental Stress Response (ESR) of gene expression [37]. Similar results were also observed in a recently reported trisomy in rice, in which the upregulated DEGs were reported to mainly associate with various types of responses to stress [14]. Researchers believe that aneuploidy in plants can also have implications for adaptability because aneuploid individuals in a population can add genetic variation, rapidly responding to changing environments [6,14,32,42,53]. The GO results of trans-effect upregulated DEGs in this study likely support the possibility of the advantages of trisomy in responding to environmental changes. In addition, different gene expression biases were detected in TC2, in which the genes belonging to the low group were more likely to be upregulated, while genes in the medium and high groups were more likely to be downregulated. Similar results were observed in aneuploidy rice [14], B. napus [30], and B. rapa [32], and even in Down’s syndrome [46,47,48], suggesting that this gene expression bias should be a signature characteristic of the transcriptional response in aneuploidy.
4. Materials and Methods
4.1. Plant Materials
A Chinese kale accession, “Chijielan”, which has been self-crossed for more than ten generations, was used in this study. The plants for RNA sequencing were cultured in flowerpots (48 cm in diameter and 30 cm in depth, humus soil, PINDSTRUP, Ryomgård, Denmark) in a greenhouse under a 16:8 light–dark cycle, a stationary temperature of 22 °C, and a relative humidity of 40%. The plants for cytological and phenotypic analyses were cultured in October 2022 in the experimental field of Guizhou Normal University, Guiyang, China for 120 days.
4.2. Cytological Analysis
To count the chromosome number of tested plants, young ovaries were collected from trisomic and normal plants and then treated with 2 mM 8-hydroxyquinoline for 3 h in an incubator at a stationary temperature of 22 °C. Then, these ovaries were stored in Carnoy’s solution (3:1 ethanol:glacial acetic) for further analysis. To check the chromosome behaviour of trisomy, the trisomic cloned plantlets were first generated using MS medium with 1.0 mg/L 6-BA (6-benzyladenine) and 0.25 mg/L NAA (naphthylacetic acid), and then young flower buds from trisomic cloned plantlets were collected and continuously treated with fresh Carnoy’s solution until the flower buds were completely discoloured. Cytological analysis was carried out based on the work of Li et al. [54], and the images were captured by a CCD (Charge Coupled Device) camera (N80i, Nikon, Tokyo, Japan).
To check the pollen viability of the tested plants, more than 300 pollen grains from trisomic and normal plants were stained with 1% acetocarmine and then screened using a microscope with a CCD camera. More than three plants for trisomic and normal genotypes were used.
4.3. RNA Extraction, c-DNA Library Construction, and RNA Sequencing
For RNA extraction, the third leaves that were newly expanded from trisomic and normal plants were gathered and immediately stored in liquid nitrogen. The total RNA was treated with DNAse (CWBIO, Taizhou, China) to remove DNA contamination. Three biological replicates for trisomic and normal plants were prepared. The leaves were fully ground in a mortar with liquid nitrogen, and approximately 0.1 g of powdered leaves was used to isolate the total RNA using a commercial RNA extraction kit (EASYspin Plant RNA kit, Aidlab, Beijing, China) according to the instructions. Agarose electrophoresis was used to check the quality of the extracted RNA, and an Agilent 2100 instrument (Illumina, San Diego, CA, USA) was used to measure RNA integrity (RIN value). The RIN values of RNA ≥ 8.0 were used to construct the c-DNA library according to the TruSeq RNA Sample Prep v2 protocol (Illumina, San Diego, CA, USA). A total of six c-DNA libraries were constructed and sequenced using the Illumina NovaSeq 6000 platform.
4.4. Differentially Expressed Genes (DEGs) Determination
The Illumina sequencing platform generated 150-bp paired-end reads. Then, Trimmomatic version 0.33 was employed to obtain clean reads after removing adapters, poly-N sequences, and low-quality reads (length of reads < 30 bp). These clean reads were mapped to the B. oleracea genome [55] using Hisat2 v2.0.5 with default parameters. The FPKM values, which were calculated using RSEM with default parameters (fragments per kilobase of exon per million fragments mapped), were employed to determine gene expression levels. DEGs between the control and treatment B. oleracea were determined using R-project based on Benjamini and Hochberg’s approach (cut-off: p < 0.05 and fold changes > 1.5). The raw sequence data are available in NCBI-SRA (https://www.ncbi.nlm.nih.gov/sra, accessed on 26 July 2023) under the accession number PRJNA998726.
4.5. Real-Time PCR (qRT–PCR) Analysis
To detect the reliability of RNA sequencing, the gene expression levels of the RNA samples were also determined by qRT–PCR. A total of ten DEGs, including five upregulated and five downregulated genes, were randomly selected for qRT–PCR validation. The primers of the selected DEGs and actin (Table S2) were designed by utilizing NCBI Primer-Blast. First-strand cDNA synthesis was performed using a HiFiScript gDNA Removal cDNA Synthesis Kit (CWBIO, Taizhou, China). The actin gene was used as an internal housekeeping gene control. A 10 μL qRT–PCR mixture was prepared by following the protocol for the SYBR-Green fluorescent reagents (TIANGEN Biotech, Beijing, China): 5 μL of 2 × SYBR® Premix Ex Taq II, 0.3 μL each of the forwards and reverse primers, 1 μL (69 ng/μL) of cDNA, and 3.2 μL of RNase-Free ddH2O. The qRT-PCR thermal cycling profile consisted of 95 °C for 3 min, followed by 40 cycles of 95 °C for 5 s and 60 °C for 15 s.
5. Conclusions
In general, trisomic variation is quite rare in nature. In this study, we found a trisomic plant in B. oleracea and subsequently identified the extra chromosome as C2 using cytological analysis and RNA-seq data. Gene expression perturbation across the whole genome was observed in this trisomy (TC2), indicating that the genome balance was severely impacted by the extra chromosome. In addition, GO annotation analysis showed that the downregulated trans-effect DEGs were mostly overrepresented by the functions of DNA synthesis. Moreover, the upregulated trans-effect DEGs were mainly enriched in functions associated with the response to stress, suggesting the possible advantages of trisomy in responding to environmental changes. We believe that this trisomy not only provides an important resource for genetic analysis in B. oleracea but also provides some insights into the regulation and functional interactions of genes in the B. oleracea aneuploid genome.
Supplementary Materials
The following supporting information can be downloaded at: https://www.mdpi.com/article/10.3390/plants12183199/s1, Figure S1: qRT–PCR results of actin gene. Table S1: Summary of clean reads of TC2 and NBP aligned to the reference genome (B. oleracea); Table S2: Primers of selected DEGs used in verification of qRT-PCR.
Author Contributions
Conceptualization, B.Z. and M.C.; methodology, J.Y. (Jie Yu); software, M.H.; validation, B.Z. and M.C.; investigation, J.Y. (Junxing Yu); resources, Q.F.; data curation, J.Y. (Jie Yu); writing—original draft preparation, Q.F. and J.Y. (Junxing Yu); writing—review and editing, B.Z.; visualization, H.W.; supervision, L.G.; project administration, X.D.; funding acquisition, M.C. All authors have read and agreed to the published version of the manuscript.
Funding
This work was supported by the National Natural Science Foundation of China (NSFC, Grant No. 32060463 and 32260460), Guizhou Provincial Basic Research Program (Natural Science), grant number ZK [2023] YB272, and The Scientific and Technological Key Program of Guizhou province (No. Qiankehezhicheng [2022] Key 031).
Data Availability Statement
Not applicable.
Conflicts of Interest
The authors declare no conflict of interest.
References
- Birchler, J.A.; Veitia, R.A. Gene balance hypothesis: Connecting issues of dosage sensitivity across biological disciplines. Proc. Natl. Acad. Sci. USA 2012, 109, 14746–14753. [Google Scholar] [CrossRef] [PubMed]
- Torres, E.M.; Williams, B.R.; Tang, Y.C.; Amon, A. Thoughts on Aneuploidy. Cold Spring Harbor Symp. Quant. Biol. 2010, 75, 445. [Google Scholar] [CrossRef] [PubMed]
- Chen, Y.; Chen, S.; Li, K.; Zhang, Y.; Huang, X.; Li, T.; Wu, S.; Wang, Y.; Carey, L.B.; Qian, W. Overdosage of Balanced Protein Complexes Reduces Proliferation Rate in Aneuploid Cells. Cell Syst. 2019, 9, 129–142.e125. [Google Scholar] [CrossRef] [PubMed]
- Blakeslee, A.F.; Belling, J.; Farnham, M.E. Chromosomal Duplication and Mendelian Phenomena in Datura Mutants. Science 1920, 52, 388–390. [Google Scholar] [CrossRef]
- Siegel, J.J.; Amon, A. New insights into the troubles of aneuploidy. Annu. Rev. Cell. Dev. Biol. 2012, 28, 189–214. [Google Scholar] [CrossRef]
- Sang, Y.; Kong, B.; Do, P.U.; Ma, L.; Du, J.; Li, L.; Cheng, X.; Zhao, Y.; Zhou, Q.; Wu, J. Microsporogenesis in the triploid hybrid ‘Beilinxiongzhu 1#’and detection of primary trisomy in 2× 3× Populus hybrids. BMC Plant Biol. 2023, 23, 177. [Google Scholar] [CrossRef]
- Cregan, P.; Kollipara, K.; Xu, S.; Singh, R.; Fogarty, S.; Hymowitz, T. Primary trisomics and SSR markers as tools to associate chromosomes with linkage groups in soybean. Crop Sci. 2001, 41, 1262–1267. [Google Scholar] [CrossRef]
- Zou, J.; Singh, R.; Lee, J.; Xu, S.; Cregan, P.; Hymowitz, T. Assignment of molecular linkage groups to soybean chromosomes by primary trisomics. Theor. Appl. Genet. 2003, 107, 745–750. [Google Scholar] [CrossRef]
- Gardner, M.; Hymowitz, T.; Xu, S.; Hartman, G. Physical map location of the Rps1-k allele in soybean. Crop Sci. 2001, 41, 1435–1438. [Google Scholar] [CrossRef]
- Wagenvoort, M. Spontaneous structural rearrangements in Solanum phureja Juz. et Buk. 2. Meiotic behaviour and identification of interchange chromosomes using primary trisomics. Genome 1995, 38, 140–147. [Google Scholar] [CrossRef]
- Miura, H.; Sugawara, A. Dosage effects of the three Wx genes on amylose synthesis in wheat endosperm. Theor. Appl. Genet. 1996, 93, 1066–1070. [Google Scholar] [CrossRef] [PubMed]
- Cai, X.; Xu, S.S. Meiosis-driven genome variation in plants. Curr. Genomics 2007, 8, 151–161. [Google Scholar] [CrossRef] [PubMed]
- Henry, I.M.; Dilkes, B.P.; Young, K.; Watson, B.; Wu, H.; Comai, L. Aneuploidy and genetic variation in the Arabidopsis thaliana triploid response. Genetics 2005, 170, 1979–1988. [Google Scholar] [CrossRef] [PubMed]
- Sun, S.; Liu, K.; Xue, C.; Hu, Y.; Yu, H.; Qi, G.; Chen, J.; Li, X.; Zhao, X.; Gong, Z. Genome-Wide Effects on Gene Expression Between Parental and Filial Generations of Trisomy 11 and 12 of Rice. Rice 2023, 16, 17. [Google Scholar] [CrossRef]
- Blakeslee, A.F. Variations in Datura due to changes in chromosome number. Am. Nat. 1922, 56, 16–31. [Google Scholar] [CrossRef][Green Version]
- Auger, D.; Birchler, J. Maize tertiary trisomic stocks derived from BA translocations. J. Hered. 2002, 93, 42–47. [Google Scholar] [CrossRef]
- Baomin, H.; Tianzhen, Z.; Jiaju, P. Studies of trisomic plants in upland cotton I. origin, cytological identification and their phenotypes. Zuo Wu Xue Bao 1996, 22, 147–151. [Google Scholar]
- Xu, S.; Singh, R.; Kollipara, K.; Hymowitz, T. Primary trisomics in soybean: Origin, identification, breeding behavior, and use in linkage mapping. Crop Sci. 2000, 40, 1543–1551. [Google Scholar] [CrossRef]
- Sharma, P.; Koul, A. Genetic diversity among Plantagos III. Primary trisomy in Plantago lagopus L. Genetica 1984, 64, 135–138. [Google Scholar] [CrossRef]
- Qiren, C.; Zhenhua, Z.; Yuanhua, G. Cytogenetical analysis on aneuploids obtained from pollenclones of rice (Oryza sativa L.). Theor. Appl. Genet. 1985, 71, 506–512. [Google Scholar] [CrossRef]
- Chu, Q.; Zhang, C.; Zheng, Z. Anther culture of rice tetraploid pollen plants and chromosome variation in regenerated plants. Chin. Bull. Bot 1985, 3, 40–43. [Google Scholar]
- Sree Ramulu, K.; Carluccio, F.; De Nettancourt, D.; Devreux, M. Trisomics from triploid-diploid crosses in self-incompatible Lycopersicum peruvianum: I. Essential features of aneuploids and of self-compatible trisomics. Theor. Appl. Genet. 1977, 50, 105–119. [Google Scholar] [CrossRef]
- Yan, X.; Cheng, M.; Li, Y.; Wu, Z.; Li, Y.; Li, X.; He, R.; Yang, C.; Zhao, Y.; Li, H. Tripsazea, a novel trihybrid of Zea mays, Tripsacum dactyloides, and Zea perennis. G3 Genes Genomes Genet. 2020, 10, 839–848. [Google Scholar] [CrossRef] [PubMed]
- Khun, L.H.; Miyaji, S.; Motomura, K.; Murayama, S.; Adaniya, S.; Nose, A. Trisomic analysis of new gene for late heading in rice, Oryza sativa L. Euphytica 2006, 151, 235–241. [Google Scholar] [CrossRef]
- Dhar, M.; Koul, A.; Langer, A. Genetic diversity among Plantagos: 17. A novel trisomic in Plantago lagopus. Theor. Appl. Genet. 1990, 79, 216–218. [Google Scholar] [CrossRef]
- Sharma, P.; Langer, A.; Koul, A. Genetic diversity among Plantagos V. Transmission of the additional chromosome in a triplo-4 individual of Plantago lagopus L. Genetica 1985, 67, 131–135. [Google Scholar] [CrossRef]
- Birchler, J.A.; Veitia, R.A. The gene balance hypothesis: From classical genetics to modern genomics. The Plant Cell 2007, 19, 395–402. [Google Scholar] [CrossRef] [PubMed]
- Huettel, B.; Kreil, D.P.; Matzke, M.; Matzke, A.J. Effects of aneuploidy on genome structure, expression, and interphase organization in Arabidopsis thaliana. PLoS Genet. 2008, 4, e1000226. [Google Scholar] [CrossRef]
- Malone, J.H.; Cho, D.-Y.; Mattiuzzo, N.R.; Artieri, C.G.; Jiang, L.; Dale, R.K.; Smith, H.E.; McDaniel, J.; Munro, S.; Salit, M. Mediation of Drosophilaautosomal dosage effects and compensation by network interactions. Genome Biol. 2012, 13, R28. [Google Scholar] [CrossRef]
- Zhu, B.; Shao, Y.; Pan, Q.; Ge, X.; Li, Z. Genome-wide gene expression perturbation induced by loss of C2 chromosome in allotetraploid Brassica napus L. Front. Plant Sci. 2015, 6, 763. [Google Scholar] [CrossRef]
- Zhu, B.; Xiang, Y.; Zeng, P.; Cai, B.; Huang, X.; Ge, X.; Weng, Q.; Li, Z. Genome-wide gene expression disturbance by single A1/C1 chromosome substitution in Brassica rapa restituted from natural B. napus. Front. Plant Sci. 2018, 9, 377. [Google Scholar] [CrossRef] [PubMed]
- Zhu, B.; Pan, Q.; Huo, D.; Zeng, P.; Cai, B.; Ge, X.; Li, Z. Transcriptional aneuploidy responses of Brassica rapa-oleracea monosomic alien addition lines (MAALs) derived from natural allopolyploid B. napus. Front. Genet. 2019, 10, 67. [Google Scholar]
- Hou, J.; Shi, X.; Chen, C.; Islam, M.S.; Johnson, A.F.; Kanno, T.; Huettel, B.; Yen, M.-R.; Hsu, F.-M.; Ji, T. Global impacts of chromosomal imbalance on gene expression in Arabidopsis and other taxa. Proc. Natl. Acad. Sci. USA 2018, 115, E11321–E11330. [Google Scholar] [CrossRef] [PubMed]
- Zhang, A.; Li, N.; Gong, L.; Gou, X.; Wang, B.; Deng, X.; Li, C.; Dong, Q.; Zhang, H.; Liu, B. Global analysis of gene expression in response to whole-chromosome aneuploidy in hexaploid wheat. Plant Physiol. 2017, 175, 828–847. [Google Scholar] [CrossRef] [PubMed]
- Cooper, J.L.; Birchler, J.A. Developmental impact on trans-acting dosage effects in maize aneuploids. Genesis 2001, 31, 64–71. [Google Scholar] [CrossRef] [PubMed]
- Do, C.; Xing, Z.; Yu, Y.E.; Tycko, B. Trans-acting epigenetic effects of chromosomal aneuploidies: Lessons from Down syndrome and mouse models. Epigenomics 2017, 9, 189–207. [Google Scholar] [CrossRef]
- Torres, E.M.; Sokolsky, T.; Tucker, C.M.; Chan, L.Y.; Boselli, M.; Dunham, M.J.; Amon, A. Effects of aneuploidy on cellular physiology and cell division in haploid yeast. Science 2007, 317, 916–924. [Google Scholar] [CrossRef]
- Nagaharu, U.; Nagaharu, N. Genome analysis in Brassica with special reference to the experimental formation of B. napus and peculiar mode of fertilization. Jpn. J. Bot 1935, 7, 389–452. [Google Scholar]
- Cheng, F.; Wu, J.; Cai, C.; Fu, L.; Liang, J.; Borm, T.; Zhuang, M.; Zhang, Y.; Zhang, F.; Bonnema, G. Genome resequencing and comparative variome analysis in a Brassica rapa and Brassica oleracea collection. Sci. Data 2016, 3, 160119. [Google Scholar] [CrossRef]
- Mageney, V.; Neugart, S.; Albach, D.C. A guide to the variability of flavonoids in Brassica oleracea. Molecules 2017, 22, 252. [Google Scholar] [CrossRef]
- Yu, J.; Lei, S.; Fang, S.; Tai, N.; Yu, W.; Yang, Z.; Gu, L.; Wang, H.; Du, X.; Zhu, B. Identification, Characterization, and Cytological Analysis of Several Unexpected Hybrids Derived from Reciprocal Crosses between Raphanobrassica and Its Diploid Parents. Plants 2023, 12, 1875. [Google Scholar] [CrossRef] [PubMed]
- Ji, X.; Lelivelt, C.; Wijnker, E.; de Jong, H. Is partial desynapsis in cauliflower (Brassica oleracea L. var. botrytis) pollen mother cells linked to aneuploidy in the crop? Euphytica 2022, 218, 79. [Google Scholar] [CrossRef]
- Griffiths, J.A.; Scialdone, A.; Marioni, J.C. Mosaic autosomal aneuploidies are detectable from single-cell RNAseq data. BMC Genom. 2017, 18, 904. [Google Scholar] [CrossRef] [PubMed]
- Henry, I.M.; Dilkes, B.P.; Miller, E.S.; Burkart-Waco, D.; Comai, L. Phenotypic consequences of aneuploidy in Arabidopsis thaliana. Genetics 2010, 186, 1231–1245. [Google Scholar] [CrossRef]
- Lorke, D. Developmental characteristics of trisomy 19 mice. Cells Tissues Organs 1994, 150, 159–169. [Google Scholar] [CrossRef]
- Aivazidis, S.; Coughlan, C.M.; Rauniyar, A.K.; Jiang, H.; Liggett, L.A.; Maclean, K.N.; Roede, J.R. The burden of trisomy 21 disrupts the proteostasis network in Down syndrome. PLoS ONE 2017, 12, e0176307. [Google Scholar] [CrossRef]
- Mowery, C.T.; Reyes, J.M.; Cabal-Hierro, L.; Higby, K.J.; Karlin, K.L.; Wang, J.H.; Kimmerling, R.J.; Cejas, P.; Lim, K.; Li, H. Trisomy of a Down syndrome critical region globally amplifies transcription via HMGN1 overexpression. Cell Rep. 2018, 25, 1898–1911.e1895. [Google Scholar] [CrossRef] [PubMed]
- Cejas, R.B.; Tamano-Blanco, M.; Blanco, J.G. Analysis of the intracellular traffic of IgG in the context of Down syndrome (trisomy 21). Sci. Rep. 2021, 11, 10981. [Google Scholar] [CrossRef]
- Chen, H.-F.; Wang, H.; Li, Z.-Y. Production and genetic analysis of partial hybrids in intertribal crosses between Brassica species (B. rapa, B. napus) and Capsella bursa-pastoris. Plant Cell Rep. 2007, 26, 1791–1800. [Google Scholar] [CrossRef] [PubMed]
- Xiong, Z.; Gaeta, R.T.; Pires, J.C. Homoeologous shuffling and chromosome compensation maintain genome balance in resynthesized allopolyploid Brassica napus. Proc. Natl. Acad. Sci. USA 2011, 108, 7908–7913. [Google Scholar] [CrossRef]
- Birchler, J.A.; Veitia, R.A. The Gene Balance Hypothesis: Dosage Effects in Plants. In Plant Epigenetics and Epigenomics: Methods and Protocols; Springer: Cham, Switzerland, 2014; pp. 25–32. [Google Scholar]
- Shi, X.; Yang, H.; Chen, C.; Hou, J.; Ji, T.; Cheng, J.; Birchler, J.A. Effect of aneuploidy of a non-essential chromosome on gene expression in maize. Plant J. 2022, 110, 193–211. [Google Scholar] [CrossRef] [PubMed]
- Oleszczuk, S.; Rabiza-Swider, J.; Zimny, J.; Lukaszewski, A.J. Aneuploidy among androgenic progeny of hexaploid triticale (X Triticosecale Wittmack). Plant Cell Rep. 2011, 30, 575–586. [Google Scholar] [CrossRef] [PubMed][Green Version]
- Li, Z.; Liu, H.; Luo, P. Production and cytogenetics of intergeneric hybrids between Brassica napus and Orychophragmus violaceus. Theor. Appl. Genet. 1995, 91, 131–136. [Google Scholar] [CrossRef] [PubMed]
- Parkin, I.A.; Koh, C.; Tang, H.; Robinson, S.J.; Kagale, S.; Clarke, W.E.; Town, C.D.; Nixon, J.; Krishnakumar, V.; Bidwell, S.L. Transcriptome and methylome profiling reveals relics of genome dominance in the mesopolyploid Brassica oleracea. Genome Biol. 2014, 15, R77. [Google Scholar] [CrossRef] [PubMed]
Disclaimer/Publisher’s Note: The statements, opinions and data contained in all publications are solely those of the individual author(s) and contributor(s) and not of MDPI and/or the editor(s). MDPI and/or the editor(s) disclaim responsibility for any injury to people or property resulting from any ideas, methods, instructions or products referred to in the content. |
© 2023 by the authors. Licensee MDPI, Basel, Switzerland. This article is an open access article distributed under the terms and conditions of the Creative Commons Attribution (CC BY) license (https://creativecommons.org/licenses/by/4.0/).