

Changes in Profiles of Classes and of Individual Polyphenols in Leaves of Spiraea chamaedryfolia and Spiraea media along an Altitudinal Gradient


Abstract
:1. Introduction
2. Results and Discussion
3. Materials and Methods
3.1. Plant Material
3.2. Preparation of the Extract
3.3. Determination of the Set and Levels of Individual PCs by High-Performance Liquid Chromatography (HPLC)
3.4. Statistical Analysis
4. Conclusions
Author Contributions
Funding
Data Availability Statement
Acknowledgments
Conflicts of Interest
References
- Körner, C.; Kèorner, C. Alpine Plant Life: Functional Plant Ecology of High Mountain Ecosystems, 2nd ed.; Springer: Berlin/Heidelberg, Germany, 1999. [Google Scholar]
- Asensio, E.; Vitales, D.; Pérez, I.; Peralba, L.; Viruel, J.; Montaner, C.; Vallès, J.; Garnatje, T.; Sales, E. Phenolic Compounds Content and Genetic Diversity at Population Level across the Natural Distribution Range of Bearberry (Arctostaphylos uva-ursi, Ericaceae) in the Iberian Peninsula. Plants 2020, 9, 1250. [Google Scholar] [CrossRef] [PubMed]
- Nagahama, N.; Gastaldi, B.; Clifford, M.N.; Manifesto, M.M.; Fortunato, R.H. The influence of environmental variations on the phenolic compound profiles and antioxidant activity of two medicinal Patagonian valerians (Valeriana carnosa Sm. and V. clarionifolia Phil.). AIMS Agric. Food 2021, 6, 106–124. [Google Scholar] [CrossRef]
- Zhou, S.; Yan, X.; Yang, J.; Qian, C.; Yin, X.; Fan, X.; Fang, T.; Gao, Y.; Chang, Y.; Liu, W.; et al. Variations in Flavonoid Metabolites Along Altitudinal Gradient in a Desert Medicinal Plant Agriophyllum squarrosum. Front. Plant Sci. 2021, 12, 683265. [Google Scholar] [CrossRef]
- Apel, K.; Hirt, H. Reactive oxygen species: Metabolism, oxidative stress, and signal transduction. Annu. Rev. Plant Biol. 2004, 55, 373–399. [Google Scholar] [CrossRef] [PubMed]
- Shahidi, F.; Janitha, P.; Wanasundara, P. Phenolic antioxidants. Crit. Rev. Food Sci. 1992, 32, 67–103. [Google Scholar] [CrossRef]
- Sharaf, A.A.; Khafagi, O.M.A.; Hatab, E.B.E.; Moursy, M.M. Effect of altitudinal gradients on the content of carbohydrate, protein, proline and total phenols of some desert plants in Saint Katherine Mountain, South Sinai, Egypt. Middle East J. Sci. Res. 2013, 14, 122–129. [Google Scholar]
- Boyarskih, I.G.; Syso, A.I.; Siromlya, T.I. Variability of chemical elements and biologically active polyphenols in Loniceracaerulea subsp. altaica (Caprifoliaceae) plant organs along an altitudinal gradient. Contemp. Probl. Ecol. 2019, 12, 594–606. [Google Scholar] [CrossRef]
- Zhang, X.S.; Wang, B.D. Chinese Medicine Dictionary; Shanghai Science and Technology Publishing House: Shanghai, China, 1986; pp. 1117, 1978. [Google Scholar]
- Turner, N.; Bouchard, R.; Kennedy, D. Ethnobotany of the Okanagan-Colville Indians of British Columbia and Washington; British Columbia Provincial Museum: Victoria, BC, Canada, 1980. [Google Scholar]
- Lavrenov, V.K.; Lavrenova, G.V. Complete Encyclopedia of Medicinal Plants; Olma-Press: Moscow, Russia, 1999; Volume 2, pp. 337–340. (In Russian) [Google Scholar]
- Kostikova, V.A.; Petrova, N.V. Phytoconstituents and bioactivity of plants of the genus Spiraea L. (Rosaceae): A review. Int. J. Mol. Sci. 2021, 22, 11163. [Google Scholar] [CrossRef]
- Karpova, E.A.; Khramova, E.P. Dynamics of phenolic composition and content of representatives of the genus Spiraea L. under the conditions of transport and industrial pollution in Novosibirsk. Chem. Sustain. Dev. 2019, 27, 154–165. [Google Scholar]
- Kiss, T.; Cank, K.B.; Orbán-Gyapai, O.; Liktor-Busa, E.; Zomborszki, Z.P.; Rutkovska, S.; Pučka, I.; Németh, A.; Csupor, D. Phytochemical and pharmacological investigation of Spiraea chamaedryfolia: A contribution to the chemotaxonomy of Spiraea genus. BMC Res. Notes 2017, 10, 762–768. [Google Scholar] [CrossRef]
- Kiss, T. Phytochemical, Pharmacological and Toxicological Studies of Alkaloid-and Sesquiterpene Lactone-Containing Medicinal Plants. Ph.D. Thesis, University of Szeged, Szeged, Hungary, 2017. [Google Scholar]
- Kostikova, V.A.; Filippova, E.I.; Vysochina, G.I.; Mazurkova, N.A. Antiviral activity of plants of the genus Spiraea (Rosaceae) growing in the Asian part of Russia. In Proceedings of the International Conference Dedicated to the 70th Anniversary of Central Siberian Botanical Garden “Preserving the Diversity of Flora in the Botanical Gardens: Tradition, Modernity and Perspectives”, CSBG SB RAS, Novosibirsk, Russia, 1–8 August 2016; pp. 156–157. (In Russian). [Google Scholar]
- Bodalski, T.; Cisowski, W. Flavonoids in the inflorescence of Spiraea media Schm. Diss. Pharm. Pharmacol. 1969, 21, 443–447. [Google Scholar]
- Karpova, E.A.; Polyakova, T.A. Content of phenolic compounds and potential of biological activity of siberian and russian far eastern species of the genus Spiraea L. (Rosaceae Juss.). Plant Life Asian Russ. 2009, 2, 79–88. (In Russian) [Google Scholar]
- Serebryakova, V.A.; Vysochina, G.I. Research on the composition and content of biologically active substances of Far East representatives of genus Spiraea (Rosaceae). Plant Life Asian Russ. 2011, 8, 120–124. (In Russian) [Google Scholar]
- Shirshova, T.I.; Smirnova, A.N.; Beshlei, I.V.; Ufimtsev, K.G. Valuable bioactive substances of Spiraea (Rosaceae) species from the republic of Komi. Rastit. Resur. 2019, 56, 528–536. (In Russian) [Google Scholar]
- Gammerman, A.P.; Blinova, K.F.; Badmaev, A.N. Antimicrobial activity of medicinal plants of Tibet. In Phytoncides; Drobotko, V.G., Ed.; Naukova Dumka: Kiev, Ukraine, 1967; pp. 107–113. (In Russian) [Google Scholar]
- Kostikova, V.A.; Shaldaeva, T.M. The antioxidant activity of the Russian Far East representatives of the Spiraea L. genus (Rosaceae Juss.). Russ. J. Bioorg. Chem. 2017, 43, 790–794. [Google Scholar] [CrossRef]
- Kostikova, V.A.; Zarubaev, V.V.; Esaulkova, I.L.; Sinegubova, E.O.; Kadyrova, R.A.; Shaldaeva, T.M.; Veklich, T.N.; Kuznetsov, A.A. The antiviral, antiradical, and phytochemical potential of dry extracts from Spiraea hypericifolia, S. media, and S. salicifolia (Rosaceae). S. Afr. J. Bot. 2022, 147, 215–222. [Google Scholar] [CrossRef]
- Mirovich, V.M.; Tsyrenzhapov, A.V.; Krivosheev, I.M. Investigation of anti-inflammatory of Spiraea media Franz Schmidt. Innov. Technol. Pharm. 2018, 5, 286–290. (In Russian) [Google Scholar]
- Poyarkova, A.I. Subfamily Spiraeoideae Agardh. In Flora SSSR; Flora of the USSR; Komarov, V.L., Ed.; Akad. Nauk SSSR: Leningrad, Russia, 1939; Volume 9, pp. 279–318. [Google Scholar]
- Polozhiy, A.V. Rod Spiraea L.—Tavolga. In Flora Sibiri; Nauka: Novosibirsk, Russia, 1988; Volume 8, pp. 10–20. (In Russian) [Google Scholar]
- Lu, L.T.; Crinan, A. Spiraea Linnaeus. In Flora of China; Wu, Z.Y., Raven, P.H., Eds.; Science Press: Beijing, China; Missouri Botanical Garden Press: St. Louis, MO, USA, 2003; Volume 9, pp. 47–73. [Google Scholar]
- Ni, Q.; Wang, Z.; Xu, G.; Gao, Q.; Yang, D.; Morimatsu, F.; Zhang, Y. Altitudinal variation of antioxidant components and capability in Indocalamus latifolius (Keng) McClure leaf. J. Nutr. Sci. Vitaminol. 2013, 59, 336–342. [Google Scholar] [CrossRef]
- Senica, M.; Stampar, F.; Veberic, R.; Mikulic-Petkovsek, M. The higher the better? Differences in phenolics and cyanogenic glycosides in Sambucus nigra leaves, flowers and berries from different altitudes. J. Sci. Food. Agric. 2017, 97, 2623–2632. [Google Scholar] [CrossRef]
- Spitaler, R.; Schlorhaufer, P.D.; Ellmerer, E.P.; Merfort, I.; Bortenschlager, S.; Stuppner, H.; Zidorn, C. Altitudinal variation of secondary metabolite profiles in flowering heads of Arnica montana cv. ARBO. Phytochemistry 2006, 67, 409–417. [Google Scholar] [CrossRef]
- Rieger, G.; Muller, M.; Guttenberger, H.; Bucar, F. Influence of altitudinal variation on the content of phenolic compounds in wild populations of Calluna vulgaris, Sambucus nigra, and Vaccinium myrtillus. J. Agric. Food Chem. 2008, 56, 9080–9086. [Google Scholar] [CrossRef] [PubMed]
- Khramova, E.P. The phenolic compounds of aboveground parts of Pentaphylloides fruticosa (Rosaceae) growing in altai mountains. Rastit. Resur. 2014, 50, 627–639. (In Russian) [Google Scholar]
- Vagabova, F.A.; Radjabov, G.K.; Musaev, A.M.; Islamova, F.I. Ziziphora clinopodioides var. serpyllacea (M. Bieb.) Boiss. is perspective species in the flora of Dagestan by phenolic compounds. Bot. Bull. North. Cauc. 2015, 1, 30–38. (In Russian) [Google Scholar]
- Boyarskih, I.G.; Vasiliev, V.G.; Kukushkina, T.A. Content of flavonoids and hydroxycinnamic acids in Lonicera caerulea (Caprifoliaceae) in populations of mountain Altai. Rastit. Resur. 2014, 50, 105–121. (In Russian) [Google Scholar]
- van Beek, T.A. Chemical analysis of Ginkgo biloba leaves and extracts. J. Chromatogr. A 2002, 967, 21–55. [Google Scholar] [CrossRef]
- Kostikova, V.A.; Kuznetsov, A.A. Changes in the sets and levels of flavonoids and Phenolcarboxylic Acids in the Leaves of Spiraea betulifolia subsp. aemiliana (Rosaceae) during Introduction into Novosibirsk Conditions. Chem. Sustain. Dev. 2021, 29, 40–50. [Google Scholar]
- Zaprometov, M.N. Fundamentals of Biochemistry of Phenolic Compounds; Visshaya Shkola: Moscow, Russia, 1974. (In Russian) [Google Scholar]
- Klyshev, L.K.; Bandyukova, V.A.; Alyukina, L.S. Plant Flavonoids. Distribution, Physico-Chemical Properties and Investigation Methods; Nauka: Alma-Ata, Kazakhstan, 1978. (In Russian) [Google Scholar]
- Mabry, T.J.; Markham, K.R.; Thomas, M.B. The Systematic Identification of Flavonoids; Springer: Berlin/Heidelberg, Germany, 1970. [Google Scholar]
- Glantz, S.A. Primers of Biostatistics, 7th ed.; McGraw-Hill: New York, NY, USA, 2012. [Google Scholar]


| Peak ID Number | Compound | Retention Time, min | Spectral Characteristics, λmax, nm | Altitude, m a.s.l. | ||||||
|---|---|---|---|---|---|---|---|---|---|---|
| 1070 | 1072 | 1083 | 1222 | 1235 | 1650 | 1700 | ||||
| 1 | Chlorogenic acid | 3.2 | 244, 330 | 0.17 ± 0.01 d | 0.07 ± 0 e | 0.26 ± 0.01 c | 0.5 ± 0.02 b | 0.22 ± 0.01 c | 0.54 ± 0.02 b | 0.86 ± 0.03 a |
| 2 | Flavone | 4.4 | 270, 320 | 0.09 ± 0 a | 0.08 ± 0 b | 0.09 ± 0 a | 0.08 ± 0 b | 0.08 ± 0 b | 0.08 ± 0 b | 0.1 ± 0 c |
| 3 | Flavonol | 7.3 | 255, 355 | 3.45 ± 0.13 d | 1.08 ± 0.04 f | 2.2 ± 0.08 e | 7.5 ± 0.28 a | 6.43 ± 0.24 b | 5.23 ± 0.19 c | 3.69 ± 0.14 d |
| 4 | Flavanone | 11.5 | 285, 335 | 4.74 ± 0.18 c | 5.37 ± 0.20 c | 6.02 ± 0.22 b,c | 3.67 ± 0.14 d | 4.76 ± 0.18 c | 6.2 ± 0.23 b | 14.55 ± 0.54 a |
| 5 | Flavonol | 15.2 | 250, 355 | 0.21 ± 0.01 b | 0.28 ± 0.01 a | 0.09 ± 0 c | 0.08 ± 0 d | 0.08 ± 0 d | 0 | 0 |
| 6 | Isoquercitrin | 19.3 | 255, 355 | 0.42 ± 0.02 d | 0.58 ± 0.02 c | 0.41 ± 0.02 d,e | 0.35 ± 0.01 e | 0.85 ± 0.03 a | 0.57 ± 0.02 c | 0.72 ± 0.03 b |
| 7 | Rutin | 20 | 256, 358 | 2.18 ± 0.08 b | 2.41 ± 0.01 a | 2.03 ± 0.08 b,c | 0.65 ± 0.02 f | 0.92 ± 0.03 e | 1.28 ± 0.05 d | 1.97 ± 0.07 c |
| 8 | Flavone | 23.8 | 250, 340 | 0.34 ± 0.01 c | 0.24 ± 0.01 d | 0.28 ± 0.01 d | 0.39 ± 0.01 c | 0.96 ± 0.04 a | 0.78 ± 0.03 b | 0.15 ± 0.01 e |
| 9 | Spiraeoside | 26.8 | 255, 365 | 1.05 ± 0.04 b | 0.68 ± 0.03 d | 0.86 ± 0.03 c | 0.57 ± 0.02 e | 1.02 ± 0.04 b | 1.3 ± 0.05 a | 1.07 ± 0.04 b |
| 10 | Astragalin | 32.5 | 265, 350 | 0.14 ± 0.01 a | 0.12 ± 0 b | 0.14 ± 0.01 a | 0.12 ± 0 b | 0.13 ± 0 a,b | 0.04 ± 0 d | 0.05 ± 0 c |
| 11 | Cinnamic acid | 35.9 | 216, 270 | 0.25 ± 0.01 a,b | 0.22 ± 0.01 c | 0.24 ± 0.01 b,c | 0.23 ± 0.01 b,c | 0.27 ± 0.01 a | 0.1 ± 0 d | 0.11 ± 0.00 d |
| 12 | Flavonol | 38.5 | 265, 355 | 0.12 ± 0 b | 0 | 0 | 0.3 ± 0.01 a | 0 | 0 | 0 |
| 13 | Quercetin | 40.6 | 255, 372 | 0.15 ± 0.01 b | 0.1 ± 0 e | 0.12 ± 0 c | 0.32 ± 0.01 a | 0.11 ± 0 d | 0 | 0 |
| 14 | Flavonol | 41.9 | 250, 360 | 0.36 ± 0.01 b | 0 | 0 | 0.61 ± 0.02 a | 0 | 0 | 0 |
| 15 | Phenolcarboxylic acid | 44 | 235, 315 | 0.42 ± 0.02 a | 0.25 ± 0.01 d | 0.23 ± 0.01 d,e | 0.23 ± 0.01 d,e | 0.2 ± 0.01 e | 0.38 ± 0.01 b | 0.3 ± 0.01 c |
| 16 | Kaempferol | 46.9 | 266, 370 | 0.32 ± 0.01 a | 0.23 ± 0.01 c | 0.29 ± 0.01 b | 0.22 ± 0.01 c | 0 | 0 | 0 |
| Peak ID Number | Compound | Retention Time, min | Spectral Characteristics, λmax, nm | Altitude, m a.s.l. | ||||
|---|---|---|---|---|---|---|---|---|
| 1242 | 1409 | 1660 | 1690 | 1701 | ||||
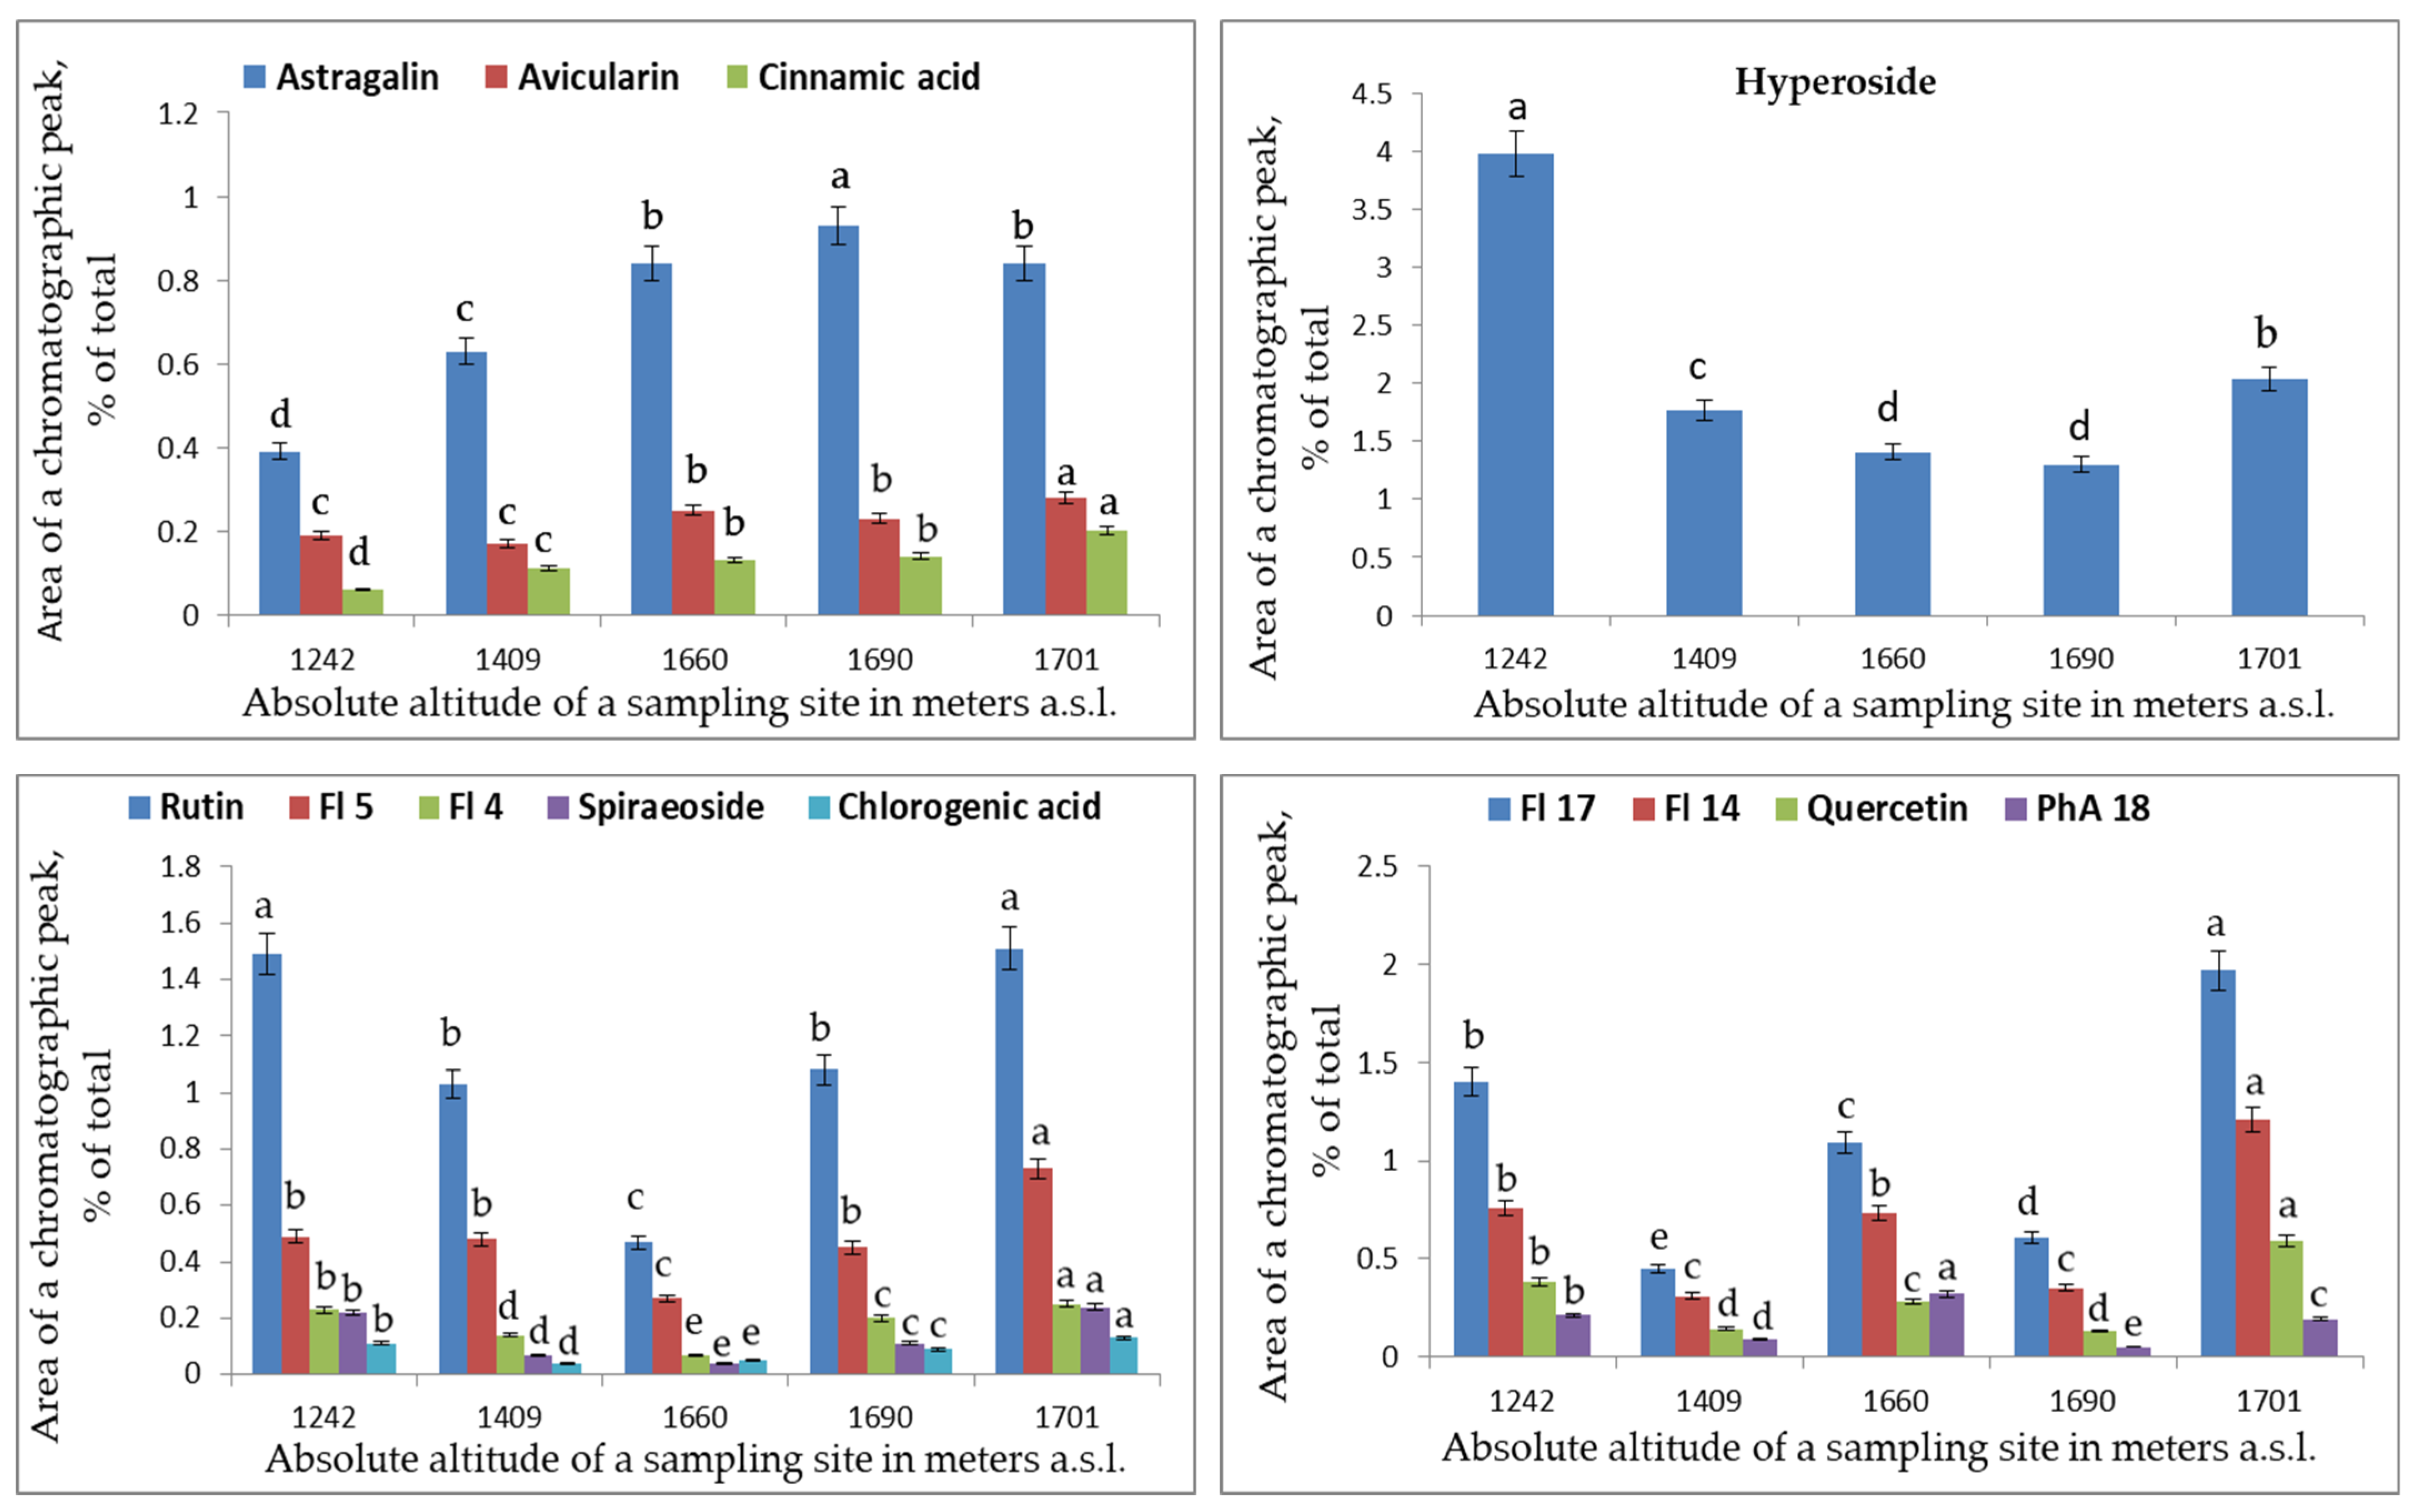
| 1 | Chlorogenic acid | 3.2 | 244, 330 | 0.36 ± 0.01 b | 0.14 ± 0.01 e | 0.18 ± 0.01 d | 0.31 ± 0.01 c | 0.42 ± 0.02 a |
| 2 | p-Coumaric acid | 7.9 | 226, 320 | 0.3 ± 0.01 b | 0 | 0 | 0.36 ± 0.01 a | 0.04 ± 0 c |
| 3 | Dihydroquercetin | 8.5 | 290 | 0.32 ± 0.01 c | 0.5 ± 0.02 a | 0.39 ± 0.01 b | 0 | 0.15 ± 0.01 d |
| 4 | Flavonol | 10.9 | 255, 360 | 1.28 ± 0.05 b | 0.79 ± 0.03 d | 0.42 ± 0.02 e | 1.11 ± 0.04 c | 1.41 ± 0.05 a |
| 5 | Flavonol | 15.2 | 250, 355 | 2.74 ± 0.10 b | 2.69 ± 0.10 b | 1.5 ± 0.06 c | 2.53 ± 0.09 b | 4.07 ± 0.15 a |
| 6 | Hyperoside | 18 | 255, 355 | 3.98 ± 0.15 a | 1.77 ± 0.07 c | 1.41 ± 0.05 d | 1.3 ± 0.05 d | 2.04 ± 0.08 b |
| 7 | Rutin | 20 | 256, 358 | 8.36 ± 0.31 a | 5.79 ± 0.21 b | 2.63 ± 0.10 c | 6.08 ± 0.22 b | 8.46 ± 0.31 a |
| 8 | – | 23 | – | 0.87 ± 0.03 b | 0.84 ± 0.03 b | 0.58 ± 0.02 c | 0.89 ± 0.03 b | 1.74 ± 0.06 a |
| 9 | Flavone | 23.8 | 250, 340 | 0.96 ± 0.04 a | 0.25 ± 0.01 d | 0.48 ± 0.02 c | 0.75 ± 0.03 b | 1.03 ± 0.04 a |
| 10 | Spiraeoside | 26.8 | 255, 365 | 1.26 ± 0.05 a | 0.37 ± 0.01 c | 0.23 ± 0.01 d | 0.59 ± 0.02 b | 1.32 ± 0.05 a |
| 11 | Avicularin | 28.4 | 260, 360 | 1.08 ± 0.04 c | 0.95 ± 0.04 c | 1.4 ± 0.05 b | 1.3 ± 0.05 b | 1.56 ± 0.06 a |
| 12 | Astragalin | 32.5 | 265, 350 | 2.17 ± 0.08 d | 3.54 ± 0.13 c | 4.72 ± 0.17 b | 5.24 ± 0.19 a | 4.74 ± 0.18 b |
| 13 | Cinnamic acid | 35.9 | 216, 270 | 0.21 ± 0.01 d | 0.35 ± 0.01 c | 0.42 ± 0.02 b | 0.44 ± 0.02 b | 0.65 ± 0.02 a |
| 14 | Flavonol | 38.5 | 265, 355 | 4.26 ± 0.16 b | 1.76 ± 0.07 c | 4.12 ± 0.15 b | 1.95 ± 0.07 c | 6.77 ± 0.25 a |
| 15 | Flavonol | 39.7 | 260, 360 | 0.62 ± 0.02 a | 0.2 ± 0.01 d | 0.51 ± 0.02 b | 0.17 ± 0.01 d | 0.25 ± 0.01 c |
| 16 | Quercetin | 40.6 | 255, 372 | 2.15 ± 0.08 b | 0.81 ± 0.03 d | 1.58 ± 0.06 c | 0.75 ± 0.03 d | 3.28 ± 0.12 a |
| 17 | Flavonol | 41.9 | 250, 360 | 7.86 ± 0.29 b | 2.5 ± 0.09 e | 6.09 ± 0.23 c | 3.41 ± 0.13 d | 11.05 ± 0.41 a |
| 18 | Phenolcarboxylic acid | 42.9 | 255, 265, 315 | 0.69 ± 0.03 a | 0.29 ± 0.01 d | 0.47 ± 0.02 c | 0.15 ± 0.01 e | 0.63 ± 0.02 b |
| 19 | Phenolcarboxylic acid | 44 | 235, 315 | 0.2 ± 0.01 d | 0.22 ± 0.01 d | 0.75 ± 0.03 a | 0.27 ± 0.01 c | 0.45 ± 0.02 b |
| 20 | Flavonol | 45.7 | 270, 350 | 0.79 ± 0.03 b | 0.2 ± 0.01 d | 0.56 ± 0,02 c | 0.08 ± 0 e | 0.96 ± 0.04 a |
| 21 | Flavonol | 46 | 270, 355 | 0.29 ± 0.01 b | 0.06 ± 0 d | 0.4 ± 0,01 a | 0.08 ± 0 c | 0.3 ± 0.01 b |
| 22 | Kaempferol | 46.9 | 266, 370 | 0.33 ± 0.01 d | 0.56 ± 0.02 c | 2.05 ± 0.08 a | 1 ± 0.04 b | 1.04 ± 0.04 b |
Disclaimer/Publisher’s Note: The statements, opinions and data contained in all publications are solely those of the individual author(s) and contributor(s) and not of MDPI and/or the editor(s). MDPI and/or the editor(s) disclaim responsibility for any injury to people or property resulting from any ideas, methods, instructions or products referred to in the content. |
© 2023 by the authors. Licensee MDPI, Basel, Switzerland. This article is an open access article distributed under the terms and conditions of the Creative Commons Attribution (CC BY) license (https://creativecommons.org/licenses/by/4.0/).
Share and Cite
Boyarskikh, I.G.; Artemov, I.A.; Kuznetsov, A.A.; Kostikova, V.A. Changes in Profiles of Classes and of Individual Polyphenols in Leaves of Spiraea chamaedryfolia and Spiraea media along an Altitudinal Gradient. Plants 2023, 12, 2977. https://doi.org/10.3390/plants12162977
Boyarskikh IG, Artemov IA, Kuznetsov AA, Kostikova VA. Changes in Profiles of Classes and of Individual Polyphenols in Leaves of Spiraea chamaedryfolia and Spiraea media along an Altitudinal Gradient. Plants. 2023; 12(16):2977. https://doi.org/10.3390/plants12162977
Chicago/Turabian StyleBoyarskikh, Irina G., Igor A. Artemov, Alexander A. Kuznetsov, and Vera A. Kostikova. 2023. "Changes in Profiles of Classes and of Individual Polyphenols in Leaves of Spiraea chamaedryfolia and Spiraea media along an Altitudinal Gradient" Plants 12, no. 16: 2977. https://doi.org/10.3390/plants12162977
APA StyleBoyarskikh, I. G., Artemov, I. A., Kuznetsov, A. A., & Kostikova, V. A. (2023). Changes in Profiles of Classes and of Individual Polyphenols in Leaves of Spiraea chamaedryfolia and Spiraea media along an Altitudinal Gradient. Plants, 12(16), 2977. https://doi.org/10.3390/plants12162977