
Cryptogamic Biomass in Pannonic Acidic Sand Steppes Subject to Changing Land-Use

 ,
,  , and
, and
Abstract
1. Introduction
2. Results
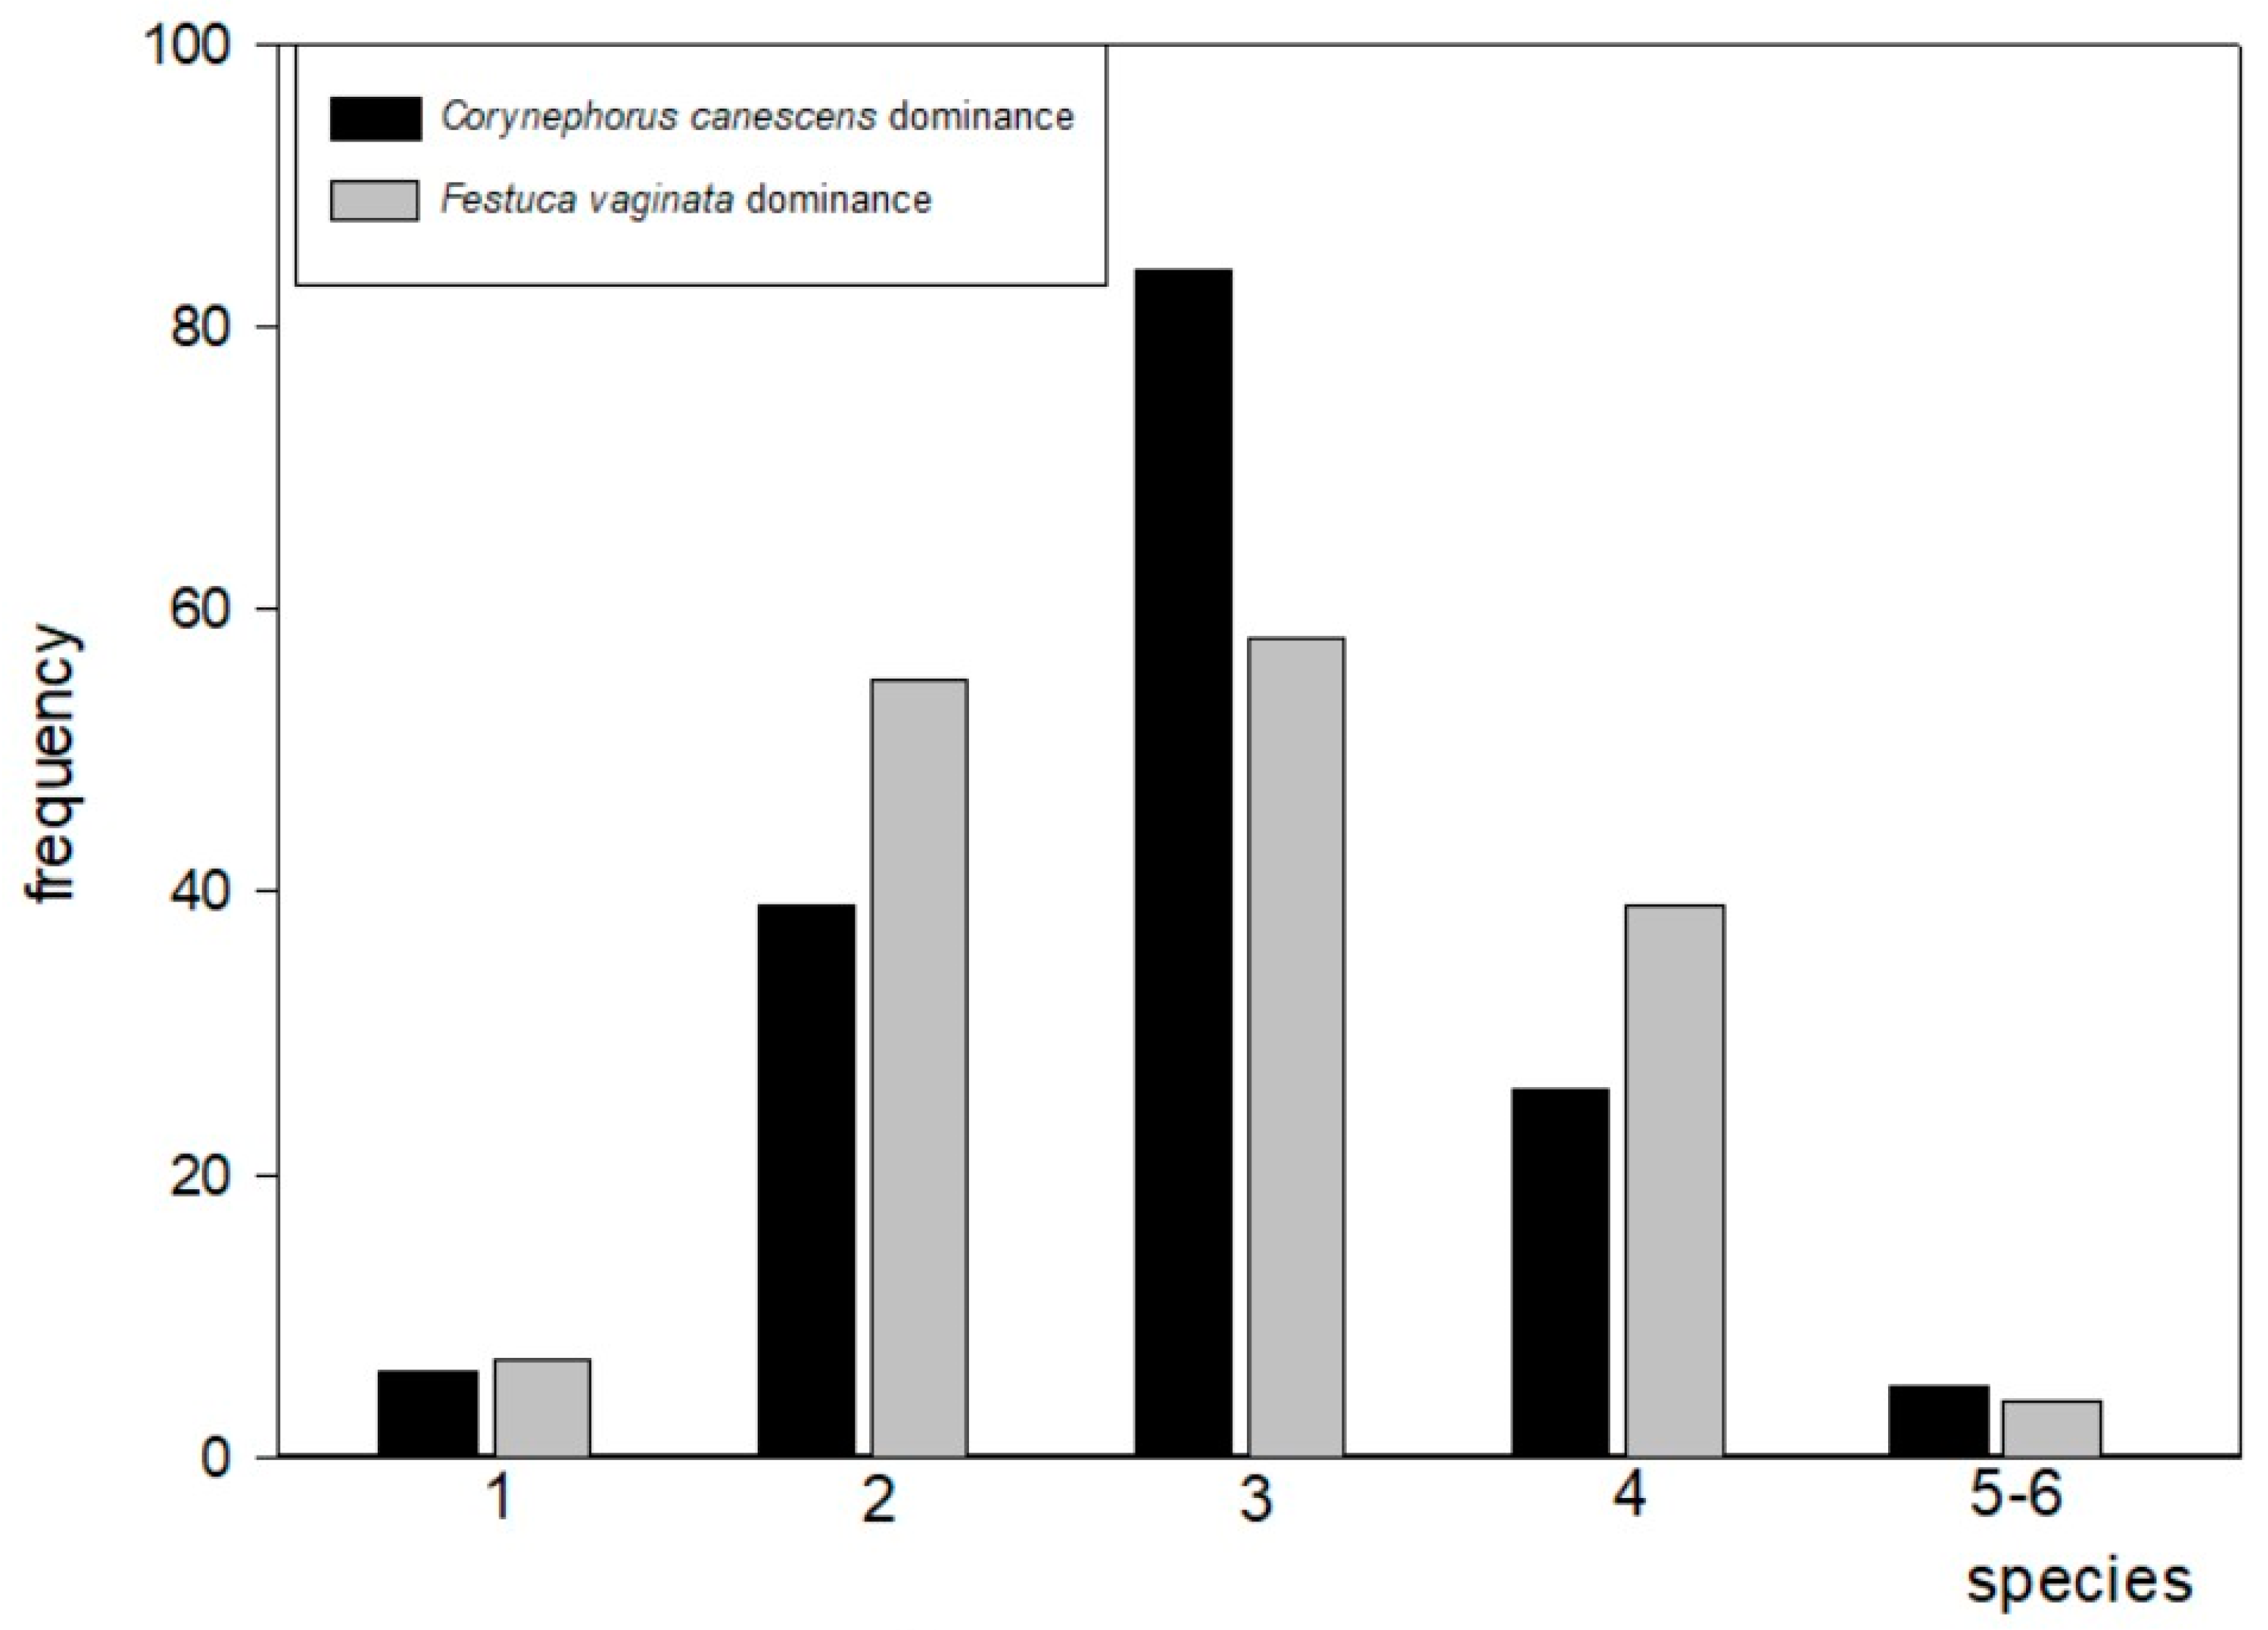
2.1. Species Richness
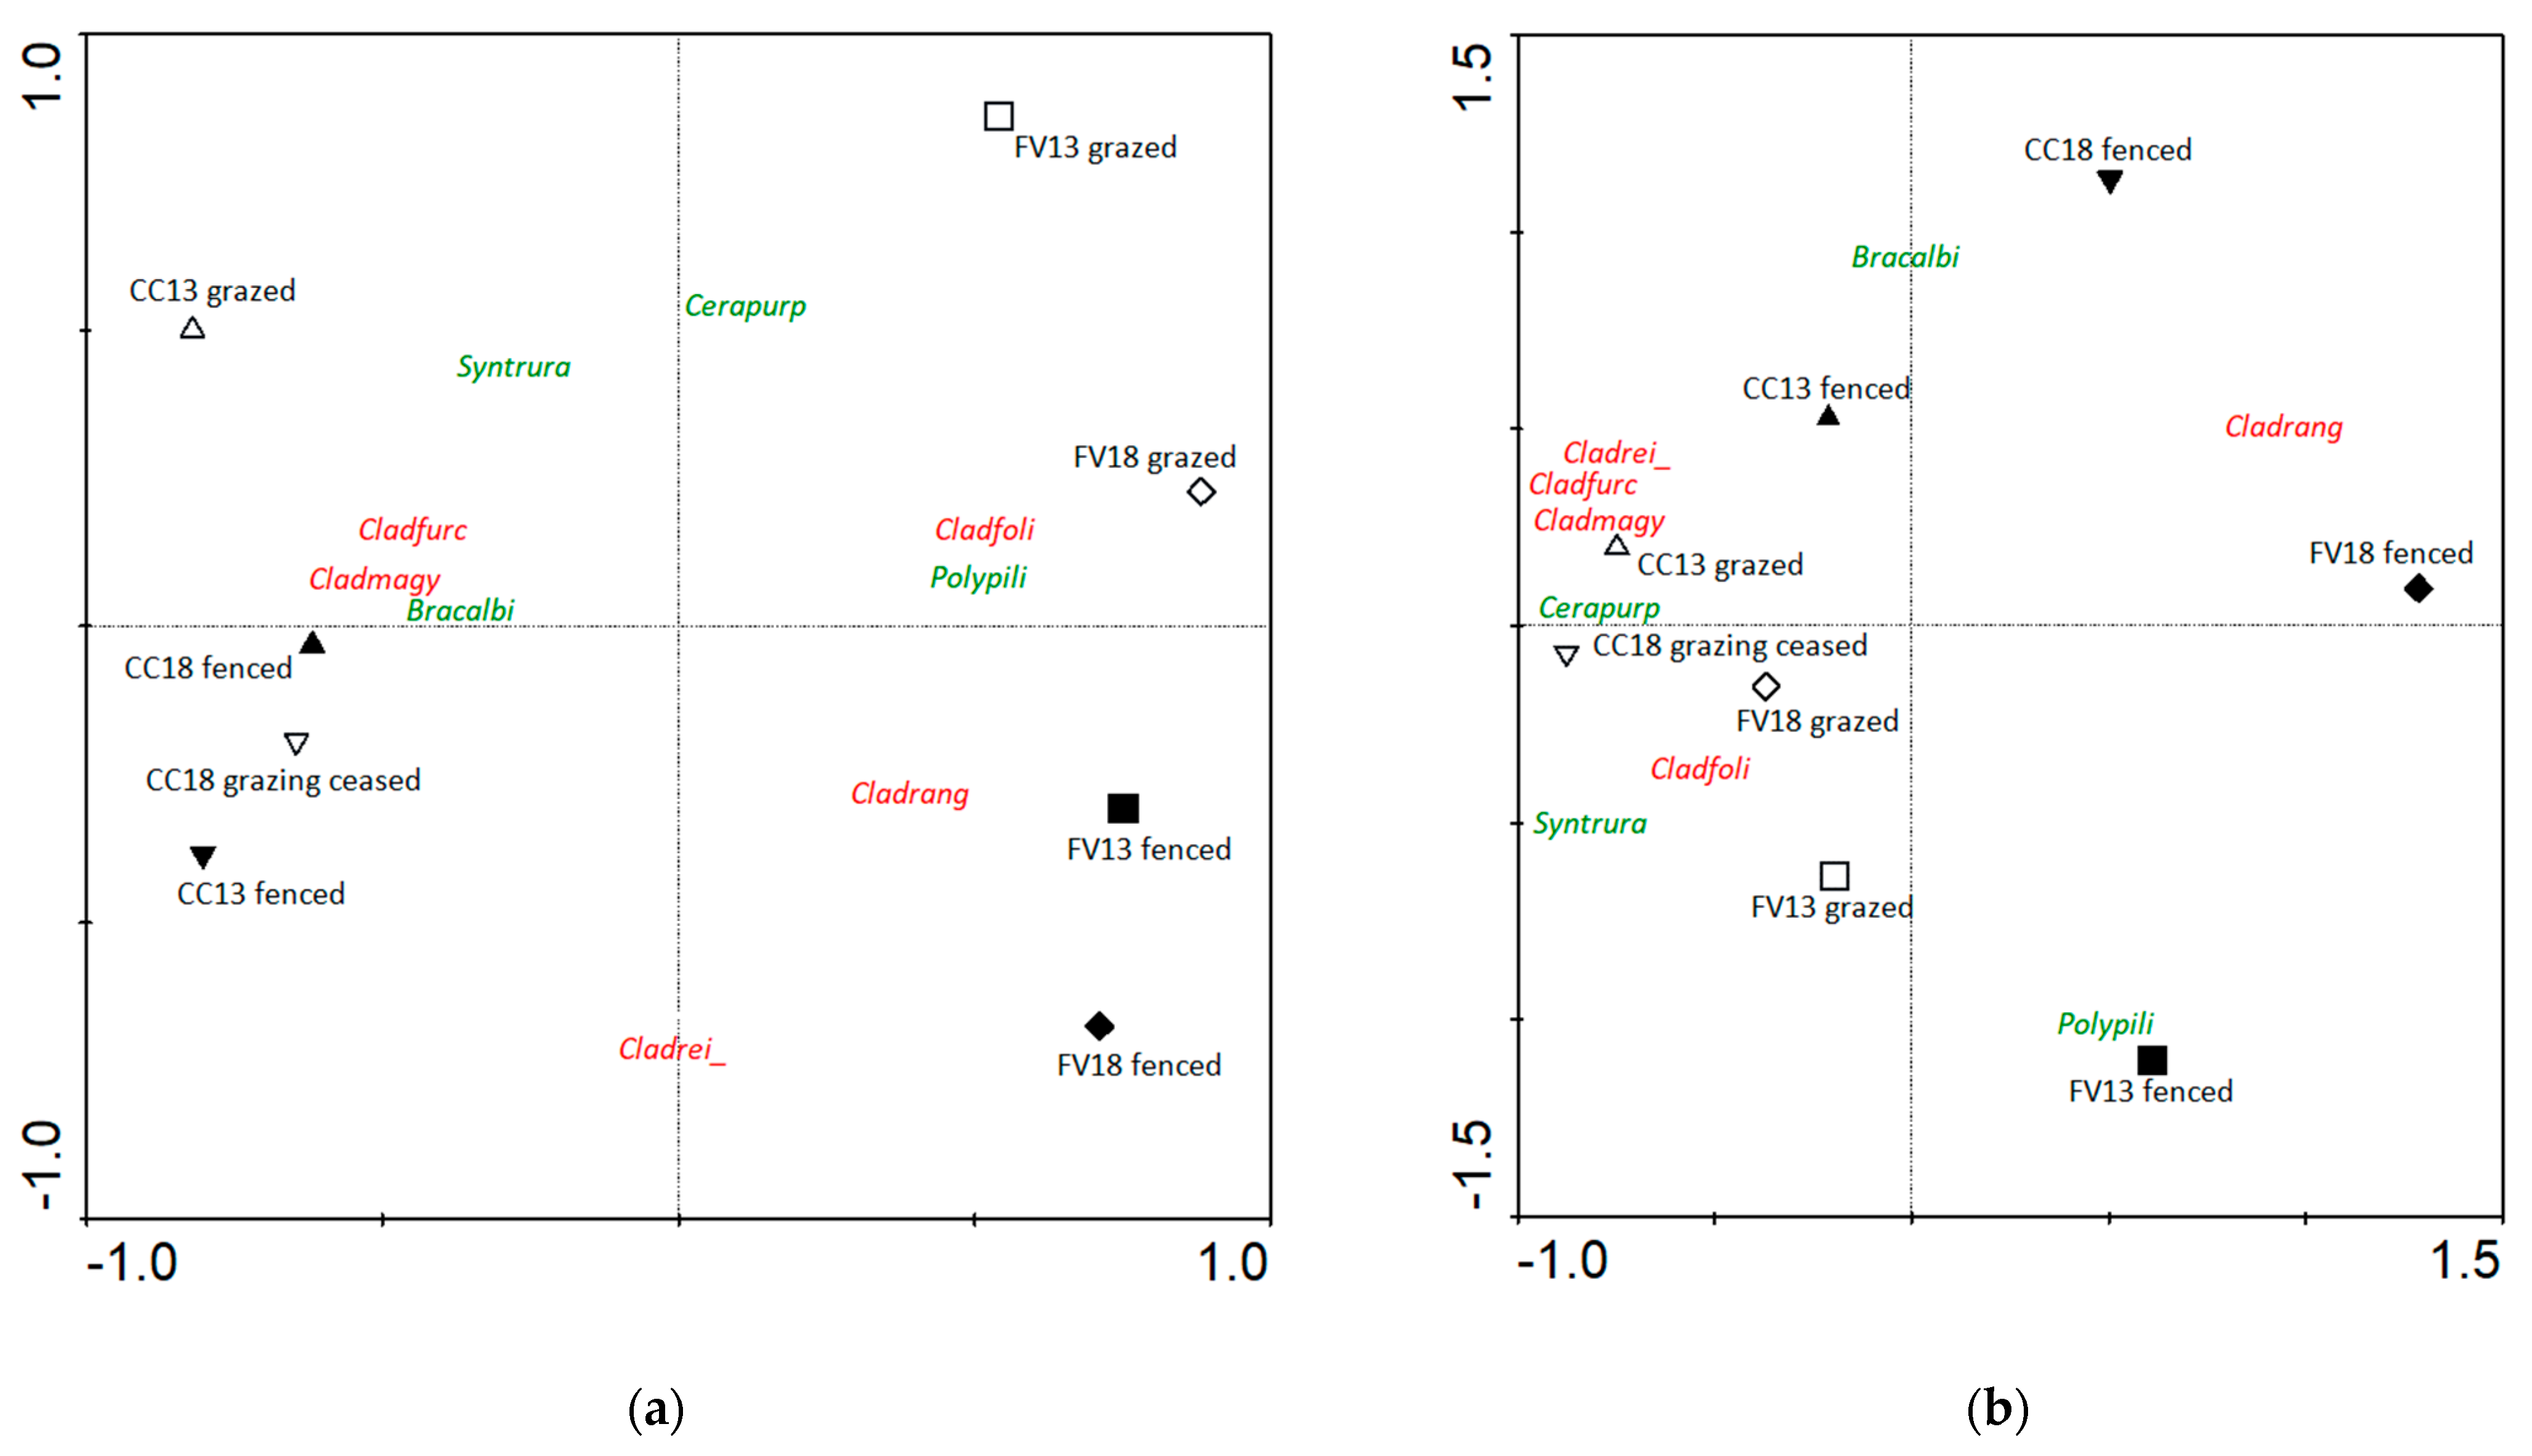
2.2. Composition
2.2.1. Frequency
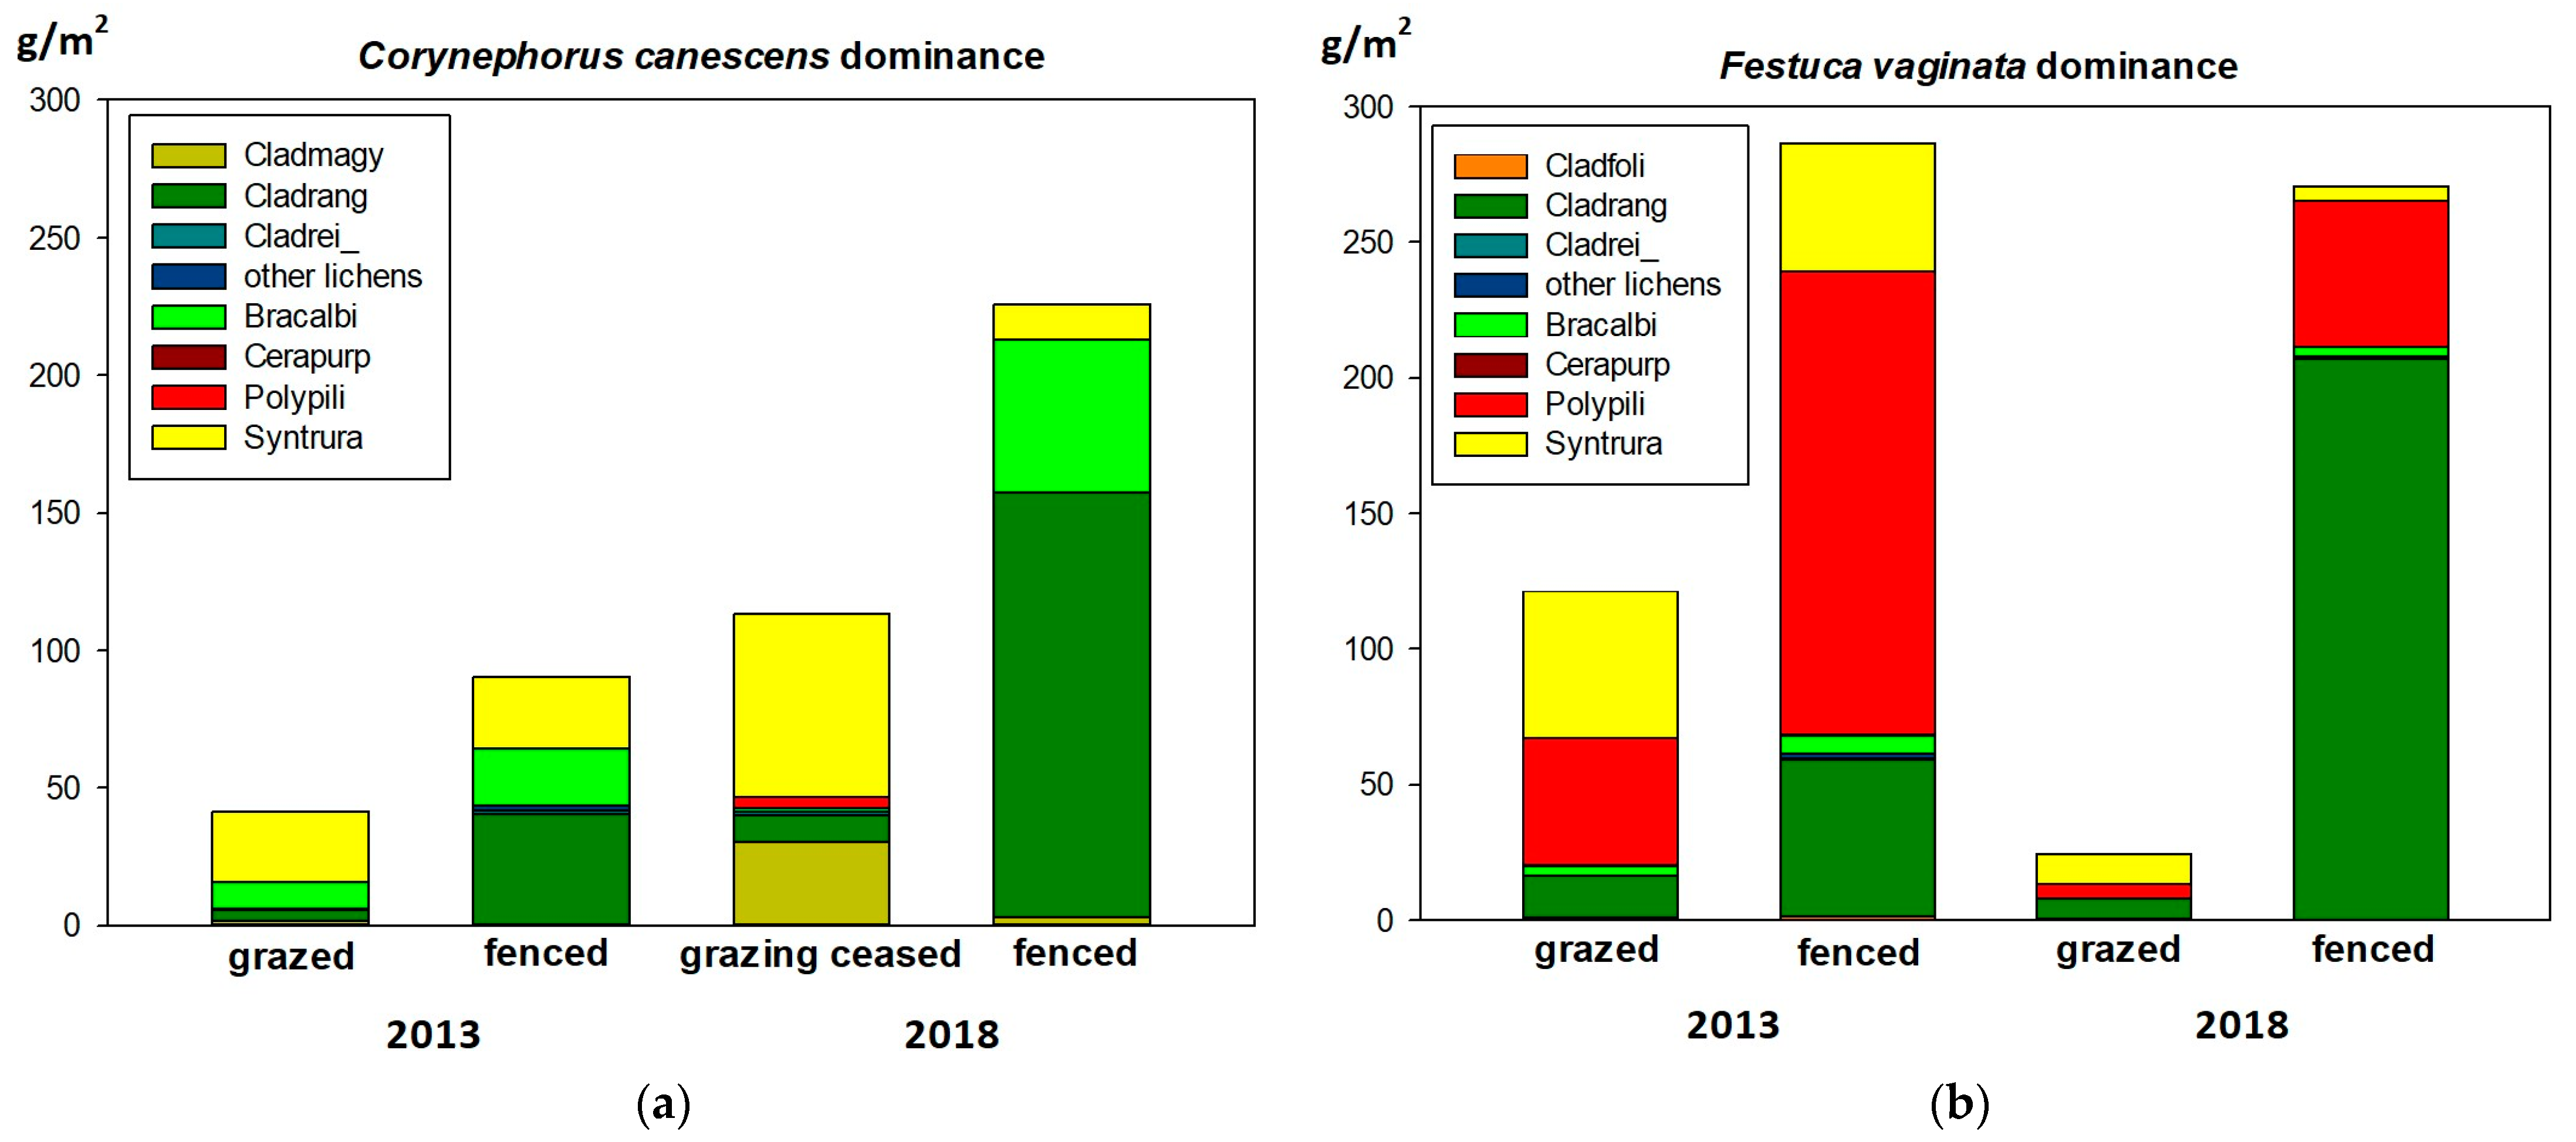
2.2.2. Biomass
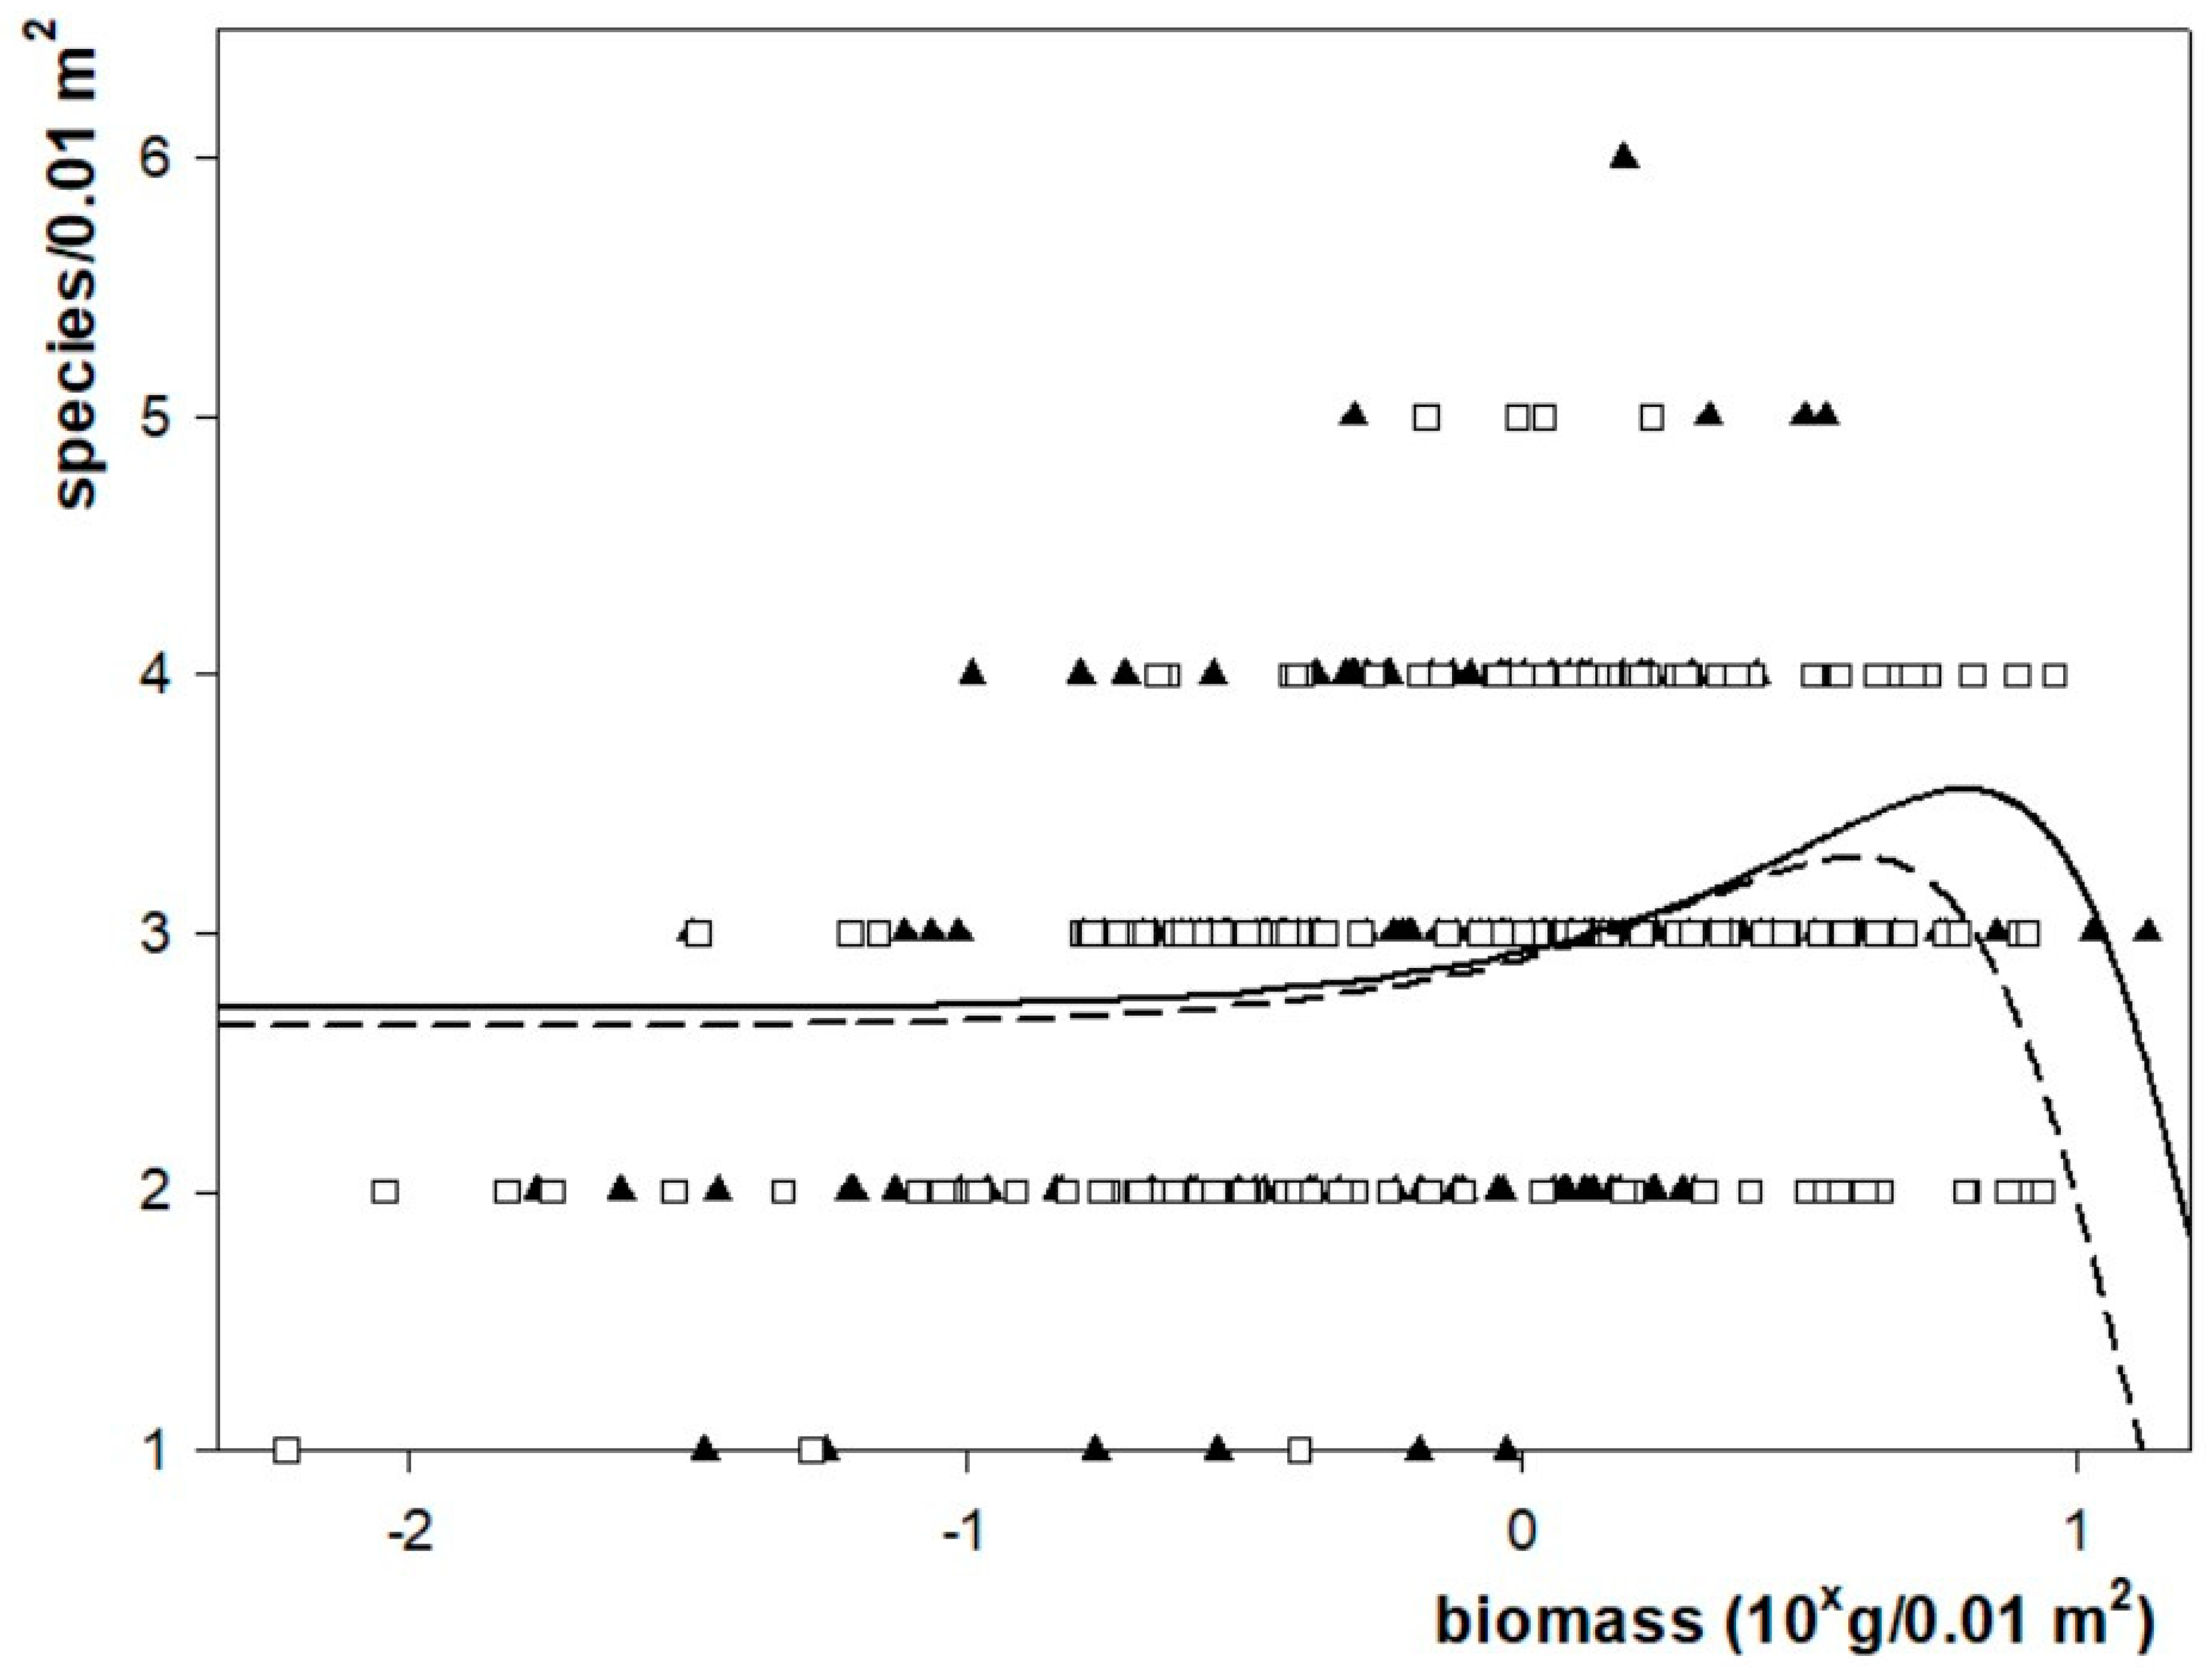
2.3. Productivity
2.4. Diversity
3. Discussion
3.1. Composition and Species Richness
3.2. Biomass
3.3. Diversity
3.4. Management
4. Materials and Methods
4.1. Characteristics of the Study Area
4.2. Biomass Sampling
4.3. Soil Analysis
4.4. Identification
4.5. Data Processing
Author Contributions
Funding
Data Availability Statement
Acknowledgments
Conflicts of Interest
Appendix A

| Corynephorus canescens Dominance | ||||||||
|---|---|---|---|---|---|---|---|---|
| 2013 | 2018 | |||||||
| Lichens | Frequency | Mean Biomass (g/m2) | Frequency | Mean Biomass (g/m2) | ||||
| Grazed | Fenced | Grazed | Fenced | Grazing Ceased | Fenced | Grazing Ceased | Fenced | |
| Cladonia fimbriata (L.) Fr. | 0 | 2 | 0.00 | 0.31 | 0 | 0 | 0.00 | 0.00 |
| Cladonia furcata (Huds.) Schrad. | 3 | 9 | 0.48 | 0.84 | 1 | 2 | 0.05 | 0.04 |
| Cladonia magyarica Vain. | 9 | 2 | 1.65 | 0.02 | 13 | 3 | 30.32 | 2.68 |
| Cladonia pyxidata (L.) Hoffm. | 0 | 1 | 0.00 | 0.01 | 0 | 0 | 0.00 | 0.00 |
| Cladonia rangiformis Hoffm. | 19 | 34 | 3.62 | 40.31 | 28 | 38 | 9.57 | 154.49 |
| Cladonia rei Schaer. | 1 | 15 | 0.04 | 1.38 | 11 | 5 | 1.11 | 0.26 |
| Cladonia sp. | 1 | 3 | 0.02 | 0.10 | 0 | 0 | 0.00 | 0.00 |
| Cladonia subrangiformis L. Scriba ex Sandst. | 0 | 3 | 0.00 | 0.40 | 0 | 0 | 0.00 | 0.00 |
| Cladonia subulata (L.) Weber ex F.H. Wigg. | 0 | 0 | 0.00 | 0.00 | 1 | 0 | 0.02 | 0.00 |
| Diploschistes muscorum (Scop.) R. Sant. | 1 | 1 | 0.03 | 0.07 | 0 | 0 | 0.00 | 0.00 |
| Altogether | 34 | 70 | 5.83 | 43.42 | 54 | 48 | 41.07 | 157.47 |
| Bryophytes | ||||||||
| Brachythecium albicans (Hedw.) Schimp. | 37 | 39 | 9.72 | 20.74 | 22 | 38 | 1.35 | 55.48 |
| Ceratodon purpureus (Hedw.) Brid. | 1 | 0 | 0.01 | 0.00 | 0 | 0 | 0.00 | 0.00 |
| Polytrichum piliferum Hedw. | 3 | 1 | 0.06 | 0.11 | 4 | 2 | 4.14 | 0.07 |
| Syntrichia ruralis (Hedw.) F. Weber & D. Mohr | 38 | 30 | 25.47 | 25.92 | 38 | 31 | 66.68 | 12.42 |
| Altogether | 79 | 70 | 35.25 | 46.77 | 64 | 71 | 72.17 | 67.97 |
| All cryptogams | 113 | 140 | 41.08 | 90.19 | 94 | 125 | 113.24 | 225.44 |
| Festuca vaginata Dominance | ||||||||
|---|---|---|---|---|---|---|---|---|
| 2013 | 2018 | |||||||
| Lichens | Frequency | Mean Biomass (g/m2) | Frequency | Mean Biomass (g/m2) | ||||
| Grazed | Fenced | Grazed | Fenced | Grazed | Fenced | Grazed | Fenced | |
| Cladonia foliacea (Huds.) Willd. (syn.: C. convoluta (Lam.) Anders) | 3 | 2 | 1.02 | 1.54 | 5 | 2 | 0.66 | 0.46 |
| Cladonia furcata (Huds.) Schrad. | 2 | 0 | 0.29 | 0.00 | 0 | 0 | 0.00 | 0.00 |
| Cladonia rangiformis Hoffm. | 36 | 39 | 15.43 | 57.79 | 38 | 39 | 7.42 | 206.71 |
| Cladonia rei Schaer. | 0 | 15 | 0.00 | 0.57 | 2 | 20 | 0.02 | 0.76 |
| Cladonia subrangiformis L. Scriba ex Sandst. | 0 | 1 | 0.00 | 0.77 | 0 | 0 | 0.00 | 0.00 |
| Altogether | 41 | 57 | 16.45 | 61.57 | 45 | 61 | 8.10 | 207.93 |
| Bryophytes | ||||||||
| Brachythecium albicans (Hedw.) Schimp. | 33 | 23 | 3.81 | 6.62 | 2 | 26 | 0.02 | 3.71 |
| Ceratodon purpureus (Hedw.) Brid. | 6 | 1 | 0.15 | 0.46 | 0 | 0 | 0.00 | 0.00 |
| Polytrichum piliferum Hedw. | 28 | 30 | 46.70 | 170.87 | 18 | 26 | 5.18 | 53.72 |
| Syntrichia ruralis (Hedw.) F. Weber & D. Mohr | 31 | 25 | 54.21 | 47.13 | 29 | 12 | 11.28 | 5.23 |
| Altogether | 98 | 79 | 104.87 | 225.08 | 49 | 64 | 16.48 | 62.66 |
| All cryptogams | 139 | 136 | 121.32 | 286.65 | 94 | 125 | 24.58 | 270.59 |
References
- Slack, N.G. Species Diversity and Community Structure in Bryophytes: New York State Studies; Bulletin of New York State Museum Scientific Survey: Albany, NY, USA, 1977. [Google Scholar]
- Brown, M.J.; Jarman, S.J.; Kantvilas, G. Conservation and Reservation of Non-Vascular Plants in Tasmania, with Special Reference to Lichens. Biodivers. Conserv. 1994, 3, 263–278. [Google Scholar] [CrossRef]
- Jarman, S.J.; Kantvilas, G. Lichens and Bryophytes of the Tasmanian World Heritage Area. II. Three Forest Sites at Pelion Plains. Tasforests 1994, 6, 103–120. [Google Scholar]
- Dengler, J.; Biurrun, I.; Boch, S.; Dembicz, I.; Török, P. Grasslands of the Palaearctic Biogeographic Realm: Introduction and Synthesis. In Encyclopedia of the World’s Biomes; Elsevier: Amsterdam, The Netherlands, 2020; pp. 617–637. ISBN 978-0-12-816097-8. [Google Scholar]
- Bergauer, M.; Dembicz, I.; Boch, S.; Willner, W.; Babbi, M.; Blank-Pachlatko, J.; Catalano, C.; Cykowska-Marzencka, B.; Gehler, J.; Guarino, R.; et al. Scale-Dependent Patterns and Drivers of Vascular Plant, Bryophyte and Lichen Diversity in Dry Grasslands of the Swiss Inneralpine Valleys. Alp. Bot. 2022, 132, 195–209. [Google Scholar] [CrossRef]
- Löbel, S.; Dengler, J.; Hobohm, C. Species Richness of Vascular Plants, Bryophytes and Lichens in Dry Grasslands: The Effects of Environment, Landscape Structure and Competition. Folia Geobot. 2006, 41, 37–393. [Google Scholar] [CrossRef]
- Boros, Á. A Mohok a Természetben És Az Ember Életében. Természettudományi Közlöny 1943, 75, 33–46. [Google Scholar]
- Boros, Á. Magyarország Mohái; Akadémiai Kiadó: Budapest, Hungary, 1953; 360p. [Google Scholar]
- Boros, Á. A Mohák Jelentősége a Mezőgazdaságban. Agrobotanika 1971, 12, 99–106. [Google Scholar]
- Smith, A.J.E. Bryophyte Ecology; Chapman and Hall: London, UK; New York, NY, USA, 1982; ISBN 978-0-412-22340-2. [Google Scholar]
- Orbán, S.; Vajda, L. Magyarország Mohaflórájának Kézikönyve; Akadémiai Kiadó: Budapest, Hungary, 1983; 518p, ISBN 978-963-05-2889-4. [Google Scholar]
- Vanderpoorten, A.; Goffinet, B. Introduction to Bryophytes, 1st ed.; Cambridge University Press: Cambridge, UK, 2009; 328p, ISBN 978-0-521-87712-1. [Google Scholar]
- Szczepaniak, K.; Biziuk, M. Aspects of the Biomonitoring Studies Using Mosses and Lichens as Indicators of Metal Pollution. Environ. Res. 2003, 93, 221–230. [Google Scholar] [CrossRef] [PubMed]
- Cornelissen, J.H.C.; Lang, S.I.; Soudzilovskaia, N.A.; During, H.J. Comparative Cryptogam Ecology: A Review of Bryophyte and Lichen Traits That Drive Biogeochemistry. Ann. Bot. 2007, 99, 987–1001. [Google Scholar] [CrossRef]
- Asplund, J.; Wardle, D.A. How Lichens Impact on Terrestrial Community and Ecosystem Properties. Biol. Rev. 2017, 92, 1720–1738. [Google Scholar] [CrossRef]
- Rubio-Salcedo, M.; Martínez, I.; Carreño, F.; Escudero, A. Poor Effectiveness of the Natura 2000 Network Protecting Mediterranean Lichen Species. J. Nat. Conserv. 2013, 21, 1–9. [Google Scholar] [CrossRef]
- Dengler, J.; Janišová, M.; Török, P.; Wellstein, C. Biodiversity of Palaearctic Grasslands: A Synthesis. Agric. Ecosyst. Environ. 2014, 182, 1–14. [Google Scholar] [CrossRef]
- Dengler, J.; Guarino, R.; Moysiyenko, I.; Vynokurov, D.; Boch, S.; Cykowska-Marzencka, B.; Babbi, M.; Catalano, C.; Eggenberg, S.; Gehler, J.; et al. On the Trails of Josias Braun-Blanquet II: First Results from the 12th EDGG Field Workshop Studying the Dry Grasslands of the Inneralpine Dry Valleys of Switzerland. Palaearct. Grassl. 2020, 45, 59–88. [Google Scholar] [CrossRef]
- Darbyshire, I.; Anderson, S.; Asatryan, A.; Byfield, A.; Cheek, M.; Clubbe, C.; Ghrabi, Z.; Harris, T.; Heatubun, C.D.; Kalema, J.; et al. Important Plant Areas: Revised Selection Criteria for a Global Approach to Plant Conservation. Biodivers. Conserv. 2017, 26, 1767–1800. [Google Scholar] [CrossRef]
- Gheza, G.; Assini, S.; Lelli, C.; Marini, L.; Mayrhofer, H.; Nascimbene, J. Biodiversity and Conservation of Terricolous Lichens and Bryophytes in Continental Lowlands of Northern Italy: The Role of Different Dry Habitat Types. Biodivers. Conserv. 2020, 29, 3533–3550. [Google Scholar] [CrossRef]
- Chytrý, M.; Sedláková, I.; Tichý, L. Species Richness and Species Turnover in a Successional Heathland. Appl. Veg. Sci. 2001, 4, 89–96. [Google Scholar] [CrossRef]
- Ketner-Oostra, R.; Aptroot, A.; Jungerius, P.D.; Sykora, K.V. Vegetation Succession and Habitat Restoration in Dutch Lichen-Rich Inland Drift Sands. Tuexenia 2012, 32, 245–268. [Google Scholar]
- Büdel, B.; Colesie, C.; Green, T.G.A.; Grube, M.; Lázaro Suau, R.; Loewen-Schneider, K.; Maier, S.; Peer, T.; Pintado, A.; Raggio, J.; et al. Improved Appreciation of the Functioning and Importance of Biological Soil Crusts in Europe: The Soil Crust International Project (SCIN). Biodivers. Conserv. 2014, 23, 1639–1658. [Google Scholar] [CrossRef]
- Jüriado, I.; Kämärä, M.-L.; Oja, E. Environmental Factors and Ground Disturbance Affecting the Composition of Species and Functional Traits of Ground Layer Lichens on Grey Dunes and Dune Heaths of Estonia. Nord. J. Bot. 2016, 34, 244–255. [Google Scholar] [CrossRef]
- Gheza, G. Terricolous Lichens of the Western Padanian Plain: New Records of Phytogeographical Interest. Acta Bot. Gall. 2015, 162, 339–348. [Google Scholar] [CrossRef]
- Gheza, G.; Assini, S.; Passadore, M.V. Terricolous Lichen Communities of Corynephorus Canescens Grasslands of Northern Italy. Tuexenia 2016, 36, 121–142. [Google Scholar] [CrossRef]
- Gheza, G.; Nascimbene, J.; Mayrhofer, H.; Barcella, M.; Assini, S. Two Cladonia Species New to Italy from Dry Habitats in the Po Plain. Herzogia 2018, 31, 293–303. [Google Scholar] [CrossRef]
- Gheza, G.; Assini, S.; Marini, L.; Nascimbene, J. Impact of an Invasive Herbivore and Human Trampling on Lichen-Rich Dry Grasslands: Soil-Dependent Response of Multiple Taxa. Sci. Total Environ. 2018, 639, 633–639. [Google Scholar] [CrossRef]
- Veres, K.; Farkas, E.; Csintalan, Z. The Bright and Shaded Side of Duneland Life: The Photosynthetic Response of Lichens to Seasonal Changes Is Species-Specific. Mycol. Prog. 2020, 19, 629–641. [Google Scholar] [CrossRef]
- Veres, K.; Csintalan, Z.; Kovács, B.; Farkas, E. Factors at Multiple Scales Influence the Composition of Terricolous Lichen Communities in Temperate Semi-Arid Sandy Grasslands. Lichenologist 2021, 53, 467–479. [Google Scholar] [CrossRef]
- Veres, K.; Csintalan, Z.; Laufer, Z.; Engel, R.; Szabó, K.; Farkas, E. Photoprotection and High-Light Acclimation in Semi-Arid Grassland Lichens—A Cooperation between Algal and Fungal Partners. Symbiosis 2022, 86, 33–48. [Google Scholar] [CrossRef]
- Veres, K.; Sinigla, M.; Szabó, K.; Varga, N.; Farkas, E. The Long-Term Effect of Removing the UV-Protectant Usnic Acid from the Thalli of the Lichen Cladonia foliacea. Mycol. Prog. 2022, 21, 83. [Google Scholar] [CrossRef]
- Jentsch, A.; Beyschlag, W. Vegetation Ecology of Dry Acidic Grasslands in the Lowland Area of Central Europe. Flora 2003, 198, 3–25. [Google Scholar] [CrossRef]
- Ketner-Oostra, R.; Sýkora, K.V. Vegetation Change in a Lichen-Rich Inland Drift Sand Area in the Netherlands. Phytocoenologia 2008, 38, 267–286. [Google Scholar] [CrossRef]
- Metera, E.; Sakowski, T.; Sloniewski, K.; Romanowicz, B. Grazing as a Tool to Maintain Biodiversity of Grassland—A Review. Anim. Sci. Pap. Rep. 2010, 28, 315–334. [Google Scholar]
- Dumont, B.; Carrère, P.; Ginane, C.; Farruggia, A.; Lanore, L.; Tardif, A.; Decuq, F.; Darsonville, O.; Louault, F. Plant–Herbivore Interactions Affect the Initial Direction of Community Changes in an Ecosystem Manipulation Experiment. Basic Appl. Ecol. 2011, 12, 187–194. [Google Scholar] [CrossRef]
- Rupprecht, D.; Gilhaus, K.; Hölzel, N. Effects of Year-Round Grazing on the Vegetation of Nutrient-Poor Grass- and Heathlands—Evidence from a Large-Scale Survey. Agric. Ecosyst. Environ. 2016, 234, 16–22. [Google Scholar] [CrossRef]
- Evans, D.M.; Villar, N.; Littlewood, N.A.; Pakeman, R.J.; Evans, S.A.; Dennis, P.; Skartveit, J.; Redpath, S.M. The Cascading Impacts of Livestock Grazing in Upland Ecosystems: A 10-Year Experiment. Ecosphere 2015, 6, 1–15. [Google Scholar] [CrossRef]
- EC Directorate-General for Environment; Tsiripidis, I.; Piernik, A.; Janssen, J.A.M.; Tahvanainen, T.; Molina, J.A.; Giusso del Galdo, G.; Gardfjell, H.; Dimopoulos, P.; Šumberová, K.; et al. European Red List of Habitats. Part 2, Terrestrial and Freshwater Habitats; Publications Office: Luxembourg, 2016. [Google Scholar]
- Botta-Dukát, Z. Invasion of Alien Species to Hungarian (Semi-)Natural Habitats. Acta Bot. Hung. 2008, 50, 219–227. [Google Scholar] [CrossRef]
- Ónodi, G.; Kertész, M.; Botta-Dukát, Z. Effects of Simulated Grazing on Open Perennial Sand Grassland. Community Ecol. 2006, 7, 133–141. [Google Scholar] [CrossRef]
- Ónodi, G.; Kertész, M.; Botta-Dukát, Z.; Altbäcker, V. Grazing Effects on Vegetation Composition and on the Spread of Fire on Open Sand Grasslands. Arid Land Res. Manag. 2008, 22, 273–285. [Google Scholar] [CrossRef]
- Holt, E.A.; McCune, B.; Neitlich, P. Grazing and Fire Impacts on Macrolichen Communities of the Seward Peninsula, Alaska, U.S.A. Bryologist 2008, 111, 68–83. [Google Scholar] [CrossRef]
- Hodgins, I.W.; Rogers, R.W. Correlations of Stocking with the Cryptogamic Soil Crust of a Semi-Arid Rangeland in Southwest Queensland. Austral Ecol. 1997, 22, 425–431. [Google Scholar] [CrossRef]
- Brotherson, J.C.; Rushforth, S.R.; Johansen, J.R. Effects of Long-Term Grazing on Cryptogam Crust Cover in Navajo National Monument, Arizona. J. Range Manag. 1983, 36, 579–581. [Google Scholar] [CrossRef]
- Concostrina-Zubiri, L.; Huber-Sannwald, E.; Martínez, I.; Flores Flores, J.L.; Reyes-Agüero, J.A.; Escudero, A.; Belnap, J. Biological Soil Crusts across Disturbance-Recovery Scenarios: Effect of Grazing Regime on Community Dynamics. Ecol. Appl. 2014, 24, 1863–1877. [Google Scholar] [CrossRef]
- Rogers, R.W.; Lange, R.T. Lichen Populations on Arid Soil Crusts around Sheep Watering Places in South Australia. Oikos 1971, 22, 93–100. [Google Scholar] [CrossRef]
- Bertiller, M.B.; Ares, J.O. Does Sheep Selectivity along Grazing Paths Negatively Affect Biological Crusts and Soil Seed Banks in Arid Shrublands? A Case Study in the Patagonian Monte, Argentina. J. Environ. Manag. 2011, 92, 2091–2096. [Google Scholar] [CrossRef] [PubMed]
- Gómez, D.A.; Aranibar, J.N.; Tabeni, S.; Villagra, P.E.; Garibotti, I.A.; Atencio, A. Biological Soil Crust Recovery after Long-Term Grazing Exclusion in the Monte Desert (Argentina). Changes in Coverage, Spatial Distribution, and Soil Nitrogen. Acta Oecol. 2012, 38, 33–40. [Google Scholar] [CrossRef]
- Eskelinen, A.; Oksanen, J. Changes in the Abundance, Composition and Species Richness of Mountain Vegetation in Relation to Summer Grazing by Reindeer. J. Veg. Sci. 2006, 17, 245–254. [Google Scholar] [CrossRef]
- Olofsson, J.; Kitti, H.; Rautiainen, P.; Stark, S.; Oksanen, L. Effects of Summer Grazing by Reindeer on Composition of Vegetation, Productivity and Nitrogen Cycling. Ecography 2001, 24, 13–24. [Google Scholar] [CrossRef]
- Anderson, D.C.; Harper, K.T.; Holmgren, R.C. Factors Influencing Development of Cryptogamic Soil Crusts in Utah Deserts. J. Range Manag. 1982, 35, 180. [Google Scholar] [CrossRef]
- Ahti, T. Studies of the Caribou Lichen Stands of Newfoundland. Ann. Bot. Soc. Van. 1959, 30, 1–44. [Google Scholar]
- Klein, D.R. Vegetation Recovery Patterns Following Overgrazing by Reindeer on St. Matthew Island. J. Range Manag. 1987, 40, 336–338. [Google Scholar] [CrossRef]
- Manseau, M.; Hout, J.; Crete, M. Effects of Summer Grazing by Caribou on Composition and Productivity of Vegetation: Community and Landscape Level. J. Ecol. 1996, 84, 503–513. [Google Scholar] [CrossRef]
- Pegau, R.E. Effect of Reindeer Trampling and Grazing on Lichens. J. Range Manag. 1970, 23, 95–97. [Google Scholar] [CrossRef]
- Tommervik, H.; Johansen, B.; Tombre, I.; Thannheiser, D.; Hogda, K.A. Wielgolaski Vegetation Changes in the Nordic Mountain Birch Forest: The Influence of Grazing and Climate Change. Arct. Antarct. Alp. Res. 2004, 36, 323–332. [Google Scholar] [CrossRef]
- Ponzetti, J.M.; McCune, B.P. Biotic Soil Crusts of Oregon’s Shrub Steppe: Community Composition in Relation to Soil Chemistry, Climate, and Livestock Activity. Bryologist 2001, 104, 212–225. [Google Scholar] [CrossRef]
- Liu, H.; Han, X.; Li, L.; Huang, J.; Liu, H.; Li, X. Grazing Density Effects on Cover, Species Composition, and Nitrogen Fixation of Biological Soil Crust in an Inner Mongolia Steppe. Rangel. Ecol. Manag. 2009, 62, 321–327. [Google Scholar] [CrossRef]
- Hobbs, R.J.; Arico, S.; Aronson, J.; Baron, J.S.; Bridgewater, P.; Cramer, V.A.; Epstein, P.R.; Ewel, J.J.; Klink, C.A.; Lugo, A.E.; et al. Novel Ecosystems: Theoretical and Management Aspects of the New Ecological World Order: Novel Ecosystems. Glob. Ecol. Biogeogr. 2006, 15, 1–7. [Google Scholar] [CrossRef]
- Gilbert, O.L. Reindeer Grazing in Britain. Lichenologist 1974, 6, 165–167. [Google Scholar] [CrossRef]
- Helle, T.; Aspi, J. Effects of Winter Grazing by Reindeer on Vegetation. Oikos 1983, 40, 337. [Google Scholar] [CrossRef]
- Verseghy, K.; Kovács-Láng, E. Investigations on Production of Grassland Communities of Sandy Soil in the IBP Area near Csévharaszt (Hungary). I. Production of Lichens. Acta Biol. Acad. Sci. Hung. 1971, 22, 393–411. [Google Scholar] [PubMed]
- Verseghy, K. Quantitative Investigation of Xerothermophilous Lichens of Sandy Soil. Ann. Hist. Nat. Mus. Natn. Hung. 1976, 68, 59–63. [Google Scholar]
- Verseghy, K. Investigation on Lichen Production of Grassland Communities of Sandy Soil II. Acta Biol. Acad. Sci. Hung. 1977, 28, 25–32. [Google Scholar]
- Verseghy, K. Zuzmóprodukció, Produktivitás És Annak Feltételei Száraz Homoki Gyepekben. Ph.D. Thesis, Eötvös Loránd University, Budapest, Hungary, 1979; 153p. [Google Scholar]
- Verseghy, K. Productivity and Turnover of Xerotherm Lichen Species. Acta Bot. Acad. Sci. Hung. 1982, 28, 411–425. [Google Scholar]
- Lájer, K. A Rejtőke (Teesdalia Nudicaulis) Előfordulása Es a Belső-Somogyi Ezüstperjés Gyepek Mai Állapota. Somogyi Múzeumok Közleményei 2004, 16, 257–264. [Google Scholar]
- Lájer, K. Magyarország Ezüstperjés Gyepei. Kanitzia 2005, 13, 29–43. [Google Scholar]
- Bartha, S.; Balogh, L.; Bíró, M.; Bódis, J.; Csete, S.; Csiky, J.; Fráter, E.; Hayek, Z.; Lájer, K.; Purger, D.; et al. Nyílt És Záródó Homokpusztagyepek Társulási Viszonyainak Összehasonlítása a Vácrátóti Tece Legelőn. In Kutatás, oktatás, értékteremtés. A 80 éves Précsényi István köszöntés; MTA ÖBKI: Vácrátót, Hungary, 2006; pp. 111–132. [Google Scholar]
- Szigetvári, C. Inváziós Növények Szerepének Összehasonlító Vizsgálata Nyílt Homokgyepekben. Ph.D. Dissertation, University of Szeged, Szeged, Hungary, 2004. [Google Scholar]
- Török, P.; Kelemen, A.; Valkó, O.; Miglécz, T.; Tóth, K.; Tóth, E.; Sonkoly, J.; Kiss, R.; Csecserits, A.; Rédei, T.; et al. Succession in Soil Seed Banks and Its Implications for Restoration of Calcareous Sand Grasslands: Seed Bank Succession on Calcareous Sand. Restor. Ecol. 2018, 26, 134–140. [Google Scholar] [CrossRef]
- Berg, C.; Schwager, P.; Pöltl, M.; Dengler, J. Plot Sizes Used for Phytosociological Sampling of Bryophyte and Lichen Micro-Communities. Herzogia 2016, 29, 654–667. [Google Scholar] [CrossRef]
- Chytrý, M.; Otýpková, Z. Plot Sizes Used for Phytosociological Sampling of European Vegetation. J. Veg. Sci. 2003, 14, 563–570. [Google Scholar] [CrossRef]
- Sinigla, M.; Szurdoki, E.; Lőkös, L.; Bartha, D.; Galambos, I.; Bidló, A.; Farkas, E. Distribution and Habitat Preference of Protected Reindeer Lichen Species ( Cladonia Arbuscula, C. Mitis and C. Rangiferina ) in the Balaton Uplands (Hungary). Lichenologist 2021, 53, 271–282. [Google Scholar] [CrossRef]
- Güler, B.; Jentsch, A.; Apostolova, I.; Bartha, S.; Bloor, J.M.G.; Campetella, G.; Canullo, R.; Házi, J.; Kreyling, J.; Pottier, J.; et al. How Plot Shape and Spatial Arrangement Affect Plant Species Richness Counts: Implications for Sampling Design and Rarefaction Analyses. J. Veg. Sci. 2016, 27, 692–703. [Google Scholar] [CrossRef]
- Boros, Á. A Nyírség Flórája És Növényföldrajza. Debreceni Tud. Társ. Honis. Biz. Kiadv. 1932, 7, 25–26. [Google Scholar]
- Verseghy, K. Magyarország zuzmóflórájának kézikönyve; Magyar Természettudományi Múzeum: Budapest, Hungary, 1994; 414p, ISBN 978-963-7093-22-7. [Google Scholar]
- Farkas, E.; Lőkös, L. Védett Zuzmófajok Magyarországon. (Protected Lichen Species in Hungary). Mikol. Közlem. Clusiana 2007, 45, 159–171. [Google Scholar]
- Matus, G.; Lőkös, L. Újabb Adatok a Dél-Nyírség Makrozuzmóinak Ismeretéhez. In X. Aktuális Flóra- és Vegetációkutatás a Kárpát-Medencében: X. Nemzetközi Konferencia Összefoglalói = Recent Flora- and Vegetation Research in the Carpathian Basin X. Book of Abstracts; Dávid, S., Miklós, K., Dénes, B., Eds.; Erdőmérnöki Kar, Növénytani és Természetvédelmi Intézet: Sopron, Hungary, 2014; 16p, ISBN 9789633341537. [Google Scholar]
- Papp, B.; Erzberger, P.; Lőkös, L.; Szurdoki, E.; Németh, C.; Buczkó, K.; Höhn, M.; Aszalósné Balogh, R.; Baráth, K.; Matus, G.; et al. Taxonomical and Chorological Notes 12 (126–136). Stud. Bot. Hung. 2020, 51, 77–98. [Google Scholar] [CrossRef]
- Bauer, N.; Hüvös-Récsi, A.; Lőkös, L.; Matus, G.; Sinigla, M.; Farkas, E. Distribution of Xanthoparmelia Pulvinaris (Parmeliaceae) in Hungary. Stud. Bot. Hung. 2022, 53, 113–135. [Google Scholar] [CrossRef]
- Farkas, E. Lichenológia—A Zuzmók Tudománya; MTA Ökológiai és Botanikai Kutatóintézete: Vácrátót, Hungary, 2007; 193p. [Google Scholar]
- Valachovič, M. Succession Model with Corynephorus Canescens in Abandoned Sandy Fields (W Slovakia). Hacquetia 2012, 11, 5–15. [Google Scholar] [CrossRef]
- Stenroos, S.; Hyvonen, J.; Myllys, L.; Thell, A.; Ahti, T. Phylogeny of the Genus Cladonia s.Lat. (Cladoniaceae, Ascomycetes) Inferred from Molecular, Morphological, and Chemical Data. Cladistics 2002, 18, 237–278. [Google Scholar] [CrossRef] [PubMed]
- Spier, L.; Aptroot, A. Fellhaneretum Myrtillicolae Ass. Nov., the Lichen Association on Vaccinium myrtillus. Herzogia 2000, 14, 43–47. [Google Scholar] [CrossRef]
- Syrek, M.; Kukwa, M. Taxonomy of the Lichen Cladonia Rei and Its Status in Poland. Biologia 2008, 63, 493–497. [Google Scholar] [CrossRef]
- Dolnik, C.; Beck, A.; Zarabska, D. Distinction of Cladonia Rei and C. Subulata Based on Molecular, Chemical and Morphological Characteristics. Lichenologist 2010, 42, 373–386. [Google Scholar] [CrossRef]
- Purvis, O.W.; Halls, C. A Review of Lichens in Metal-Enriched Environments. Lichenologist 1996, 28, 571–601. [Google Scholar] [CrossRef]
- Hammer, S. A Synopsis of the Genus Cladonia in the Northwestern United States. Bryologist 1995, 98, 1–28. [Google Scholar] [CrossRef]
- Wirth, V.; Hauck, M.; Schultz, M. Die Flechten Deutschlands; Ulmer: Stuttgart, Germany, 2013; 1244p, ISBN 978-3-8001-5903-1. [Google Scholar]
- Soó, R. Conspectus Des Groupements Végétaux Dans Les Bassins Carpathiques. Acta Bot. Hung. 1957, 3, 43–64. [Google Scholar]
- Kovacsics-Vári, G.; Sonkoly, J.; Tóth, K.; McIntosh-Buday, A.; Díaz Cando, P.; Törő-Szijgyártó, V.; Balogh, N.; Guallichico Suntaxi, L.R.; Espinoza Ami, F.D.; Demeter, L.; et al. Intensity-dependent Effects of Cattle and Sheep Grazing in Sand Grasslands—Does Livestock Type Really Matter? Appl. Veg. Sci. 2023, 26, e12727. [Google Scholar] [CrossRef]
- Zar, J.H. Biostatistical Analysis, 5th ed.; Prentice-Hall/Pearson: Upper Saddle River, NJ, USA, 2010; xiii, 944p. [Google Scholar]
- Coppins, B.J.; Shimwell, D.W. Cryptogam Complement and Biomass in Dry Calluna Heath of Different Ages. Oikos 1971, 22, 204–209. [Google Scholar] [CrossRef]
- Biermann, R.; Daniëls, F.J.A. Changes in a Lichen-Rich Dry Sand Grassland Vegetation with Special Reference to Lichen Synusiae and Campylopus introflexus. Phytocoenologia 1997, 27, 257–273. [Google Scholar] [CrossRef]
- Paus, S.M. Die Erdflechtenvegetation Nordwestdeutschlands und einiger Randgebiete. Bibl. Lichenol. 1977, 66, 1–222. [Google Scholar]
- Haveman, R.; Schaminee, J.H.J. Inland Dune Vegetation of the Netherlands. Ann. Bot. 2003, 3, 118–124. [Google Scholar] [CrossRef]
- Hasse, T. Charakterisierung Der Sukzessionsstadien Im Spergulo-Corynephoretum (Silbergrasfluren) Unter Besonderer Berücksichtigung Der Flechten. Tuexenia 2005, 25, 407–424. [Google Scholar]
- Daniëls, F.J.A.; Minarski, A.; Lepping, O. Dominance Pattern Changes of a Lichen-Rich Corynephorus Grassland in the Inland of the Netherlands. Ann. Bot. 2008, 8, 9–19. [Google Scholar] [CrossRef]
- Tschöpe, O.; Tielbörger, K. The Role of Successional Stage and Small-Scale Disturbance for Establishment of Pioneer Grass Corynephorus canescens. Appl. Veg. Sci. 2010, 13, 326–335. [Google Scholar]
- Sparrius, L. Inland Dunes in The Netherlands: Soil, Vegetation, Nitrogen Deposition and Invasive Species. Ph.D. Thesis, University of Amsterdam, Amsterdam, The Netherlands, 2011. [Google Scholar]
- Watt, A.S. Pattern and Process in the Plant Community. J. Ecol. 1947, 35, 1–22. [Google Scholar] [CrossRef]
- Grime, J.P. Competitive Exclusion in Herbaceous Vegetation. Nature 1973, 242, 344–347. [Google Scholar] [CrossRef]
- Eldridge, D.J.; Rosentreter, R. Morphological Groups: A Framework for Monitoring Microphytic Crusts in Arid Landscapes. J. Arid Environ. 1999, 41, 11–25. [Google Scholar] [CrossRef]
- Oksanen, L. Lichen Grounds of Finnmarksvidda, Northern Norway, in Relation to Summer and Winter Grazing by Reindeer. Rep. Kevo Subarct. Res. Stat. 1978, 14, 64–71. [Google Scholar]
- Olofsson, J. Short- and Long-Term Effects of Changes in Reindeer Grazing Pressure on Tundra Heath Vegetation. J. Ecol. 2006, 94, 431–440. [Google Scholar] [CrossRef]
- St. Clair, L.L.; Johansen, J.R.; St. Clair, S.B.; Knight, K.B. The Influence of Grazing and Other Environmental Factors on Lichen Community Structure along an Alpine Tundra Ridge in the Uinta Mountains, Utah, U.S.A. Arc. Antarc. Alp. Res. 2007, 39, 603–613. [Google Scholar] [CrossRef]
- Kumpula, J. Winter Grazing of Reindeer in Woodland Lichen Pasture. Small Rumin. Res. 2001, 39, 121–130. [Google Scholar] [CrossRef] [PubMed]
- Memmott, K.L.; Anderson, V.J.; Monsen, S.B. Seasonal Grazing Impact on Cryptogamic Crusts in a Cold Desert Ecosystem. J. Range Manag. 1998, 51, 547–550. [Google Scholar] [CrossRef]
- Kausrud, K.; Mysterud, A.; Rekdal, Y.; Holand, Ø.; Austrheim, G. Density-dependent Foraging Behaviour of Sheep on Alpine Pastures: Effects of Scale. J. Zool. 2006, 270, 63–71. [Google Scholar] [CrossRef][Green Version]
- Mysterud, A.; Austrheim, G. The Effect of Domestic Sheep on Forage Plants of Wild Reindeer; a Landscape Scale Experiment. Eur. J. Wildl. Res. 2008, 54, 461–468. [Google Scholar] [CrossRef]
- Pekkarinen, A.-J.; Kumpula, J.; Tahvonen, O. Parameterization and Validation of an Ungulate-Pasture Model. Ecol. Evol. 2017, 7, 8282–8302. [Google Scholar] [CrossRef]
- Piscová, V.; Ševčík, M.; Sedlák, A.; Hreško, J.; Petrovič, F.; Slobodová, T. Resistance of Lichens and Mosses of Regenerated Alpine Communities to Repeated Experimental Trampling in the Belianske Tatras, Northern Slovakia. Diversity 2023, 15, 128. [Google Scholar] [CrossRef]
- Heggenes, J.; Odland, A.; Chevalier, T.; Ahlberg, J.; Berg, A.; Larsson, H.; Bjerketvedt, D.K. Herbivore Grazing-or Trampling? Trampling Effects by a Large Ungulate in Cold High-Latitude Ecosystems. Ecol. Evol. 2017, 7, 6423–6431. [Google Scholar] [CrossRef]
- Moore, O.; Crawley, M.J. The Impact of Red Deer Management on Cryptogam Ecology in Vegetation Typical of North West Scotland. Plant Ecol. Divers. 2015, 8, 127–137. [Google Scholar] [CrossRef]
- Moore, O.; Standen, L.; Crawley, M.J. The Impact of Red Deer Management on Liverworts Associated with the Mixed Hepatic Mat Community and Other Terrestrial Cryptogams. Plant Ecol. Divers. 2015, 8, 139–145. [Google Scholar] [CrossRef]
- During, H.J. Life Strategies of Bryophytes: A Preliminary Review. Lindbergia 1979, 5, 2–18. [Google Scholar]
- Concostrina-Zubiri, L.; Martínez, I.; Escudero, A. Lichen-Biocrust Diversity in a Fragmented Dryland: Fine Scale Factors Are Better Predictors than Landscape Structure. Sci. Total Environ. 2018, 628–629, 882–892. [Google Scholar] [CrossRef] [PubMed]
- Hodgetts, N. Cladonia: A Field Guide; Joint Nature Conservation Committee: Southampton, UK, 1992; 39p, ISBN 978-1-873701-08-9. [Google Scholar]
- Kaltenecker, J.H.; Wicklow-Howard, M.C.; Rosentreter, R. Biological Soil Crusts in Three Sagebrush Communities Recovering from a Century of Livestock Trampling. In Proceedings: Shrubland Ecotones; Department of Agriculture, Forest Service, Rocky Mountain Research Station: Fort Collins, CO, USA, 1999; pp. 222–226. [Google Scholar]
- Farrar, J.F. The Lichen as an Ecosystem: Observation and Experiment. In Progress and Problems; Academic Press: London, UK, 1976; pp. 385–406. [Google Scholar]
- Balogh, R.; Farkas, E.; Lőkös, L.; Papp, B.; Novák, T.; Matus, G. Post-Exclosure Community Dynamics in Acidic Sandy Grasslands: Cryptogams, Phanerogams and Soil Seed Bank. In Proceedings of the 1st International Conference on Community Ecology, Budapest, Hungary, 28–29 September 2017. [Google Scholar]
- Aszalósné Balogh, R.; Matus, G.; Lőkös, L.; Adorján, B.; Freytag, C.; Mészáros, I.; Oláh, V.; Szűcs, P.; Erzberger, P.; Farkas, E. Cryptogamic Communities on Flatroofs in the City of Debrecen (East Hungary). Biol. Futura 2023, 74, 183–197. [Google Scholar] [CrossRef] [PubMed]
- Turtureanu, P.D.; Palpurina, S.; Becker, T.; Dolnik, C.; Ruprecht, E.; Sutcliffe, L.M.E.; Szabó, A.; Dengler, J. Scale- and Taxon-Dependent Biodiversity Patterns of Dry Grassland Vegetation in Transylvania. Agric. Ecosyst. Environ. 2014, 182, 15–24. [Google Scholar] [CrossRef]
- Zulka, K.P.; Abensperg-Traun, M.; Milasowszky, N.; Bieringer, G.; Gereben-Krenn, B.-A.; Holzinger, W.; Hölzler, G.; Rabitsch, W.; Reischütz, A.; Querner, P.; et al. Species Richness in Dry Grassland Patches of Eastern Austria: A Multi-Taxon Study on the Role of Local, Landscape and Habitat Quality Variables. Agric. Ecosyst. Environ. 2014, 182, 25–36. [Google Scholar] [CrossRef]
- Borhidi, A. Magyarország Növénytársulásai; Akad. Kiadó: Budapest, Hungary, 2003; 610p, ISBN 978-963-05-7983-4. [Google Scholar]
- Justyák, J.; Tar, K. Debrecen Éghajlata; KLTE Egyetemi jegyzet: Debrecen, Hungary, 1994. [Google Scholar]
- Smith, C.W.; Aptroot, A.; Coppins, B.J.; Fletcher, A.; Gilbert, O.L.; James, P.W.; Wolseley, P.A. The Lichens of Great Britain and Ireland; British Lichen Society: London, UK, 2009; 1046p. [Google Scholar]
- Arup, U.; Ekman, S.; Lindblom, L.; Mattsson, J.-E. High Performance Thin Layer Chromatography (HPTLC), an Improved Technique for Screening Lichen Substances. Lichenologist 1993, 25, 61–71. [Google Scholar] [CrossRef]
- Erzberger, P.; Schröder, W. The Genus Bryum (Bryaceae, Musci) in Hungary. Stud. Bot. Hung. 2013, 44, 5–192. [Google Scholar]
- Hodgetts, N.G.; Söderström, L.; Blockeel, T.L.; Caspari, S.; Ignatov, M.S.; Konstantinova, N.A.; Lockhart, N.; Papp, B.; Schröck, C.; Sim-Sim, M.; et al. An Annotated Checklist of Bryophytes of Europe, Macaronesia and Cyprus. J. Bryol. 2020, 42, 1–116. [Google Scholar] [CrossRef]
- Lepš, J.; Šmilauer, P. Multivariate Analysis of Ecological Data Using CANOCO, 1st ed.; Cambridge University Press: Cambridge, UK, 2003; ISBN 978-0-521-81409-6. [Google Scholar]
- Shannon, C.E. A Mathematical Theory of Communication. Bell Syst. Tech. J. 1948, 27, 379–423. [Google Scholar] [CrossRef]


| Site, Year, Management | Mean ± SE | ||
|---|---|---|---|
| Lichens | Bryophytes | Cryptogams | |
| CC 2013 grazed | 0.85 ± 0.11 b | 1.98 ± 0.09 a | 2.83 ± 0.15 b |
| CC 2013 fenced | 1.75 ± 0.20 a | 1.75 ± 0.08 ab | 3.50 ± 0.24 a |
| CC 2018 grazing ceased | 1.35 ± 0.13 ab | 1.60 ± 0.09 b | 2.95 ± 0.14 ab |
| CC 2018 fenced | 1.20 ± 0.09 b | 0.48 ± 0.08 ab | 2.98 ± 0.10 ab |
| H-value | 18.47 | 10.88 | 5.63 |
| p-value | <0.001 | 0.01 | 0.13 |
| FV 2013 grazed | 1.03 ± 0.08 b | 2.45 ± 0.14 a | 3.48 ± 0.19 a |
| FV 2013 fenced | 1.45 ± 0.09 a | 0.73 ± 0.12 b | 3.43 ± 0.16 a |
| FV 2018 grazed | 1.13 ± 0.06 b | 1.23 ± 0.08 c | 2.35 ± 0.12 b |
| FV 2018 fenced | 1.53 ± 0.09 a | 1.60 ± 0.09 bc | 3.13 ± 0.14 a |
| H-value | 25.42 | 49.00 | 32.18 |
| p-value | <0.001 | <0.001 | <0.001 |
| Site, Year, Management | Mean ± SE (g/0.01 m2) | ||
|---|---|---|---|
| Lichens | Bryophytes | Cryptogams | |
| CC 2013 grazed | 0.06 ± 0.01 b | 0.35 ± 0.07 a | 0.41 ± 0.07 b |
| CC 2013 fenced | 0.42 ± 0.10 b | 0.47 ± 0.08 a | 0.89 ± 0.11 b |
| CC 2018 grazing ceased | 0.42 ± 0.12 b | 0.72 ± 0.09 a | 1.14 ± 0.12 b |
| CC 2018 fenced | 1.58 ± 0.47 a | 0.68 ± 0.14 a | 2.26 ± 0.46 a |
| H-value | 28.70 | 12.26 | 36.87 |
| p-value | <0.001 | 0.01 | <0.001 |
| FV 2013 grazed | 0.16 ± 0.03 b | 1.05 ± 0.15 b | 1.21 ± 0.16 b |
| FV 2013 fenced | 0.59 ± 0.09 b | 2.25 ± 0.33 a | 2.84 ± 0.39 a |
| FV 2018 grazed | 0.07 ± 0.01 b | 0.17 ± 0.03 c | 0.24 ± 0.03 b |
| FV 2018 fenced | 2.08 ± 0.37 a | 0.63 ± 0.14 bc | 2.70 ± 0.39 a |
| H-value | 67.25 | 55.37 | 63.15 |
| p-value | <0.001 | <0.001 | <0.001 |
| chi2 | p-Value | ||
|---|---|---|---|
| 5 categories (df = 4) | Species richness | 10.595 | 0.032 |
| biomass | 11.917 | 0.018 | |
| 3 categories (df = 2) | Species richness | 8.591 | 0.014 |
| biomass | 9.188 | 0.010 |
| (a) | |||||||||||
| rCC = 0.2336 ni: 10 | ANOVA | df | SS | MS | F | p | Parameter | SE | t | p | |
| regression | 2 | 6.154 | 3.077 | 4.5313 | 0.0122 | a | 3.555 | 0.263 | 13.526 | <0.0001 | |
| residual | 157 | 106.621 | 0.679 | b | 8.456 | 1.822 | 4.642 | <0.0001 | |||
| total | 159 | 112.775 | 0.709 | x0 | 6.270 | 1.237 | 5.069 | <0.0001 | |||
| rFV = 0.2648 ni: 12 | ANOVA | df | SS | MS | F | p | Parameter | SE | t | p | |
| regression | 2 | 9.058 | 4.529 | 5.9184 | 0.0033 | a | 3.293 | 0.144 | 22.938 | <0.0001 | |
| residual | 157 | 120.136 | 0.765 | b | 5.966 | 1.011 | 5.901 | <0.0001 | |||
| total | 159 | 129.194 | 0.813 | x0 | 3.998 | 0.48 | 8.325 | <0.0001 | |||
| (b) | |||||||||||
| rCC = 0.2295 ni: 15 | ANOVA | df | SS | MS | F | p | Parameter | SE | t | p | |
| regression | 2 | 5.938 | 2.969 | 4.363 | 0.014 | a | 3.537 | 0.278 | 12.724 | <0.0001 | |
| residual | 157 | 106.837 | 0.681 | b | 10.825 | 2.631 | 4.115 | <0.0001 | |||
| total | 159 | 112.775 | 0.709 | x0 | 5.956 | 1.286 | 4.630 | <0.0001 | |||
| rFV = 0.2582 ni: 9 | ANOVA | df | SS | MS | F | p | Parameter | SE | t | p | |
| regression | 2 | 8.614 | 4.307 | 5.608 | 0.004 | a | 3.277 | 0.147 | 22.244 | <0.0001 | |
| residual | 157 | 120.580 | 0.768 | b | 7.939 | 1.536 | 5.169 | <0.0001 | |||
| total | 159 | 129.194 | 0.813 | x0 | 3.842 | 0.502 | 7.652 | <0.0001 | |||
| Period | CC | FV | ||
|---|---|---|---|---|
| Lichens | Bryophytes | Lichens | Bryophytes | |
| July 2008–March 2013 | 8.4 | 2.2 | 10.0 | 26.7 |
| March 2013–October 2018 | 20.1 | 3.9 | 26.6 | −29.5 |
| Shannon’s Diversity | CC | FV | |||||||
|---|---|---|---|---|---|---|---|---|---|
| 2013 | 2013 | 2018 | 2018 | 2013 | 2013 | 2018 | 2018 | ||
| Grazed | Fenced | Grazing Ceased | Fenced | Grazed | Fenced | Grazed | Fenced | ||
| Frequency | H′ | 1.593 | 1.838 | 1.679 | 1.443 | 1.628 | 1.681 | 1.365 | 1.601 |
| Evenness | 0.6038 | 0.6963 | 0.6363 | 0.5467 | 0.741 | 0.765 | 0.6214 | 0.7286 | |
| Biomass | H′ | 1.059 | 1.231 | 1.098 | 0.828 | 1.147 | 1.082 | 1.156 | 0.689 |
| Evenness | 0.4012 | 0.4664 | 0.4159 | 0.3138 | 0.522 | 0.4923 | 0.5261 | 0.3136 | |
| Max. | 2.639 | 2.197 | |||||||
| Dry Calluna heathland, Yorkshire, Coppins and Shimwell (1971) | ||||
| Pioneer | Building | Mature | Mature/degrading | |
| H′ | 1.326 | 0.402 | 0.346 | 0.607 |
| Evenness | 0.5757 | 0.1746 | 0.1503 | 0.2638 |
| Brometum tectorum, Csévharaszt, Verseghy (1977) | ||||
| 03.1971 | 10.1971 | 03.1972 | 10.1972 | |
| H′ | 0.783 | 0.435 | 0.653 | 0.902 |
| Evenness | 0.7125 | 0.3960 | 0.5948 | 0.8208 |
| Festucetum vaginatae danubiale, Csévharaszt, Verseghy (1977) | ||||
| 03.1971 | 10.1971 | 03.1972 | 10.1972 | |
| H′ | 1.015 | 1.505 | 1.177 | 1.087 |
| Evenness | 0.6306 | 0.9352 | 0.7310 | 0.6754 |
| Festuco vaginatae–Corynephoretum, Nyírség, this study | ||||
| 03.2013 | ||||
| CC grazed | CC fenced | FV grazed | FV fenced | |
| H′ | 0.941 | 0.362 | 0.316 | 0.239 |
| Evenness | 0.4085 | 0.1572 | 0.1963 | 0.1484 |
| 10.2018 | ||||
| CC grazing ceased | CC fenced | FV grazed | FV fenced | |
| H′ | 0.673 | 0.101 | 0.299 | 0.040 |
| Evenness | 0.2922 | 0.0437 | 0.1861 | 0.0248 |
Disclaimer/Publisher’s Note: The statements, opinions and data contained in all publications are solely those of the individual author(s) and contributor(s) and not of MDPI and/or the editor(s). MDPI and/or the editor(s) disclaim responsibility for any injury to people or property resulting from any ideas, methods, instructions or products referred to in the content. |
© 2023 by the authors. Licensee MDPI, Basel, Switzerland. This article is an open access article distributed under the terms and conditions of the Creative Commons Attribution (CC BY) license (https://creativecommons.org/licenses/by/4.0/).
Share and Cite
Aszalósné Balogh, R.; Farkas, E.; Tüdősné Budai, J.; Lőkös, L.; Matus, G. Cryptogamic Biomass in Pannonic Acidic Sand Steppes Subject to Changing Land-Use. Plants 2023, 12, 2972. https://doi.org/10.3390/plants12162972
Aszalósné Balogh R, Farkas E, Tüdősné Budai J, Lőkös L, Matus G. Cryptogamic Biomass in Pannonic Acidic Sand Steppes Subject to Changing Land-Use. Plants. 2023; 12(16):2972. https://doi.org/10.3390/plants12162972
Chicago/Turabian StyleAszalósné Balogh, Rebeka, Edit Farkas, Júlia Tüdősné Budai, László Lőkös, and Gábor Matus. 2023. "Cryptogamic Biomass in Pannonic Acidic Sand Steppes Subject to Changing Land-Use" Plants 12, no. 16: 2972. https://doi.org/10.3390/plants12162972
APA StyleAszalósné Balogh, R., Farkas, E., Tüdősné Budai, J., Lőkös, L., & Matus, G. (2023). Cryptogamic Biomass in Pannonic Acidic Sand Steppes Subject to Changing Land-Use. Plants, 12(16), 2972. https://doi.org/10.3390/plants12162972