Article

Genome-Wide Association Studies Using 3VmrMLM Model Provide New Insights into Branched-Chain Amino Acid Contents in Rice Grains

School of Tropical Agriculture and Forestry, School of Tropical Crops, Hainan University, Haikou 570228, China
*
Author to whom correspondence should be addressed.
These authors contributed equally to this work.
Plants 2023, 12(16), 2970; https://doi.org/10.3390/plants12162970
Submission received: 28 June 2023 / Revised: 7 August 2023 / Accepted: 9 August 2023 / Published: 17 August 2023

Abstract

:
Rice (Oryza sativa L.) is a globally important food source providing carbohydrates, amino acids, and dietary fiber for humans and livestock. The branched-chain amino acid (BCAA) level is a complex trait related to the nutrient quality of rice. However, the genetic mechanism underlying the BCAA (valine, leucine, and isoleucine) accumulation in rice grains remains largely unclear. In this study, the grain BCAA contents and 239,055 SNPs of a diverse panel containing 422 rice accessions were adopted to perform a genome-wide association study (GWAS) using a recently proposed 3VmrMLM model. A total of 357 BCAA-content-associated main-effect quantitative trait nucleotides (QTNs) were identified from 15 datasets (12 BCAA content datasets and 3 BLUP datasets of BCAA). Furthermore, the allelic variation of two novel candidate genes, LOC_Os01g52530 and LOC_Os06g15420, responsible for the isoleucine (Ile) content alteration were identified. To reveal the genetic basis of the potential interactions between the gene and environmental factor, 53 QTN-by-environment interactions (QEIs) were detected using the 3VmrMLM model. The LOC_Os03g24460, LOC_Os01g55590, and LOC_Os12g31820 were considered as the candidate genes potentially contributing to the valine (Val), leucine (Leu), and isoleucine (Ile) accumulations, respectively. Additionally, 10 QTN-by-QTN interactions (QQIs) were detected using the 3VmrMLM model, which were putative gene-by-gene interactions related to the Leu and Ile contents. Taken together, these findings suggest that the implementation of the 3VmrMLM model in a GWAS may provide new insights into the deeper understanding of BCAA accumulation in rice grains. The identified QTNs/QEIs/QQIs serve as potential targets for the genetic improvement of rice with high BCAA levels.

1. Introduction

Rice is one of the most important staple foods, feeding more than half of the global population. It provides carbohydrates, amino acids, dietary fiber, etc., for the nutritional supplementation to humans [1,2,3,4]. Of the nine essential amino acids (valine, leucine, isoleucine, phenylalanine, tryptophan, threonine, lysine, methionine, and histidine), valine (Val), leucine (Leu), and isoleucine (Ile) are known as branched-chain amino acids (BCAAs), which are synthesized in plants and microbes, but not in humans [5,6]. Several studies have reviewed the nutritional importance of BCAAs in human health, such as protein synthesis, insulin secretion, and aging [5,7,8,9,10]. Due to the insufficient amount of BCAAs in rice grains, increasing the BCAA levels to meet the nutritional demands for dietary supplementation is becoming an emerging goal for the genetic improvement of nutrient quality.
A genome-wide association study, as a powerful tool, is widely used in the genetic dissection of complex traits controlled by polygenes [11,12,13]. For statistical models and their corresponding power of a GWAS, the adoption of single-locus model, such as GEMMA and MLM, has been proven to control spurious associations, and it has advantages in the detection of an association locus with a large effect [14,15]. However, low power in the detection of marker-trait associations may be affected by the stringent threshold via the Bonferroni correction [16]. To address this issue, a series of multi-locus GWAS models have been proposed to detect the quantitative trait nucleotide/locus (QTN/QTL) with a large and small effect in an efficient and accurate manner, such as MLMM, FarmCPU, mrMLM, pLARmEB, FASTmrEMMA, pKWmEB, FASTmrMLM, and ISIS EM-BLASSO [17,18,19,20,21,22,23]. To further decipher the genotypic effects including additive and dominance effects, recently, a new GWAS model based on the framework of mrMLM, namely 3VmrMLM, was proposed to estimate the additive and dominance effects of three marker genotypes (AA, Aa, and aa) using the polygenic background of the genotypic effects. Moreover, the main-effect QTN, QTN-by-environment interaction (QEI), and QTN-by-QTN interaction (QQI) can be detected using the 3VmrMLM model for a deeper understanding of the genetic architecture of the complex and multi-omics traits [24].
With the advances in technology and the low cost of metabolomics assays, tremendous progress has been made using the metabolite-based genome-wide association study (mGWAS) approach, which has been widely applied in the elucidation of the genetic and biochemical bases of the metabolite of interest [25,26,27,28]. Using the mGWAS strategy, several loci controlling the content alteration of primary and secondary metabolites were identified in plants [26,29,30,31,32,33,34,35]. As a primary metabolite, the main-effect QTNs/QTLs and candidate genes associated with the BCAA contents in rice were identified in previous studies [31,32]. For instance, the function of the OsAUX5 (which encodes the amino acid transporter) gene in the uptake of valine and leucine was proven in our previous study of neutral essential amino acid accumulation in rice grains [30]. Moreover, the natural variation in OsbZIP18 contributing to the BCAA levels was also reported in rice leaf [29]. Even though the genetic dissection of BCAA accumulation has been partially achieved, the genetic architectures of the QEI and QQI related to the BCAA levels in rice grains are largely unknown.
To obtain new insight into the genetic basis underlying the BCAA accumulation in rice grains, a genome-wide association study (GWAS) was performed on a diverse panel of 422 rice accessions with 239,055 SNPs; the association panel contained 272 indica accessions and 150 japonica accessions. Using the recently proposed 3VmrMLM model, the main-effect quantitative trait nucleotides (QTNs), QTN-by-environment interactions (QEIs), and QTN-by-QTN interactions (QQIs) associated with the BCAA accumulation were identified in the BCAA content datasets (one BCAA with two years and two replicates per year). The objective of this study is to identify the candidate genes that control the BCAA levels and are potentially involved in the gene-by-environment and gene-by-gene interactions in rice grains.

2. Results

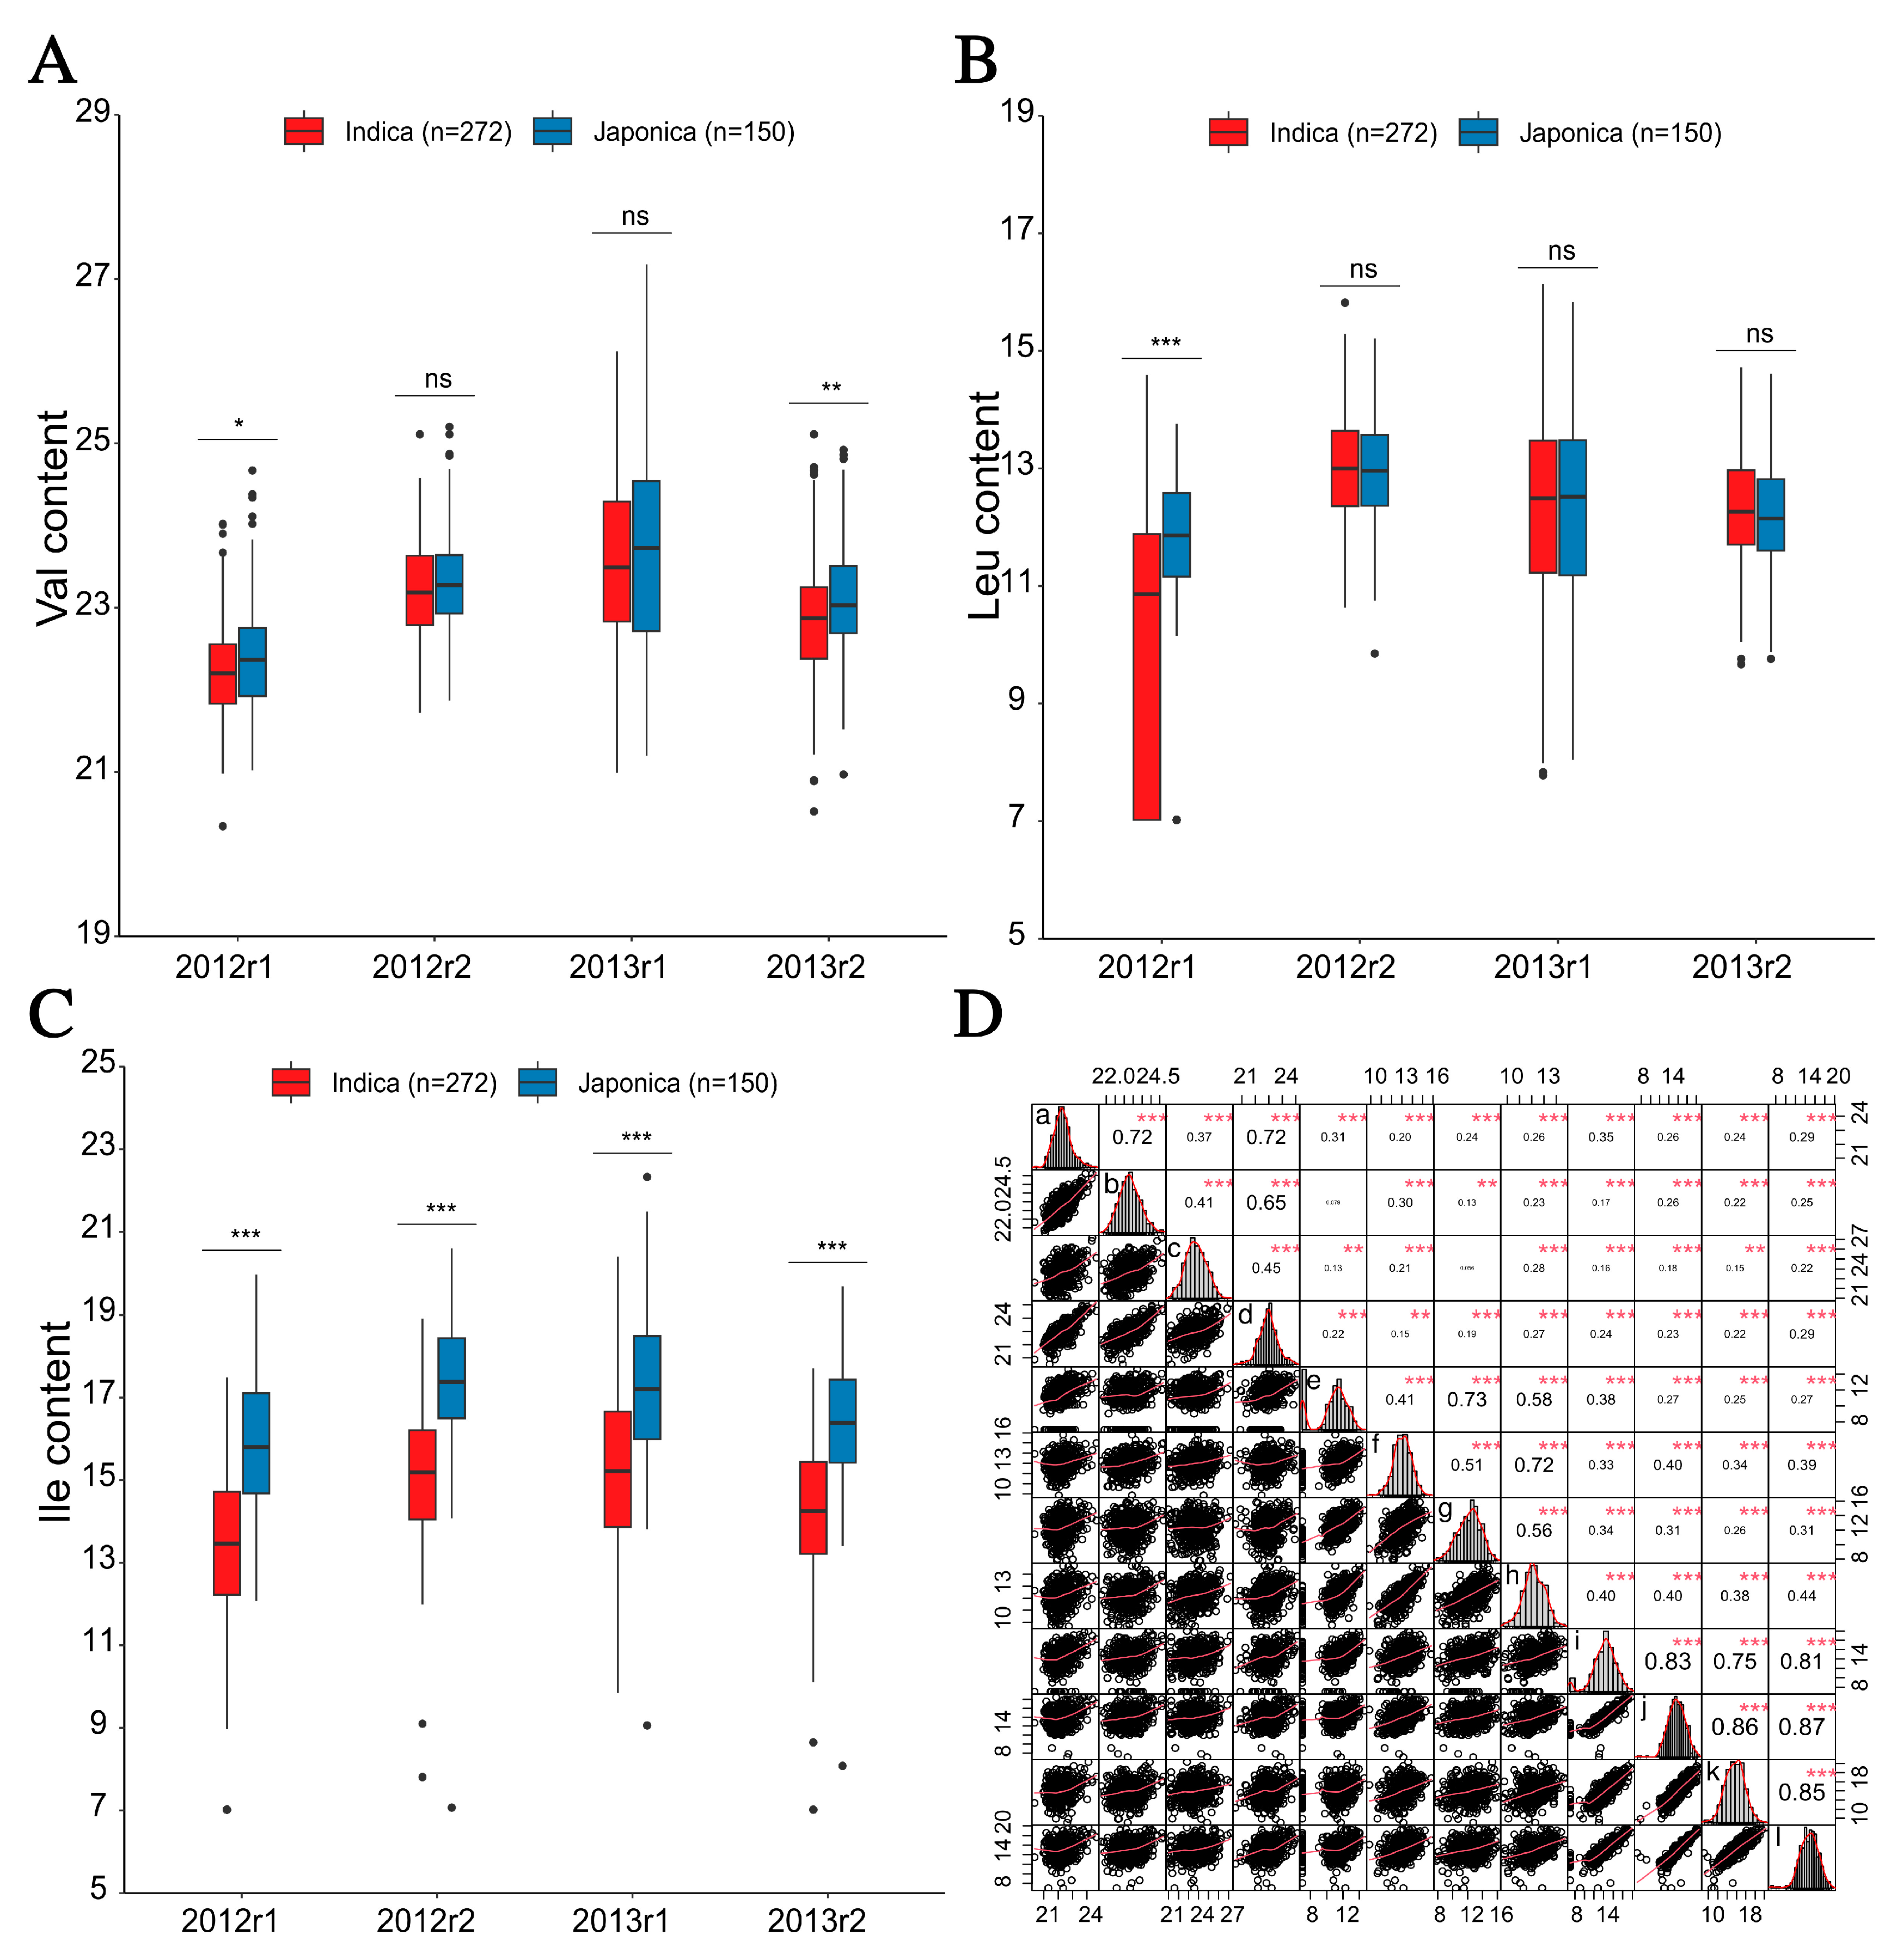
2.1. Phenotypic Variation and Correlation Analysis

Using the LC-MS approach, the grain BCAA (Val for valine, Leu for leucine, and Ile for isoleucine) contents of 422 rice accessions were qualified for the analysis of phenotypic variation. As a result, a wide range of variation coefficient (CV) was observed from 53.65% to 219.03% across the 12 BCAA content datasets (Val, Leu, and Ile with two years by two replicates per year) (Table 1). Given that most of the skewness and kurtosis of the 12 content datasets were <1, these showed the quantitative nature of the BCAA contents. The estimated broad-sense heritability (H2) for Val, Leu, and Ile was from 0.45 to 0.82 (Table 1). Additionally, significant differences in the BCAA levels were observed between the indica and japonica accessions in this genetic panel (Figure 1A–C). For each BCAA, high correlation coefficients between the BCAA contents were observed across different content datasets. For instance, the significantly highest correlation coefficient with 0.87 was observed between the I_12r2 (the Ile content dataset of the second replicate of 2012) and I_13r2 datasets (the Ile content dataset of the second replicate of 2013) (Figure 1D). These indicated that the variation of the grain BCAA levels was present in this genetic panel.

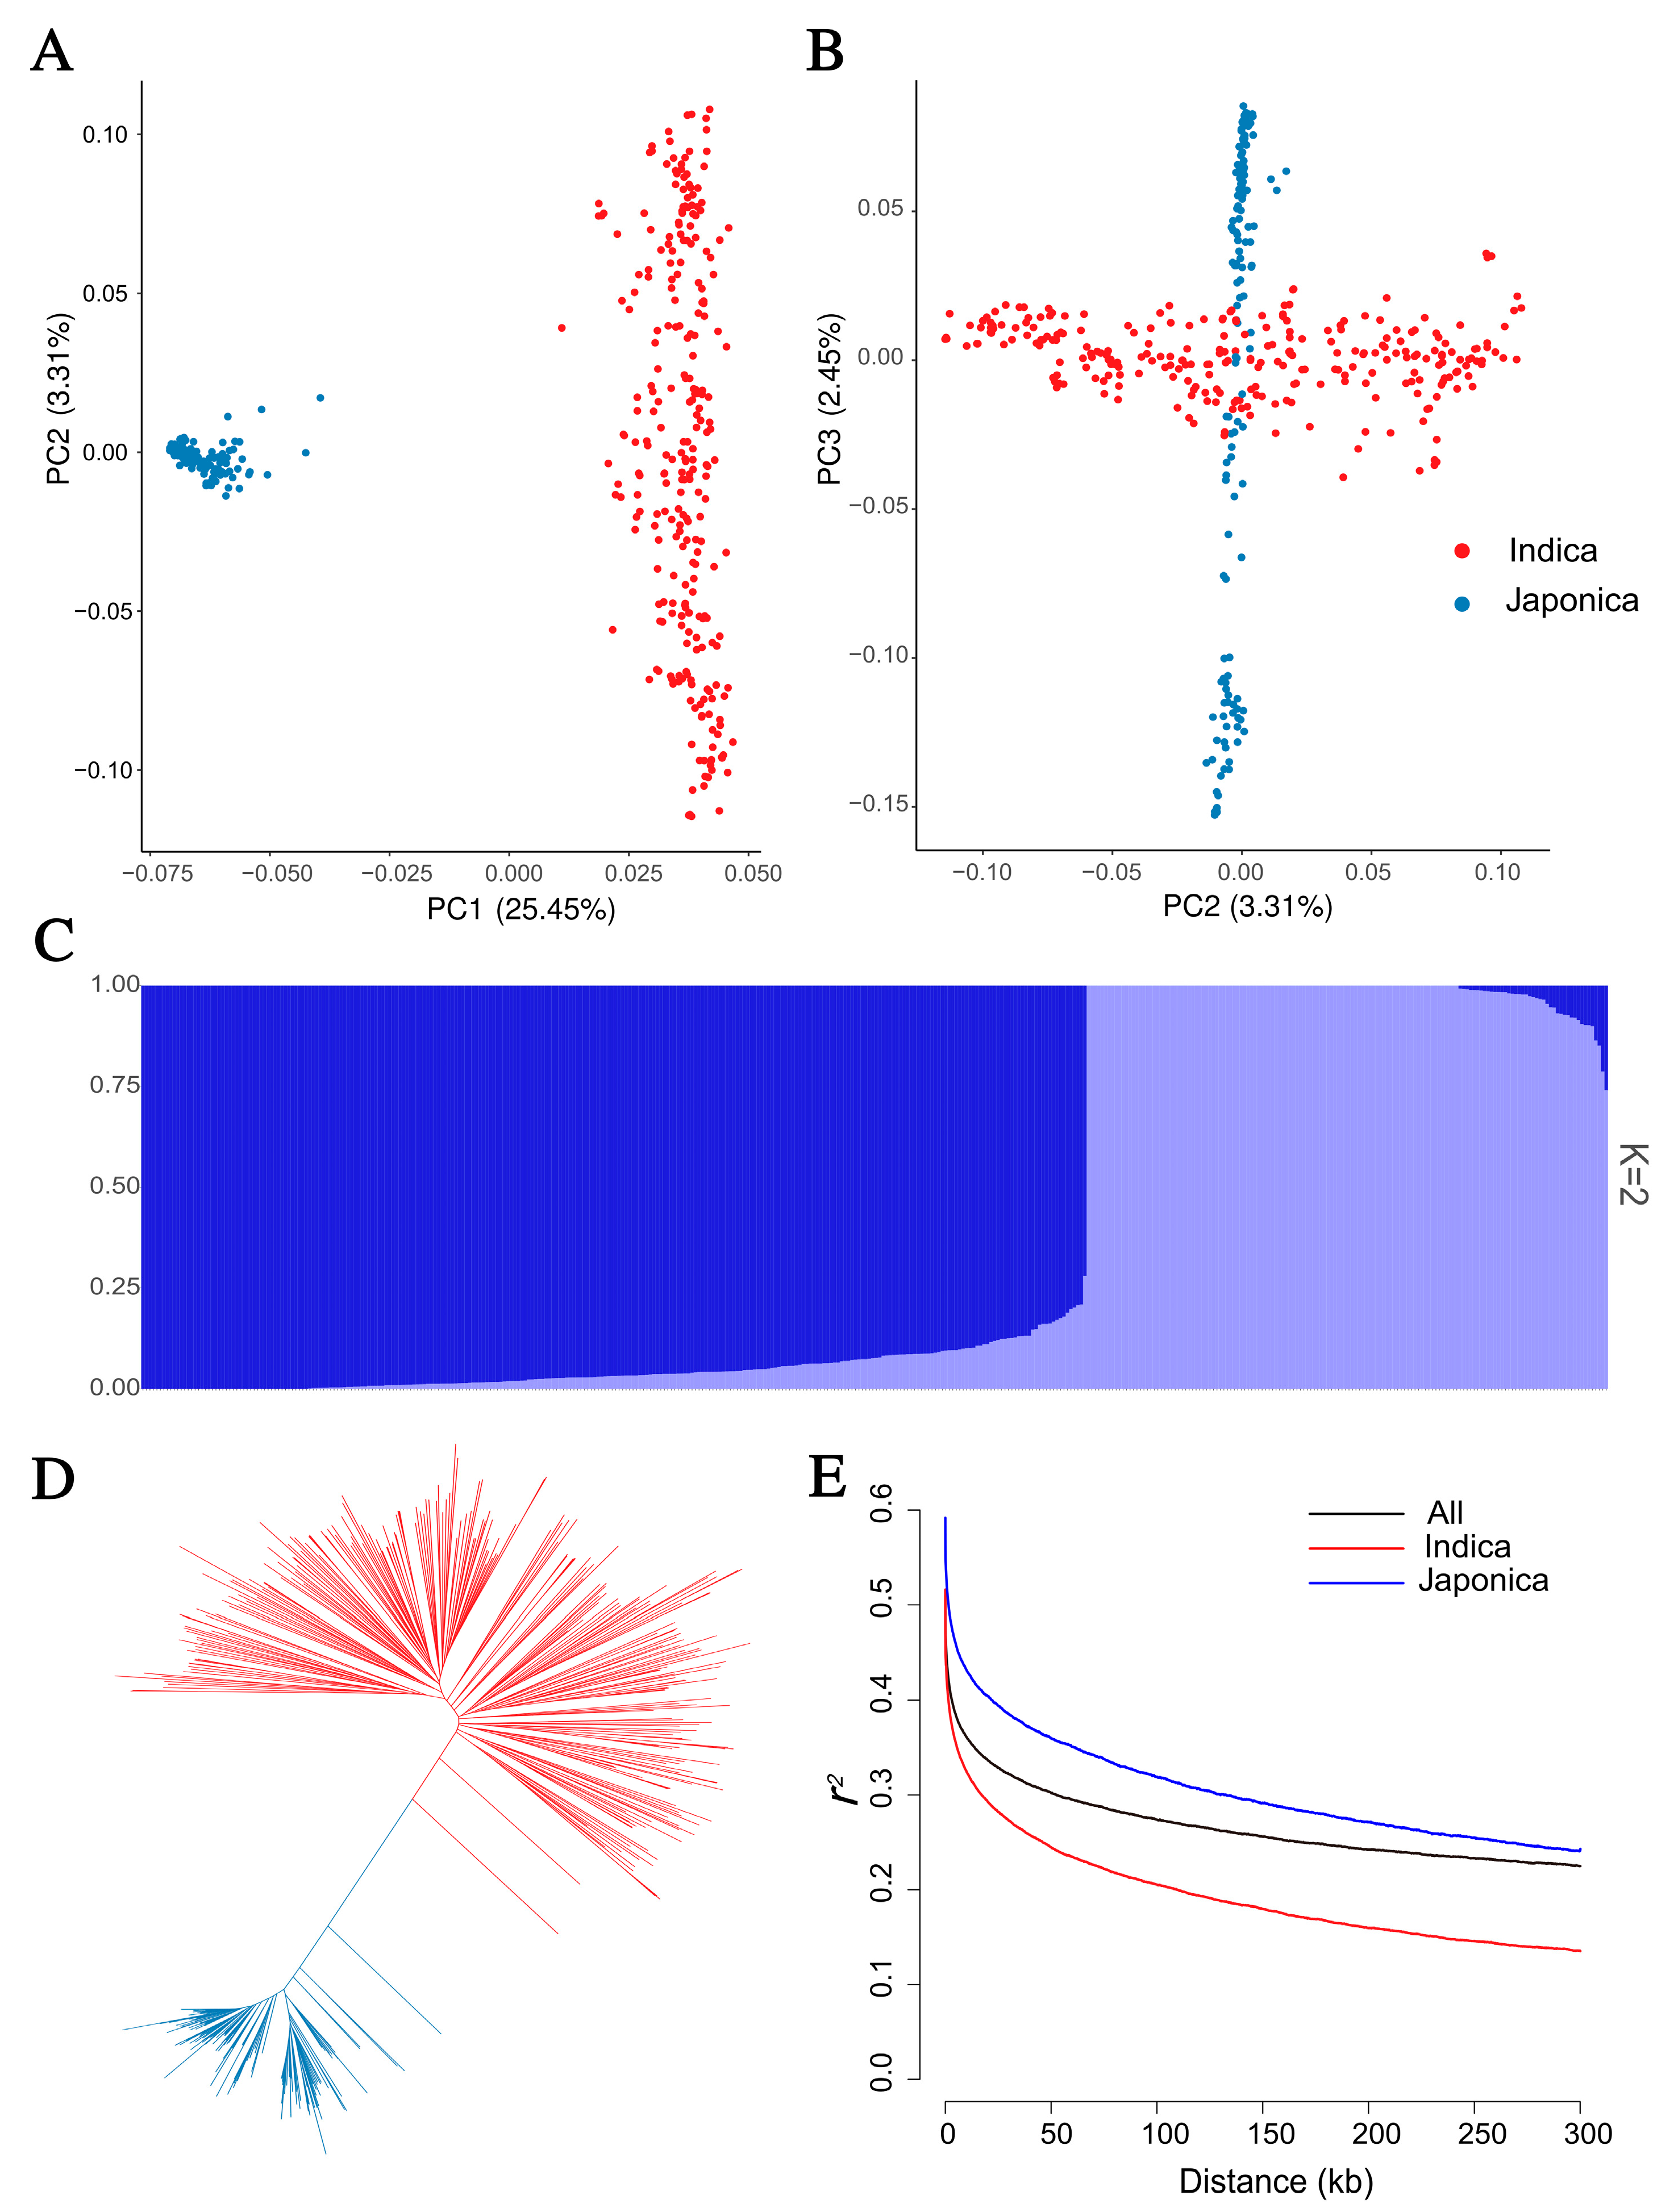
2.2. Population Analysis of 422 Rice Accessions

To dissect the genetic architecture of this rice panel, the relationship of 422 rice accessions were assessed on the basis of 239,055 SNPs. A principal component analysis (PCA) showed that these accessions were classified into two groups (Figure 2A,B), which mainly included 272 indica accessions and 150 japonica accessions. An ADIMIXTURE-based population structure analysis and neighbor-joining (NJ) tree-based phylogenetic analysis also showed identical results (Figure 2C,D). To investigate the linkage disequilibrium (LD) decay of this genetic panel, an r2-based LD analysis showed that the whole genome LD of all the accessions decayed the fastest before 122 kb, and became flat gradually (Figure 2E). In addition, the LD decay rate of the indica accessions was higher than the japonica accessions, which is also seen in Figure 2E.

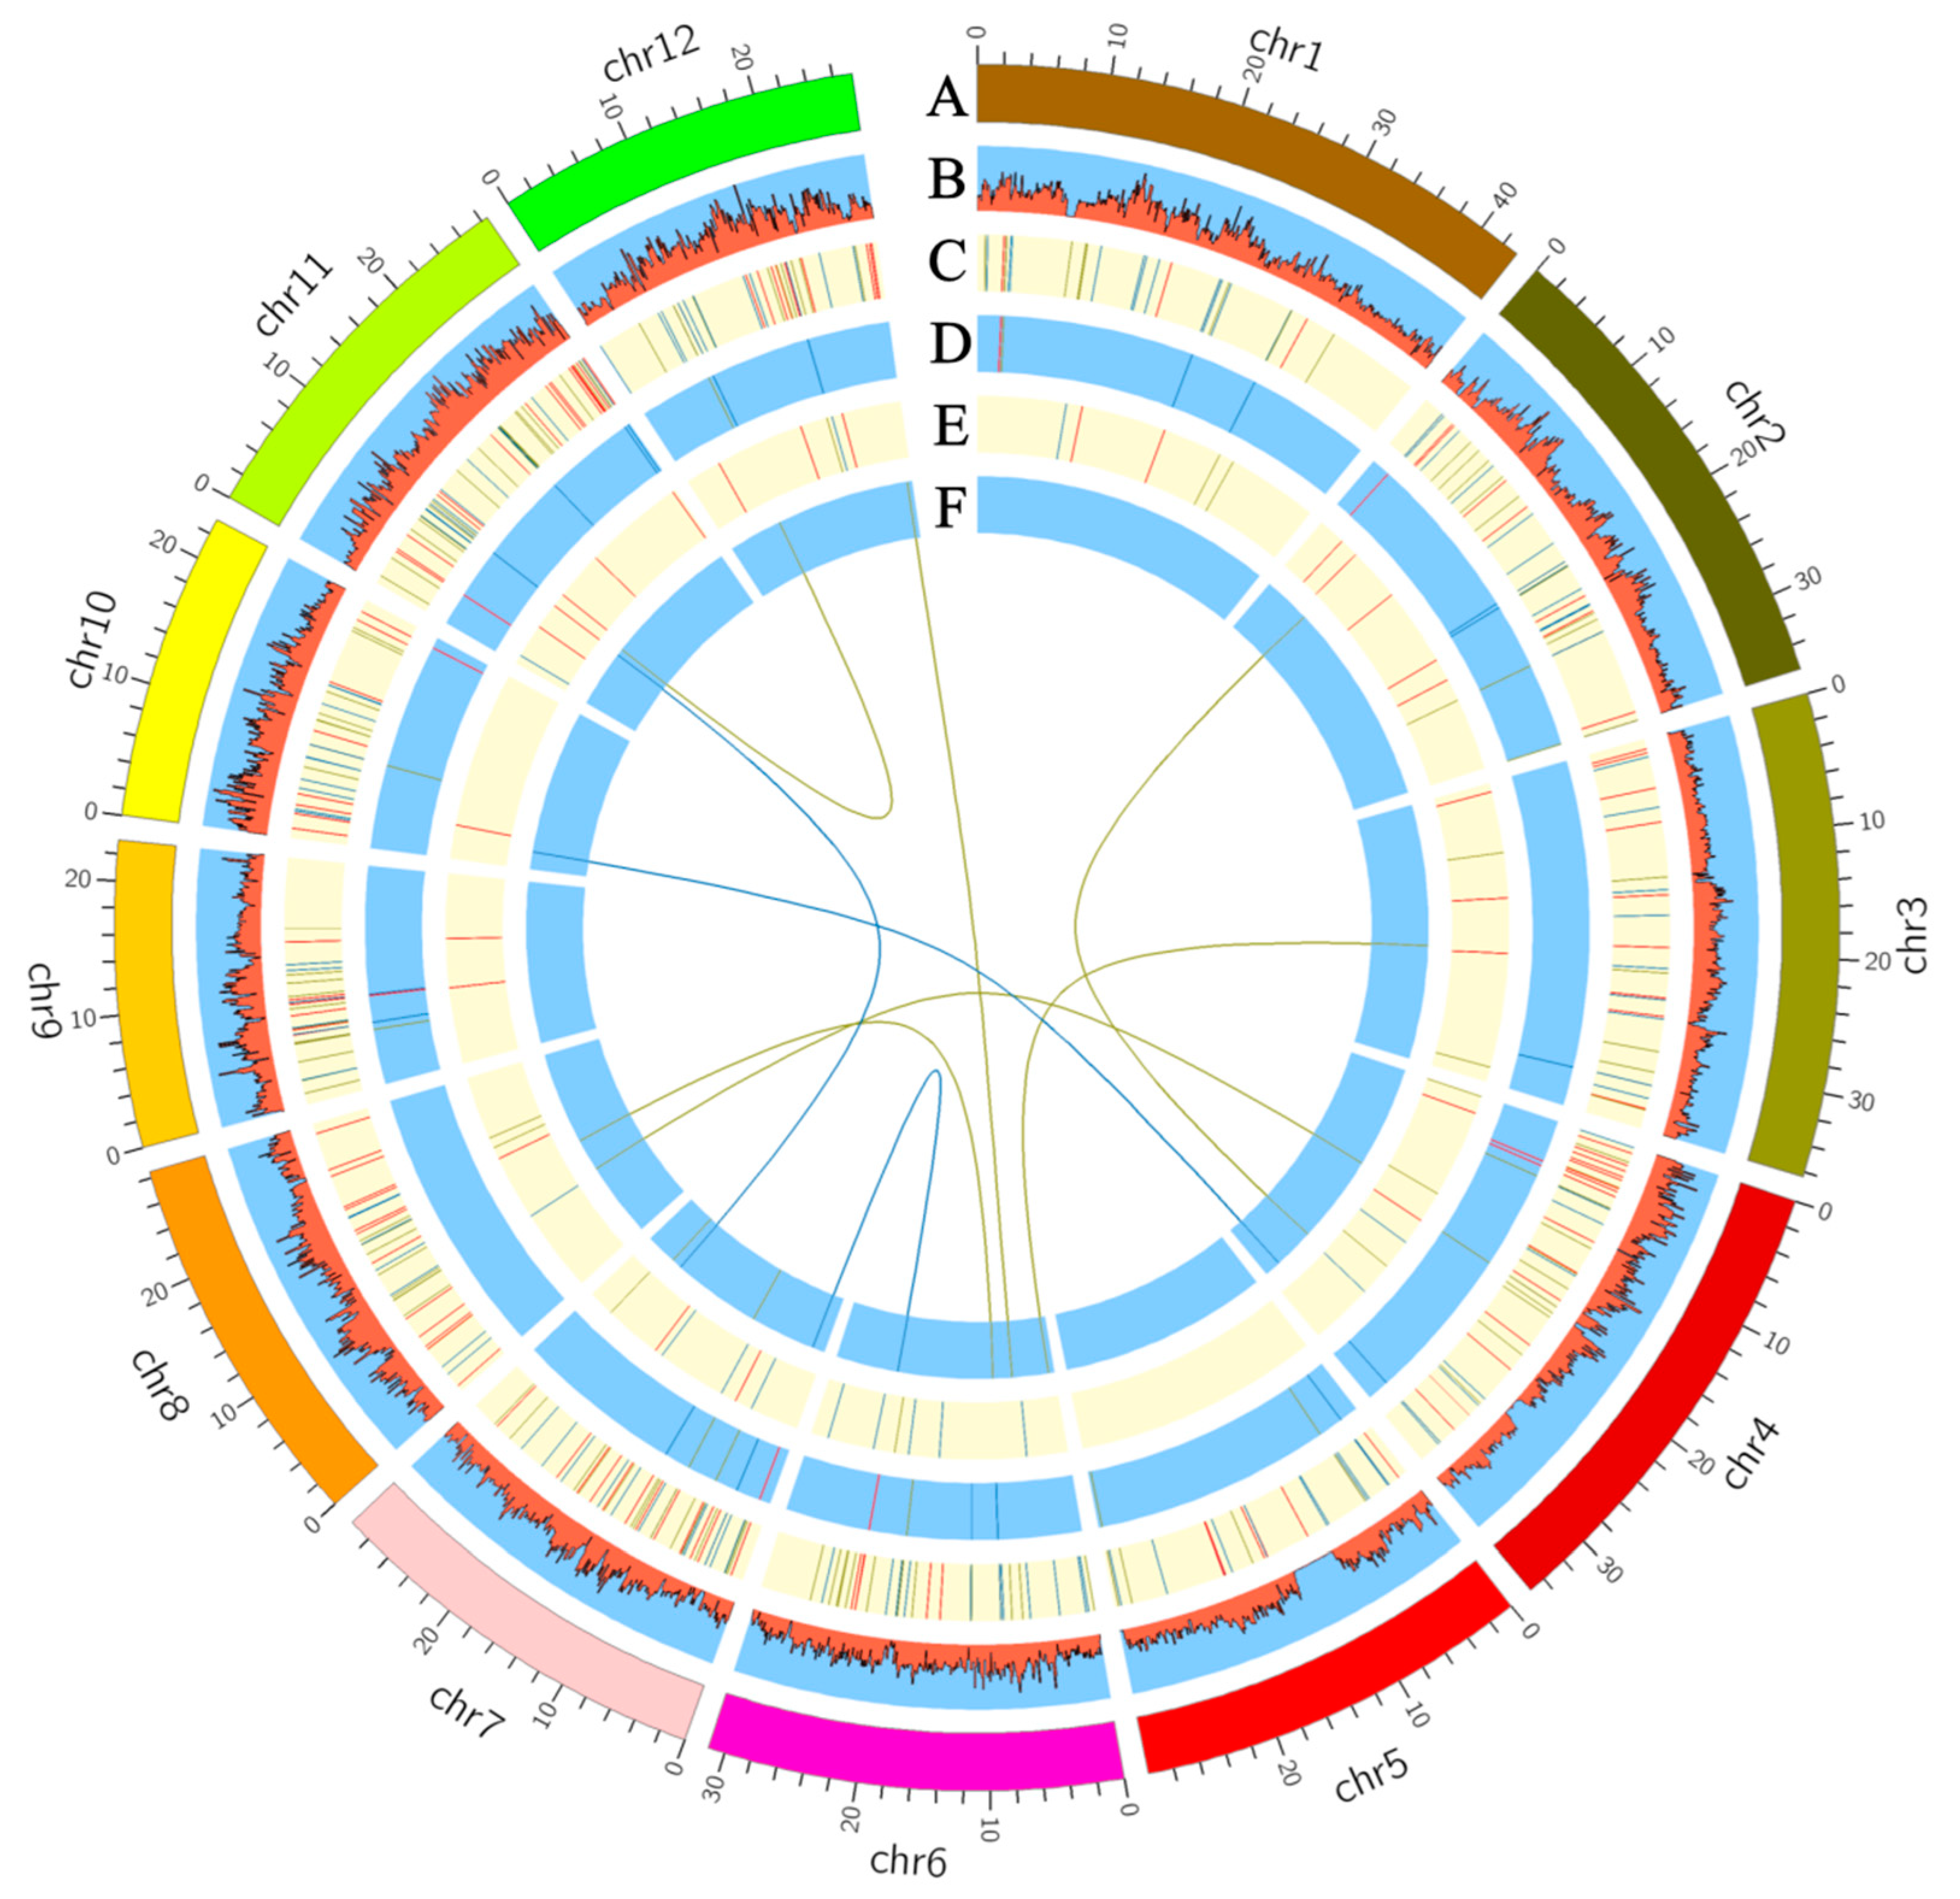
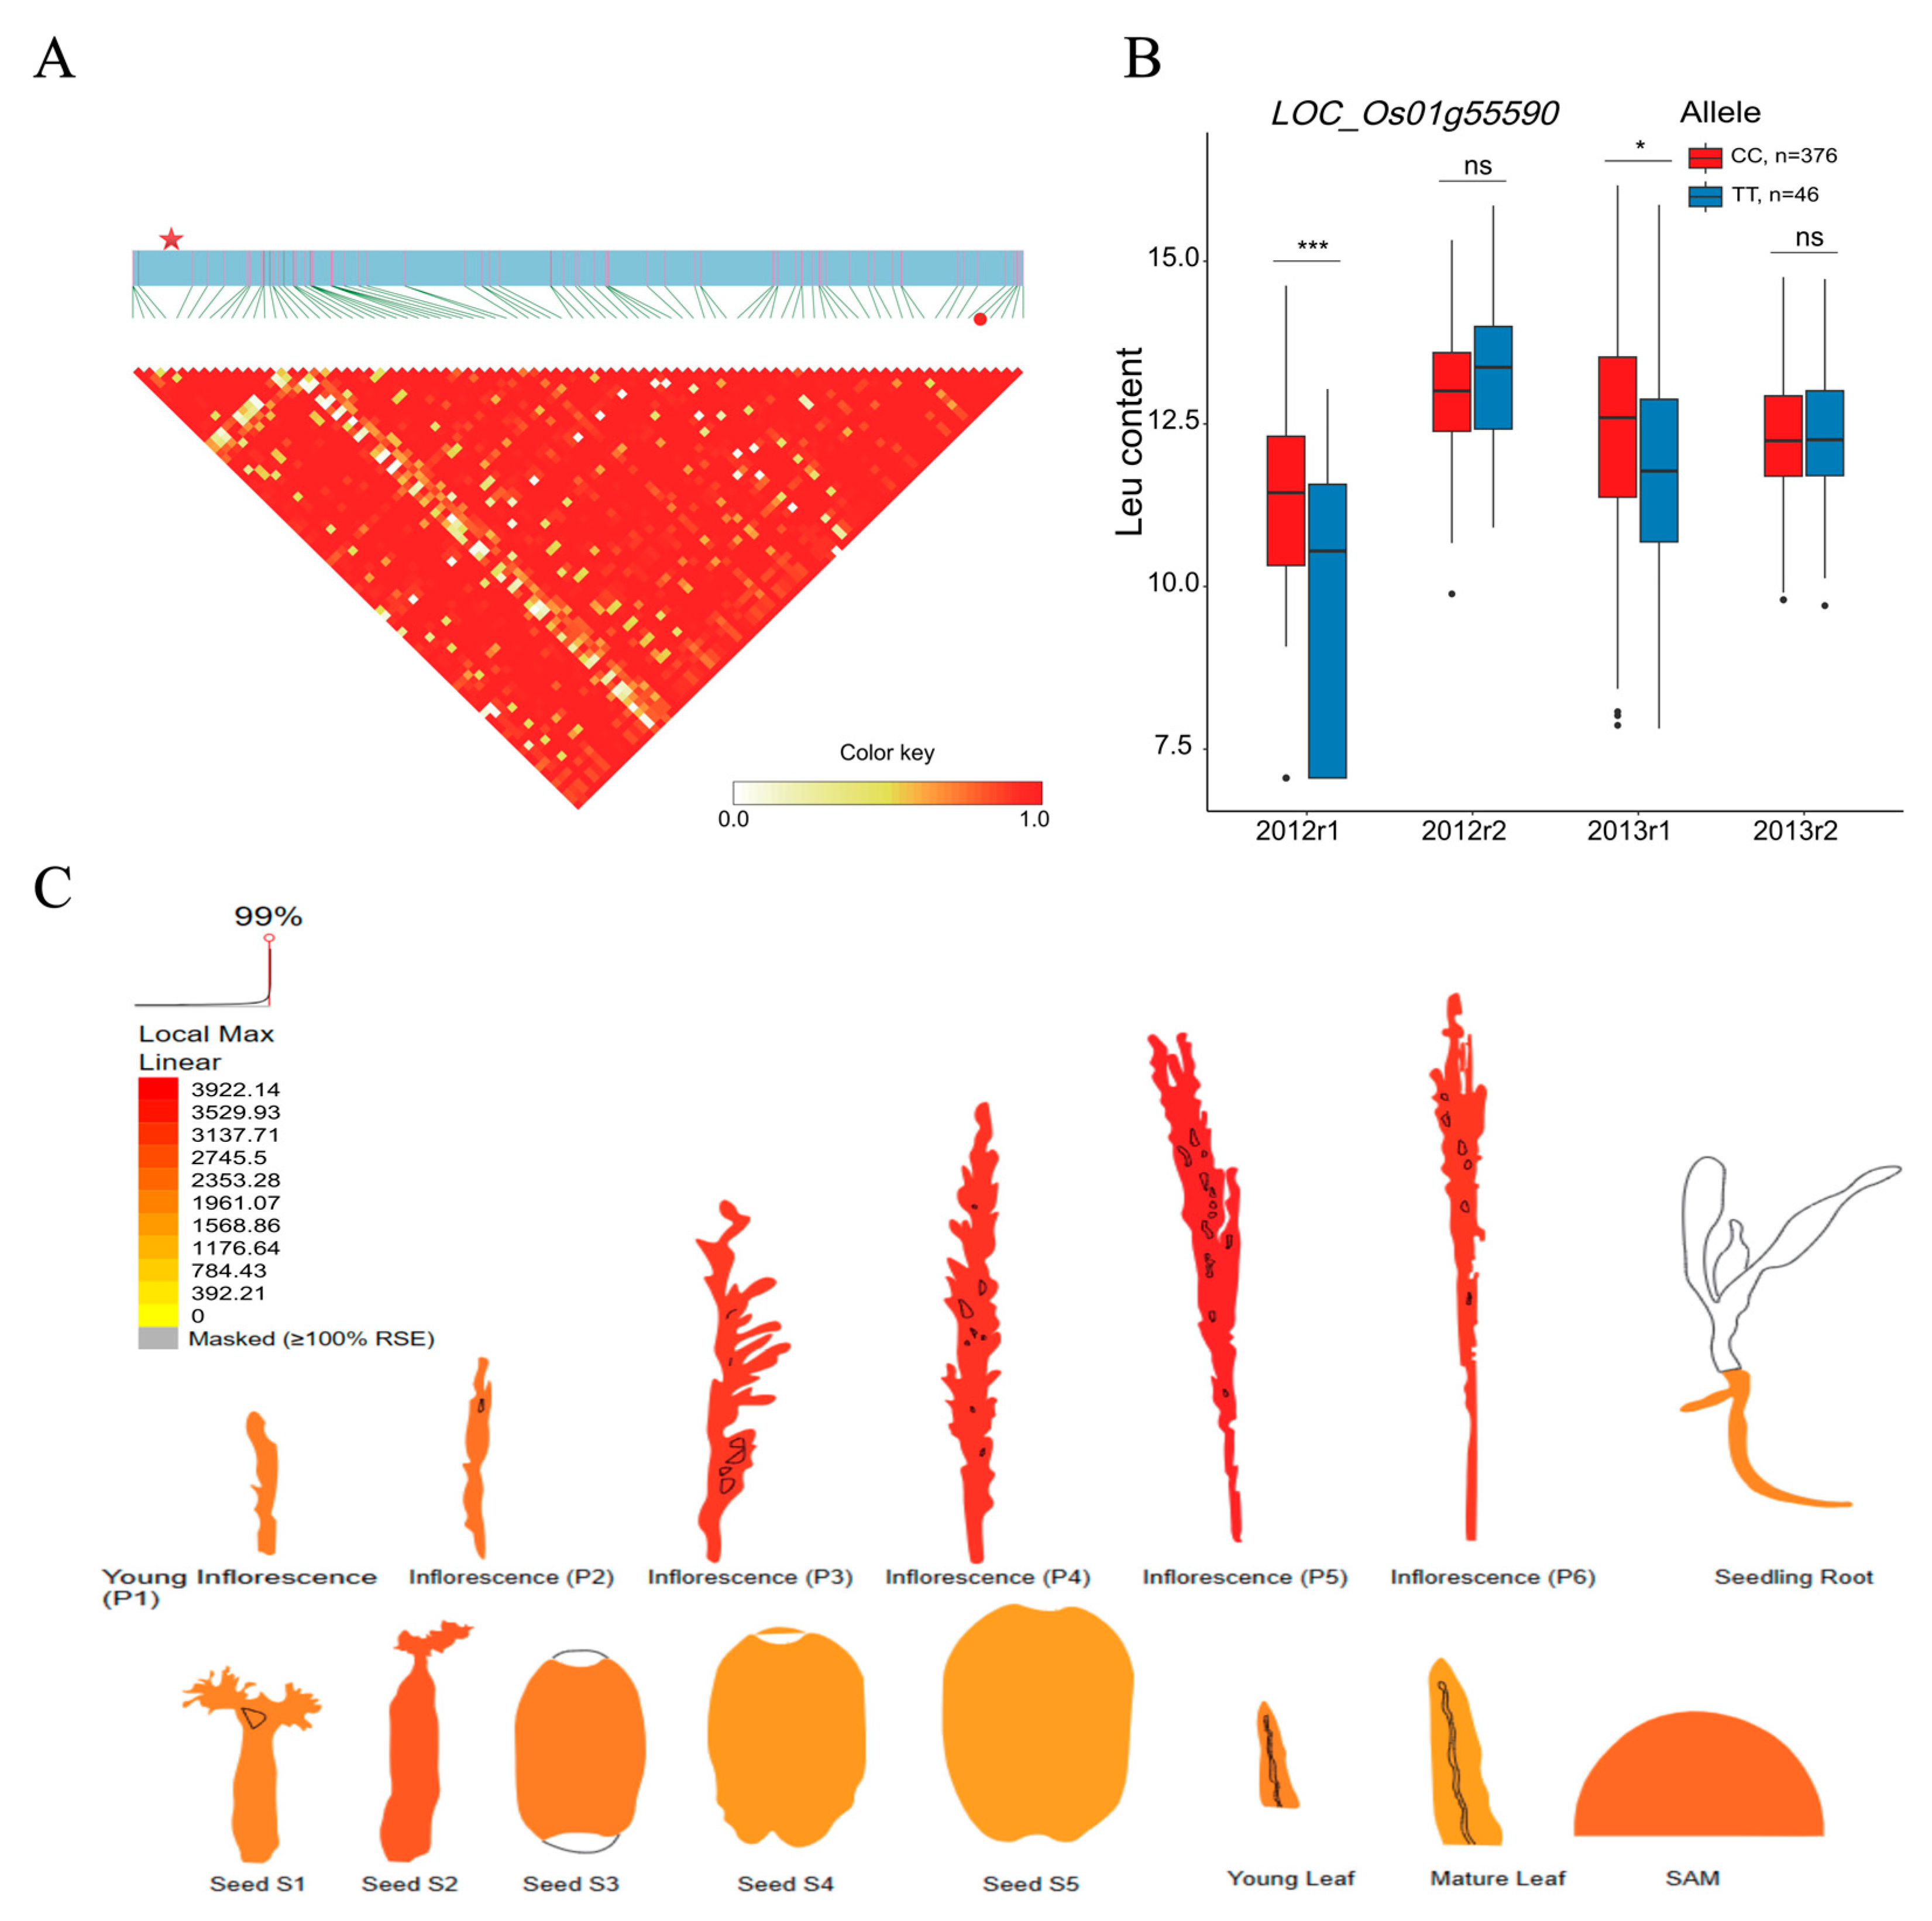
2.3. BCAA-Level-Associated QTNs and Candidate Genes

Using the newly released 3VmrMLM model, a total of 357 main-effect QTNs associated with the BCAA content were detected from 15 datasets (12 BCAA content datasets and 3 BLUP datasets of BCAA). The phenotypic variance explained (PVE) by each QTN ranged from 0.41% to 9.20%. Of these QTNs, 113, 125, and 125 QTNs were identified in the Val, Leu, and Ile content datasets, respectively (Figure 3 and Supplementary Table S1). Moreover, 41 common QTNs were detected in two or more content datasets, which contained 9 QTNs from the Val dataset, 13 QTNs from the Leu dataset, and 19 QTNs from the Ile dataset. The PVE of each common QTN was from 0.39% to 5.24% (Supplementary Table S2). Based on this, the allelic variation and BCAA content analyses were conducted to test the additive effect of these QTNs. The significant correlation coefficient between the number of favorable alleles (NFA) and the BCAA content was from 0.24 to 0.66. The highest correlation coefficient (r = 0.66) between the NFA and BCAA contents was observed in the Ile dataset (Ile_2012r1) (Supplementary Figure S3). For the candidate gene prediction, a total of 1537 genes were identified as putative genes underlying the BCAA accumulation (Supplementary Table S3). A KEGG pathway analysis showed that these genes were mainly involved in the biosynthesis of amino acids, valine, leucine, and isoleucine degradation and glutathione metabolism (Supplementary Figure S1A). Furthermore, allelic variations of LOC_Os01g52530 and LOC_Os06g15420 associated with the Ile content alteration were identified. The LOC_Os01g52530 encoding phosphoribosyl transferase is localized in the LD block (Chr1: 30,117,297–30,187,297 bp) of the QTN-sf0130120297 (sf0130120297 represents chromosome 1 at 30,120,297 bp) locus (Supplementary Figure S2A and Supplementary Table S3). The LOC_Os06g15420 encoding asparagine synthetase was in the LD block (Chr6: 8,755,681–8,775,681 bp) of the QTN-sf0608765681 locus (Supplementary Figure S2C and Supplementary Table S3). The accessions carrying functional allele2 (n = 215) of LOC_Os01g52530 with the GG allele showed a significantly higher Ile level than the accessions carrying functional allele1 (AA, n = 207) (Supplementary Figure S2B). Likewise, the accessions carrying functional allele2 (n = 363) of LOC_Os06g15420 with the TT allele showed a significantly higher Ile level than the accessions carrying functional allele1 (AA, n = 59) (Supplementary Figure S2D).

2.4. BCAA-Level-Related QEIs and Candidate Genes

In total, 53 QEIs were detected in three BCAA content datasets, which accounted for the potential interactions between the gene and environmental factor (Figure 3 and Supplementary Figure S4). The numbers of QEIs related to the grains’ Val, Leu, and Ile accumulations were 26, 13, and 14, respectively. The PVE of each QEI ranged from 0.15% to 3.06%. No common QEI was found in the three BCAA content datasets (Figure 3 and Supplementary Figure S4). Interestingly, QEI-sf0227136932 was also identified as the main-effect QTN associated with the Leu accumulation (Supplementary Tables S1 and S4). To further elucidate the genetic mechanism responsible for the gene and environment interaction, a total of 1921 genes were identified as putative genes underlying the grain BCAA accumulation (Supplementary Table S5). According to the KEGG annotation, these genes gathered in valine, leucine, and isoleucine degradation, in the biosynthesis of amino acids, and in amino-acid-related enzymes (Supplementary Figure S1B). Moreover, several genes harbored in the QEI loci and potentially related to the variation of BCAA accumulation were identified. For instance, LOC_Os03g24460 in the LD block (Chr3: 13,941,224–14,029,224 bp) of the QEI-sf0314026224 locus encoding aminotransferase-domain-containing protein was related to the content variation of the BCAA Val (Figure 4A and Supplementary Table S5), which presented two types of alleles, functional allele1 (CC, n = 222) and functional allele2 (TT, n = 200). A significantly higher Val content was observed in the accessions with allele1 than in the accessions with allele2 in the 2012r1, 2012r2, and 2013r1 datasets (Figure 4B). The ePlant gene expression profile showed that LOC_Os03g24460 was highly expressed in seed (S5, S4, and S3) and inflorescence (P2) (Figure 4C). Additionally, LOC_Os01g55590 in the LD block (Chr1: 32,024,191–32,149,191 bp) of the QEI-sf0132146191 locus encoding AMP-binding enzyme was identified as the key gene associated with the content alteration of the BCAA Leu (Figure 5A and Supplementary Table S5), which had two types of alleles, functional allele1 (CC, n = 376) and functional allele2 (TT, n = 46). The accessions carrying allele1 exhibited a significantly higher Leu level than those carrying allele2 in the 2012r1 and 2013r1 datasets (Figure 5B). LOC_Os01g55590 was relatively highly expressed in inflorescence (P3, P4, P5, and P6) and seed (S2) based on the ePlant expression data (Figure 5C). Additionally, LOC_Os12g31820 in the LD block (Chr12: 19,048,313–19,124,313 bp) of the QEI-sf1219051313 locus encoding phosphoserine phosphatase protein was identified as the candidate gene responsible for the content alteration of the BCAA Ile (Figure 6A and Supplementary Table S5), which presented two types of alleles, functional allele1 (AA, n = 39) and functional allele2 (GG, n = 383). The accessions carrying allele1 showed a significantly lower Ile content than those carrying allele2 in the 2012r1 dataset (Figure 6B). A high expression of LOC_Os12g31820 was observed in seed (S2), inflorescence (P6), and young leaf based on the ePlant analysis (Figure 6C).

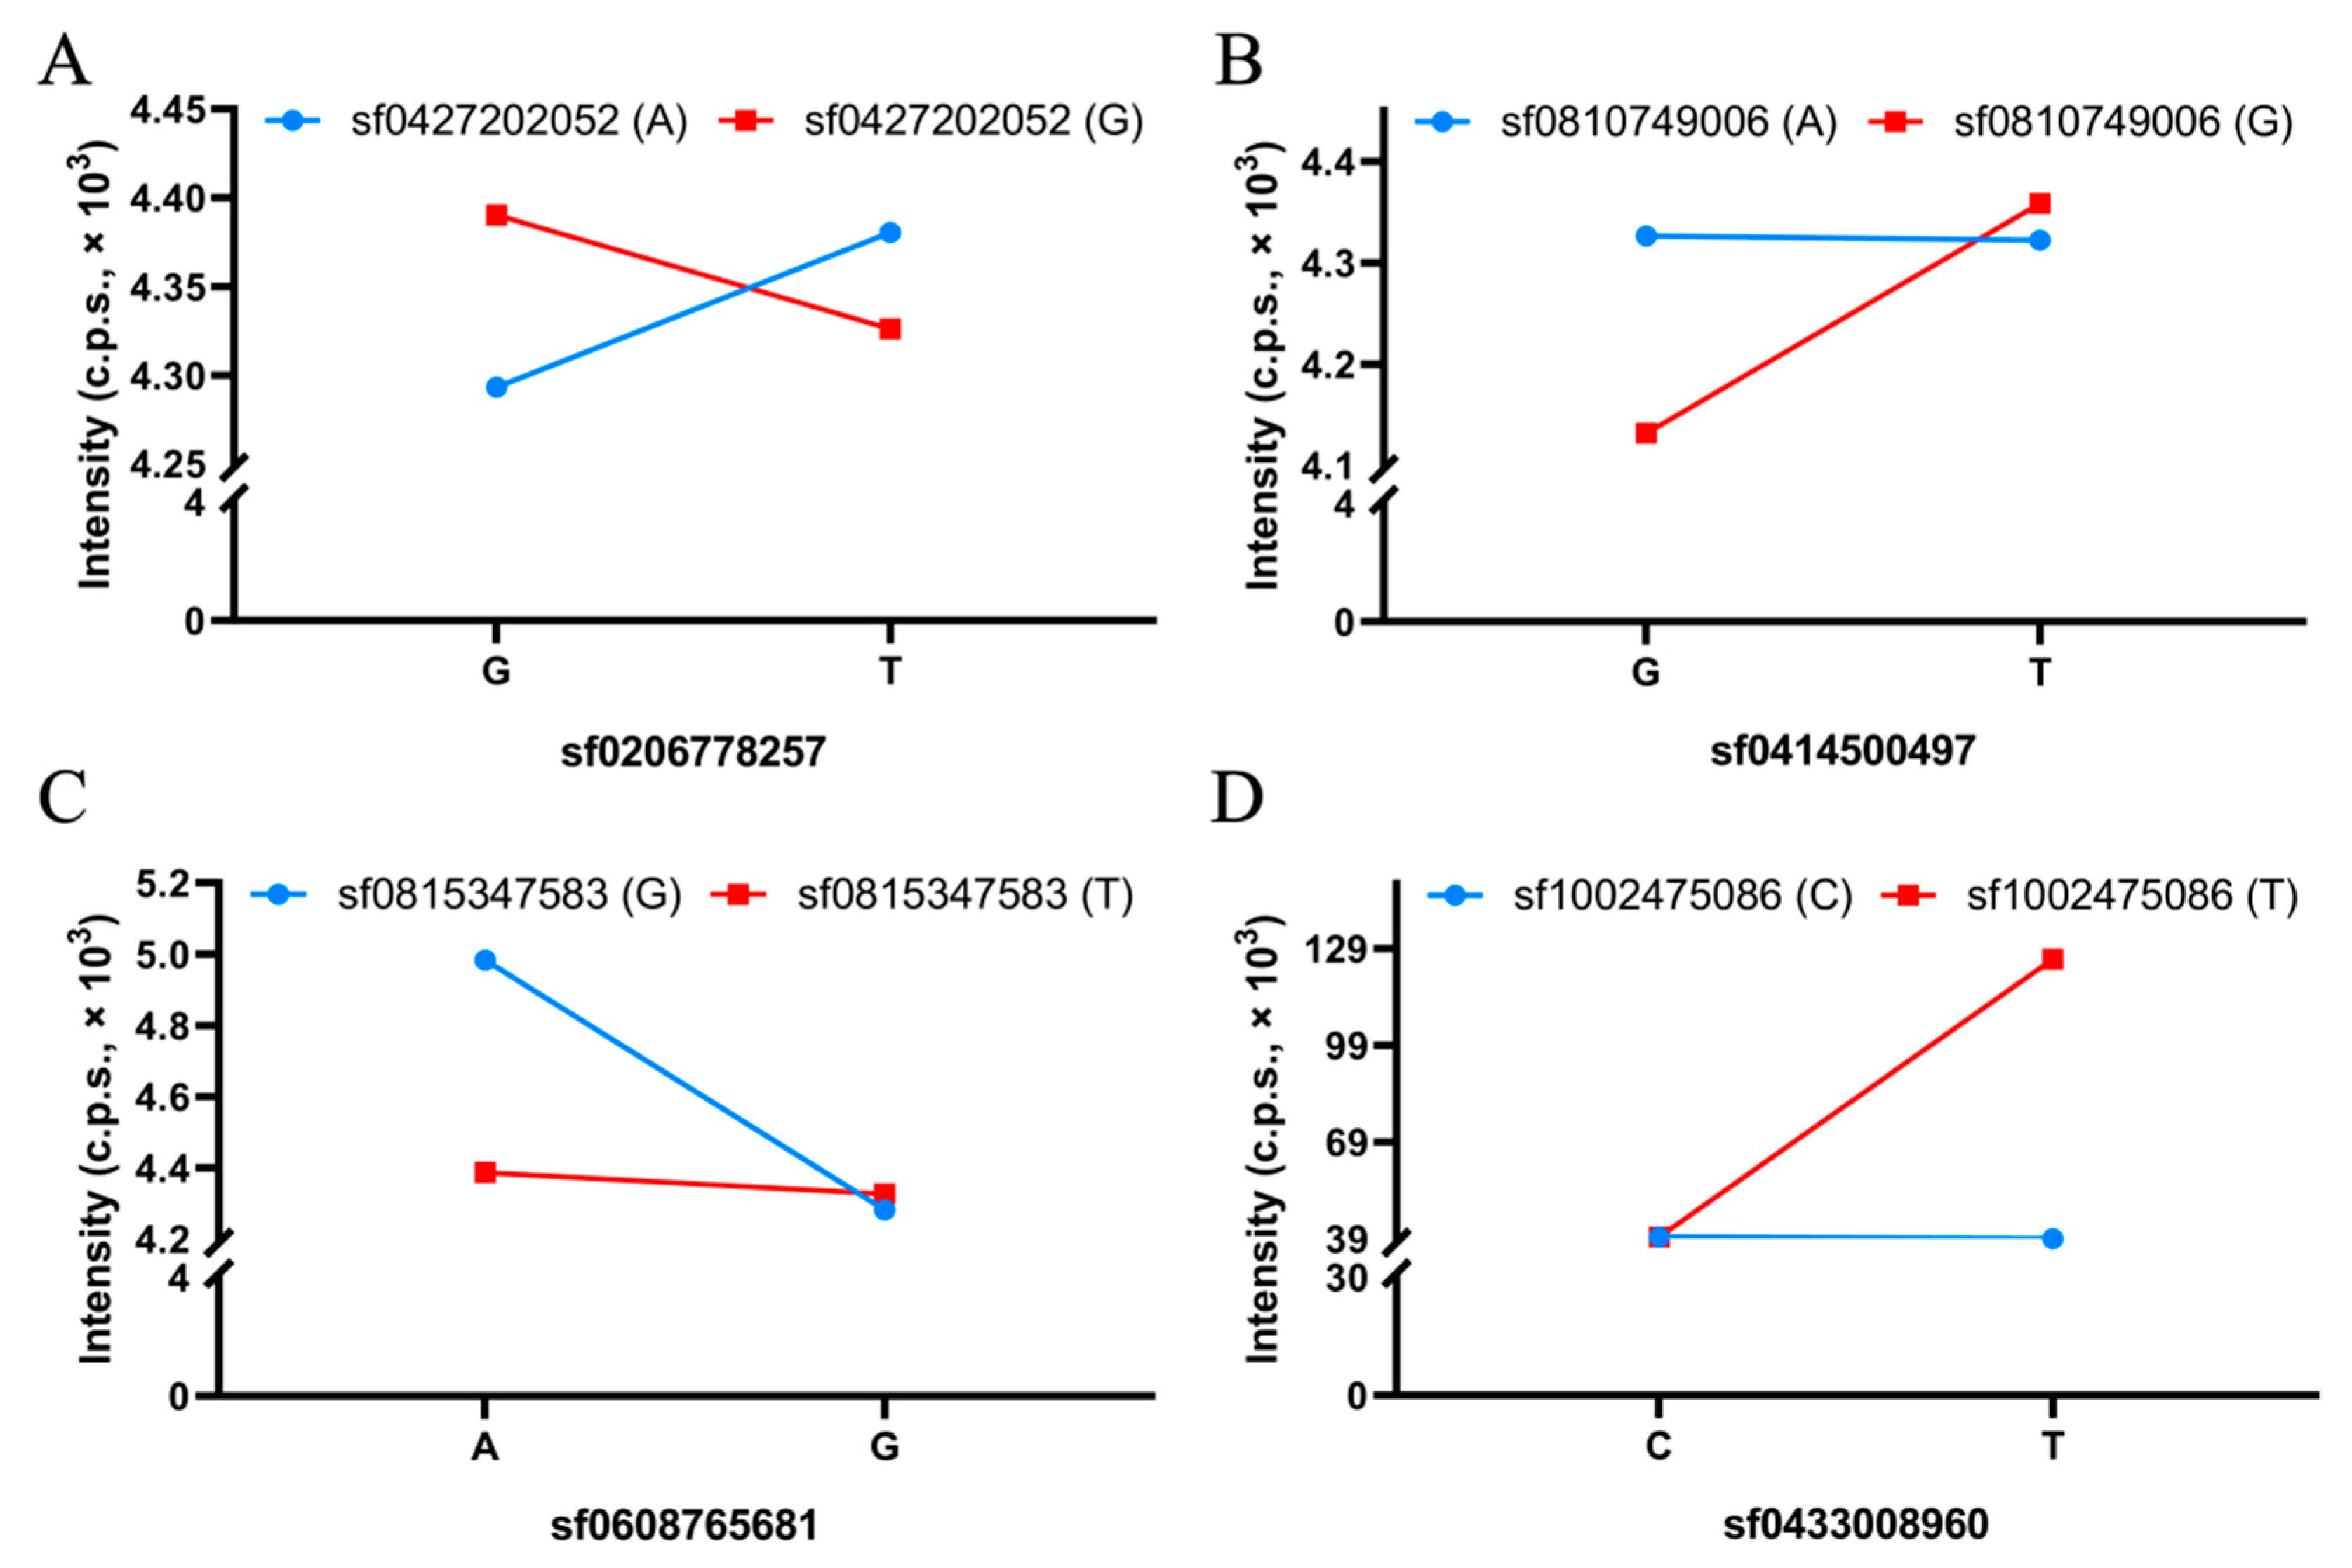
2.5. BCAA-Level-Related QQIs

QTN-by-QTN interaction (QQI) detection is an important and complementary approach for the full genetic view of the BCAA accumulation in rice grains. Using the 3VmrMLM model, a total of 10 QQIs were detected in two BCAA content datasets (Figure 3, Table 2, and Supplementary Table S6). Of those, seven and three QQIs were identified in the Leu and Ile content datasets. However, no QQI was found in the Val dataset (Table 2 and Supplementary Table S6). The PVE of each QQI was from 2.21% to 5.84% (Table 2). The QQI locus potentially played an important role in the accumulation of the BCAA content. For example, the interaction between QTN-sf0206778257 (G/T) and QTN-sf0427202052 (A/G) underlying the Leu accumulation was observed in QQI-1. Accessions with the highest level of Leu were observed in the combination of the G allele at SNP sf0206778257 and the G allele at SNP sf0427202052, while accessions with the lowest level of Leu were found in the interaction between the G allele at SNP sf0206778257 and the A allele at SNP sf0427202052 (Figure 7A). Additionally, the interaction between QTN-sf0414500497 (G/T) and QTN-sf0810749006 (A/G) associated with the Leu accumulation was identified as the QQI-3 using the 3VmrMLM model. A negative effect on the Leu accumulation of the allele G at SNP sf0414500497 when combined with the allele A at SNP sf0810749006 was observed in this QQI. Accessions carrying the T and G alleles at the two loci showed the highest level of Leu (Figure 7B). In contrast, the interaction between QTN-sf0608765681 (A/G) and QTN-sf0815347583 (G/T) underlying the Leu accumulation was found in QQI-5. Accessions with the highest content of Leu were observed in the combination of the A allele at SNP sf0608765681 and the G allele at SNP sf0815347583, while accessions with the lowest level of Leu were shown in the interaction between the G allele at SNP sf0608765681 and the G allele at SNP sf0815347583 (Figure 7C). However, a different scenario for the interaction between QTN-sf0433008960 (C/T) and QTN-sf1002475086 (C/T) in controlling the Ile content was observed in QQI-8. Accessions with the highest amount of Ile were found in the combination of T and T at the two loci. However, much lower levels of Ile were shown in the accessions with the other three combinations of alleles (Figure 7D).

3. Discussion

To elucidate the genetic mechanism underlying the BCAA content in rice, several significant SNPs associated with the BCAA level in leaf and grains were reported [31,32]. In this study, QTN-sf0817467942, QTN-sf0819955092, and QTN-sf0804979333 were identified using the 3VmrMLM model in the Val_BLUP and Val_2013r2 datasets, which were 13.10 kb, 25.26 kb, and 18.29 kb out of the previously reported QTNs (Supplementary Table S1). However, few QTNs underlying the Leu content were reported in previous studies [32]. Among the 3VmrMLM-detected main-effect QTNs associated with the Leu and Val contents, four candidate genes localized in the flanking regions of four reported QTNs/genes were identical with the previous studies related to the BCAA levels in rice (Supplementary Table S1). For instance, the reported genes OsbZIP18 (LOC_Os02g10860) and OsMCCA (LOC_Os12g41250) in the QTN-sf0205661008 and QTN-sf1225461839 spanned regions were detected in the Leu_2013r2 and Leu_2012r1 content datasets (Supplementary Table S1) [30]. Meanwhile, two candidate genes underlying the Val accumulation (OsMCCB with the gene ID LOC_Os08g32850 and OsAUX5 with the gene ID LOC_Os11g06820) around the QTN-sf0820240591 and QTN-sf1103421417 were identified in the Val_2012r2 and Val_BLUP datasets (Supplementary Tables S1 and S3) [29,30].
Apart from the reported loci and genes, the new allelic variation of the candidate genes LOC_Os01g52530 (KEGG annotation: ribose-phosphate pyrophosphokinase in biosynthesis of amino acid pathway) and LOC_Os06g15420 (KEGG annotation: asparagine synthase in biosynthesis of amino acid pathway) related to the Ile accumulation in grains was uncovered in this study. The biological function of ribose-phosphate pyrophosphokinase and asparagine synthase are confirmed and play important roles in amino acid biogenesis and metabolism. Ribose-phosphate pyrophosphokinase (EC 2.7.6.1) is a key enzyme in catalyzing the ribose-5-phosphate to phosphoribosyl pyrophosphate (5′-phosphoribosyl 1-pyrophosphate, PPRP) [36]. PPRP is an important intermediate in cellular metabolism, which is generally involved in the biosynthesis of amino acid and purine and in the pyrimidine biogenesis and degradation processes [37,38,39]. PPRP also participates in the metabolic link between amino acid and nucleotide as an intermediate metabolite of anthranilate [40]. Asparagine synthetase (EC 6.3.1.1 and EC 6.3.5.4) catalyzes the asparagine synthesis, and asparagine is a precursor of isoleucine in higher plants [41,42,43]. In addition, some transcription factors around the detected main-effect QTNs may become involved in the regulation of the BCAA content variation (Supplementary Table S3). Further validation needs to be carried out in the laboratory to decipher the molecular mechanism of these candidate genes controlling the BCAA accumulation.
In order to face the challenge of global climate change and meet the food demands of the ever-increasing population, QEI as a crucial role in the interaction between the gene and environment holds the potential to be exploited for the dissection of complex traits in plant GWAS studies. Among the candidate genes of the QEIs related to the three BCAA levels in rice grains, the genetic variation of the LOC_Os03g24460 (KEGG annotation: branched-chain amino acid aminotransferase in amino-acid-related enzyme pathway), LOC_Os01g55590 (KEGG annotation: malonyl-CoA/methylmalonyl-CoA synthetase in valine, leucine, and isoleucine degradation), and LOC_Os12g31820 (KEGG annotation: phosphoserine phosphatase in glycine, serine, and threonine metabolism) genes led to the content alteration of BCAA (Figure 4B, Figure 5B and Figure 6B), which suggests that these genes may contribute to the biological process of BCAA accumulation, which is affected by environmental factors. Branched-chain aminotransferases (BCATs), key enzymes in the interface of the BCAA metabolism, catalyze both the final anabolic step and the first catabolic step in the production of the leucine, isoleucine, and valine in plants [44,45,46,47,48,49]. Particularly, the allelic variation at AtBCAT2 is responsible for the natural variation in the BCAA levels in Arabidopsis seeds [46]. According to the KEGG annotation, the malonyl-CoA/methylmalonyl-CoA synthetase (EC:6.2.1.76 6.2.1.-) participates in the valine, leucine, and isoleucine degradation pathway. BCAAs (valine, leucine, and isoleucine) are structurally related to branched-chain fatty acids [50]. The malonyl-CoA/methylmalonyl-CoA synthetase involved in the BCAA metabolism directly catalyzed the reaction from malonic acid to malonyl-CoA. Malonyl-CoA is a central metabolite that can enhance the lipid content of branched-chain fatty acids in plants and microbes [51,52,53]. In plants, phosphoserine phosphatase is one of three specific enzymes involved in the phosphorylated pathway of serine biosynthesis (PPSB) [54,55]. Notably, the interconversion between serine and threonine is commonly observed in plants. Furthermore, threonine is the precursor of isoleucine synthesis [56].
The differences in the metabolic profiles between leaf and grain in rice were reported in a comparative study [32]. Through the GWAS model comparation, our previous study mainly focused on the identification and characterization of main-effect QTLs and genes underlying the valine, leucine, isoleucine, arginine, and tryptophan contents in rice leaf. The 3VmrMLM-detected QEIs related to the above amino acid contents were primarily detected without any natural variation analysis [35]. A total of 23, 16, and 16 QEIs related to valine, leucine, and isoleucine were found. However, the QEIs and QQIs related to the BCAA accumulation in rice grains remain uncovered. In this study, 26, 13, and 14 QEIs related to the BCAA content were identified using the 3VmrMLM model, respectively. Further analyses revealed the natural variations of the three genes controlling the BCAA accumulation in rice grains. Notably, no common QEI was found between the present and previous studies. Compared with the previously proposed model, the technical scheme of 3VmrMLM takes the additive, dominance, additive-by-environment (ae) interaction, and dominance-by-environment (de) interaction effects into account, which were proven to identify the previously reported and novel genes [24]. Moreover, according to the method of the SR4R database, the original genotypic SNP dataset used in the present study was subjected to a linkage disequilibrium (LD) filter to address the redundancy issue of a haplotype block formed by several SNPs within the same LD region. The results shown in this study suggest that using this tag SNP dataset as genotypic data to conduct a GWAS can not only detect the reported genes/loci, but can also help in gaining new findings.
In this study, the additive effect of the BCAA-accumulation-associated QTNs was suggested by the significant correlations between the NFA and BCAA levels (r = 0.24–0.66), especially for the Ile content dataset 2012r1 (r = 0.66) (Supplementary Figure S3). According to this, the highest Val, Leu, and Ile levels (Val_2013r2, Leu_2013r1, and Ile_2012r1 datasets) were observed in the accessions with four, nine, and fifteen NFAs, such as W127, W155, and W143 (Supplementary Table S7). These suggested that the accessions carrying a few NFAs provide potential targets for the BCAA biofortified rice breeding programs via the loci pyramiding strategy. It was successfully applied in the improvement of various agronomic traits, such as plant height, grain number, hybrid sterility, and disease resistance [57,58,59,60,61]. In the present study, higher BCAA levels were mostly shown in the japonica accessions than in the indica accessions (Figure 1A–C), suggesting that the japonica rice has the potential of the increase in the BACC content in indica rice through the direct hybridization with elite varieties. This was similar with the results reported in our previous study of free amino acid accumulation in rice leaf [35]. In addition, based on a set of QTNs/QTLs with a small effect, the genetic improvement of the yield and disease resistance were successfully facilitated by the application of the genomic selection (GS) breeding approach [62,63,64,65,66,67,68]. Therefore, the small-effect QTNs detected using the 3VmrMLM model might be utilized for the GS breeding in rice with a high BCAA level.

4. Materials and Methods

4.1. Plant Materials and Sequencing

A diverse panel containing 422 rice accessions of a worldwide rice collection previously released by Huazhong Agricultural University [31] was used for the analyses in this study. Due to the two main subspecies of cultivated rice, accessions belonging to indica and japonica subspecies were selected for the analyses in this study. Of this genetic panel, 272 accessions are indica rice, and 150 accessions are japonica rice. According to the geographic information of the 422 accessions, 338 accessions are from Asia, followed by 13 accessions from Europe, 12 accessions from South America, 11 accessions from North America, 5 accessions from Africa, 3 accessions from Oceania, and 40 accessions with unknown status. A randomized complete block design, containing two rows of each accession and ten plants in each row, was applied in the field-grown plants with two replicates in 2012 and 2013, respectively.
For the detection of the genetic variation, each rice accession was sequenced on the Illumina HiSeq 2000 platform to obtain approximately 1 Gb high-quality genome sequences [31]. Using the rice reference genome (version MSU 6.1) and its annotation downloaded from the Rice Genome Annotation Project (http://rice.uga.edu/index.shtml, accessed on 28 June 2023), clean reads were mapped to MSU 6.1 genome using the BWA software (https://sourceforge.net/projects/bio-bwa/, accessed on 28 June 2023) with default settings. After the subsequent process via SAMtools software [69], the SNP joint calling of these 422 rice accessions was conducted using HaplotypeCaller, CombineGVCFs, and GenotypeGVCFs functions with default settings in GATK software (https://gatk.broadinstitute.org/hc/en-us, accessed on 10 August 2023). A set of 3,873,686 high-quality SNPs, obtained using PLINK software (https://zzz.bwh.harvard.edu/plink/, accessed on 28 June 2023) with -maf 0.05 and -geno 0.1 settings, was used for the following analyses in this study. To address the redundancy issue of a haplotype block formed by several SNPs within the same linkage disequilibrium (LD) region, a tag SNP panel including 239,055 SNPs was obtained according to the method proposed by the SR4R database [70]. This tag SNP panel was used as genotypic dataset in the following analyses in the present study.

4.2. Metabolite Profiling

For the metabolic profiling, the randomly collected mature grains were pooled from three rice plants as described previously [71]. In brief, four samples (two years by two replicates of each year) for each accession were used for the subsequent metabolomics analyses [32]. To relatively quantify the widely targeted metabolites in dried seed samples, a liquid chromatography–electrospray ionization–tandem mass spectrometry system was employed. Using a mixer mill (MM 400, Retsch GmbH, Haan, Germany) with a zirconia bead for 1.5 min at 30 Hz, 100 mg crushed dried rice grain was extracted overnight at 4 °C with 1.0 mL pure methanol (or 70% aqueous methanol), which contained 0.1 mg/L lidocaine (internal standard) for lipid-soluble metabolites (or water-soluble metabolites). A scheduled multiple reaction monitoring method was used to carry out the quantification of metabolites. By dividing the relative signal intensities of metabolites by the intensities of the internal standard (lidocaine, 0.1 mg/L), the relative intensities of targeted metabolites were normalized. To improve the normality, log2-transformed metabolite data were used for further analysis. A metabolic data matrix with the three relative intensities of free amino acid valine (Val), leucine (Leu), and isoleucine (Ile) from 1688 runs (422 accessions × four sample sets) was generated for the rice genetic panel. The broad-sense heritability H2 was assessed using the four content datasets of each free amino acid (Val/Leu/Ile). The R package lme4 was used to generate the best linear unbiased prediction (BLUP) datasets for each BCAA (Val, Leu, and Ile) content [72].

4.3. Population Stratification and Linkage Disequilibrium Analysis

To dissect the genetic architecture of the diverse panel containing 422 rice accessions, a principal component analysis (PCA) was performed using PLINK software (v1.9) based on the tag SNP dataset obtained above. The concatenated tag SNPs for 422 accessions were used as input data for the phylogenetic analysis. A neighbor-joining (NJ) phylogenetic tree was constructed via the implementation of MEGA-CC software (v11) with the settings of pairwise gap deletion and 1000 bootstrap replicates [73]. The output tree was visualized using the Interactive Tree of Life (iTOL) tool [74]. The population structure was estimated via ADMIXTURE software (v1.3.0) [75]. Using PopLDdecay software, the squared correlation coefficient (r2) between SNPs was obtained to evaluate the genome-wide LD decay [76]. To estimate the local LD block region in a chromosome, LDBlockShow software (v1.40) was employed [77].

4.4. Genome-Wide Association Study

Using the recently proposed 3VmrMLM model [24], the genome-wide association study (GWAS) analyses for 12 Val, Leu, and Ile content datasets were performed on the genetic panel including 422 rice accessions with 239,055 SNPs. The 12 content datasets contained the level of three free amino acids (Val, Leu, and Ile) across two years (2012 and 2013) with two replicates per year. The R package IIIVmrMLM was implemented for the Val-, Leu-, and Ile-content-associated main-effect QTN, QEI, and QQI detection [78]. The parameters for the main-effect QTN detection were method = Single_env, SearchRadius = 20, and svpal = 0.01. The parameters for the QEI detection were method = Multi_env, SearchRadius = 20, and svpal = 0.01. The parameters for the QQI detection were method = Epistasis, SearchRadius = c(0, 1), and svpal = c(0.01, 0.01). The marker trait association (QTN/QEI/QQI) was determined using the threshold of LOD score ≥ 3 [24].

4.5. Candidate Gene Prediction and Analysis

To further uncover the genes underlying the Val, Leu, and Ile levels, rice genes localized within the 122 kb (the averaged whole genome LD decay) and local LD block defined flanking regions of each detected QTN/QEI were considered as candidate genes. Kyoto Encyclopedia of Genes and Genomes (KEGG) pathway annotations of candidate genes were analyzed using the KofamKOALA web tool with default settings (https://www.genome.jp/tools/kofamkoala, accessed on 10 August 2023). The functional effect prediction of an SNP on the gene body was obtained from the RiceVarMap database (http://ricevarmap.ncpgr.cn/, accessed on 10 August 2023) and further used for functional allele and content analysis of potential candidate genes through the Wilcoxon non-parametric test at the 5% probability level. Temporal and spatial expression profiles of candidate genes were investigated using the electronic fluorescent pictograph browser (ePlant) web tool (https://bar.utoronto.ca/, accessed on 10 August 2023). The relative contents of each BCAA were obtained according to the method of a comparative metabolic study [79].

Supplementary Materials

The following supporting information can be downloaded at https://www.mdpi.com/article/10.3390/plants12162970/s1, Figure S1: KEGG pathway analysis of candidate genes harbored in common QTNs (A) and QEIs (B) associated with valine (Val), leucine (Leu), and isoleucine (Ile) contents. Figure S2: Analyses of the candidate gene LOC_Os01g52530 and LOC_Os06g15420 related to isoleucine (Ile) content. Figure S3: Beeswarm plots illustrating the relationship between the number of favorable alleles (NFA) and valine (Val), leucine (Leu), and isoleucine (Ile) accumulation for the twelve content datasets. Figure S4: Manhattan plots for branched-chain amino acid (BCAA) levels associated QTN-by-environment interactions (QEIs) using 3VmrMLM model. Figure S5: Manhattan plots for branched-chain amino acid (BCAA) levels associated QTN-by-QTN interactions (QQIs) using 3VmrMLM model. QQIs in Val content dataset (A), Leu content dataset (B), and Ile content dataset (C); Table S1: Summary of QTNs detected from branched-chain amino acid (BCAA) content dataset. Table S2: Common QTNs identified from branched-chain amino acid (BCAA) content datasets. Table S3: Candidate genes of common QTNs. Table S4: QTN-by-environment interactions (QEIs) detected from branched-chain amino acid (BCAA) content datasets. Table S5: Candidate genes of QEIs. Table S6: QTN-by-QTN interactions (QQIs) detected from branched-chain amino acid (BCAA) content datasets. Table S7: The number of favorable alleles (NFA) and branched-chain amino acid (BCAA) content of each accession.

Author Contributions

L.H. conceived and designed this research project. Y.S., Y.C. and Y.Z. undertook the analysis of all available data. L.H. and Y.S. contributed to the resources and the writing of the original draft. L.H. discussed the results, guided the entire study, participated in the data analysis, and revised the manuscript. All authors have read and agreed to the published version of the manuscript.

Funding

This study was supported by the Hainan Provincial Natural Science Foundation of China (323RC422 and 321RC1148), and the Hainan University Startup Fund (KYQD(ZR)-21027).

Data Availability Statement

All of the phenotypic and genotypic data used in this study are shared in the Supplementary Materials.

Acknowledgments

We appreciate Jie Luo and Cheng Jin working in Hainan University and Wei Chen working in Huazhong Agricultural University for their great contribution to the rice metabolic research field and for allowing us to reuse the publicly accessible data in this study.

Conflicts of Interest

The authors declare that the research was conducted in the absence of any commercial or financial relationships that could be construed as potential conflicts of interest.

References

  1. Ufaz, S.; Galili, G. Improving the content of essential amino acids in crop plants: Goals and opportunities. Plant Physiol. 2008, 147, 954–961. [Google Scholar] [CrossRef] [PubMed]
  2. Fukagawa, N.K.; Ziska, L.H. Rice: Importance for Global Nutrition. J. Nutr. Sci. Vitaminol. 2019, 65, S2–S3. [Google Scholar] [CrossRef] [PubMed]
  3. Shi, J.; An, G.; Weber, A.P.M.; Zhang, D. Prospects for rice in 2050. Plant Cell Environ. 2023, 46, 1037–1045. [Google Scholar] [CrossRef] [PubMed]
  4. Jin, C.; Fang, C.; Zhang, Y.; Fernie, A.R.; Luo, J. Plant metabolism paves the way for breeding crops with high nutritional value and stable yield. Sci. China Life Sci. 2021, 64, 2202–2205. [Google Scholar] [CrossRef] [PubMed]
  5. Neinast, M.; Murashige, D.; Arany, Z. Branched Chain Amino Acids. Annu. Rev. Physiol. 2019, 81, 139–164. [Google Scholar] [CrossRef] [PubMed]
  6. Galili, G.; Amir, R.; Fernie, A.R. The Regulation of Essential Amino Acid Synthesis and Accumulation in Plants. Annu. Rev. Plant Biol. 2016, 67, 153–178. [Google Scholar] [CrossRef] [PubMed]
  7. Le Couteur, D.G.; Solon-Biet, S.M.; Cogger, V.C.; Ribeiro, R.; de Cabo, R.; Raubenheimer, D.; Cooney, G.J.; Simpson, S.J. Branched chain amino acids, aging and age-related health. Ageing Res. Rev. 2020, 64, 101198. [Google Scholar] [CrossRef]
  8. McGarrah, R.W.; White, P.J. Branched-chain amino acids in cardiovascular disease. Nat. Rev. Cardiol. 2023, 20, 77–89. [Google Scholar] [CrossRef]
  9. Wolfe, R.R. Branched-chain amino acids and muscle protein synthesis in humans: Myth or reality? J. Int. Soc. Sports Nutr. 2017, 14, 30. [Google Scholar] [CrossRef]
  10. Bifari, F.; Ruocco, C.; Decimo, I.; Fumagalli, G.; Valerio, A.; Nisoli, E. Amino acid supplements and metabolic health: A potential interplay between intestinal microbiota and systems control. Genes Nutr. 2017, 12, 27. [Google Scholar] [CrossRef]
  11. Tibbs Cortes, L.; Zhang, Z.; Yu, J. Status and prospects of genome-wide association studies in plants. Plant Genome 2021, 14, e20077. [Google Scholar] [CrossRef] [PubMed]
  12. Demirjian, C.; Vailleau, F.; Berthome, R.; Roux, F. Genome-wide association studies in plant pathosystems: Success or failure? Trends Plant Sci. 2023, 28, 471–485. [Google Scholar] [CrossRef] [PubMed]
  13. He, J.; Gai, J. Genome-Wide Association Studies (GWAS). Methods Mol. Biol. 2023, 2638, 123–146. [Google Scholar] [PubMed]
  14. Yu, J.; Pressoir, G.; Briggs, W.H.; Vroh Bi, I.; Yamasaki, M.; Doebley, J.F.; McMullen, M.D.; Gaut, B.S.; Nielsen, D.M.; Holland, J.B.; et al. A unified mixed-model method for association mapping that accounts for multiple levels of relatedness. Nat. Genet. 2006, 38, 203–208. [Google Scholar] [CrossRef]
  15. Zhou, X.; Stephens, M. Genome-wide efficient mixed-model analysis for association studies. Nat. Genet. 2012, 44, 821–824. [Google Scholar] [CrossRef] [PubMed]
  16. Zhang, Y.M.; Jia, Z.; Dunwell, J.M. Editorial: The Applications of New Multi-Locus GWAS Methodologies in the Genetic Dissection of Complex Traits. Front. Plant Sci. 2019, 10, 100. [Google Scholar] [CrossRef] [PubMed]
  17. Segura, V.; Vilhjalmsson, B.J.; Platt, A.; Korte, A.; Seren, U.; Long, Q.; Nordborg, M. An efficient multi-locus mixed-model approach for genome-wide association studies in structured populations. Nat. Genet. 2012, 44, 825–830. [Google Scholar] [CrossRef]
  18. Liu, X.; Huang, M.; Fan, B.; Buckler, E.S.; Zhang, Z. Iterative Usage of Fixed and Random Effect Models for Powerful and Efficient Genome-Wide Association Studies. PLoS Genet. 2016, 12, e1005767. [Google Scholar] [CrossRef]
  19. Wang, S.B.; Feng, J.Y.; Ren, W.L.; Huang, B.; Zhou, L.; Wen, Y.J.; Zhang, J.; Dunwell, J.M.; Xu, S.; Zhang, Y.M. Improving power and accuracy of genome-wide association studies via a multi-locus mixed linear model methodology. Sci. Rep. 2016, 6, 19444. [Google Scholar] [CrossRef]
  20. Ren, W.; Wen, Y.; Dunwell, J.; Zhang, Y. pKWmEB: Integration of Kruskal-Wallis test with empirical Bayes under polygenic background control for multi-locus genome-wide association study. Heredity 2018, 120, 208–218. [Google Scholar] [CrossRef]
  21. Zhang, J.; Feng, J.; Ni, Y.; Wen, Y.; Niu, Y.; Tamba, C.; Yue, C.; Song, Q.; Zhang, Y. pLARmEB: Integration of least angle regression with empirical Bayes for multilocus genome-wide association studies. Heredity 2017, 118, 517–524. [Google Scholar] [CrossRef] [PubMed]
  22. Wen, Y.; Zhang, H.; Ni, Y.; Huang, B.; Zhang, J.; Feng, J.; Wang, S.; Dunwell, J.; Zhang, Y.; Wu, R. Methodological implementation of mixed linear models in multi-locus genome-wide association studies. Brief. Bioinform. 2018, 19, 700–712. [Google Scholar] [CrossRef]
  23. Tamba, C.; Ni, Y.; Zhang, Y. Iterative sure independence screening EM-Bayesian LASSO algorithm for multi-locus genome-wide association studies. PLoS Comput. Biol. 2017, 13, e1005357. [Google Scholar] [CrossRef] [PubMed]
  24. Li, M.; Zhang, Y.W.; Zhang, Z.C.; Xiang, Y.; Liu, M.H.; Zhou, Y.H.; Zuo, J.F.; Zhang, H.Q.; Chen, Y.; Zhang, Y.M. A compressed variance component mixed model for detecting QTNs, and QTN-by-environment and QTN-by-QTN interactions in genome-wide association studies. Mol. Plant 2022, 15, 630–650. [Google Scholar] [CrossRef] [PubMed]
  25. Luo, J. Metabolite-based genome-wide association studies in plants. Curr. Opin. Plant Biol. 2015, 24, 31–38. [Google Scholar] [CrossRef] [PubMed]
  26. Fang, C.; Luo, J. Metabolic GWAS-based dissection of genetic bases underlying the diversity of plant metabolism. Plant J. 2019, 97, 91–100. [Google Scholar] [CrossRef] [PubMed]
  27. Fang, C.; Luo, J.; Wang, S. The Diversity of Nutritional Metabolites: Origin, Dissection, and Application in Crop Breeding. Front. Plant Sci. 2019, 10, 1028. [Google Scholar] [CrossRef] [PubMed]
  28. Wang, S.; Li, Y.; He, L.; Yang, J.; Fernie, A.R.; Luo, J. Natural variance at the interface of plant primary and specialized metabolism. Curr. Opin. Plant Biol. 2022, 67, 102201. [Google Scholar] [CrossRef]
  29. Sun, Y.; Shi, Y.; Liu, G.; Yao, F.; Zhang, Y.; Yang, C.; Guo, H.; Liu, X.; Jin, C.; Luo, J. Natural variation in the OsbZIP18 promoter contributes to branched-chain amino acid levels in rice. New Phytol. 2020, 228, 1548–1558. [Google Scholar] [CrossRef]
  30. Shi, Y.; Zhang, Y.; Sun, Y.; Xie, Z.; Luo, Y.; Long, Q.; Feng, J.; Liu, X.; Wang, B.; He, D.; et al. Natural variations of OsAUX5, a target gene of OsWRKY78, control the contents of neutral essential amino acids in rice grains. Mol. Plant 2022, 16, 322–336. [Google Scholar] [CrossRef]
  31. Chen, W.; Gao, Y.; Xie, W.; Gong, L.; Lu, K.; Wang, W.; Li, Y.; Liu, X.; Zhang, H.; Dong, H.; et al. Genome-wide association analyses provide genetic and biochemical insights into natural variation in rice metabolism. Nat. Genet. 2014, 46, 714–721. [Google Scholar] [CrossRef] [PubMed]
  32. Chen, W.; Wang, W.; Peng, M.; Gong, L.; Gao, Y.; Wan, J.; Wang, S.; Shi, L.; Zhou, B.; Li, Z.; et al. Comparative and parallel genome-wide association studies for metabolic and agronomic traits in cereals. Nat. Commun. 2016, 7, 12767. [Google Scholar] [CrossRef] [PubMed]
  33. Zhu, G.; Wang, S.; Huang, Z.; Zhang, S.; Liao, Q.; Zhang, C.; Lin, T.; Qin, M.; Peng, M.; Yang, C.; et al. Rewiring of the fruit metabolome in tomato breeding. Cell 2018, 172, 249–261.e212. [Google Scholar] [CrossRef] [PubMed]
  34. Cao, S.; Duan, H.; Sun, Y.; Hu, R.; Wu, B.; Lin, J.; Deng, W.; Li, Y.; Zheng, H. Genome-Wide Association Study With Growth-Related Traits and Secondary Metabolite Contents in Red- and White-Heart Chinese Fir. Front. Plant Sci. 2022, 13, 922007. [Google Scholar] [CrossRef] [PubMed]
  35. He, L.; Wang, H.; Sui, Y.; Miao, Y.; Jin, C.; Luo, J. Genome-wide association studies of five free amino acid levels in rice. Front. Plant Sci. 2022, 13, 1048860. [Google Scholar] [CrossRef] [PubMed]
  36. Zhou, W.; Tsai, A.; Dattmore, D.A.; Stives, D.P.; Chitrakar, I.; D’Alessandro, A.M.; Patil, S.; Hicks, K.A.; French, J.B. Crystal structure of E. coli PRPP synthetase. BMC Struct. Biol. 2019, 19, 1. [Google Scholar] [CrossRef] [PubMed]
  37. Hove-Jensen, B.; Andersen, K.R.; Kilstrup, M.; Martinussen, J.; Switzer, R.L.; Willemoes, M. Phosphoribosyl Diphosphate (PRPP): Biosynthesis, Enzymology, Utilization, and Metabolic Significance. Microbiol. Mol. Biol. Rev. 2017, 81, e00040-16. [Google Scholar] [CrossRef]
  38. Zrenner, R.; Stitt, M.; Sonnewald, U.; Boldt, R. Pyrimidine and purine biosynthesis and degradation in plants. Annu. Rev. Plant Biol. 2006, 57, 805–836. [Google Scholar] [CrossRef]
  39. Witte, C.P.; Herde, M. Nucleotide Metabolism in Plants. Plant Physiol. 2020, 182, 63–78. [Google Scholar] [CrossRef]
  40. Yang, Q.; Zhao, D.; Liu, Q. Connections Between Amino Acid Metabolisms in Plants: Lysine as an Example. Front. Plant Sci. 2020, 11, 928. [Google Scholar] [CrossRef]
  41. Gaufichon, L.; Reisdorf-Cren, M.; Rothstein, S.J.; Chardon, F.; Suzuki, A. Biological functions of asparagine synthetase in plants. Plant Sci. 2010, 179, 141–153. [Google Scholar] [CrossRef]
  42. Reitzer, L. Biosynthesis of Glutamate, Aspartate, Asparagine, L-Alanine, and D-Alanine. EcoSal Plus 2004, 1, 10–1128. [Google Scholar] [CrossRef]
  43. Azevedo, R.A.; Lancien, M.; Lea, P.J. The aspartic acid metabolic pathway, an exciting and essential pathway in plants. Amino Acids 2006, 30, 143–162. [Google Scholar] [CrossRef] [PubMed]
  44. Binder, S. Branched-Chain Amino Acid Metabolism in Arabidopsis thaliana. Arab. Book 2010, 8, e0137. [Google Scholar] [CrossRef] [PubMed]
  45. Maloney, G.S.; Kochevenko, A.; Tieman, D.M.; Tohge, T.; Krieger, U.; Zamir, D.; Taylor, M.G.; Fernie, A.R.; Klee, H.J. Characterization of the branched-chain amino acid aminotransferase enzyme family in tomato. Plant Physiol. 2010, 153, 925–936. [Google Scholar] [CrossRef] [PubMed]
  46. Angelovici, R.; Lipka, A.E.; Deason, N.; Gonzalez-Jorge, S.; Lin, H.; Cepela, J.; Buell, R.; Gore, M.A.; Dellapenna, D. Genome-wide analysis of branched-chain amino acid levels in Arabidopsis seeds. Plant Cell 2013, 25, 4827–4843. [Google Scholar] [CrossRef] [PubMed]
  47. Binder, S.; Knill, T.; Schuster, J. Branched-chain amino acid metabolism in higher plants. Physiol. Plant 2007, 129, 68–78. [Google Scholar] [CrossRef]
  48. Campbell, M.A.; Patel, J.K.; Meyers, J.L.; Myrick, L.C.; Gustin, J.L. Genes encoding for branched-chain amino acid aminotransferase are differentially expressed in plants. Plant Physiol. Biochem. 2001, 39, 855–860. [Google Scholar] [CrossRef]
  49. Jin, C.; Sun, Y.; Shi, Y.; Zhang, Y.; Chen, K.; Li, Y.; Liu, G.; Yao, F.; Cheng, D.; Li, J.; et al. Branched-chain amino acids regulate plant growth by affecting the homeostasis of mineral elements in rice. Sci. China Life Sci. 2019, 62, 1107–1110. [Google Scholar] [CrossRef]
  50. Adeva-Andany, M.M.; Lopez-Maside, L.; Donapetry-Garcia, C.; Fernandez-Fernandez, C.; Sixto-Leal, C. Enzymes involved in branched-chain amino acid metabolism in humans. Amino Acids 2017, 49, 1005–1028. [Google Scholar] [CrossRef]
  51. Bowman, C.E.; Wolfgang, M.J. Role of the malonyl-CoA synthetase ACSF3 in mitochondrial metabolism. Adv. Biol. Regul. 2019, 71, 34–40. [Google Scholar] [CrossRef] [PubMed]
  52. Chen, H.; Kim, H.U.; Weng, H.; Browse, J. Malonyl-CoA synthetase, encoded by ACYL ACTIVATING ENZYME13, is essential for growth and development of Arabidopsis. Plant Cell 2011, 23, 2247–2262. [Google Scholar] [CrossRef] [PubMed]
  53. Wang, Y.; Chen, H.; Yu, O. A plant malonyl-CoA synthetase enhances lipid content and polyketide yield in yeast cells. Appl. Microbiol. Biotechnol. 2014, 98, 5435–5447. [Google Scholar] [CrossRef] [PubMed]
  54. Igamberdiev, A.U.; Kleczkowski, L.A. The Glycerate and Phosphorylated Pathways of Serine Synthesis in Plants: The Branches of Plant Glycolysis Linking Carbon and Nitrogen Metabolism. Front. Plant Sci. 2018, 9, 318. [Google Scholar] [CrossRef] [PubMed]
  55. Ros, R.; Munoz-Bertomeu, J.; Krueger, S. Serine in plants: Biosynthesis, metabolism, and functions. Trends Plant Sci. 2014, 19, 564–569. [Google Scholar] [CrossRef] [PubMed]
  56. Hildebrandt, T.M.; Nunes Nesi, A.; Araujo, W.L.; Braun, H.P. Amino Acid Catabolism in Plants. Mol. Plant 2015, 8, 1563–1579. [Google Scholar] [CrossRef] [PubMed]
  57. Guo, J.; Li, Y.; Xiong, L.; Yan, T.; Zou, J.; Dai, Z.; Tang, G.; Sun, K.; Luan, X.; Yang, W.; et al. Development of Wide-Compatible Indica Lines by Pyramiding Multiple Neutral Alleles of Indica-Japonica Hybrid Sterility Loci. Front. Plant Sci. 2022, 13, 890568. [Google Scholar] [CrossRef]
  58. Tamisier, L.; Szadkowski, M.; Nemouchi, G.; Lefebvre, V.; Szadkowski, E.; Duboscq, R.; Santoni, S.; Sarah, G.; Sauvage, C.; Palloix, A.; et al. Genome-wide association mapping of QTLs implied in potato virus Y population sizes in pepper: Evidence for widespread resistance QTL pyramiding. Mol. Plant Pathol. 2020, 21, 3–16. [Google Scholar] [CrossRef]
  59. Ashikari, M.; Matsuoka, M. Identification, isolation and pyramiding of quantitative trait loci for rice breeding. Trends Plant Sci. 2006, 11, 344–350. [Google Scholar] [CrossRef]
  60. Cruppe, G.; Lemes da Silva, C.; Lollato, R.; Fritz, A.; Kuhnem, P.; Cruz, C.D.; Calderon, L.; Valent, B. QTL pyramiding provides marginal improvement in 2NvS-based wheat blast resistance. Plant Dis. 2023. [Google Scholar] [CrossRef]
  61. Pilet-Nayel, M.L.; Moury, B.; Caffier, V.; Montarry, J.; Kerlan, M.C.; Fournet, S.; Durel, C.E.; Delourme, R. Quantitative Resistance to Plant Pathogens in Pyramiding Strategies for Durable Crop Protection. Front. Plant Sci. 2017, 8, 1838. [Google Scholar] [CrossRef] [PubMed]
  62. Crossa, J.; Perez-Rodriguez, P.; Cuevas, J.; Montesinos-Lopez, O.; Jarquin, D.; de Los Campos, G.; Burgueno, J.; Gonzalez-Camacho, J.M.; Perez-Elizalde, S.; Beyene, Y.; et al. Genomic Selection in Plant Breeding: Methods, Models, and Perspectives. Trends Plant Sci. 2017, 22, 961–975. [Google Scholar] [CrossRef] [PubMed]
  63. Newell, M.A.; Jannink, J.L. Genomic selection in plant breeding. Methods Mol. Biol. 2014, 1145, 117–130. [Google Scholar] [PubMed]
  64. Bhat, J.A.; Ali, S.; Salgotra, R.K.; Mir, Z.A.; Dutta, S.; Jadon, V.; Tyagi, A.; Mushtaq, M.; Jain, N.; Singh, P.K.; et al. Genomic Selection in the Era of Next Generation Sequencing for Complex Traits in Plant Breeding. Front. Genet. 2016, 7, 221. [Google Scholar] [CrossRef] [PubMed]
  65. Xu, Y.; Liu, X.; Fu, J.; Wang, H.; Wang, J.; Huang, C.; Prasanna, B.M.; Olsen, M.S.; Wang, G.; Zhang, A. Enhancing Genetic Gain through Genomic Selection: From Livestock to Plants. Plant Commun. 2020, 1, 100005. [Google Scholar] [CrossRef]
  66. Budhlakoti, N.; Kushwaha, A.K.; Rai, A.; Chaturvedi, K.K.; Kumar, A.; Pradhan, A.K.; Kumar, U.; Kumar, R.R.; Juliana, P.; Mishra, D.C.; et al. Genomic Selection: A Tool for Accelerating the Efficiency of Molecular Breeding for Development of Climate-Resilient Crops. Front. Genet. 2022, 13, 832153. [Google Scholar] [CrossRef]
  67. He, L.; Xiao, J.; Rashid, K.; Jia, G.; Li, P.; Yao, Z.; Wang, X.; Cloutier, S.; You, F. Evaluation of genomic prediction for pasmo resistance in flax. Int. J. Mol. Sci. 2019, 20, 359–376. [Google Scholar] [CrossRef]
  68. Wang, X.; Xu, Y.; Hu, Z.L.; Xu, C.W. Genomic selection methods for crop improvement: Current status and prospects. Crop J. 2018, 6, 330–340. [Google Scholar] [CrossRef]
  69. Li, H.; Handsaker, B.; Wysoker, A.; Fennell, T.; Ruan, J.; Homer, N.; Marth, G.; Abecasis, G.; Durbin, R.; 1000 Genome Project Data Processing Subgroup. The Sequence Alignment/Map format and SAMtools. Bioinformatics 2009, 25, 2078–2079. [Google Scholar] [CrossRef]
  70. Yan, J.; Zou, D.; Li, C.; Zhang, Z.; Song, S.; Wang, X. SR4R: An Integrative SNP Resource for Genomic Breeding and Population Research in Rice. Genom. Proteom. Bioinform. 2020, 18, 173–185. [Google Scholar] [CrossRef]
  71. Chen, W.; Gong, L.; Guo, Z.; Wang, W.; Zhang, H.; Liu, X.; Yu, S.; Xiong, L.; Luo, J. A novel integrated method for large-scale detection, identification, and quantification of widely targeted metabolites: Application in the study of rice metabolomics. Mol. Plant 2013, 6, 1769–1780. [Google Scholar] [CrossRef] [PubMed]
  72. Bates, D.; Mächler, M.; Bolker, B.; Walker, S. Fitting Linear Mixed-Effects Models Using lme4. J. Stat. Softw. 2015, 67, 1–48. [Google Scholar] [CrossRef]
  73. Kumar, S.; Stecher, G.; Peterson, D.; Tamura, K. MEGA-CC: Computing core of molecular evolutionary genetics analysis program for automated and iterative data analysis. Bioinformatics 2012, 28, 2685–2686. [Google Scholar] [CrossRef] [PubMed]
  74. Letunic, I.; Bork, P. Interactive Tree Of Life (iTOL): An online tool for phylogenetic tree display and annotation. Bioinformatics 2007, 23, 127–128. [Google Scholar] [CrossRef]
  75. Alexander, D.H.; Novembre, J.; Lange, K. Fast model-based estimation of ancestry in unrelated individuals. Genome Res. 2009, 19, 1655–1664. [Google Scholar] [CrossRef] [PubMed]
  76. Zhang, C.; Dong, S.S.; Xu, J.Y.; He, W.M.; Yang, T.L. PopLDdecay: A fast and effective tool for linkage disequilibrium decay analysis based on variant call format files. Bioinformatics 2019, 35, 1786–1788. [Google Scholar] [CrossRef] [PubMed]
  77. Dong, S.S.; He, W.M.; Ji, J.J.; Zhang, C.; Guo, Y.; Yang, T.L. LDBlockShow: A fast and convenient tool for visualizing linkage disequilibrium and haplotype blocks based on variant call format files. Brief. Bioinform. 2021, 22, bbaa227. [Google Scholar] [CrossRef] [PubMed]
  78. Li, M.; Zhang, Y.W.; Xiang, Y.; Liu, M.H.; Zhang, Y.M. IIIVmrMLM: The R and C++ tools associated with 3VmrMLM, a comprehensive GWAS method for dissecting quantitative traits. Mol. Plant 2022, 15, 1251–1253. [Google Scholar] [CrossRef]
  79. Wu, Z.; Guo, Z.; Wang, K.; Wang, R.; Fang, C. Comparative metabolomic analysis reveals the role of OsHPL1 in the cold-induced metabolic changes in rice. Plants 2023, 12, 2032. [Google Scholar] [CrossRef]
Figure 1. Grain branched-chain amino acid levels and correlation analyses in rice accessions. (AC) Box plots of valine (Val), leucine (Leu), and isoleucine (Ile) contents for the 272 indica and 150 japonica accessions. 2012r1, 2012r2, 2013r1, and 2013r2 on the x axes represent Val, Leu, and Ile content datasets with two biological replicates in 2012 and 2013. The contents of Val, Leu, and Ile are shown on the y axes. (D) Distribution and correlation matrix of Val, Leu, and Ile contents with two replicates in 2012 and 2013. The letter from a to l indicate the first and second replicate in 2012 and 2013 of Val, Leu, and Ile contents, respectively. *, **, ***, and “ns” indicate statistical significance at the 5%, 1%, and 0.1% probability levels and no significant difference, respectively.
Plants 12 02970 g001
Figure 2. Population structure of 422 rice accessions. (A) and (B) are scatter plots of the first three principal components (PCs) of 422 rice accessions. The variation explained by the first and second PCs are shown on the x and y axes in (A). The variation explained by the second and third PCs are shown on the x and y axes in (B). (C) Population structure estimated via ADMIXTURE. (D) Phylogenetic analysis of 422 rice accessions, the indica and japonica accessions are indicated in red and blue. (E) Genome-wide LD decay analysis of the genetic panel; indica and japonica accessions are indicated in red and blue. The squared correlation coefficients (r2) between SNPs are shown on the y axis, and the distance of LD decay is shown on the x axis.
Plants 12 02970 g002
Figure 3. Circos map of quantitative trait nucleotides (QTNs), QTN-by-environment interactions (QEIs), and QTN-by-QTN interactions (QQIs) for branched-chain amino acid level in rice grains. Track (A): Twelve rice chromosomes. Track (B): Heatmap of SNP density with bin sizes of 0.1 Mb. Track (C): QTNs detected using 3VmrMLM model. Track (D): Common QTNs identified in two or more content datasets. Track (E,F): QEIs and QQIs detected using 3VmrMLM model. The red, green, and blue lines on the track C-F represent the QTNs/QEIs/QQIs associated with the grains’ Val, Leu, and Ile contents, respectively.
Plants 12 02970 g003
Figure 4. Analyses of the candidate gene LOC_Os03g24460 related to valine (Val) content. (A) Local linkage disequilibrium block analysis for LOC_Os03g24460 and QEI-sf0314026224 locus. (B) Allelic variation and Val content analysis of LOC_Os03g24460 in 422 rice accessions with two replicates in 2012 and 2013. The Val content and content dataset info are shown on the y and x axes. 2012r1, 2012r2, 2013r1, and 2013r2 represent two replicates in 2012 and 2013. (C) Expression profile of LOC_Os03g24460 based on ePlant transcriptome data in rice, with the expression strength coded by color from yellow (low) to red (high). Red star and red dot indicate LOC_Os03g24460 and QEI-sf0314026224. *, ***, and “ns” indicate statistical significance at the 5% and 0.1% probability levels and no significant difference, respectively.
Plants 12 02970 g004
Figure 5. Analyses of the candidate gene LOC_Os01g55590 related to leucine (Leu) content. (A) Local linkage disequilibrium block analysis for LOC_Os01g55590 and QEI-sf0132146191 locus. (B) Allelic variation and Leu content analysis of LOC_Os01g55590 in 422 rice accessions with two replicates in 2012 and 2013. The Leu content and content dataset info are shown on the y and x axes. 2012r1, 2012r2, 2013r1, and 2013r2 represent two replicates in 2012 and 2013. (C) Expression profile of LOC_Os01g55590 based on ePlant transcriptome data in rice, with the expression strength coded by color from yellow (low) to red (high). Red star and red dot indicate LOC_Os01g55590 and QEI-sf0132146191. *, ***, and “ns” indicate statistical significance at the 5% and 0.1% probability levels and no significant difference, respectively.
Plants 12 02970 g005
Figure 6. Analyses of the candidate gene LOC_Os12g31820 related to isoleucine (Ile) content. (A) Local linkage disequilibrium block analysis for LOC_Os12g31820 and QEI-sf1219051313 locus. (B) Allelic variation and Ile content analysis of LOC_Os12g31820 in 422 rice accessions with two replicates in 2012 and 2013. The Ile content and content dataset info are shown on the y and x axes. 2012r1, 2012r2, 2013r1, and 2013r2 represent two replicates in 2012 and 2013. (C) Expression profile of LOC_Os12g31820 based on ePlant transcriptome data in rice, with expression strength coded by color from yellow (low) to red (high). Red star and red dot indicate LOC_Os12g31820 and QEI-sf1219051313. * and “ns” indicate statistical significance at the 5% probability level and no significant difference.
Plants 12 02970 g006
Figure 7. Detected QTN-by-QTN interactions (QQIs) related to branched-chain amino acid (BCAA) content in rice grains. (AC) Interaction between two QTNs underlying the leucine (Leu) accumulation. (D) Interaction between two QTNs underlying the isoleucine (Ile) accumulation. The alleles of first QTN and intensity of the accessions carrying corresponding alleles are shown on the x and y axes of each plot. c.p.s. indicates counts per second.
Plants 12 02970 g007
Table 1. Descriptive statistics of branched-chain amino acid (BCAA) content datasets.
DatasetNumberRangeMeanSDSkewnessKurtosisCV (%) aH2
Val-2012r142220.34–24.6722.280.630.550.7753.650.45
Val-2012r242221.72–25.223.260.610.290.0247.24
Val-2013r142220.99–27.1823.611.140.12−0.3192.75
Val-2013r242220.52–25.1122.950.700.070.6254.26
Leu-2012r14227.02–14.5910.782.09−0.81−0.5299.420.49
Leu-2012r24229.85–15.8212.980.91−0.110.0967.34
Leu-2013r14227.78–16.1312.321.63−0.27−0.34113.39
Leu-2013r24229.67–14.7212.240.92−0.10−0.0566.93
Ile-2012r14227.02–19.9714.162.51−0.861.34187.570.82
Ile-2012r24227.07–20.615.931.94−0.351.07156.20
Ile-2013r14229.06–22.3315.952.13−0.09−0.04219.03
Ile-2013r24227.02–19.6815.031.91−0.451.12145.75
a Calculated from the original dataset. CV: coefficient of variation; SD: standard deviation; H2: broad-sense heritability. Val, Leu, and Ile represent valine, leucine, and isoleucine. 2012r1, 2012r2, 2013r1, and 2013r2 represent two replicates in 2012 and 2013.
Table 2. Detected QTN-by-QTN interactions (QQIs) in grain branched-chain amino acid (BCAA) content datasets. QTN-1 and QTN2 represent the first and second QTNs of each QQI. aa.effect stands for the additive–additive effect.
QQI No.TraitQTN-1QTN-2aa.effectLODp-ValueR2 (%)
QQI-1Leusf0206778257sf04272020520.254.802.61 × 10−64.50
QQI-2Leusf0220165492sf06008254070.225.416.00 × 10−74.84
QQI-3Leusf0414500497sf0810749006−0.195.475.14 × 10−73.90
QQI-4Leusf0606055009sf1226791763−0.205.191.01 × 10−64.16
QQI-5Leusf0608765681sf08153475830.305.021.52 × 10−65.84
QQI-6Leusf0711167346sf07252928930.315.613.73 × 10−74.17
QQI-7Leusf1109127718sf1207700947−0.294.991.63 × 10−63.67
QQI-8Ilesf0433008960sf1002475086−0.316.445.15 × 10−82.31
QQI-9Ilesf0622321011sf0701768847−0.295.792.42 × 10−72.21
QQI-10Ilesf0723859952sf11081923190.347.405.25 × 10−92.56
Disclaimer/Publisher’s Note: The statements, opinions and data contained in all publications are solely those of the individual author(s) and contributor(s) and not of MDPI and/or the editor(s). MDPI and/or the editor(s) disclaim responsibility for any injury to people or property resulting from any ideas, methods, instructions or products referred to in the content.

