Article

Comparative Cytogenetics and Fluorescent Chromosome Banding in Five Indian Species of Dipcadi Medik

1
Department of Botany, Calcutta University, 35, Ballygunge Circular Road, Kolkata 700019, India
2
Department of Botany, Maulana Azad College, Kolkata 700013, India
*
Author to whom correspondence should be addressed.
Plants 2023, 12(13), 2534; https://doi.org/10.3390/plants12132534
Submission received: 24 February 2023 / Revised: 21 June 2023 / Accepted: 27 June 2023 / Published: 3 July 2023
(This article belongs to the Special Issue Cytogenetics and Agronomic Traits of Crops)

Abstract

:
The genus Dipcadi Medik. (Subfamily: Scilloideae) has a narrow distribution in India and several overlapping morphological traits make the genus taxonomically challenging at the species level. Cytogenetic characterization can provide additional taxonomic data and can be used to evaluate genetic diversity at the species level. We have accomplished comparative karyotype analysis and fluorescence banding patterns using 4′-6-Diamidino-2-phenylindole (DAPI) and Chromomycin A3 (CMA) in five Indian species for the first time. The karyotypes of D. concanense and D. goaense exhibited similar fluorochrome banding profiles. However, D. montanum, D. ursulae and D. erythraeum differ distinctly in their karyotypes. In all taxa, CMA+ve/DAPI−ve or DAPI0 (GC-rich) constitutive heterochromatin was located at the constriction region or terminal satellite of the nucleolar chromosome. DAPI+ve/CMA−ve or CMA0 (AT-rich) heterochromatin dominates in D. montanum, D. ursulae and D. erythraeum. However, D. erythraeum shows a distinct variation in fluorochrome banding pattern from all other species. The distribution of CMA and DAPI bands is a reflection of heterochromatin composition and variations acquired by different species. This characterization can be used to assess phylogenetic relationships in the understudied genus Dipcadi and may serve as a basis for other genomic analyses and evolutionary studies.

1. Introduction

The subfamily Scilloideae (family Asparagaceae) sensu Angiosperm Phylogeny Group, (APG III) [1] is a major group of small perennial bulbous plants, consisting of four monophyletic tribes: Hyacintheae, Ornithogaleae, Urgineeae and Oziroeeae [2,3,4,5]. Bulbous geophytes of this subfamily have long been used in traditional medicine and specialized metabolites from members of each tribe have been reported such as homoisoflavonoids and triterpenoids from Hyacintheae, bufadienolides from Urgineeae and cardenolides from Ornithogaleae [6,7,8,9,10,11]. Scilloideae is represented mainly by three genera in India viz. Drimia Jacq. ex Willd. (Urgineeae), Dipcadi Medik. (Ornithogaleae) and Ledebouria Roth (Hyacintheaee). Due to taxonomic disputes at interspecific levels [12], the three genera have been subjected to revision from time to time [2,3,4].
The genus Dipcadi Medik. is morphologically distinct from other genera in having tubular flowers, quadrate capsules and large discoid seeds [13]. There are confusing reports on the number of valid species of Dipcadi in India [12,14,15,16], ranging from seven to nine species [12,14,16,17]. Most of the species of Dipcadi in India are endemic to the Western Ghats, a biodiversity hotspot and a world heritage site [12,17]. Some species are assessed as threatened according to the red data book of Indian plants of which D. concanense and D. reidii were declared extinct but rediscovered and assessed as critically endangered [17,18]. Dipcadi goaense was located along the lateritic gravelly area of South Goa [19] and the species is known by a single population restricted to the type locality [14]. Dipcadi erythraeum is endemic to desert areas of Rajasthan. These species have several uniform and overlapping morphological characters, making the genus taxonomically difficult at the species level [12,20] and necessitating the study of additional parameters for the thorough characterization of taxa. The importance of the Indian species of Dipcadi resides not only in their endemism and narrow distribution but also in their phytochemical constituents [12,15,21,22,23,24].
Detailed cytogenetic and molecular phylogenetic studies are reported to be useful for the advancement of classification at the species level [2,3,25]. Globally, chromosome counts have been reported for 14 species of Dipcadi [25] showing wide diversity in chromosome number [26]. Among the species occurring in India, D. concanense, D. goaense and D. saxorum show 2n = 12 chromosomes while D. montanum and D. ursulae show 2n = 20 chromosomes [14,27,28,29]. Dipcadi erythraeum is reported to have 2n = 20 [30] as well as 2n = 22 chromosomes [31]. Meiosis shows regular bivalent formation in most of the species studied [14,30,31,32]. Karyotype analysis in the Indian species of Dipcadi exhibits asymmetric bimodal karyotypes but detailed characterization is lacking [14,30,31,32,33].
Over the years, molecular cytogenetics has rejuvenated research on plant chromosomes. Chromosomes prepared through the enzymatic maceration and air drying (EMA) method followed by Giemsa staining [34,35] provides distinct chromosomal morphology in a cytoplasm-free background. Application of contrasting base-specific fluorochrome dyes 4′-6-Diamidino-2-phenylindole (DAPI) and Chromomycin A3 (CMA) helps to identify heterochromatin blocks of repetitive DNA sequences directly on the chromosomes [36]. The present study is a continuation of our previous work on the karyological relationship and molecular phylogeny of the Indian taxa of Scilloideae [37,38]. It is evident that chromosomal evaluation and molecular phylogenetic study may complement each other to enrich existing knowledge regarding the relationship among different species of the understudied genus Dipcadi.
The objective of the present study was to establish fluorescent karyotypes of Indian species of Dipcadi, to evaluate the genetic diversity at chromosomal level in the species collected. Traditional taxonomic parameters such as vegetative and floral morphology, anatomy and pollen architecture have been reported to show very little or continuous variation in Dipcadi species and hence the study of additional parameters seems necessary. Molecular cytogenetic characterization providing precise knowledge on chromosome number and architecture is reported to be useful for phylogenetic studies and the advancement of classification at the species level. This characterization can be used to assess genetic diversity, provide additional taxonomic data, and serve as a basis for other genomic analyses and evolutionary studies.

2. Results

2.1. Chromosome Number and Karyotype Analysis

This karyo-morphometric analysis of the Indian species of Dipcadi is based on five species collected from Western Ghats (D. concanense, D. goaense, D. montanum, D. ursulae) and Rajasthan (D. erythraeum). Chromosome counts from 20–25 well-scattered metaphase plates of each population of each species (Table 1) revealed interspecific differences in the diploid chromosome number. Dipcadi concanense (a threatened species) and D. goaense (an endemic species) showed 2n = 12 chromosomes, while D. montanum and D. ursulae show 2n = 20 chromosomes and D. erythraeum, an endemic species from Rajasthan, showed 2n = 22 chromosomes.
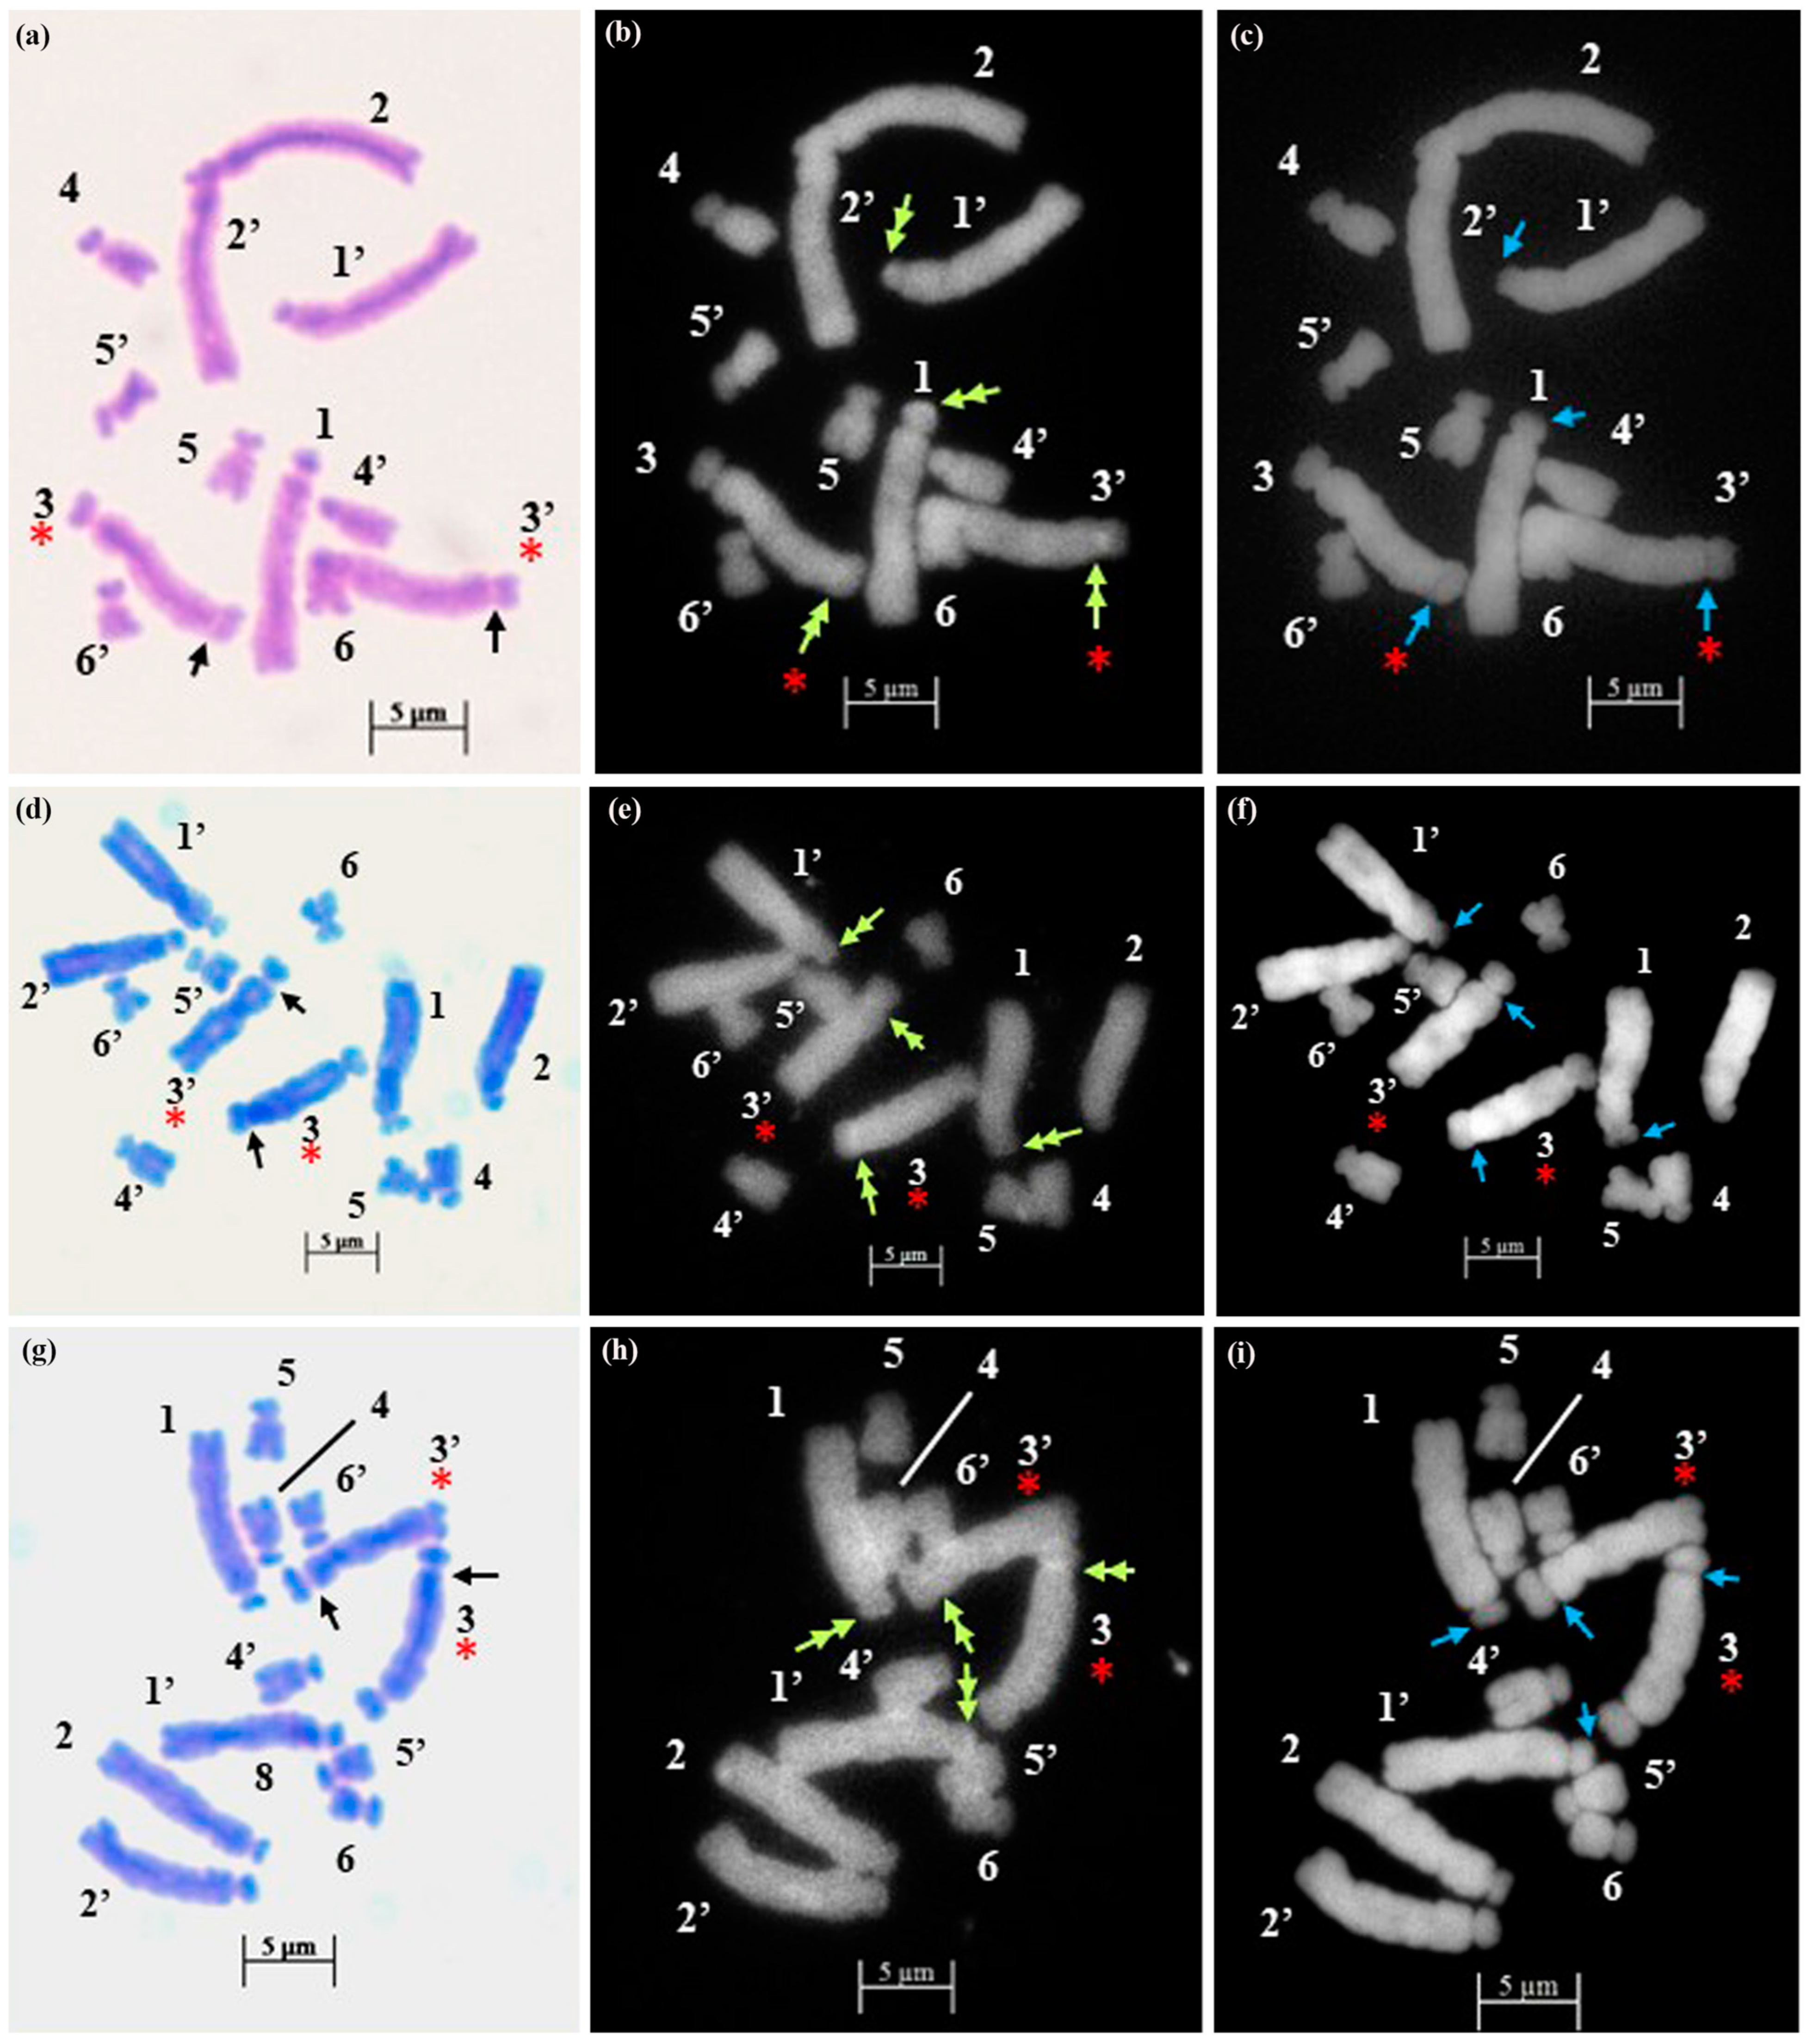
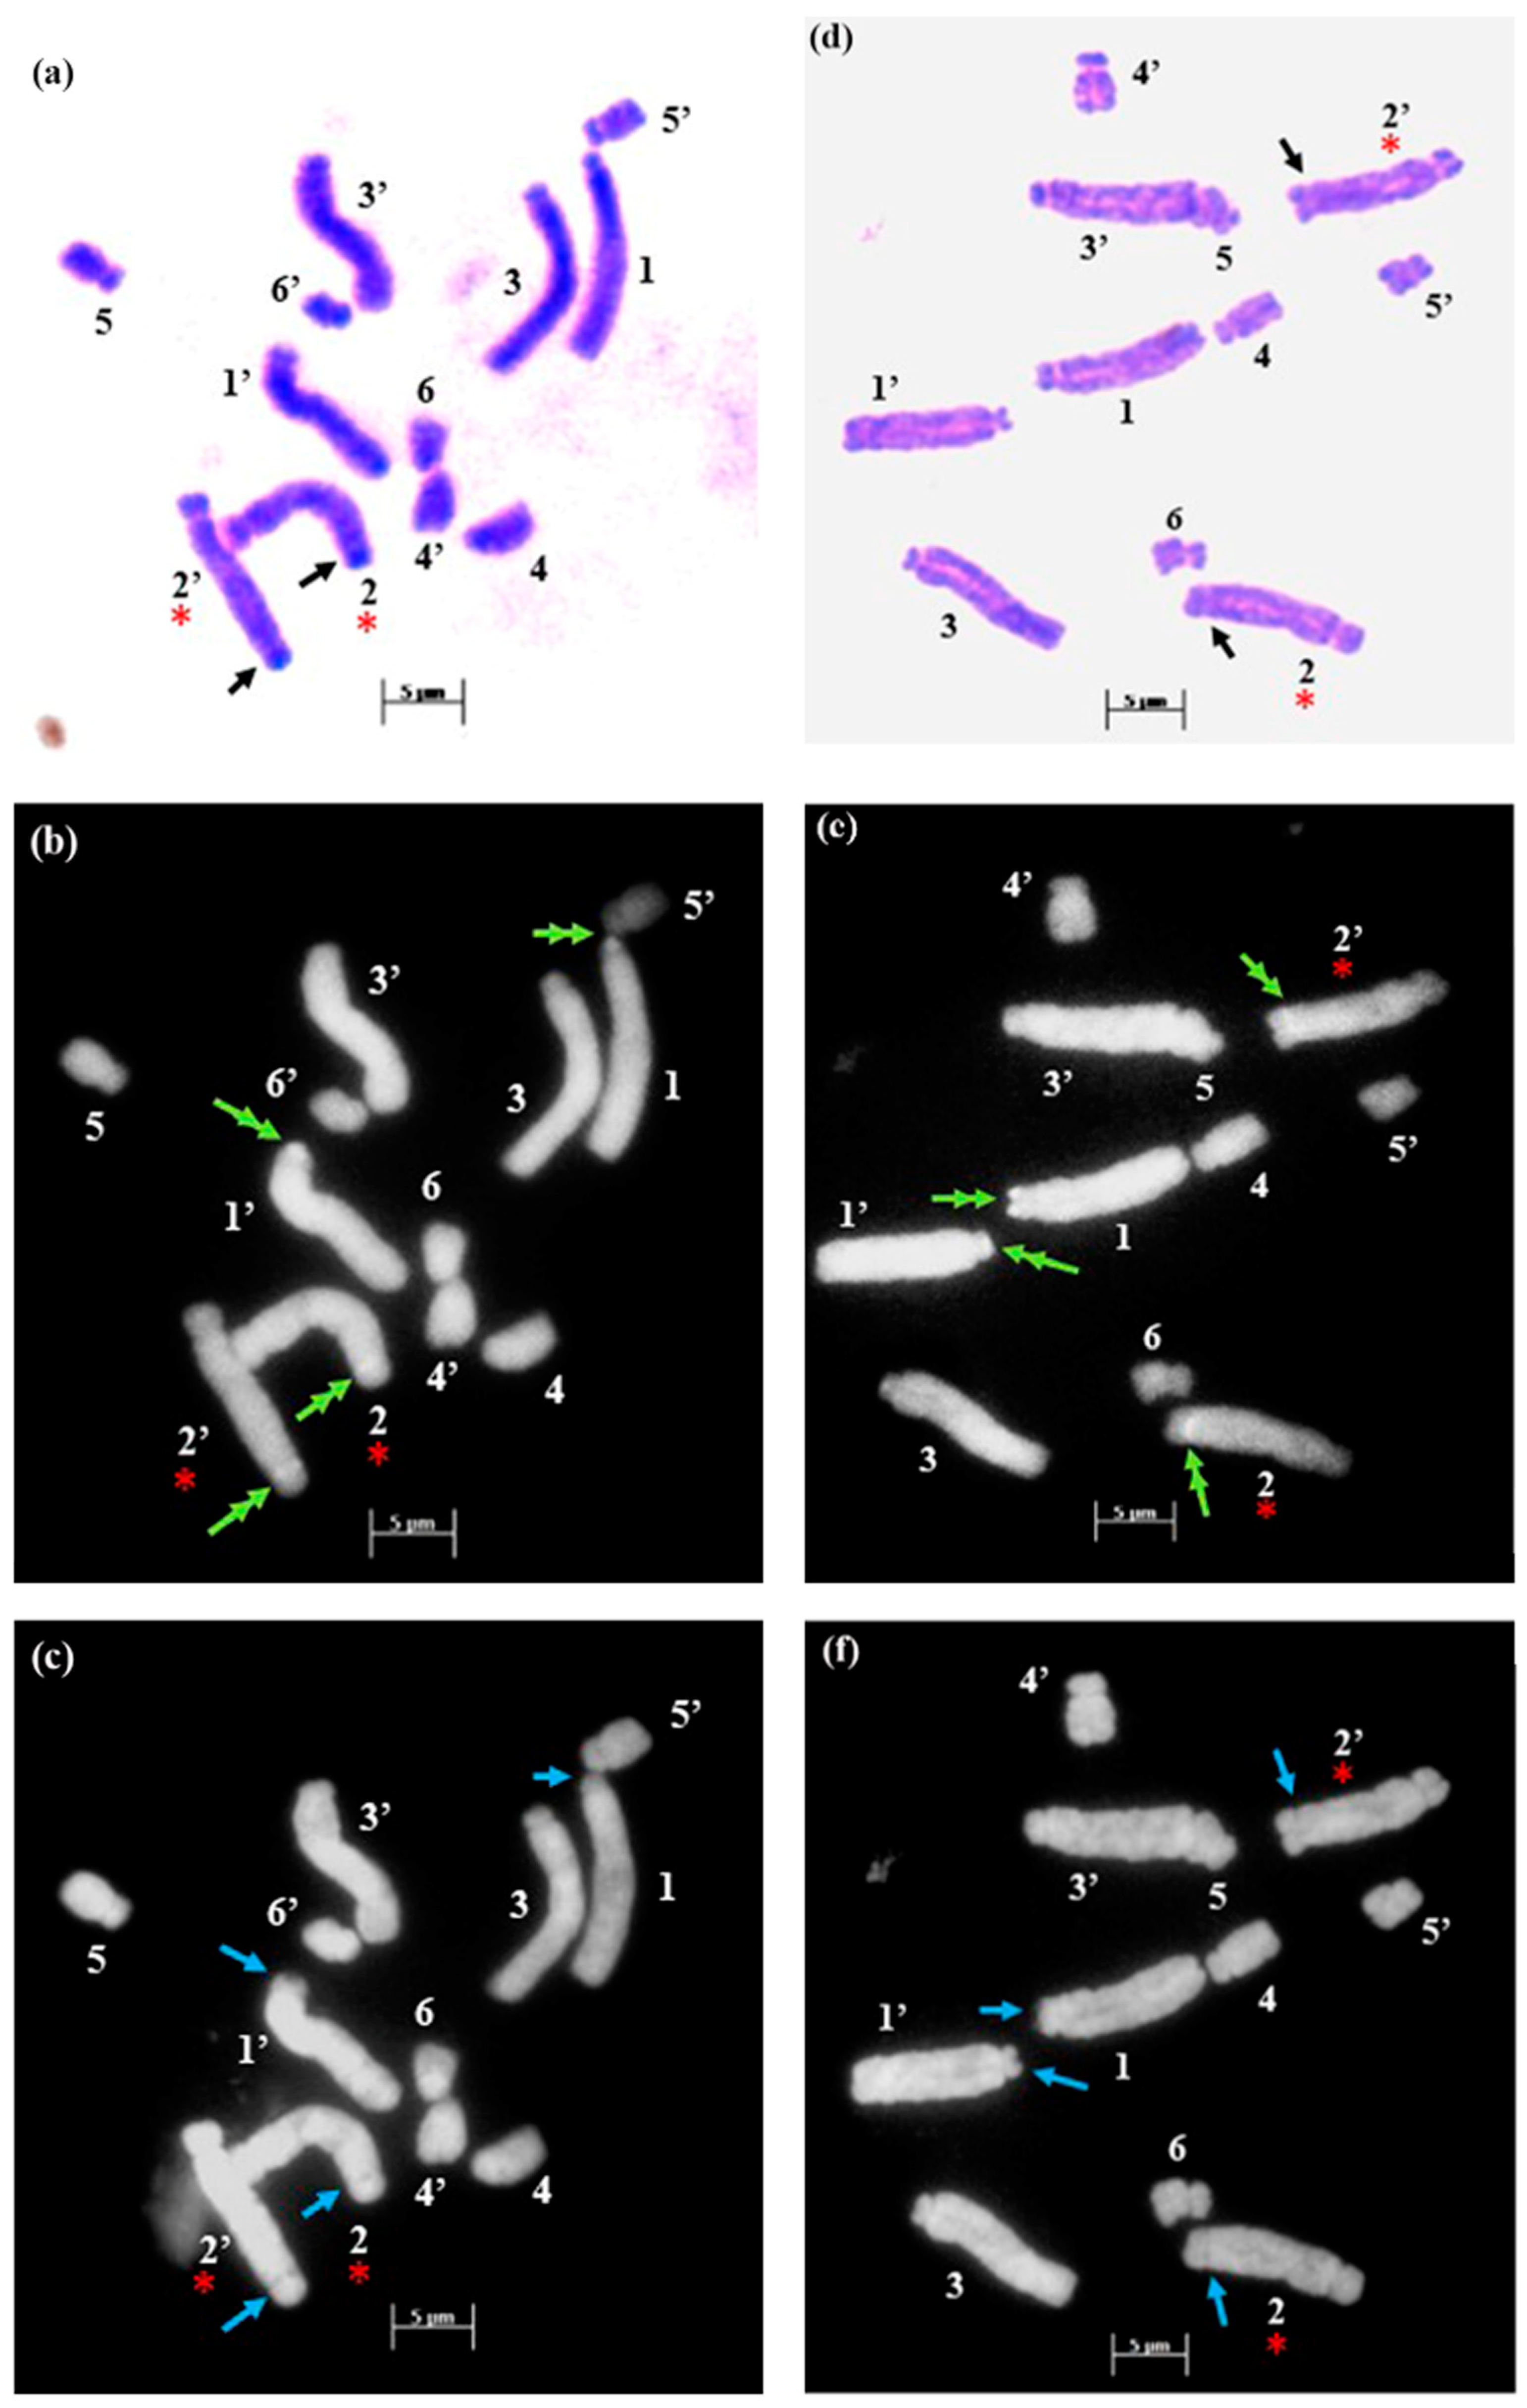
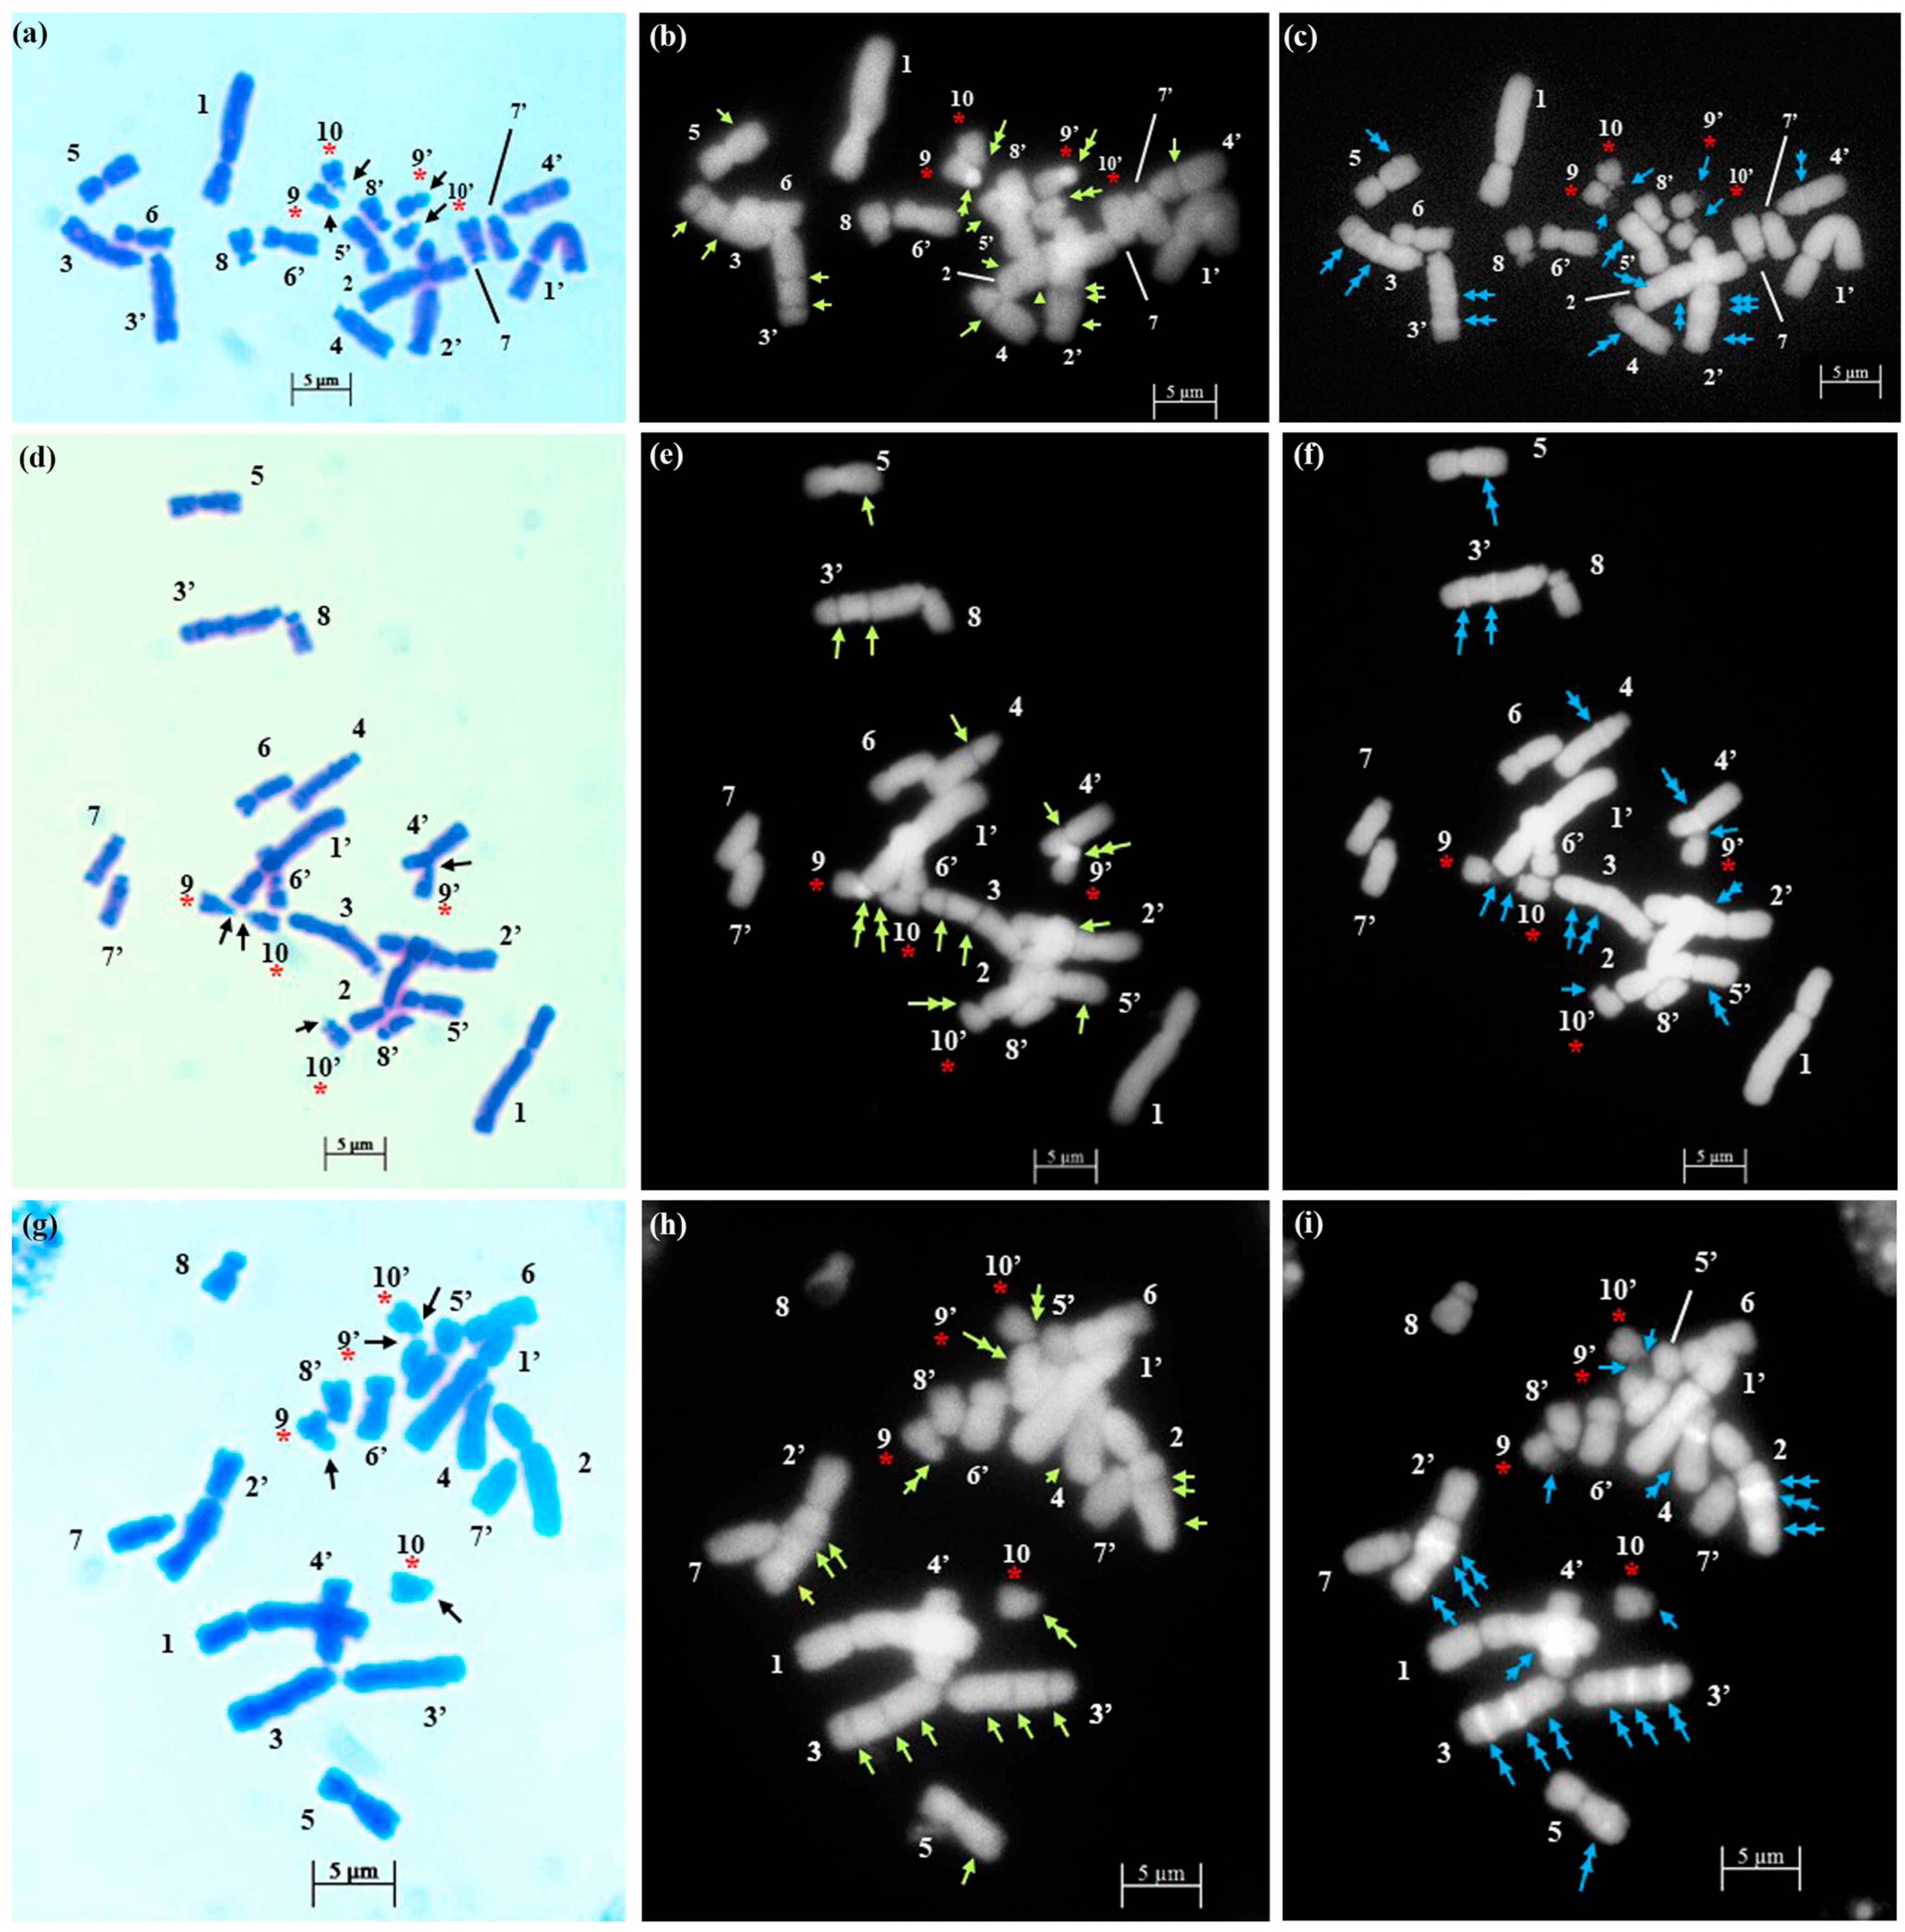
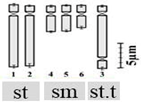
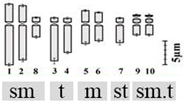
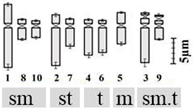
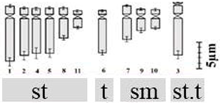
The technical standardization of the methodology for EMA-based Giemsa staining allowed us to identify very clearly the numbers and the position of constrictions (primary and secondary) for the first time in all five species. The chromosomes have been categorized into three basic types [39,40] in five species: sub-median (sm), sub-terminal (st) and terminal (t). The longest chromosome pair in all the species is either with sub-terminal constriction (D. concanense, D. goaense and D. erythraeum) or with sub-median constriction (in D. montanum and D. ursulae). The smallest chromosome pair was sub-median in all the species except in D. erythraeum. Chromosomes with secondary constriction (i.e., chromosomes with two constrictions) have been identified for the first time in Dipcadi species in this study (Figure 1a, Figure 2a, Figure 3a, Figure 4a and Figure 5a). One pair of chromosomes with two constrictions was clearly identified in D. concanense, D. goaense and D. erythraeum, (Table 2, Figure 1a, Figure 2a and Figure 5a) whereas two pairs of chromosomes with secondary constrictions were identified in D. montanum and D. ursulae (Table 2, Figure 3a and Figure 4a). These were located on the 3rd pair of chromosomes in D. concanense, and D. erythraeum and on the 2nd pair in D. goaense. On the other hand, in D. montanum, the 9th and 10th pair of chromosomes were with two constrictions. In D. ursulae, these were located on the 3rd and 9th pair of chromosomes as shown in the karyotype of each species (Table 2). Dipcadi concanense and D. goaense with the same chromosome number (2n = 12), showed similar karyotype (4st + 6sm + 2st.t). Additionally, in D. concanense and D. goaense, the secondary constricted chromosomes were of the same type, i.e., of the two constrictions, one is subterminal (st) and the other is terminal (t), at two ends of the long arm. Dipcadi montanum and D. ursulae, with the same chromosome number (2n = 20), differ in their karyotype (Table 2) and the type of secondary constricted chromosomes. In D. montanum, of the two constrictions in the 9th and 10th pair of chromosomes, one is sub-median (sm) in position and the other is terminal (t) at the distal end of the short arm. In D. ursulae, one is sub-terminal (st) and the other is terminal (t), at the distal end of the short arm in the 3rd and 9th pair of chromosomes. The two populations of D. erythraeum (2n = 22) exhibited distinctly different karyotypes from all other four species. However, the type of secondary constricted chromosome was similar to D. ursulae (Table 2).
The interspecific and intraspecific variation in total chromatin length (TCL) was determined for all populations (Table 1). Inter-specific variation in TCL was observed between all species and between populations of D. montanum, D. ursulae, D. erythraeum (Table 1). The range of chromosome size found in these species indicated the bimodal nature of their karyotype (Table 2). The Average Chromosome Length (ACL) of the different populations in five species ranged between 5.10–5.15 µm (D. erythraeum) and 7.15–7.18 µm (D. concanense). The karyotypes of all species studied, were asymmetrical considering the centromeric position and chromosome size variation.

2.2. Fluorochrome Banding Pattern
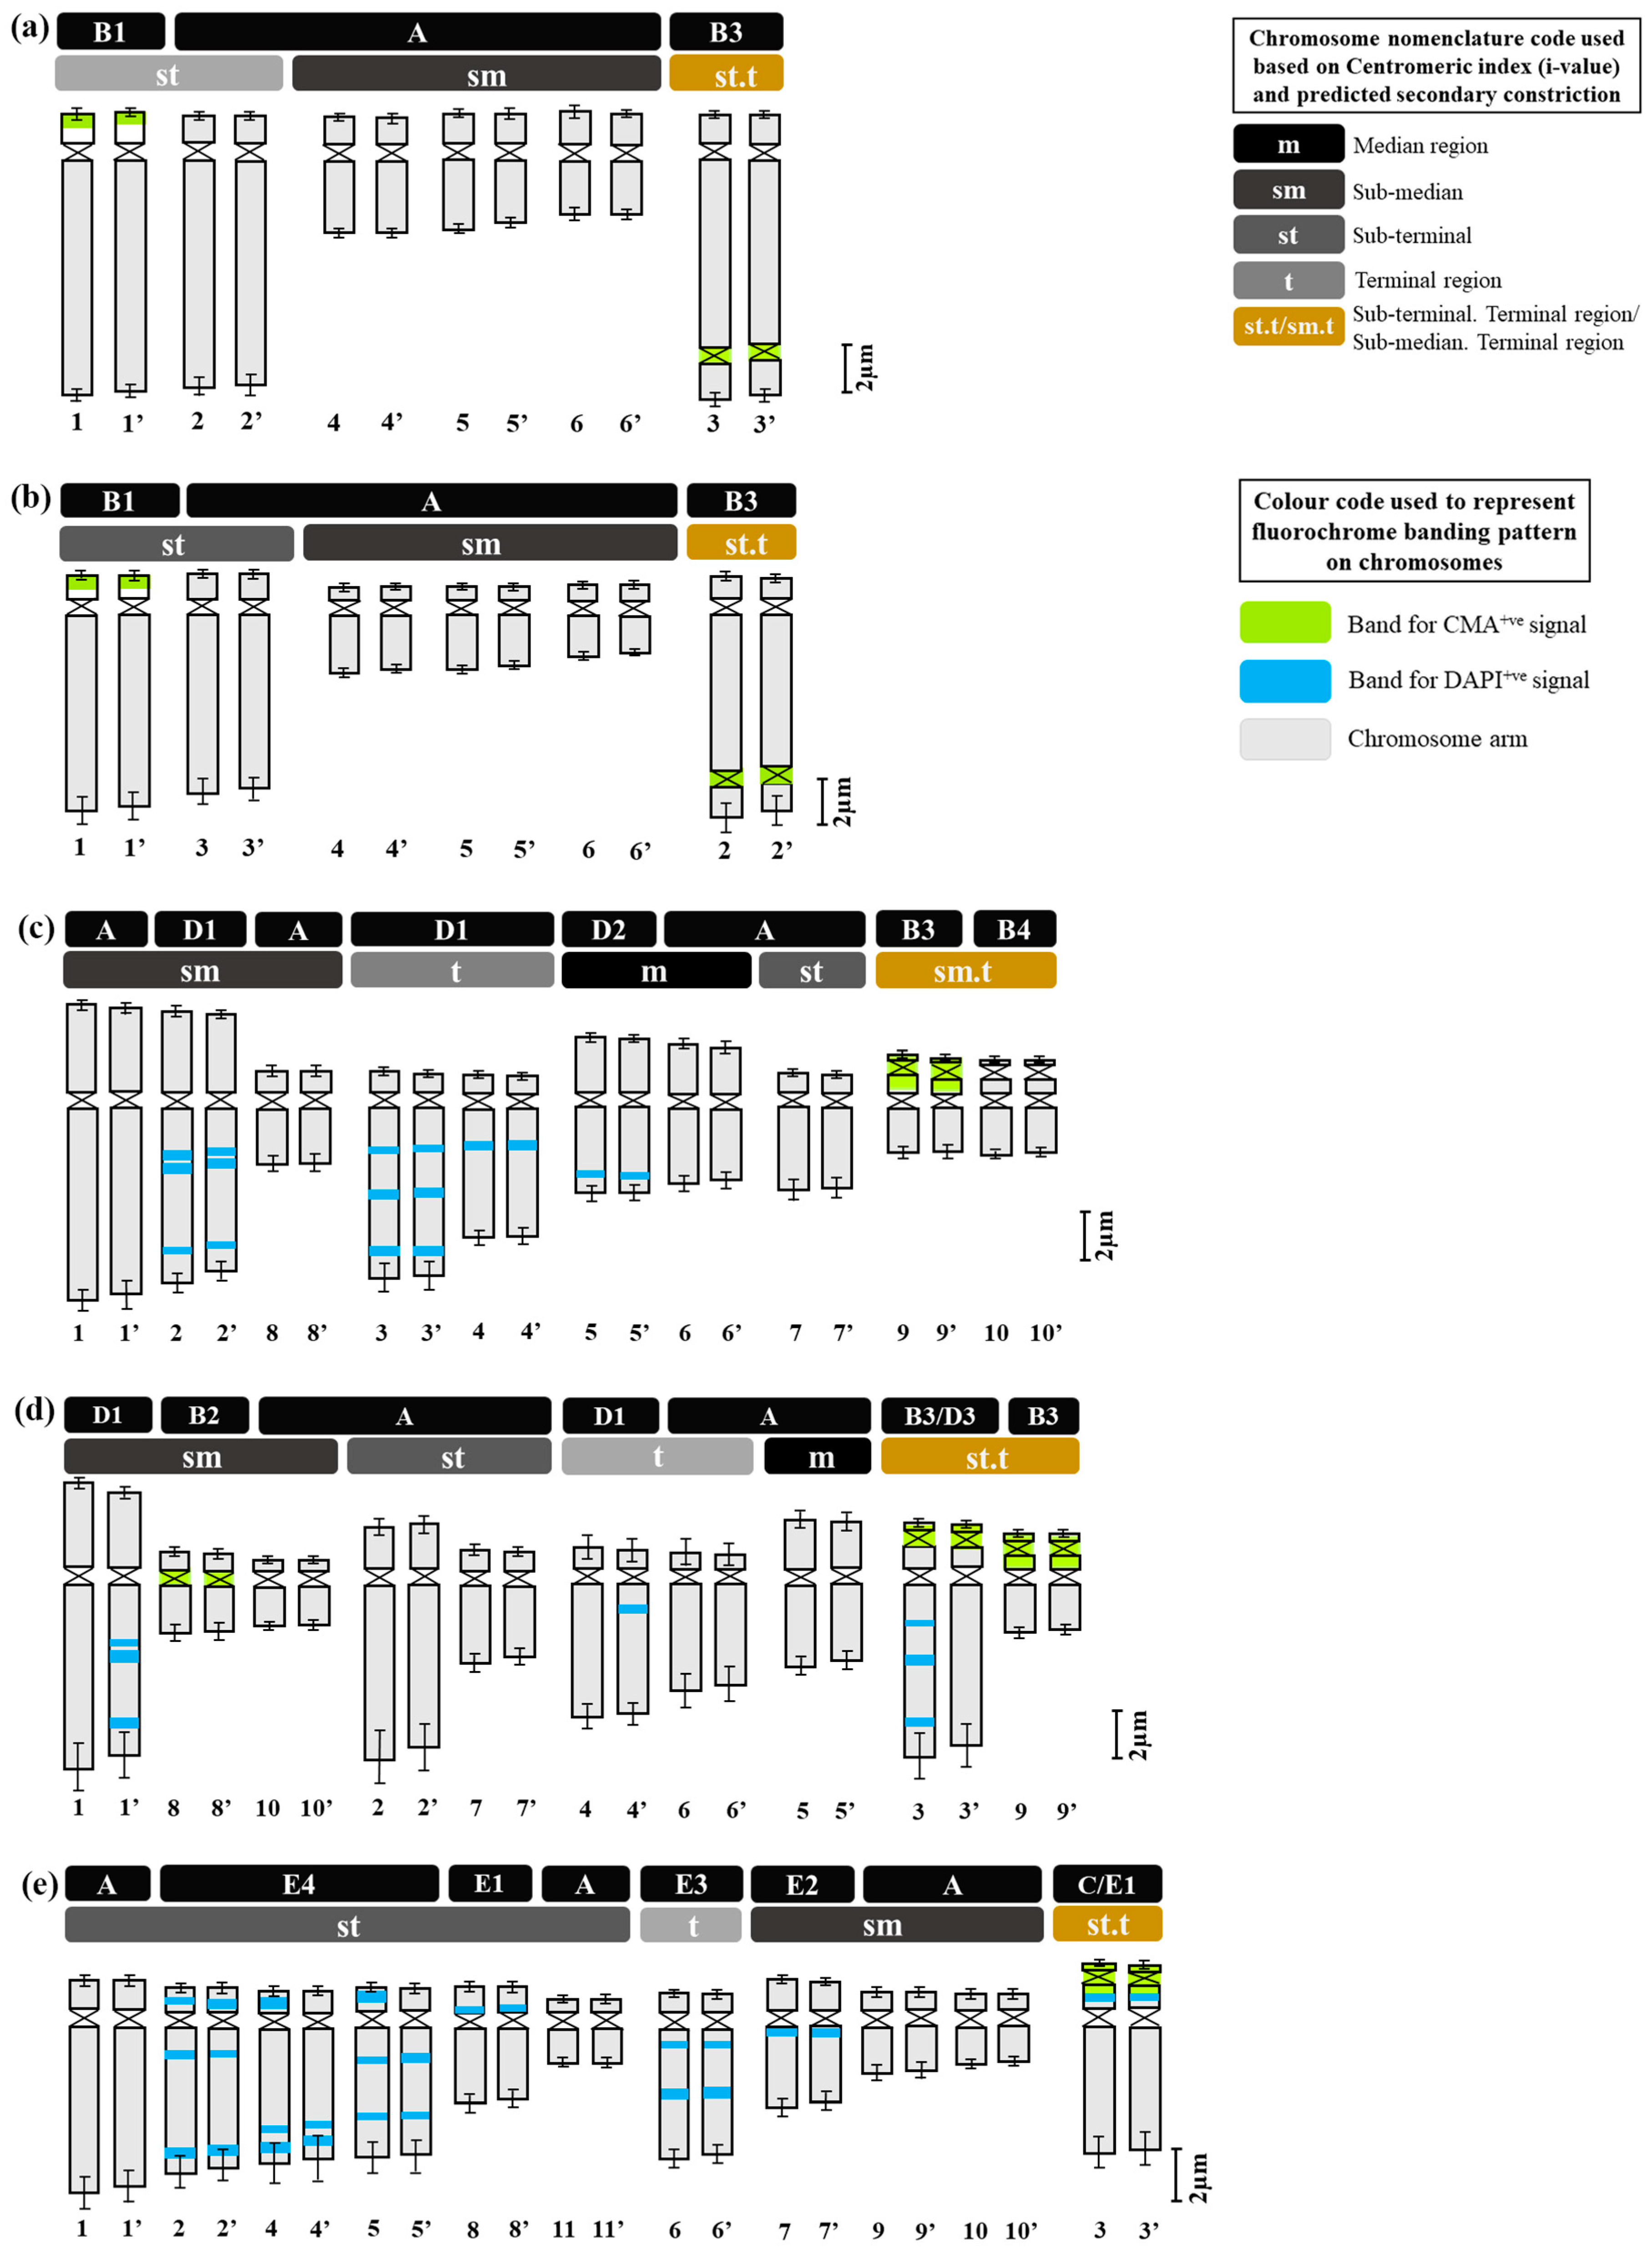
Fluorescent banding with DAPI and CMA led to a diversified, scorable and species-specific fluorescent banding pattern in species of Dipcadi. 0.1 mg mL−1 of CMA solution required 60 min. to induce scorable bands, while, 0.1 µg mL−1 of DAPI solution took 25 min to induce clearly visible bands. A minimum of 15 metaphase plates for each species stained with DAPI and CMA were considered for the analysis of band patterns (Figure 1, Figure 2, Figure 3, Figure 4, Figure 5 and Figure 6). Considering the high preferential nature of CMA and DAPI in GC- and AT-rich sequences, as suggested by Barros e Silva and Guerra [41], we identified different types of heterochromatic signals/bands as GC-rich (CMA+ve/DAPI−ve), AT-rich (DAPI+ve/CMA−ve) or as AT/GC-neutral (DAPI0/CMA0) in different species of Dipcadi (Table 3). In chromosomes showing CMA+ve/DAPI−ve banding pattern (type B, Table 3), DAPI staining resulted in a clear gap (DAPI−ve bands) corresponding to the CMA+ve signal/band. On the other hand, in chromosomes showing DAPI+ve/CMA−ve banding pattern (type D, Table 3), CMA staining resulted in a clear gap (CMA−ve bands) corresponding to the DAPI+ve signal/band.
In D. concanense and D. goaense with 2n = 12, only four CMA+ve/DAPI−ve bands (type B, Table 3 and Table 4, Figure 1, Figure 2 and Figure 6) were located on two pairs of chromosomes. It is noteworthy that no DAPI+ve bands were identified in these two species. In D. montanum and D. ursulae (2n = 20), four and six CMA+ve/DAPI−ve bands (type B, Table 3 and Table 4, Figure 3 and Figure 4) were observed, respectively. The distinctive feature of both species was the presence of DAPI+ve/CMA−ve bands (type D, Table 3, Figure 3, Figure 4 and Figure 6) on the chromosomes. Sixteen type D bands were located on four pairs of chromosomes in D. montanum while seven bands on three chromosomes were located in D. ursulae (Table 4). Dipcadi erythraeum (2n = 22), differed from all other species in the banding type, showing two CMA+ve/DAPI0 bands (type C, Table 3 and Table 4, Figure 5) and 26 DAPI+ve/CMA0 bands (type E, Table 3 and Table 4, Figure 5 and Figure 6). The DAPI+ve/CMA0 bands were interstitial in position, located on the short arm (type E1) or long arm (E3) or on both arms (E4) of chromosomes. Thus, the fluorochrome karyotype showed significant differences in the type of bands and in the number of bands between the five species. The fluorochrome karyotypes of five species reveal similarities and distinct differences between species (Figure 6).
Figure 1. Somatic metaphase plates of Dipcadi concanense (Dalzell) Baker with 2n = 12 chromosomes stained with Giemsa (a,d,g), CMA (b,e,h) and DAPI (c,f,i). Black arrows indicate position of secondary constrictions in Giemsa-stained plates (a,d,g). Double yellow arrows indicate CMA+ve bands (b,e,h). Single blue arrows indicate the DAPI−ve band/gap (c,f,i). Red asterisks mark chromosomes with secondary constrictions in all the plates. Bars 5 µm.
Plants 12 02534 g001
Figure 2. Somatic metaphase plates of Dipcadi goaense Prabhug. with 2n = 12 chromosomes stained with Giemsa (a,d), CMA (b,e) and DAPI (c,f). Black arrows indicate position of secondary constrictions in Giemsa-stained plates (a,d). Double yellow arrows indicate CMA+ve bands (b,e). Single blue arrows mark the DAPI−ve gaps (c,f). Red asterisks mark chromosomes with secondary constrictions in all the plates. (df); one chromosome less, out of field). Bars 5 µm.
Plants 12 02534 g002
Figure 3. Somatic metaphase plates of Dipcadi montanum (Dalzell) Baker with 2n = 20 chromosomes stained with Giemsa (a,d,g), CMA (b,e,h) and DAPI (c,f,i). Black arrows indicate position of secondary constrictions in Giemsa-stained plates (a,d,g). Double yellow arrows indicate CMA+ve signals and single yellow arrows indicate CMA−ve gaps (b,e,h). Double blue arrows indicate DAPI+ve signals and single blue arrows mark the DAPI−ve gaps (c,f,i). Red asterisks indicate chromosomes with secondary constrictions in all the plates. Bars 5 µm.
Plants 12 02534 g003
Figure 4. Somatic metaphase plates of Dipcadi ursulae Blatt. with 2n = 20 chromosomes stained with Giemsa (a,d,g), CMA (b,e,h) and DAPI (c,f,i). Black arrows indicate position of secondary constrictions in Giemsa-stained plates (a,d,g). Double and single yellow arrows indicate bands of CMA+ve signals and CMA−ve gaps (b,e,h). Double blue arrows indicate DAPI+ve signals and single blue arrows mark the DAPI−ve gaps (c,f,i). Red asterisks indicate chromosomes with secondary constrictions in all the plates. Bars 5 µm.
Plants 12 02534 g004
Figure 5. Somatic metaphase plates of Dipcadi erythraeum Webb & Berthel. with 2n = 22 chromosomes stained with Giemsa (a,d), CMA (b,e) and DAPI (c,f). Black arrows indicate position of secondary constrictions in Giemsa-stained plates (a,d). Double yellow arrows indicate bands of CMA+ve signals in CMA-stained plates (b,e). Double blue arrows showing clear and bright DAPI+ve signals (c,f). Red asterisks in all the three stained plates indicate chromosomes with secondary constrictions and an associated unusual CMA+ve/DAPI0 signal. Bars 5 µm.
Plants 12 02534 g005
Figure 6. Comparative ideograms of the five species of Dipcadi ((a) D. concanense, (b) D. goaense, (c) D. montanum, (d) D. ursulae, (e) D. erythraeum) showing CMA+ve and DAPI+ve banding patterns. (The upper two bars of each ideogram mention the types of CMA+ve and DAPI+ve signals observed on chromosome arms and category of chromosomes based on centromeric index, respectively. The numbers in the lower panel represent the numerical sequence of the chromosomes in the karyotype based on their average absolute length. Bar scale: 2 µm). Colour code used for centromeric index based chromosomal nomenclature and CMA+ve and DAPI+ve signals (or, bands) are described in the top-right corner of the figure.
Plants 12 02534 g006

3. Discussion

Although traditional karyotype analysis can be considered obsolete in the genomic era, it is in fact quite contrary as basic karyotype information, chromosome number, genome size, and position of landmarks including repetitive DNA, will remain important for necessary data interpretation [42,43,44,45,46,47,48]. Chromosome features used in cytotaxonomy may present a continuous variation (average chromosome length, mean arm ratio or r index, symmetry indices) or a discontinuous variation (chromosome number, heterochromatic bands, number of rDNA sites) [46,49]. Measurements of chromosome arms for the identification of chromosomes in a karyotype are useful to quantify differences or similarities among karyotypes. The symbols used in the present study to describe karyotypes correspond to those coined by Levan et al. [39], as described by Mitrenina et al. [40]. Although most publications in plant cytogenetics followed the nomenclature for chromosome morphology as reviewed by Levan et al. [39], some variations in nomenclature [50] and development of R scripts for the determination of standardized karyotype have also been reported [45,48].
In this study, we have presented a karyotype analysis of five endemics, threatened Indian species of Dipcadi, which was reported as a disappearing genus in India [51]. Dipcadi with 41 species distributed in the Mediterranean region, Africa and Southeast Asia [13,20], is poorly defined taxonomically because of overlapping morphological characters [12]. Consistent with the general trend in Scilloideae, continuous variation is prevalent in most Indian taxa requiring detailed taxonomic characterization, including molecular and cytogenetic characterization. Molecular phylogenetic studies in the tribe Ornithogaloideae (Subfamily Scilloideae) recognized nineteen monophyletic genera, including Dipcadi [5].
Somatic chromosome counts available globally for about 14 species of Dipcadi [25] have revealed wide diversity in chromosome number (2n = 6, 8, 16, 20, 22, 24, 32, 40). Since D. serotinum, with a broad distribution (Europe and Northern Africa to the Arabian Peninsula and India) shows 2n = 2x = 8 chromosomes with n = 4 [33], a base chromosome number [49,52] of x = 4 has been suggested [30]. Thus, considering x = 4, taxa with 2n = 12, 20, 22 in the present study may be polyploid derivatives. However, the probable base chromosome number of x = 6 has also been proposed for the genus Dipcadi [26] according to which in the present study, species with 2n = 12 are diploids (D. concanense and D. goaense) while species with 2n = 20, 2n = 22 (D. ursulae, D. montanum, D. erythraeum) presumably resulted from descending dysploidy and subsequent polyploidisation, and are thus probable hypotetraploids.
In the present study, the somatic chromosome number of 2n = 12 was observed in D. concanense, and D. goaense reconfirms earlier chromosome number reports in the two species [19,28,29]. Chromosome numbers of D. montanum and D. ursulae were observed to be 2n = 20, while D. erythraeum showed 2n = 22. Although Mahabale and Cheenavariah [27] reported 2n=20 for D. montanum, Naik [32] reported two cytological races for D. montanum collected from Aurangabad showing 2n = 10 and 2n = 12 in somatic metaphases. In this study, we reconfirm 2n = 20 for D. montanum. Jakhi et al. [31] first reported 2n = 22 and n = 11 in D. erythraeum collected from Rajasthan, reconfirmed by Jehan et al. [12], although 2n = 20 has also been reported in the species [30]. We confirm 2n = 22 in D. erythraeum in two populations from Rajasthan.
Meiotic analysis in species reported revealed regular bivalent formation in pollen mother cells [14,30,31,32,33]. However, in some species, low pollen fertility [31], the occurrence of univalents [30] and abnormalities during meiosis have also been reported [33]. Hybridization followed by polyploidisation may have resulted in ascending dysploid series of chromosome numbers in the genus Dipcadi. Dysploid variation is caused by complex mechanisms [52] and further analyses in a large number of species are a prerequisite to suggest the trend of karyotype evolution in the genus Dipcadi.
Previous reports of karyotype analysis on Indian species of Dipcadi are few and have not revealed distinct morphology of the karyotype with respective to a position of centromere and secondary constriction. In D. erythraeum, Jakhi et al. [31] described chromosome morphology revealing one pair of long and two pairs of short chromosomes with sub-terminal constrictions, while the remaining chromosomes were sub-median. Rawat et al. [30] determined the karyotype formula revealing the majority of telocentric chromosomes followed by sub-metacentrics. They also stated that the analysis of chromosomes with secondary constrictions could not be obtained due to technical difficulties. The karyotype of D. goaense was reported to be similar to D. concanense [14,27].
This is the first report of EMA-Giemsa-based karyotype analysis establishing the modal karyotypes of five endemic or threatened Indian species of Dipcadi showing the presence of chromosomes with secondary constrictions in each species, varying in type and number. The karyotypes are characterized by the predominance of acrocentric/telocentric chromosomes with distinctly bimodal or graded chromosome complement.
In most plant species, the centromere or primary constriction is present in all the chromosomes, while on some chromosomes, a secondary constriction at the nucleolar organizer region (NOR) has been identified from the earliest microscopy [53,54]. At metaphase, NORs are often visible as secondary constrictions as the arrays of genes active at the previous metaphase remain decondensed [54]. Chromosomes with secondary constrictions are considered landmark chromosomes in karyotype analysis. In D. concanense, D. goaense and D. erythraeum one pair of chromosomes with secondary constrictions were identified while in D. montanum and D. ursulae, two pairs of chromosomes with secondary constrictions were identified.
The EMA-based Giemsa-stained karyotypes of two populations of D. concanense and D. goaense (from type locality), were similar in number and morphology including the type of nucleolar chromosomes. On the other hand, D. montanum, D. ursulae and D. erythraeum differ distinctly in their karyotypes including the number and type of nucleolar chromosomes. Fluorescent banding, particularly with CMA and DAPI, has been frequently used in a wide range of plant species to characterize individual chromosomes and delineate heterochromatic regions comprised of repetitive DNA sequences at different locations in a chromosome [36,55]. Chromosomal CMA+ve bands imply the prevalence of heterochromatic GC elements mainly surrounding the NORs [55,56] whereas the DAPI+ve bands reflect a type of condensed heterochromatin occupied by AT elements since DAPI is specific for AT-rich DNA stretches [36,57]. The same fluorochromes may also negatively stain AT-poor (DAPI−ve) or GC-poor (CMA−ve) heterochromatin blocks [55].
It is apparent from the fluorochrome band profiles in the present study that all five species of Dipcadi exhibited the CMA+ve band in one of the constriction regions or terminal satellites of the nucleolar chromosome. These CMA+ve bands were DAPI−ve, showing a clear gap corresponding to the CMA+ve bands in all species except in D. erythraeum. It is noteworthy that by using fluorochrome banding with base-specific fluorochromes [42], GC-rich heterochromatin has been identified in all species of Dipcadi, mostly in the nucleolar chromosomes. The majority of heterochromatic bands [42] have been reported to be AT-rich and are usually at interstitial regions in species with medium and large chromosomes. 35S rRNA genes often have been found to coincide with GC-rich bands [55]. The distal CMA+ve/DAPI−ve bands in the short arm of long chromosomes in D. concanence and D. goaense has not been observed in any other species in the present study. The CMA+ve signals are generally considered to represent GC-rich heterochromatin found mostly at NORs and also at proximal positions, coinciding with DAPI-negativity in the majority of plants reported [55]. It is now known that secondary constrictions represent only the expression of rRNA genes that were active during the last interphase [58]. Other functional sites may not form secondary constrictions if located at the terminal end of chromosomes [59].
AT-specific DAPI+ve banding profile revealed unique species-specific characteristic features for the first time in Dipcadi. DAPI+ve bands were distributed in the different interstitial regions of the long arm and short arm of the chromosomes in all species except in D. concanence and D. goaense. No DAPI+ve/CMA−ve or DAPI+ve/CMA0 signals/bands were obtained in D. concanence and D. goaense. Dipcadi montanum and D. ursulae showed distinctive DAPI+ve/CMA−ve bands in the chromosomes of the diploid complement (2n = 20). However, the two species differ in the number and occurrence of DAPI+ve/CMA−ve bands in the homologous chromosomes. In D. montanum, sixteen DAPI+ve/CMA−ve bands occur in four chromosome pairs. While in D. ursulae, seven DAPI+ve/CMA−ve bands were observed in three chromosomes, but not in the corresponding homologous pair. Thus, in D. ursulae, three out of ten pair of chromosomes show heteromorphism in homologous chromosomes with respect to DAPI+ve/CMA−ve banding patterns.
Dipcadi erythraeum with 2n = 22, shows distinct variation in banding type and pattern from all other species of Dipcadi studied. CMA+ve/DAPI0 signals in one of the constriction regions (in the chromosome pair with secondary constriction or nucleolar chromosome) extended to the short arm and terminal satellite. No CMA+ve/DAPI−ve bands were observed in any of the chromosomes. DAPI+ve/CMA0 signals were observed in seven chromosome pairs including one pair of nucleolar chromosomes. A total of 26 DAPI+ve/CMA0 bands were found on the seven chromosomes. Thus, in D. erythraeum two out of seven pair of chromosomes show heteromorphism in homologous chromosomes. Rawat et al. [30] suggested an amphidiploid origin for D. erythraeum. Jehan et al. [12] based on studies using molecular markers found D. erythraeum from Rajasthan to be distinctly different from the other species of Western Ghats. The heteromorphism in the banding pattern (DAPI+ve) supports both studies. Thus, in D. ursulae and D. erythraeum, CMA+ve/DAPI+ve signals in different regions of the same chromosome indicate the heterochromatin variation acquired by the species. The distribution of CMA and DAPI bands is a reflection of heterochromatin composition and variations acquired by different species [60,61,62]. AT-specific DAPI+ve banding pattern obtained in the present study revealed unique species-specific characteristic features for the first time.
In the subfamily Scilloideae, fluorochrome banding and fluorescence in situ hybridization (FISH) has been reported in some species under the tribe Hyacintheae. In Bellevalia, CMA+ve signals were associated with nucleolar chromosomes and rDNA probes colocalized with CMA+ve signals [63], although some variations have been reported in B. romana [64]. In Muscari, with bimodal karyotype, CMA+ve signals were located at NOR and rDNA probes colocalized with CMA+ve signals [65,66]. Interspecific variation in the distribution of DAPI+ve signals [65,67] and CMA+ve signals [67] have been reported in Muscari. Varied distribution of DAPI+ve signals has also been reported in species of Lachenalia [68,69]. In Drimia (tribe Urgineeae), CMA+ve/DAPI−ve signals were associated with nucleolar chromosomes, with some interspecific variations in additional signals [37]. In Albuca bracteata, (tribe Ornithogaleae), CMA+ve signals were detected at NOR regions, colocalized with rDNA signals while DAPI+ve signals were also reported at the centromeric or intercalary regions in the species [70].
Deshpande et al. [20] investigated the phylogenetic relationship between the two endemic and critically endangered Indian species of Dipcadi, D. concanense and D. goaense, using a plastid (matK) and ITS sequences. This study [20] revealed that D. concanense and D. goaense, were not only morphologically similar [19], with the same chromosome number [14], but they were also phylogenetically closely related species. In the present study, the karyotype analysis based on chromosome morphometric data as well as the fluorochrome banding pattern of D. concanense and D. goaense, were found to be very similar, and in agreement with findings based on molecular phylogenetic data [20]. Jehan et al. [12] studied in detail genetic diversity among the three genera, Drimia, Dipcadi and Ledebouria of subfamily Scilloideaea in India, using RAPD and SRAP markers. The study resolved the three genera into monophyletic groups corresponding to three subfamilies (now subtribes); Urginoideae, Hyacinthoideae and Ornithogaloideae. Among the Indian species of Dipcadi (excluding D. goaense), studied by Jehan et al. [12], D. concanense was found to be very distinct from other species of Western Ghats and D. erythraeum was also found to be a genetically distinct species in this study. The species from the Western Ghats formed a well distinct group, “whereas, northern Indian species, D. erythraeum from Rajasthan and Dipcadi serotinum from Delhi stood out as well differentiated taxa”. Jehan et al. [12] suggested that Dipcadi serotinum may have been introduced from Europe, as the flowering time differs from the Indian species. Thus, the unique fluorochrome banding patterns of D. montanum and D. ursulae, reveal that though the two species share the same chromosome number, the species are distinctly different as observed by Jehan et al. [12].
The application of fluorescent banding for comparative analysis of karyotypes has enriched present-day cytogenetics enormously as an integrative approach to solving the issues of systematics and phylogeny [71,72,73]. The present EMA-based Giemsa and fluorescent banding karyotype in five Indian Dipcadi species have confirmed distinct patterns and diversity of landmark nucleolar chromosomes. The result has revealed a diverse number of species-specific AT-rich, DAPI-positive repetitive sequences (0–26 in number) for the first time in the genus Dipcadi. These may be considered useful molecular markers for analyzing genetic diversity and studying genome evolution in other species. To resolve the interspecific phylogenetic and evolutionary relationships more molecular cytogenetic-based chromosome analysis using fluorescent banding and fluorescence in situ hybridization (FISH) deserves attention.

4. Materials and Methods

4.1. Plant Materials and Their Collection

Collection of different populations of Dipcadi species was possible as part of this study under the guidance of Professor SR Yadav and Dr. MM Lekhak, Shivaji University, Kolhapur, Maharashtra and with the help of Professor NS Shekhawat, Jodhpur University, Rajasthan. We could not collect/obtain any other Indian species for this study. Herbarium vouchers were prepared for each species, identified and deposited to the Shivaji University Herbarium, Kolhapur as well as Calcutta University Herbarium. Brief information on the place of collection of these five species is given in Table 1. Bulbs of each species were grown in pots and maintained in the experimental garden of the Department of Botany, University of Calcutta.

4.2. Mitotic Chromosome Preparation and Giemsa Staining

Ten to fifteen actively growing root tips from bulbs of each species were harvested during the months of June to August and pre-treated with 0.5% colchicine for 4 to 4.5 h at 14–16 °C [74]. The pre-treated root tips were fixed in a 3:1 methanol-acetic acid solution overnight and stored at −20 °C. The chromosome preparations were performed through standardization of the basic EMA technique following our earlier protocol [37,74] with modifications required. Fixed root tips were placed in water and kept at 4 °C for 3 h. One to two mm root tips were excised and carefully placed inside a microtube containing a cocktail enzyme mixture containing 0.15% Pectolyase (Y-23) plus 0.75% Macerozyme (R-10) and 1% Cellulose (Onozuka RS) along with 1mM EDTA. Root tips were incubated at 37 °C for 80–90 min. Enzyme-digested root tips were washed with distilled water and macerated in freshly prepared acetic methanol (1:3) solution on glass slides. Air-dried slides were stained in 2% Giemsa solution (Giemsa azure eosin methylene blue solution, Merck, Darmstadt, Germany) in 1/15th phosphate buffer (2.390 g Na2HPO4 and 0.900 g KH2PO4 in 100 mL distilled water) for 20–25 min at room temperature. A staining period of 25 min with Giemsa was found optimum for Dipcadi species. Giemsa-stained slides were screened under Axio Lab. A1 Carl Zeiss microscope to assess the quality of cytological preparations. Data sheets for individual species were prepared for selected well-scattered metaphase plates. Photomicrographs were taken under Axio Lab. A1 microscope fitted with a CCD camera and computer.

4.3. Karyotype Analysis

Somatic chromosome numbers and karyotypes were determined from 20–25 well-scattered Giemsa-stained metaphase plates of each population of species. The software Axiovision L.E 4 (Carl Zeiss, Jena, Germany), was used for chromosome morphometric data. A minimum of 10 well-scattered metaphase plates were selected for each population/species and analysed using this software for the estimation of short arm length (s), long arm length (l), arm ratios (r = l/s), chromosome length (CL), and total chromosome length (TCL). The centromeric index (i-value) was determined following Levan et al. [39] and Mitrenina et al. [40]. Absolute and relative chromosome lengths were calculated [75]. Karyotype formulae and the respective ideogram for each of the individual species were generated using the chromosome morphometric data [76].

4.4. Fluorochrome Staining of Somatic Chromosomes

Giemsa-stained slides were de-stained with 70% methanol for 45 min, air dried and further used twice for two separate fluorochrome staining with 4′-6-Diamidino-2-phenylindole (DAPI) and Chromomycin A3 (CMA) following the protocol described earlier [74,76], with minor modifications. Slides were incubated in McIlvaine buffer I (0.1 M citric acid, 0.2 M Na2HPO4, pH 7.0) for 30 min and stained with 0.1 µg/mL DAPI solution for 25–30 min. Slides were washed in the same buffer and counterstained with Actinomycin D (0.25 mg/mL) for 15 min. Slides were air-dried and mounted in non-fluorescent glycerol. The slides were kept overnight at 4 °C for maturation and were examined under the microscope with a UV filter cassette and images were captured with a CCD camera. For CMA staining, the slides were de-stained in 70% Methanol and air-dried. Slides were incubated in McIlvaine buffer I (0.1 M citric acid, 0.2 M Na2HPO4, pH 7.0) for 30 min and then in McIlvaine buffer II (with 5 mM MgCl2·6H2O) for 15 min. The slides were then flooded with 0.1 mg/mL CMA for 55–70 min. Excess stain was washed off in McIlvaine buffer II, air dried and mounted in non-fluorescent glycerol and kept at 4 °C refrigerator for 48 hrs. The observations were made by fluorescence microscopy with a BV filter cassette and the images were captured with a CCD camera.

4.5. Statistical Analysis

Data from at least ten different scattered metaphase plates were taken for determination of all the karyo-morphometric data, and data for each karyo-morphometric parameter was expressed as the mean ± standard deviation (SD). One-way analysis of variance (ANOVA) was used to analyse the data in order to find statistically significant variations in the mean values among the five species of Dipcadi. Using SPSS statistic software (IBM®, Armand, NY, USA) version 17.0, a descriptive post hoc mean separation analysis for the karyo-morphometric data set was carried out using Duncan’s multiple range test (DMRT) at the 5% probability level.

Author Contributions

Conceptualization, T.B.J., S.R. and S.J.; Data curation, T.S.; Formal analysis, T.S.; Funding acquisition, S.J.; Investigation, T.B.J., S.R. and S.J.; Methodology, T.S. and T.B.J.; Project administration, S.J.; Resources, S.R.; Supervision, T.B.J., S.R. and S.J.; Validation, T.B.J.; Writing—original draft, T.S.; Writing—review and editing, T.B.J. and S.J. All authors have read and agreed to the published version of the manuscript.

Funding

The Research was funded by National Academy of Sciences, India, grant number NASI/234/10/2020. APC was not funded.

Data Availability Statement

All data have been presented in the paper.

Acknowledgments

SJ is thankful to the National Academy of Sciences (NASI, Allahabad, India) for award of Senior Scientist Platinum Jubilee fellowship. We are grateful to SR Yadav and M.M. Lekhak, Shivaji University, Kolhapur, NS Shekhawat, Jodhpur University and S Rama Rao, NEHU, Shillong, for help in collection of plant materials. Authors thank Mihir Halder and Sayantika Sarkar for technical help.

Conflicts of Interest

The authors declare no conflict of interest.

References

  1. Angiosperm Phylogeny Group. An update of the Angiosperm Phylogeny Group classification for the orders and families of flowering plants: APG III. Bot. J. Linn. Soc. 2009, 161, 105–121. [Google Scholar] [CrossRef] [Green Version]
  2. Speta, F. Systematische Analyse der Gattung Scilla L. s.l. (Hyacinthaceae). Phyton 1998, 38, 1–141. [Google Scholar]
  3. Pfosser, M.; Speta, F. Phylogenetics of Hyacinthaceae based on plastid DNA sequences. Ann. Mo. Bot. Gard. 1999, 86, 852–875. [Google Scholar] [CrossRef]
  4. Manning, J.C.; Goldblatt, P.; Fay, M.F. A revised generic synopsis of Hyacinthaceae in sub-Saharan Africa based on molecular evidence, including new combinations and the new tribe Pseudoprospereae. Edinb. J. Bot. 2004, 60, 533–568. [Google Scholar] [CrossRef]
  5. Martínez-Azorín, M.; Crespo, M.B.; Juan, A.; Fay, M.F. Molecular phylogenetics of subfamily Ornithogaloideae (Hyacinthaceae) based on nuclear and plastid DNA regions, including a new taxonomic arrangement. Ann. Bot. 2011, 107, 1–37. [Google Scholar] [CrossRef] [PubMed] [Green Version]
  6. Nath, S.; Saha, P.S.; Jha, S. Medicinal bulbous plants: Biology, phytochemistry and biotechnology. In Bulbous Plants Biotechnology; Ramawat, K.G., Mérillon, J.M., Eds.; CRC Press Inc.: Boca Raton, FL, USA, 2013; pp. 338–369. [Google Scholar] [CrossRef]
  7. Jha, S. Bufadienolides. In Phytochemicals in Plant Cell Cultures; Vasil, I.K., Ed.; Academic Press: Cambridge, MA, USA, 1988; pp. 179–191. [Google Scholar]
  8. Mulholland, D.A.; Schwikkard, S.L.; Crouch, N.R. The chemistry and biological activity of the Hyacinthaceae. Nat. Prod. Rep. 2013, 30, 1165–1210. [Google Scholar] [CrossRef] [Green Version]
  9. Kamboj, A.; Rathour, A.; Kaur, M. Bufadienolides and their medicinal utility: A review. Int. J. Pharm. Pharm. Sci. 2013, 5, 20–27. [Google Scholar]
  10. Azizi, N.; Amirouche, R.; Amirouche, N. Cytotaxonomic diversity of some medicinal species of Hyacinthaceae from Algeria. Pharmacogn. Commn. 2016, 6, 34–38. [Google Scholar] [CrossRef] [Green Version]
  11. Pohl, T.S.; Crouch, N.R.; Mulholland, D.A. Southern African Hyacinthaceae chemistry, bioactivity and ethnobotany. Curr. Org. Chem. 2000, 4, 1287–1324. [Google Scholar] [CrossRef]
  12. Jehan, T.; Vashistha, A.; Yadav, S.R.; Lakhanpaul, S. Genetic diversity and genetic relationships in Hyacinthaceae in India using RAPD and SRAP markers. Physiol. Mol. Biol. Plants. 2014, 20, 103–114. [Google Scholar] [CrossRef] [Green Version]
  13. Manning, J.C.; Forest, F.; Devey, D.S.; Fay, M.F.; Goldblatt, P. A molecular phylogeny and a revised classification of Ornithogaloideae (Hyacinthaceae) based on an analysis of four plastid DNA regions. Taxon 2009, 58, 77–107. [Google Scholar] [CrossRef]
  14. Gosavi, K.V.C.; Yadav, U.S.; Janarthanam, M.K.; Yadav, S.R. Karyomorphological analysis of recently described rare species of Dipcadi Medik. (Hyacinthaceae) from Northern Western Ghats. Cytologia 2011, 76, 63–66. [Google Scholar] [CrossRef] [Green Version]
  15. Deb, D.B.; Dasgupta, S. Liliaceae: Tribe-Scilleae. In Fascicles of Flora of India; Botanical Survey of India, Botanic Garden: Howrah, India, 1981; Volume 7, pp. 2–11. [Google Scholar]
  16. Karthikeyan, S.; Jain, S.K.; Nayar, M.P.; Sanjappa, M. Florae Indicae Enumeratio: Monocotyledons; BSI: Kolkata, India, 1989. [Google Scholar]
  17. Patil, S. A note on the occurrence and distribution of Dipcadi concanense (Hyacinthaceae). Nelumbo 2015, 57, 60–63. [Google Scholar] [CrossRef]
  18. Rawat, D.S.; Chandra, S. Presumed extinct Dipcadi reidii (Asparagaceae) recollected after 127 years from Uttarakhand, India. Rheedea 2014, 24, 1–4. [Google Scholar]
  19. Prabhugaonkar, A.; Yadav, U.S.; Janarthanam, M.K. Dipcadi goaense (Hyacinthaceae), a new species from the foothills of the Western Ghats, India. Kew Bull. 2009, 64, 743–746. [Google Scholar] [CrossRef]
  20. Deshpandey, A.S.; Krishnan, S.; Janarthanam, M.K. Systematic position of two endemic Dipcadi spp. (Asparagaceae) from northern Western Ghats of India using molecular markers. Rheedea 2015, 25, 97–102. [Google Scholar]
  21. Moussaid, M.; Elamrani, A.; Bourhim, N.; Benaissa, M. Contribution to the study of the essential oil of Dipcadi serotinum (L.) Medik. of Morocco. Afr. Sci. Revue Int. Sci. Technol. 2013, 9, 34–42. [Google Scholar]
  22. El-Shabrawy, M.O.; Marzouk, M.M.; Kawashtya, S.A.; Hosni, H.; El-Garf, I.; Saleh, N.A.M. Flavonoid constituents of Dipcadi erythraeum Webb. & Berthel. Asian Pac. J. Trop. Dis. 2016, 6, 404–405. [Google Scholar] [CrossRef]
  23. Adly, F.; Moussaid, M.; Berhal, C.; Razik, A.; Elamrani, A.A.; Moussaid, H.; Bourhim, N.; Loutfi, M. Phytochemical screening and biological study of ethanol extractives of Dipcadi serotinum (L.) Medik. EJARBLS 2015, 3, 17–23. [Google Scholar]
  24. Marzouk, M.M.; Elkhateeb, A.; Latif, R.R.A.; Abdel-Hameed, E.S.; Kawashty, S.A.; Hussein, S.R. C-glycosyl flavonoids-rich extract of Dipcadi erythraeum Webb & Berthel. bulbs: Phytochemical and anticancer evaluations. J. App. Pharm. Sci. 2019, 9, 94–98. [Google Scholar] [CrossRef] [Green Version]
  25. Nath, S.; Sarkar, S.; Patil, S.D.; Saha, S.S.; Lekhak, M.M.; Ray, S.; Rao, S.R.; Yadav, S.R.; Verma, R.C.; Dhar, M.K.; et al. Cytogenetic diversity in Scilloideae (Asparagaceae): A comprehensive recollection and exploration of karyo-evolutionary trends. Bot. Rev. 2023, 89, 158–200. [Google Scholar] [CrossRef]
  26. Goldblatt, P.; Manning, J.C. A review of chromosome cytology in Hyacinthaceae subfamily Ornithogaloideae (Albuca, Dipcadi, Ornithogalum and Pseudogaltonia) in sub-Saharan Africa. S. Afr. J. Bot. 2011, 77, 581–591. [Google Scholar] [CrossRef] [Green Version]
  27. Mahabale, T.S.; Chennaveeraiah, M.S. Karyotype in Dipcadi Medik. Curr. Sci. 1954, 23, 367–368. [Google Scholar]
  28. Kanmani, B.N. Karyotype study in Dipcadi concanense Dalz. Curr. Sci. 1975, 44, 278–279. [Google Scholar]
  29. Dixit, G.B.; Yadav, S.R.; Patil, K.S. Cytological studies in Dipcadi concanense (Dalz.) Baker. J. Cytol. Genet. 1992, 27, 91–94. [Google Scholar]
  30. Rawat, D.; Sharma, S.K.; Mahmoudi, A.; Rao, S.R. Cytogenetic rationale for probable amphidiploid origin of Dipcadi erythraeum Webb. & Berth.—A rare and endemic plant of Indian Thar desert. Caryologia 2011, 64, 75–83. [Google Scholar] [CrossRef] [Green Version]
  31. Jakhi, P.S.; Desai, N.S.; Dixit, G.B. Karyogical studies in Dipcadi erythraeum. J. Cytol. Genet. 1994, 29, 89–93. [Google Scholar]
  32. Naik, V.N. Cytological studies in two species of Dipcadi Medic. from India. Cytologia 1974, 39, 591–596. [Google Scholar] [CrossRef] [Green Version]
  33. Rejón, M.R.; Rejón, C.R.; Pascual, L. The chromosome system of Dipcadi serotinum (Liliaceae): A natural species with unusual cytogenetic characteristics. Caryologia 1981, 34, 419–426. [Google Scholar] [CrossRef]
  34. Fukui, K. Plant chromosomes at mitosis. In Plant Chromosomes: Laboratory Methods; Fukui, K., Nakayama, S., Eds.; CRC Press: Boca Raton, CA, USA, 1996; pp. 1–17. [Google Scholar]
  35. Jha, T.B. Karyotype diversity in cultivated and wild Indian rice through EMA-based chromosome analysis. J. Genet. 2021, 100, 81. [Google Scholar] [CrossRef] [PubMed]
  36. Schweizer, D. Reverse fluorescent chromosome banding with chromomycin and DAPI. Chromosoma 1976, 58, 307–324. [Google Scholar] [CrossRef]
  37. Nath, S.; Jha, T.B.; Mallick, S.K.; Jha, S. Karyological relationships in Indian species of Drimia based on fluorescent chromosome banding and nuclear DNA amount. Protoplasma 2015, 252, 283–299. [Google Scholar] [CrossRef]
  38. Saha, P.S.; Jha, S. A molecular phylogeny of the genus Drimia (Asparagaceae: Scilloideae: Urgineeae) in India inferred from non-coding chloroplast and nuclear ribosomal DNA sequences. Sci. Rep. 2019, 9, 7563. [Google Scholar] [CrossRef] [Green Version]
  39. Levan, A.; Fredga, K.; Sandberg, A.A. Nomenclature for centromeric position on chromosomes. Hereditas 1964, 52, 201–220. [Google Scholar] [CrossRef]
  40. Mitrenina, E.; Erst, A.; Peruzzi, L.; Skaptsov, M.; Ikeda, H.; Nikulin, V.; Wang, W. Karyotype and genome size variation in white-flowered Eranthis sect. Shibateranthis (Ranunculaceae). PhytoKeys 2021, 187, 207–227. [Google Scholar] [CrossRef] [PubMed]
  41. Barros e Silva, A.E.; Guerra, M. The meaning of DAPI bands observed after C-banding and FISH procedures. Biotech. Histochem. 2010, 85, 115–125. [Google Scholar] [CrossRef] [PubMed]
  42. Schneeweiss, H.W.; Schneeweiss, G.M. Karyotype diversity and evolutionary trends in Angiosperms. In Plant Genome Diversity; Greilhuber, J., Doležel, J., Wendel, J.F., Eds.; Springer: Vienna, Austria, 2013; Volume 2, pp. 209–230. [Google Scholar]
  43. Winterfeld, G.; Becher, H.; Voshell, S.; Hilu, K.; Röser, M. Karyotype evolution in Phalaris (Poaceae): The role of reductional dysploidy, polyploidy and chromosome alteration in a wide-spread and diverse genus. PLoS ONE 2018, 13, e0192869. [Google Scholar] [CrossRef] [Green Version]
  44. Wen-Guang, S.; Hang, S.; Zhi-Min, L. Chromosome data mining and its application in plant diversity research. Plant Sci. J. 2019, 37, 260–269. [Google Scholar] [CrossRef]
  45. Knytl, M.; Fornaini, N.R. Measurement of chromosomal arms and FISH reveal complex genome architecture and standardized karyotype of model fish, genus Carassius. Cells 2021, 10, 2343. [Google Scholar] [CrossRef]
  46. Deanna, R.; Acosta, M.C.; Scaldaferro, M.; Chiarini, F. Chromosome Evolution in the Family Solanaceae. Front. Plant Sci. 2022, 12, 787590. [Google Scholar] [CrossRef]
  47. Carta, A.; Escudero, M. Karyotypic diversity: A neglected trait to explain angiosperm diversification? Evolution 2023, 77, 1158–1164. [Google Scholar] [CrossRef] [PubMed]
  48. Knytl, M.; Fornaini, N.R.; Bergelov, B.; Gvoždík, V.; Cernohorskà, H.; Kubíckova, S.; Fokam, E.B.; Evans, B.J.; Krylov, V. Divergent subgenome evolution in the allotetraploid frog Xenopus calcaratus. Gene 2023, 851, 146974. [Google Scholar] [CrossRef]
  49. Guerra, M. Cytotaxonomy: The end of childhood. Plant Biosyst. 2012, 146, 703–710. [Google Scholar] [CrossRef]
  50. Guerra, M. Reviewing the chromosome nomenclature of Levan et al. Genet. and Mol. Biol. 1986, 9, 741–743. [Google Scholar]
  51. Rawat, D.S. Dipcadi Medik. (Liliaceae): A disappearing genus in India. Natl. Acad. Sci. Lett. USA 2009, 32, 211–212. [Google Scholar]
  52. Guerra, M. Chromosome number in plant cytotaxonomy: Concepts and implications. Cytogenet. Genome Res. 2008, 120, 339–350. [Google Scholar] [CrossRef] [PubMed]
  53. Lima-De-Faria, A. The chromosome fields: I. Prediction of the location of ribosomal cistrons. Hereditas 1976, 83, 1–22. [Google Scholar] [CrossRef]
  54. Heslop-Harrison, J.S.; Schwarzacher, T. The plant genome: An evolutionary view on structure and function; Organisation of the plant genome in chromosomes. Plant J. 2011, 66, 18–33. [Google Scholar] [CrossRef] [PubMed]
  55. Guerra, M. Patterns of heterochromatin distribution in plant chromosomes. Genet. Mol. Biol. 2000, 23, 1029–1041. [Google Scholar] [CrossRef]
  56. Marques, A.; Fuchs, J.; Ma, L.; Heckmann, S.; Guerra, M.; Houben, A. Characterization of eu-and heterochromatin of Citrus with a focus on the condensation behavior of 45S rDNA chromatin. Cytogenet. Genome Res. 2011, 134, 72–82. [Google Scholar] [CrossRef]
  57. Eriksson, S.; Kim, S.K.; Kubista, M.; Norden, B. Binding of 4’,6-diamidino-2-phenylindole (DAPI) to AT regions of DNA: Evidence for an allosteric conformational change. Biochemistry 1993, 32, 2987–2998. [Google Scholar] [CrossRef]
  58. Roa, F.; Guerra, M. Distribution of 45S rDNA sites in chromosomes of plants: Structural and evolutionary implications. BMC Evol. Biol. 2012, 12, 225. [Google Scholar] [CrossRef] [PubMed] [Green Version]
  59. Vanzela, A.L.L.; Cuadrado, A.; Guerra, M. Localization of 45S rDNA and telomeric sites on holocentric chromosomes of Rhyncospora tenuis Link (Cyperaceae). Genet. Mol. Biol. 2003, 26, 199–201. [Google Scholar] [CrossRef] [Green Version]
  60. Yamamoto, M.; Tominaga, S. Chromosome identification in haploid clementine (Citrus clementina hort. ex. Tanaka) by fluorescent staining. Sci Hortic. 2004, 101, 201–206. [Google Scholar] [CrossRef]
  61. Yamamoto, M.; Abkenar, A.A.; Matsumoto, R.; Kubo, T.; Tominaga, S. CMA staining analysis of chromosomes in several species of Aurantioideae. Genet. Resour. Crop Evol. 2008, 55, 1167–1173. [Google Scholar] [CrossRef]
  62. Alam, S.S.; Jahan, N.; Habib, M.A.; Islam, M.N. Cytogenetical and molecular characterization of five commercial varieties in Trichosanthes anguina L. Cytologia 2012, 77, 155–162. [Google Scholar] [CrossRef] [Green Version]
  63. Bareka, P.; Siljak-Yakovlev, S.; Kamari, G. Molecular cytogenetics of Bellevalia (Hyacinthaceae) species occurring in Greece. Plant Syst. Evol. 2012, 298, 421–430. [Google Scholar] [CrossRef]
  64. Kuroki, Y.; Shibata, F.; Hizume, M. Chromosome bandings and signal pattern of FISH using rDNAs in Bellevalia romana. Cytologia 2013, 78, 399–401. [Google Scholar] [CrossRef] [Green Version]
  65. Cunado, N.; Herrán, R.D.L.; Santos, J.L.; Rejón, C.R.; Garrido-Ramos, M.A.; Rejón, M.R. The evolution of the ribosomal loci in the subgenus Leopoldia of the genus Muscari (Hyacinthaceae). Plant Syst. Evol. 2000, 221, 245–252. [Google Scholar] [CrossRef]
  66. Rejon, C.R.; Lozano, R.; Rejon, M.R. A cytogenetic analysis of the chromosomes in two related species of the genus Muscari (Liliaceae). Genome 2011, 33, 729–732. [Google Scholar] [CrossRef]
  67. Herrán, R.D.L.; Cunado, F.R.N.; Santos, J.L.; Rejón, M.R.; Garrido-Ramos, M.A.; Rejón, C.R. A heterochromatic satellite DNA is highly amplified in a single chromosome of Muscari (Hyacinthaceae). Chromosoma 2001, 110, 197–202. [Google Scholar] [CrossRef]
  68. Hamatani, S.; Tagashira, N.; Kondo, K. Molecular cytogenetic analysis in seven species of Lachenalia (Liliaceae) with chromosome numbers of 2n = 18, 22, 23,26, and 28 by DAPI staining and FISH using 5S rDNA and 18S rDNA probes. Chromosome Bot. 2010, 5, 55–59. [Google Scholar] [CrossRef] [Green Version]
  69. Hamatani, S.; Masuda, Y.; Uchida, M.; Tagashira, N.; Kusaba, M.; Kondo, K. Molecular cytogenetical and phylogenetical studies of Lachenalia congesta (Asparagaceae). Chromosome Bot. 2012, 7, 47–52. [Google Scholar] [CrossRef] [Green Version]
  70. Pedrosa, A.; Jantsch, M.F.; Moscone, E.A.; Ambros, P.F.; Schweizer, D. Characterisation of pericentromeric and sticky intercalary heterochromatin in Ornithogalum longibracteatum (Hyacinthaceae). Chromosoma 2001, 110, 203–213. [Google Scholar] [CrossRef] [PubMed]
  71. Astuti, G.; Roma-Marzio, F.; Peruzzi, L. Traditional karyomorphological studies: Can they still provide a solid basis in plant systematics? Flora Mediterr. 2017, 27, 91–98. [Google Scholar]
  72. Mraz, P.; Filipas, L.; Bărbos, M.I.; Kadlecova, J.; Paštova, L.; Belyayev, A.; Fehrer, J. An unexpected new diploid Hieracium from Europe: Integrative taxonomic approach with a phylogeny of diploid Hieracium taxa. Taxon 2019, 68, 1258–1277. [Google Scholar] [CrossRef]
  73. Erst, A.S.; Sukhorukov, A.P.; Mitrenina, E.Y.; Skaptsov, M.V.; Kostikova, V.A.; Chernisheva, O.A.; Troshkina, V.I.; Kushunina, M.A.; Krivenko, D.A.; Ikeda, H.; et al. An integrative taxonomic approach reveals a new species of Eranthis (Ranunculaceae) in North Asia. PhytoKeys 2020, 140, 75–100. [Google Scholar] [CrossRef]
  74. Jha, T.B.; Bhowmick, B.K. Unraveling the genetic diversity and phylogenetic relationships of Indian Capsicum through fluorescent banding. Genet. Resour. Crop Evol. 2021, 68, 205–225. [Google Scholar] [CrossRef]
  75. Baltisberger, M.; Widmer, A. Chromosome numbers and karyotypes within the Ranunculus alpestris-group (Ranunculaceae). Org. Divers. Evol. 2009, 9, 232–243. [Google Scholar] [CrossRef] [Green Version]
  76. Jha, T.B.; Bhowmick, B.; Roy, P. Analysis of CMA-DAPI bands and preparation of fluorescent karyotypes in thirty Indian cultivars of Lens culinaris. Caryologia 2021, 74, 65–77. [Google Scholar] [CrossRef]
Table 1. Collection details, somatic chromosome number and total chromosome Length (TCL) in different populations of Indian species of Dipcadi.
SpeciesPopulationSite of
Collection
Geographic DetailsChromosome Number (2n)TCL
(Mean ± µm) *
D. concanenseDcon1Rajapur,
Maharashtra
16.6571° N, 73.5211° E1285.68 ± 0.53 b
Dcon2Ratnagiri,
Maharashtra
16.9902° N, 73.3120° E1286.20 ± 0.71 b
D. goaenseDgoa1Quepem District, South Goa15.2282° N, 74.0647° E1281.98 ± 0.72 a
D. ursulaeDurs1Thosegar,
Maharashtra
17.6031° N, 73.8478° E20110.58 ± 1.38 c
Durs2Panhala,
Maharashtra
16.8107° N, 74.1181° E20117.00 ± 0.87 f
Durs3Satara,
Maharashtra
17.6805° N, 74.0183° E20118.08 ± 1.00 g
D. montanumDmon1Ajara,
Maharashtra
16.1159° N, 74.2106° E20118.84 ± 0.43 g
Dmon2Badami,
Karnataka
15.9186° N, 75.6761° E20112.00 ± 0.64 d
D. erythraeumDery1Jaisalmer,
Rajasthan
26.9157° N, 70.9083° E22112.24 ± 0.43 d
Dery2Jodhpur,
Rajasthan
26.2389° N, 73.0243° E22113.30 ± 0.98 e
* Values followed by same letter are not significantly different; according to Duncan’s test (p = 0.05).
Table 2. Chromosome morphometric data generated through EMA-Giemsa staining in the five Indian species of Dipcadi.
Species &
Population
Absolute Length of Longest Chromosome (Mean ± SD in µm) *Absolute Length of Shortest Chromosome (Mean ± SD in µm) *ACL (Mean ± SD in µm) *No. of SAT Chromosome & Ordering No. of SAT Bearing PairDiploid Karyotype FormulaDiagrammatic Representation of Karyotype (Haploid Set)
D. concanense (Dalzell) Baker 2n = 12Dcon111.25 ± 0.30 b3.10 ± 0.20 u7.15 ± 0.40 z2 (3rd pair)4st + 6sm + 2st.tPlants 12 02534 i001
Dcon211.14 ± 0.45 b3.19 ± 0.14 u7.18 ± 0.31 z
D. goaense
Prabhug.
2n = 12
Dgoa110.93 ± 1.36 b3.05 ± 0.47 u6.83 ± 0.81 yz2 (2nd pair)4st + 6sm + 2st.tPlants 12 02534 i002
D. montanum (Dalzell) Baker
2n = 20
Dmon111.79 ± 0.87 b2.35 ± 0.18 st5.94 ± 0.55 xy4 (9th & 10th pair)6sm + 4t + 4m + 2st + 4sm.tPlants 12 02534 i003
Dmon211.66 ± 0.68 b2.40 ± 0.15 t5.60 ± 0.54 x
D. ursulae Blatt.
2n = 20
Durs111.29 ± 1.66 b2.01 ± 0.29 qr5.52 ± 0.86 x4 (3rd & 9th pair)6sm + 4st + 4t + 2m + 4st.tPlants 12 02534 i004
Durs211.54 ± 0.32 b2.05 ± 0.22 qr5.85 ± 0.92 xy
Durs311.79 ± 0.87 b2.01 ± 0.28 qr5.90 ± 0.74 xy
D. erythraeum Webb & Berthel.
2n = 22
Dery17.88 ± 1.02 a1.66 ± 0.20 p5.10 ± 1.05 x2 (3rd pair)12st + 2t + 6sm + 2st.tPlants 12 02534 i005
Dery27.93 ± 1.58 a1.72 ± 0.16 pq5.15 ± 0.75 x
* Values followed by the same letter are not significantly different; according to Duncan’s test (p = 0.05).
Table 3. A brief typification of CMA and DAPI fluorescent bands observed in somatic chromosomes of five Indian species of Dipcadi.
Major Band/Signal Types Based on CMA/DAPI StainingSub-Types Based on Position of Bands/Signals on ChromosomesPosition of Bands/Signal(s) on
Chromosome Arms
Diagrammatic RepresentationSpecies Name
Type A CMA0/DAPI0ANo distinct signalPlants 12 02534 i006In all species
Type B CMA+ve/DAPI−veB1Short arm, distal to constrictionPlants 12 02534 i007D. concanense,
D. goaense
B2Centromeric regionPlants 12 02534 i008D. ursulae
B3NucleolarPlants 12 02534 i009D. concanense,
D. goaense
Nucleolar, extended to terminal satellitePlants 12 02534 i010D. ursulae
Nucleolar, extended to short arm and
terminal satellite
Plants 12 02534 i011D. montanum,
D. ursulae
B4Short arm and
terminal satellite
Plants 12 02534 i012D. montanum
Type C CMA+ve/DAPI0CNucleolar, extended to short arm and
terminal satellite
Plants 12 02534 i013D. erythraeum *
Type D DAPI+ve/CMA−veD1Long arm, interstitial, 1–3 in numberPlants 12 02534 i014D. montanum,
D. ursulae
D2Long arm, DistalPlants 12 02534 i015D. montanum
Type E DAPI+ve/CMA0E1Short arm,
interstitial
Plants 12 02534 i016D. erythraeum *
E2Long arm, proximal to constrictionPlants 12 02534 i017D. erythraeum
E3Long arm,
interstitial, 2 in number (2 bands)
Plants 12 02534 i018D. erythraeum
E4Both arms, interstitial, 3 in numberPlants 12 02534 i019D. erythraeum
[Light yellow and light blue line diagrams represent CMA and DAPI-stained chromosome arms, respectively. The fluorescent green bands indicate CMA+ve signals on CMA-stained chromosomes. The dark blue bands indicate DAPI+ve signals on DAPI-stained chromosome arms, respectively. * Chromosome pair in D. erythraeum showing both CMA+ve (C type) and DAPI+ve (E1 type) signals].
Table 4. CMA and DAPI fluorescent banding patterns somatic chromosomes of five Indian species of Dipcadi.
Sl. No.Species &
Chromosome Number
Order of
Nucleolar Pair
CMA+ve BandsDAPI+ve BandsTotal No. CMA+ve & DAPI+ve Bands/2nFluorescent
Karyotype (2n) *
No.Chromosome Pair (p)/Single (s)TypeNo.Chromosome Pair (p)/Single (s)Type
1.D. concanense
(2n = 12)
3rd21st (p)B1Nil----48A + 4B
23rd (p)B3
2.D. goaense
(2n = 12)
2nd21st (p)B1Nil----48A + 4B
22nd (p)B3
3.D. montanum
(2n = 20)
9th
10th
29th (p)B362nd (p)D1208A + 4B + 8D
210th (p)B463rd (p)D1
24th (p)D1
25th (p)D2
4.D. ursulae
(2n = 20)
3rd
9th
23rd (p)B331st (s)D11310A + 4B + 2B/D + 4D
28th (p)B233rd (s)D3
29th (p)B314th (s)D1
5.D. erythraeum
(2n = 22)
3rd23rd (p)C62nd (p)E4288A + 2C/E+12E
23rd (p)E1
4 + 14th (2p + 1s)E4
4 + 15th (2p + 1s)E4
46th (p)E3
27th (p)E2
28th (p)E1
* Type A (CMA0/DAPI0), Type B (CMA+ve/DAPI−ve), Type C (CMA+ve/DAPI0), Type D (DAPI+ve/CMA−ve), and Type E (DAPI+ve/CMA0).
Disclaimer/Publisher’s Note: The statements, opinions and data contained in all publications are solely those of the individual author(s) and contributor(s) and not of MDPI and/or the editor(s). MDPI and/or the editor(s) disclaim responsibility for any injury to people or property resulting from any ideas, methods, instructions or products referred to in the content.