Article

Analysis of the Differentially Expressed Proteins and Metabolic Pathways of Honeybush (Cyclopia subternata) in Response to Water Deficit Stress

by
Mary-Jane S. Mahlare
1,2,
Lizex Husselmann
3,
Muinat N. Lewu
1,*,
Cecilia Bester
1,
Francis B. Lewu
2,* and
Oluwafemi James Caleb
4,5,*
1
Agricultural Research Council (ARC) Infruitec-Nietvoorbij, Stellenbosch 7599, South Africa
2
Department of Agriculture, Faculty of Applied Sciences, Cape Peninsula University of Technology, Wellington Campus, Private Bag X8, Wellington 7654, South Africa
3
Department of Biotechnology, University of the Western Cape, Bellville 7535, South Africa
4
Africa Institute for Postharvest Technology, Faculty of AgriSciences, Stellenbosch University, Private Bag X1, Matieland 7602, South Africa
5
Department of Horticultural Science, Faculty of AgriSciences, Stellenbosch University, Matieland 7602, South Africa
*
Authors to whom correspondence should be addressed.
Plants 2023, 12(11), 2181; https://doi.org/10.3390/plants12112181
Submission received: 2 March 2023 / Revised: 10 May 2023 / Accepted: 13 May 2023 / Published: 31 May 2023
(This article belongs to the Section Plant Physiology and Metabolism)

Abstract

:
Honeybush (Cyclopia spp.) is a rich source of antioxidant properties and phenolic compounds. Water availability plays a crucial role in plant metabolic processes, and it contributes to overall quality. Thus, this study aimed to investigate changes in molecular functions, cellular components, and biological processes of Cyclopia subternata exposed to different water stress conditions, which include well-watered (as Control, T1), semi-water stressed (T2), and water-deprived (T3) potted plants. Samples were also collected from a well-watered commercial farm first cultivated in 2013 (T13) and then cultivated in 2017 (T17) and 2019 (T19). Differentially expressed proteins extracted from C. subternata leaves were identified using LC-MS/MS spectrometry. A total of 11 differentially expressed proteins (DEPs) were identified using Fisher’s exact test (p < 0.00100). Only α-glucan phosphorylase was found to be statistically common between T17 and T19 (p < 0.00100). Notably, α-glucan phosphorylase was upregulated in the older vegetation (T17) and downregulated in T19 by 1.41-fold. This result suggests that α-glucan phosphorylase was needed in T17 to support the metabolic pathway. In T19, five DEPs were upregulated, while the other six were downregulated. Based on gene ontology, the DEPs in the stressed plant were associated with cellular and metabolic processes, response to stimulus, binding, catalytic activity, and cellular anatomical entity. Differentially expressed proteins were clustered based on the Kyoto Encyclopedia of Genes and Genomes (KEGG), and sequences were linked to metabolic pathways via enzyme code and KEGG ortholog. Most proteins were involved in photosynthesis, phenylpropanoid biosynthesis, thiamine, and purine metabolism. This study revealed the presence of trans-cinnamate 4-monooxygenase, an intermediate for the biosynthesis of a large number of substances, such as phenylpropanoids and flavonoids.

1. Introduction

Honeybush is the general term used to classify all known types of Cyclopia species, a genus in the leguminous family [1]. It is native to the fynbos biome in the Western and Eastern Cape Provinces of South Africa, and its tea has a sweet, honey-like taste [2]. Cyclopia species are among the few wild plants that have been turned into commercial commodities in South Africa. Although 23 species grow in the wild, only a few are currently used to make tea, including C. subternata, C. intermedia, C. genistoides, C. maculata, C. longifolia, and C. sessiliflora [3,4]. The popularity of honeybush can also be attributed to its low tannin content, the absence of caffeine, and the presence of antioxidants. The tea from honeybush is usually enjoyed in its fermented state, although the unfermented (green) one is also marketed [5]. These herbal teas are famous for their rich organic antioxidant properties and phenolic compounds, which are helpful in treating colon, throat, and lung ailments, heartburn, ulcers, nausea, and urinary tract infections [6,7]. Polyphenols in the unfermented honeybush tea have been broadly perceived as having anti-cancerous properties [8,9].
Increasing awareness of the health benefits of Cyclopia species is one of the factors contributing to the market growth of the tea. Extracts of honeybush teas are also utilized in food and other aesthetic products [10]. During the last two decades, the export of South African honeybush has expanded due to an increase in demand. It is estimated that about 90% of the honeybush tea crop is exported, with the largest share to the Netherlands (±44%), Germany (±30%), United Kingdom (±8%), and the United States (±7%), while the remaining percentage is packaged for local consumption in South Africa [11,12].
Plants are continually exposed to biotic and abiotic stresses in their natural and agricultural environments, which can threaten their survival and growth [13]. Stressful conditions could result in delayed seed germination, reduced plant growth, and lower crop yield [14,15]. Furthermore, a water deficit could inhibit essential processes such as photosynthesis, respiration, and transpiration, thus restraining the growth and development of plants [16,17]. Lack of water can alter plant chemistry and negatively influence their growth by disrupting metabolic processes and pigment formation, thereby decreasing photosynthesis, and thus preventing food production [18,19,20]. Heat and water stress have the potential to compromise sustainable crop production on a global scale [21,22]. Plants can be affected by water stress in two different ways, drought (too little water) or waterlogging (too much water), which reduce oxygen in the soil and impair nutrient uptake [23,24].
There are numerous molecular programs in plants such as drought avoidance, drought tolerance, drought escape, proline accumulation, synthesis of proteomes, accumulation of osmolytes, and closure of stomatal conductance, which have evolved in response to these changes in available water. These molecular programs quickly detect and adapt to environmental changes and other stresses [3,25,26]. Plant proteins play a crucial role in both biotic and abiotic stress responses because they regulate physiological characteristics directly to adapt to changes in the environment. They are also crucial executors of cellular mechanisms and key players in cellular homeostasis [27]. The scarcity of genomic information has hampered crop proteomics applications. However, within the past decade and due to the advancement in analytical tools, the use of proteomics tools for crop plant analysis has amplified drastically. With the successful development of “next generation” sequencing technology, the identification and annotation of proteins and their isoforms in a specific crop species are becoming considerably easier [14].
Proteomics analysis aims to provide an inclusive profile of various proteins found in a specified organism in response to different biotic or abiotic stresses [3,28,29]. Plant resistance mechanisms [27,30,31], responses to water stress [32,33,34], and other exogenous stimuli [35] have been investigated using proteomics tools in several studies. For example, Haddoudi et al. [34] investigated the morpho-physiological, biochemical, and molecular responses to water deficit stress in four contrasting Medicago truncatula lines (TN6.18, JA17, TN1.11, and A10). The study showed that line TN6.18 was most resistant to water deficit stress with the highest root biomass production, a significantly higher increase in soluble sugar and its total protein contents, and lower levels of lipid peroxidation with greater cell membrane integrity. Furthermore, RT-qPCR revealed that the DREB1B gene had a higher induction rate in roots of TN6.18 and JA17 than in A10 roots. The authors suggested that DREB1B plays a key role in the water deficit tolerance of M. truncatula. However, there is a limited understanding of how potted and commercially farmed C. subternata plants would respond to induced/natural water stress at the proteomic level. Therefore, the aim of the present study was to compare the effect of water deficit stress on molecular functions, cellular components, and biological processes of potted and commercially farmed C. subternata plants. This study provides insights into the proteomic basis of drought tolerance mechanisms mediated by the key regulators.

2. Results

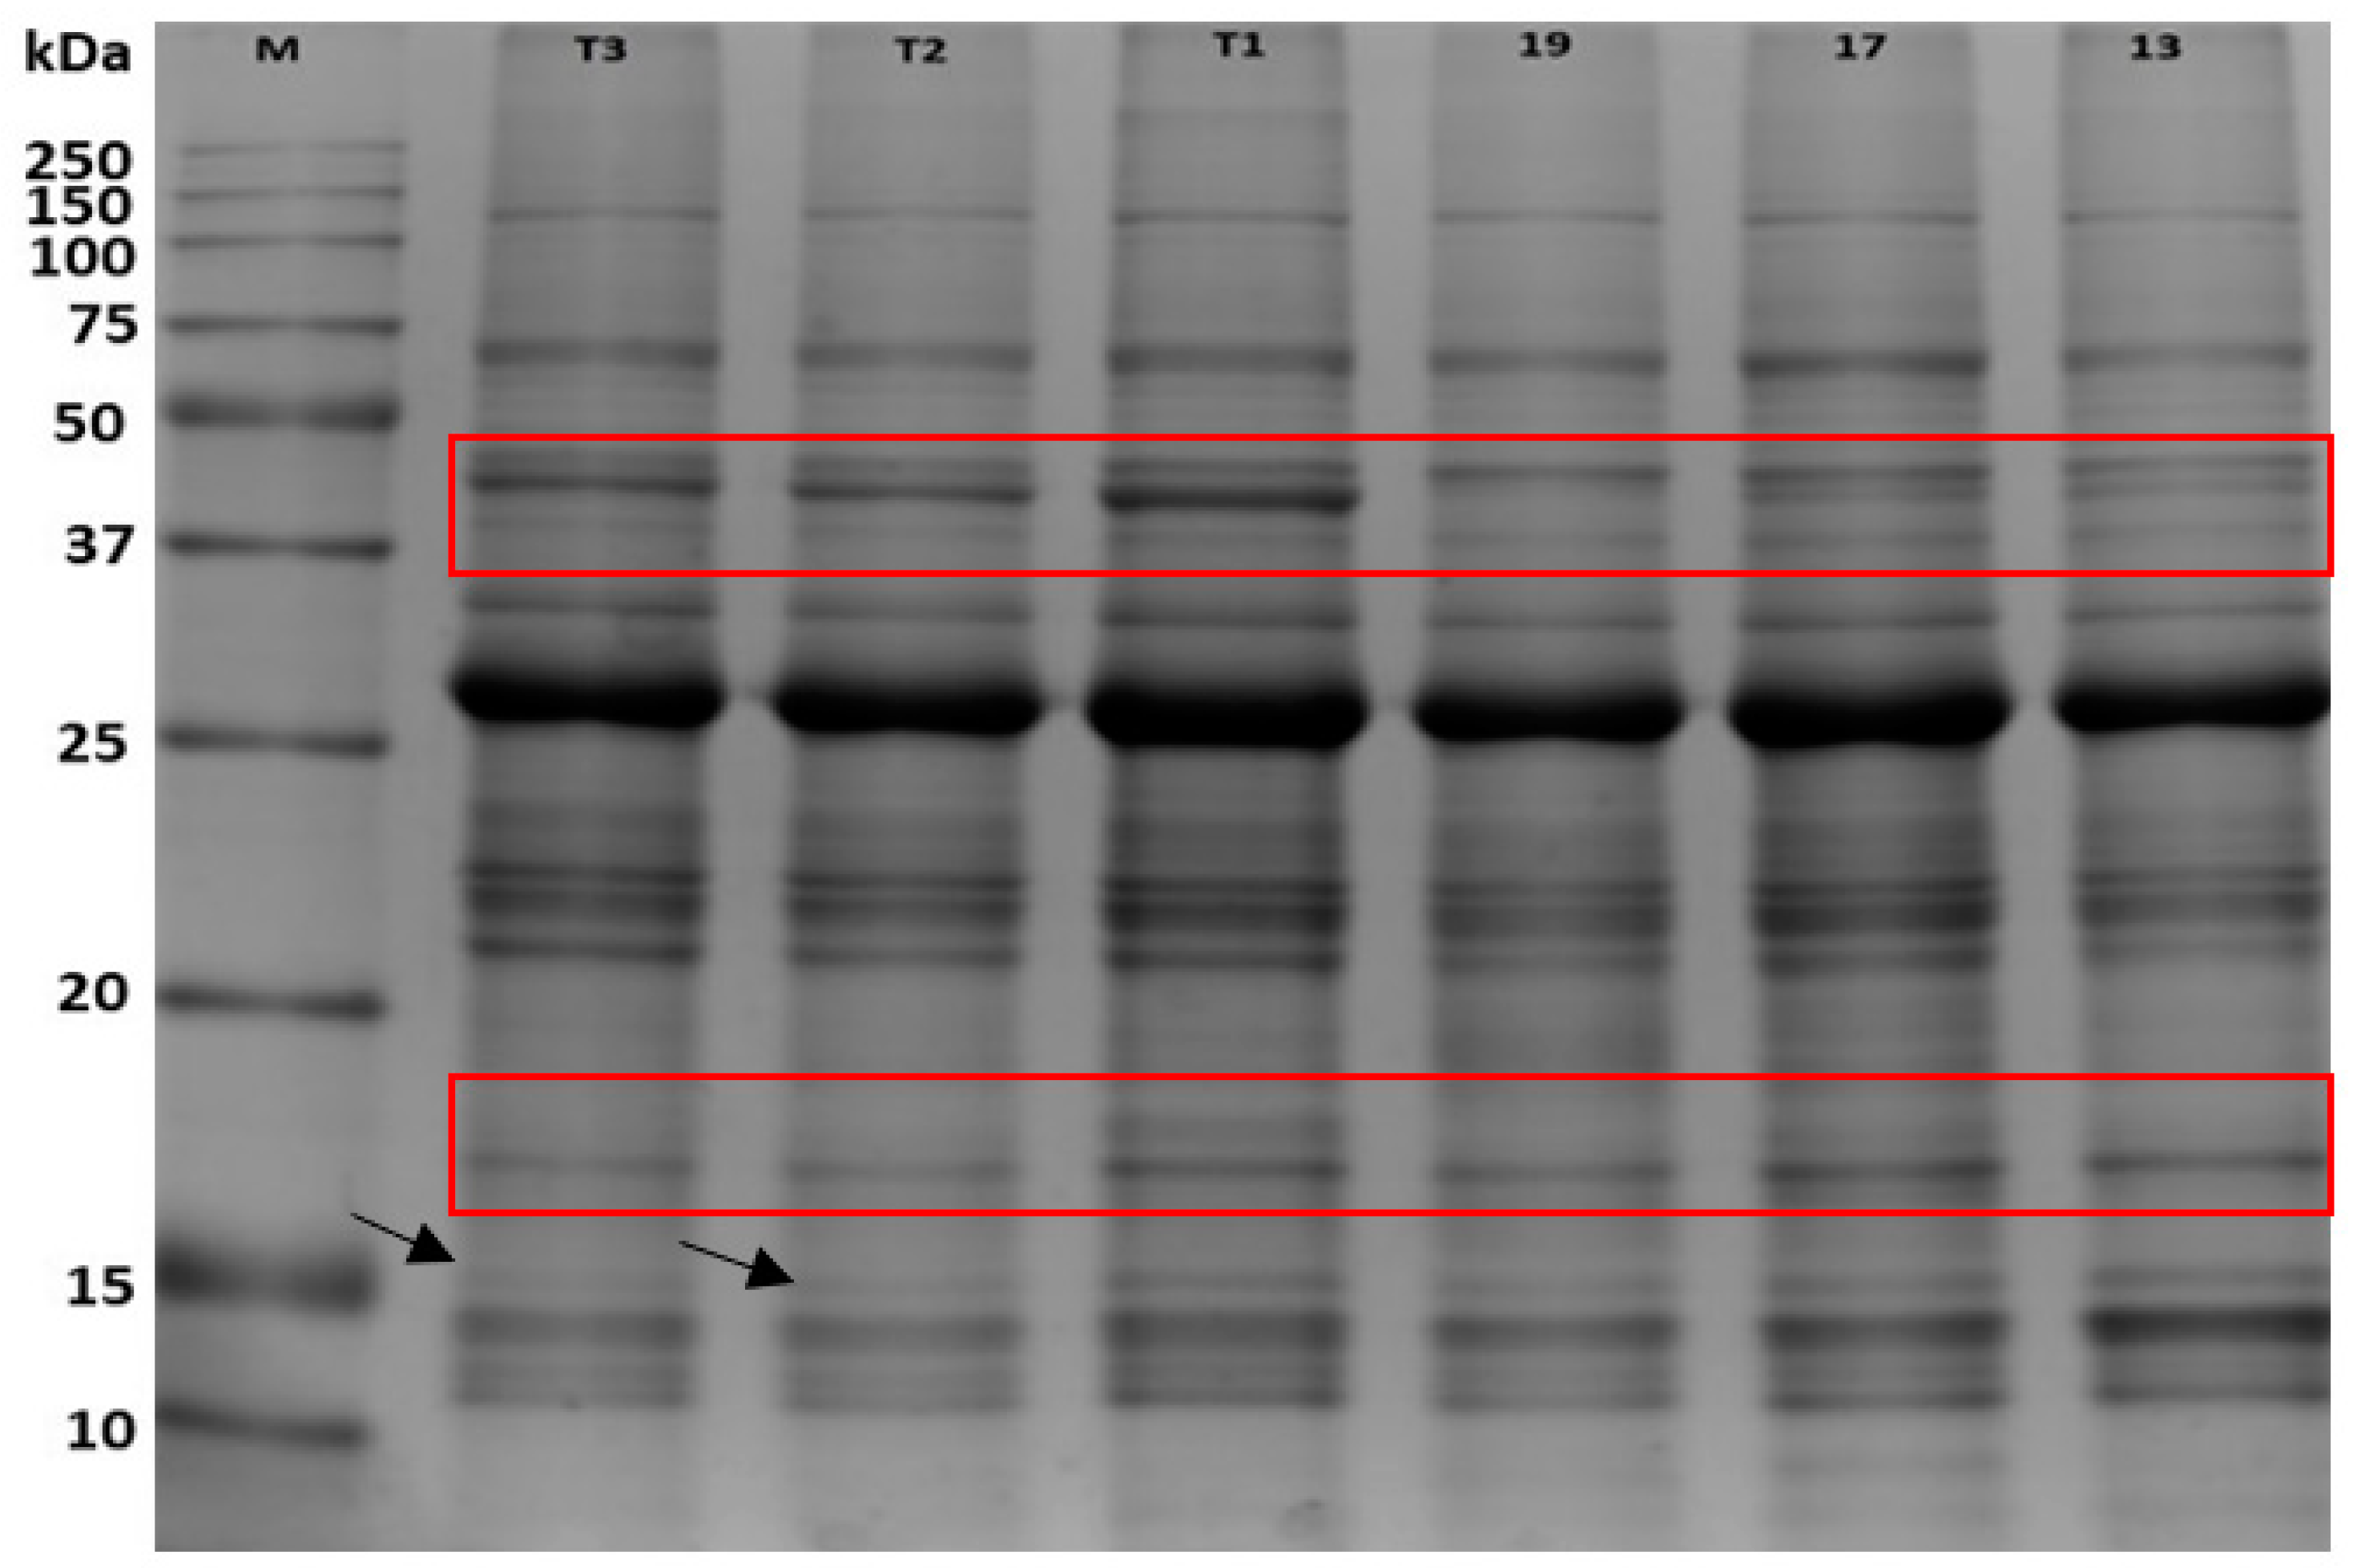
2.1. 1D-SDS-PAGE of C. subternata Protein Samples

One-dimensional gel electrophoresis showing the responses of C. subternata protein samples to different water stress levels is presented in Figure 1. Protein loading was relatively uniform, and no streaking of proteins was observed in the leaf protein extracts. The information integrates the molecular weight and the amount of protein extract per treatment. Protein bands from all treatments covered a molecular weight range of 10 to 150 kDa. The youngest commercial farm samples (T19) have a missing band between 37 and 50 kDa. In contrast, an extra protein that differentiates T1 and T17 from the other treatments was located between 15 and 20 kDa. Similarly, at 15 kDa, the two water-stressed potted plants had lower band intensity (Figure 1).

2.2. Identification of Induced Proteins in C. subternata Using LC-MS/MS Analysis

Based on known proteins, over 600 proteins were identified across all the treatments; however, after the four filter standards (Fisher’s exact test at p < 0.00100, peptide threshold (95%), protein threshold (1% false discovery rate (FDR), and a minimum of two peptides) used, the results showed that only 11 differentially expressed proteins (DEPs) were found to be significant (p < 0.00100). Table 1 presents significantly different proteins identified from stressed and well-watered treatments in C. subternata leaves. For example, a total number of 269 proteins were identified from the broad comparison of both well-watered C. subternata plants (T17 and T19) that were cultivated commercially. However, only one enzyme (α-glucan phosphorylase) was found to be statistically common between T17 and T19 (p < 0.00100) using Fisher’s exact test. Notably, the enzyme (α-glucan phosphorylase) was upregulated in T17 (older vegetation) and downregulated in T19 by 1.41-fold. This result suggests that α-glucan phosphorylase was produced less in T19 and more in T17 as needed.

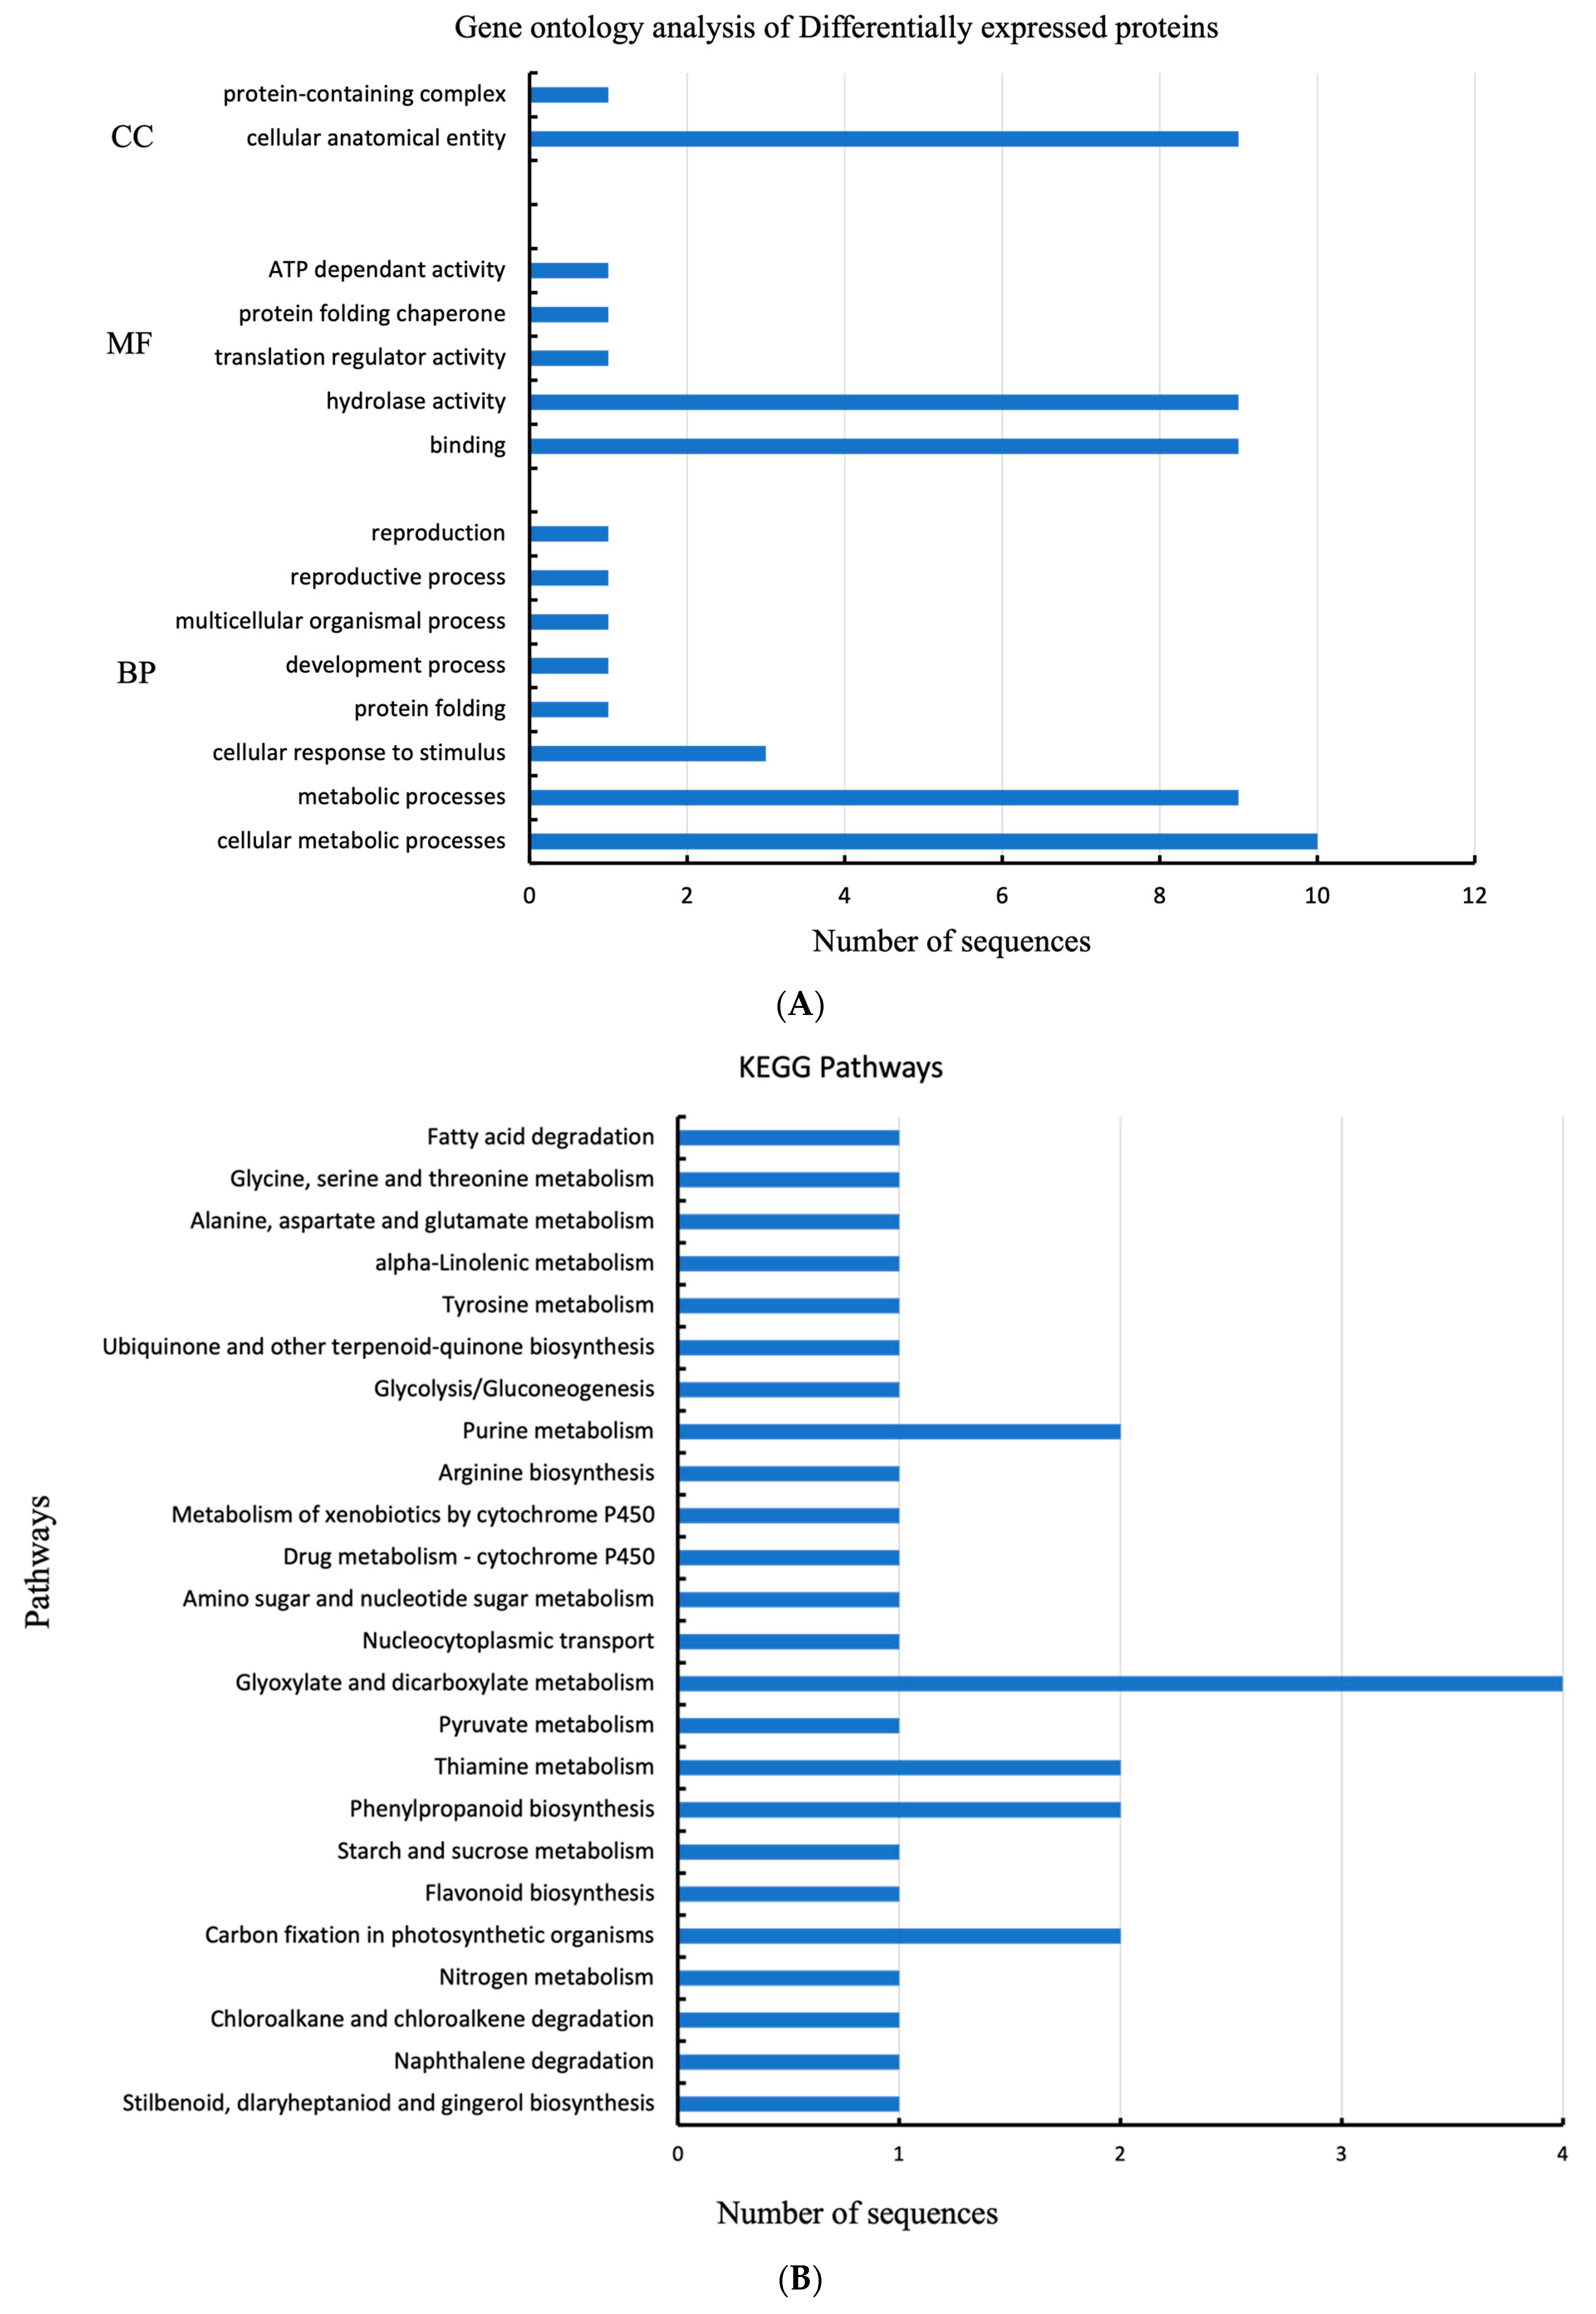
2.3. GO Analysis of Gene Ontology Enrichment

Differentially expressed proteins involved in combined water deficit with heat stress were mapped using Panther for gene ontology analysis (http://www.pantherdb.org, accessed on 22 August 2022). Based on the total number of proteins listed above in Table 1, the Panther analysis annotated into three categories of GO distribution by level 1, namely, biological process (BP), molecular function (MF), and cellular component (CC). The proteins involved in these activities include α-glucan phosphorylase, ribulose bisphosphate carboxylase, trans-cinnamate 4-monooxygenase, UDP-arabinopyranose mutase 1, cinnamyl alcohol dehydrogenase, glutamine synthetase nodule isozyme, elongation factor 1-α, and chlorophyll a-b binding protein. This was to improve the understanding of biological functions associated with water stress in C. subternata. Figure 2A summarizes the gene ontology distribution of proteins obtained from treated (water-stressed) and non-treated (well-watered) C. subternata leaf samples.

2.4. Kyoto Encyclopedia of Genes and Genomes (KEGG) Pathway Analysis

Proteins were mapped and assigned to different metabolic pathways according to the KEGG pathway database for a better understanding of the roles of DEPs in C. subternata leaves (Figure 2B). Sequences were linked to pathways via both enzyme code (EC) and KEGG ortholog (KO). According to the results of this study, a total of 30 sequences were associated with 24 KEGG pathways, where only five were differentially expressed. The KEGG pathway database was used to sort the identified metabolic pathways into major categories.

3. Discussion

3.1. 1D-SDS-PAGE and LC-MS/MS Analysis

Based on protein fragmentation via SDS-PAGE, similar banding patterns or fragmentation with varying abundance or intensity were observed across the different water treatments for C. subternata. However, as indicated by the intensity of the bands, the treated samples from the Nietvoorbij farm glasshouse (T1–T3) had greater protein abundance between 37 and 50 kDa compared with all other treatments (Figure 1). In contrast, band intensity at the lower molecular weight range between 10 and 15 kDa was more expressed in commercial farm samples (T13 to T19) than in other treatments. However, the youngest commercial farm samples (T19) have a missing band between 37 to 50 kDa, while T1 had the highest intensity in one of the bands within this range. In contrast, an extra protein that differentiates T1 and T17 from the other treatments was located between 15 and 20 kDa, but the intensity of this band also differed between the treatments. Similarly, at 15 kDa the two water-stressed potted plants had lower band intensity (Figure 1). The differences in fragmented protein abundance suggest that there were possible events of either up- or downregulation of various proteins within the molecular weight range [36].
According to Ubiparip et al. [37], α-glucan phosphorylases play an essential role in catalyzing reversible phosphorolysis and storing polysaccharides such as glycogen, starch, and maltodextrins. This could suggest that T17, which is the older plant, is well adapted for the storing of available/excess polysaccharides compared to the younger plants. The reason for the presence of α-glucan phosphorylase in these samples alone may be because they were irrigated at equal rates. Furthermore, the comparison of the total number of proteins identified between well-watered T1, cultivated in the glasshouse, and that well-watered and commercially farmed (T19) was 271. However, only four proteins (i.e., ribulose bisphosphate carboxylase large chain, (RubisCO), trans-cinnamate 4-monooxygenase, probable UDP-arabinopyranose mutase 1, and cinnamyl alcohol dehydrogenase) were found to be significantly common between both samples (p < 0.00100). The cluster of one RubisCO large subunit protein was found to be 2.41-fold higher in T1 than in T19. RubisCO is the key enzyme that facilitates the process of carbon fixation in the Calvin cycle. The fold increase under T1 (well-irrigated) could suggest that there was a higher photosynthetic carbon flux in the Calvin cycle under the glasshouse conditions. The results found in this study contradict those in the study by Haworth et al. [38] on olives, where heat stress stimulated a deterioration in photosynthesis with reduced RubisCO activity.
Furthermore, the downregulation of RubisCO subunits under T19 could suggest nitrogen deficiency in the leaf [39]. Abiotic stresses such as drought reduce the rate of photosynthesis by disturbing the cell homeostasis and affecting the photosynthetic pigments, soluble proteins, proteins in thylakoid membranes, the electron transport chain, photophosphorylation, and carbon dioxide (CO2) fixation [40]. During drought conditions, crop growth and yields are seriously impaired, and photosynthesis is hindered [41]. Based on the results obtained from T1 and T19 protein profiles, the impact of abiotic stress due to water deficit/stress could not be established. Probable cinnamyl alcohol dehydrogenase (CAD) was downregulated in T1 and upregulated in T19 by 1.06-fold. According to reports, cinnamyl alcohol dehydrogenase catalyzes the last stages of the production of monolignol [42]. Lignins are complex polymers that play a role in the alteration of biofuel and ensure good leaf quality in plants [43]. They also play an essential role in plant defense, mechanical support, and water retention [44]. Different plants have responded differently to CAD downregulation in terms of lignin content [43]. Therefore, the downregulation of CAD enzyme in this study may suggest that a low amount was needed in T1 (Nietvoorbij well-watered plants) compared to T19 (Napier commercial farm plants). The fold change in probable UDP-arabinopyranose mutase 1 was reported to be 1.07 times lower in T1 than in T19. Saqid et al. [45] stated that L-Arabinofuranose is an omnipresent component produced from the cytosolic UDP-arabinopyranose (UDP-Arap mutase 1). In contrast, trans-cinnamate 4-monooxygenase had a fold change of 1, with T1 being lower and T19 being higher. Trans-cinnamate is a naturally occurring aromatic compound in plants, and it could serve as a central intermediate for the biosynthesis of a large number of substances, such as phenylpropanoids, coumarins, and flavonoids [46]. Enzymes such as trans-cinnamate 4-monooxygenase (CYP73A) were identified in the ‘phenylpropanoid biosynthesis’ pathway in [47].
Based on known proteins and the four filter standards used, the results showed that only six differentially expressed proteins (DEPs) were found between the T19 (well-irrigated treatment) and T3 (stressed treatment from Nietvoorbij) groups. This included the four enzymes (three large chain ribulose bisphosphate carboxylase subunits and glutamine synthetase (GS) nodule isozyme) and two proteins (chlorophyll a/b binding protein, chloroplastic and elongation factor 1-alpha). Glutamine synthetase plays an important role in the metabolism of nitrogen by catalyzing the reaction of condensation of glutamate and ammonia to form glutamine [48]. The GS enzyme was downregulated in the stressed treatment (T3) by 1.62-fold compared to the well-watered treatment (T19) in response to water stress in this study. The findings are comparable to those reported by Mabizela [3] on C. subternata. During drought stress, nodule function and the growth of honeybush are directly affected when plants receive less water during summer periods, as honeybush are rain-fed plants. Furthermore, drought decreases the rate of photosynthesis and lowers the level of photosynthates needed by the bacteria for nitrogen fixation [49]. This finding may suggest that there was a positive nitrogen metabolism, which may be true as Cyclopia species are known to fix their own nitrogen [50,51].
Chloroplast is responsible for both light and dark reactions during photosynthesis, but it is highly sensitive to various abiotic stresses [52]. Drought disrupts cellular homeostasis and affects the photosynthetic pigments, soluble proteins, proteins in the thylakoids membranes, the electron transport chain, photophosphorylation, and carbon dioxide (CO2) fixation, which reduces the rate of photosynthesis. The closure of stomata also decreases photosynthesis, increasing chloroplast and sub-stomatal CO2 concentration and decreasing CO2 assimilation [40]. There was a downregulation of chlorophyll a/b binding proteins in the stressed treatment (T3) compared to T19. Drought causes leaf stomatal closure, which hinders CO2 entry into the mesophyll cells, thus reducing photosynthesis [53]. This is supported by a study conducted by Mabizela [3], where the amount of chlorophyll a/b-binding proteins in plants increased under drought conditions. In agreement, Benešová et al. [54] reported an increase in chlorophyll a/b-binding protein levels in a tolerant genotype of Zea mays, leading to open stomata and efficient transpiration. According to the proteomic findings, C. subternata’s photosynthesis-related proteins are regulated during drought stress, which may have crucial implications for plant tolerance research.

3.2. Gene Ontology Enrichment and KEGG Pathway Analysis

The reported DEPs were mostly found in the biological processes of cellular process, metabolic process, and response to a stimulus. Additionally, the biological processes involved are growth, developmental, multicellular organismal, reproductive, and reproduction processes. In terms of molecular functions, most of the differently expressed proteins identified were involved in binding and catalytic activities in leaves. Some of the observed molecular functions include translation regulator activity, protein folding chaperone, and ATP-dependent activity. In terms of the cellular component category, the most differentially expressed proteins identified were in the cellular anatomical entity followed by the protein-containing complex.
The enriched KEGG pathways in Figure 2B demonstrate that the greatest number of enzymes annotated in the leaves of C. subternata were linked to the glyoxylate and dicarboxylate metabolism. This may suggest that the activation of this pathway plays a crucial role in the mechanisms of water stress responses in C. subternata. Some of the observed metabolic pathways that were also identified in the leaves are carbon fixation in photosynthetic organisms, phenylpropanoid biosynthesis, thiamine metabolism, and purine metabolism.

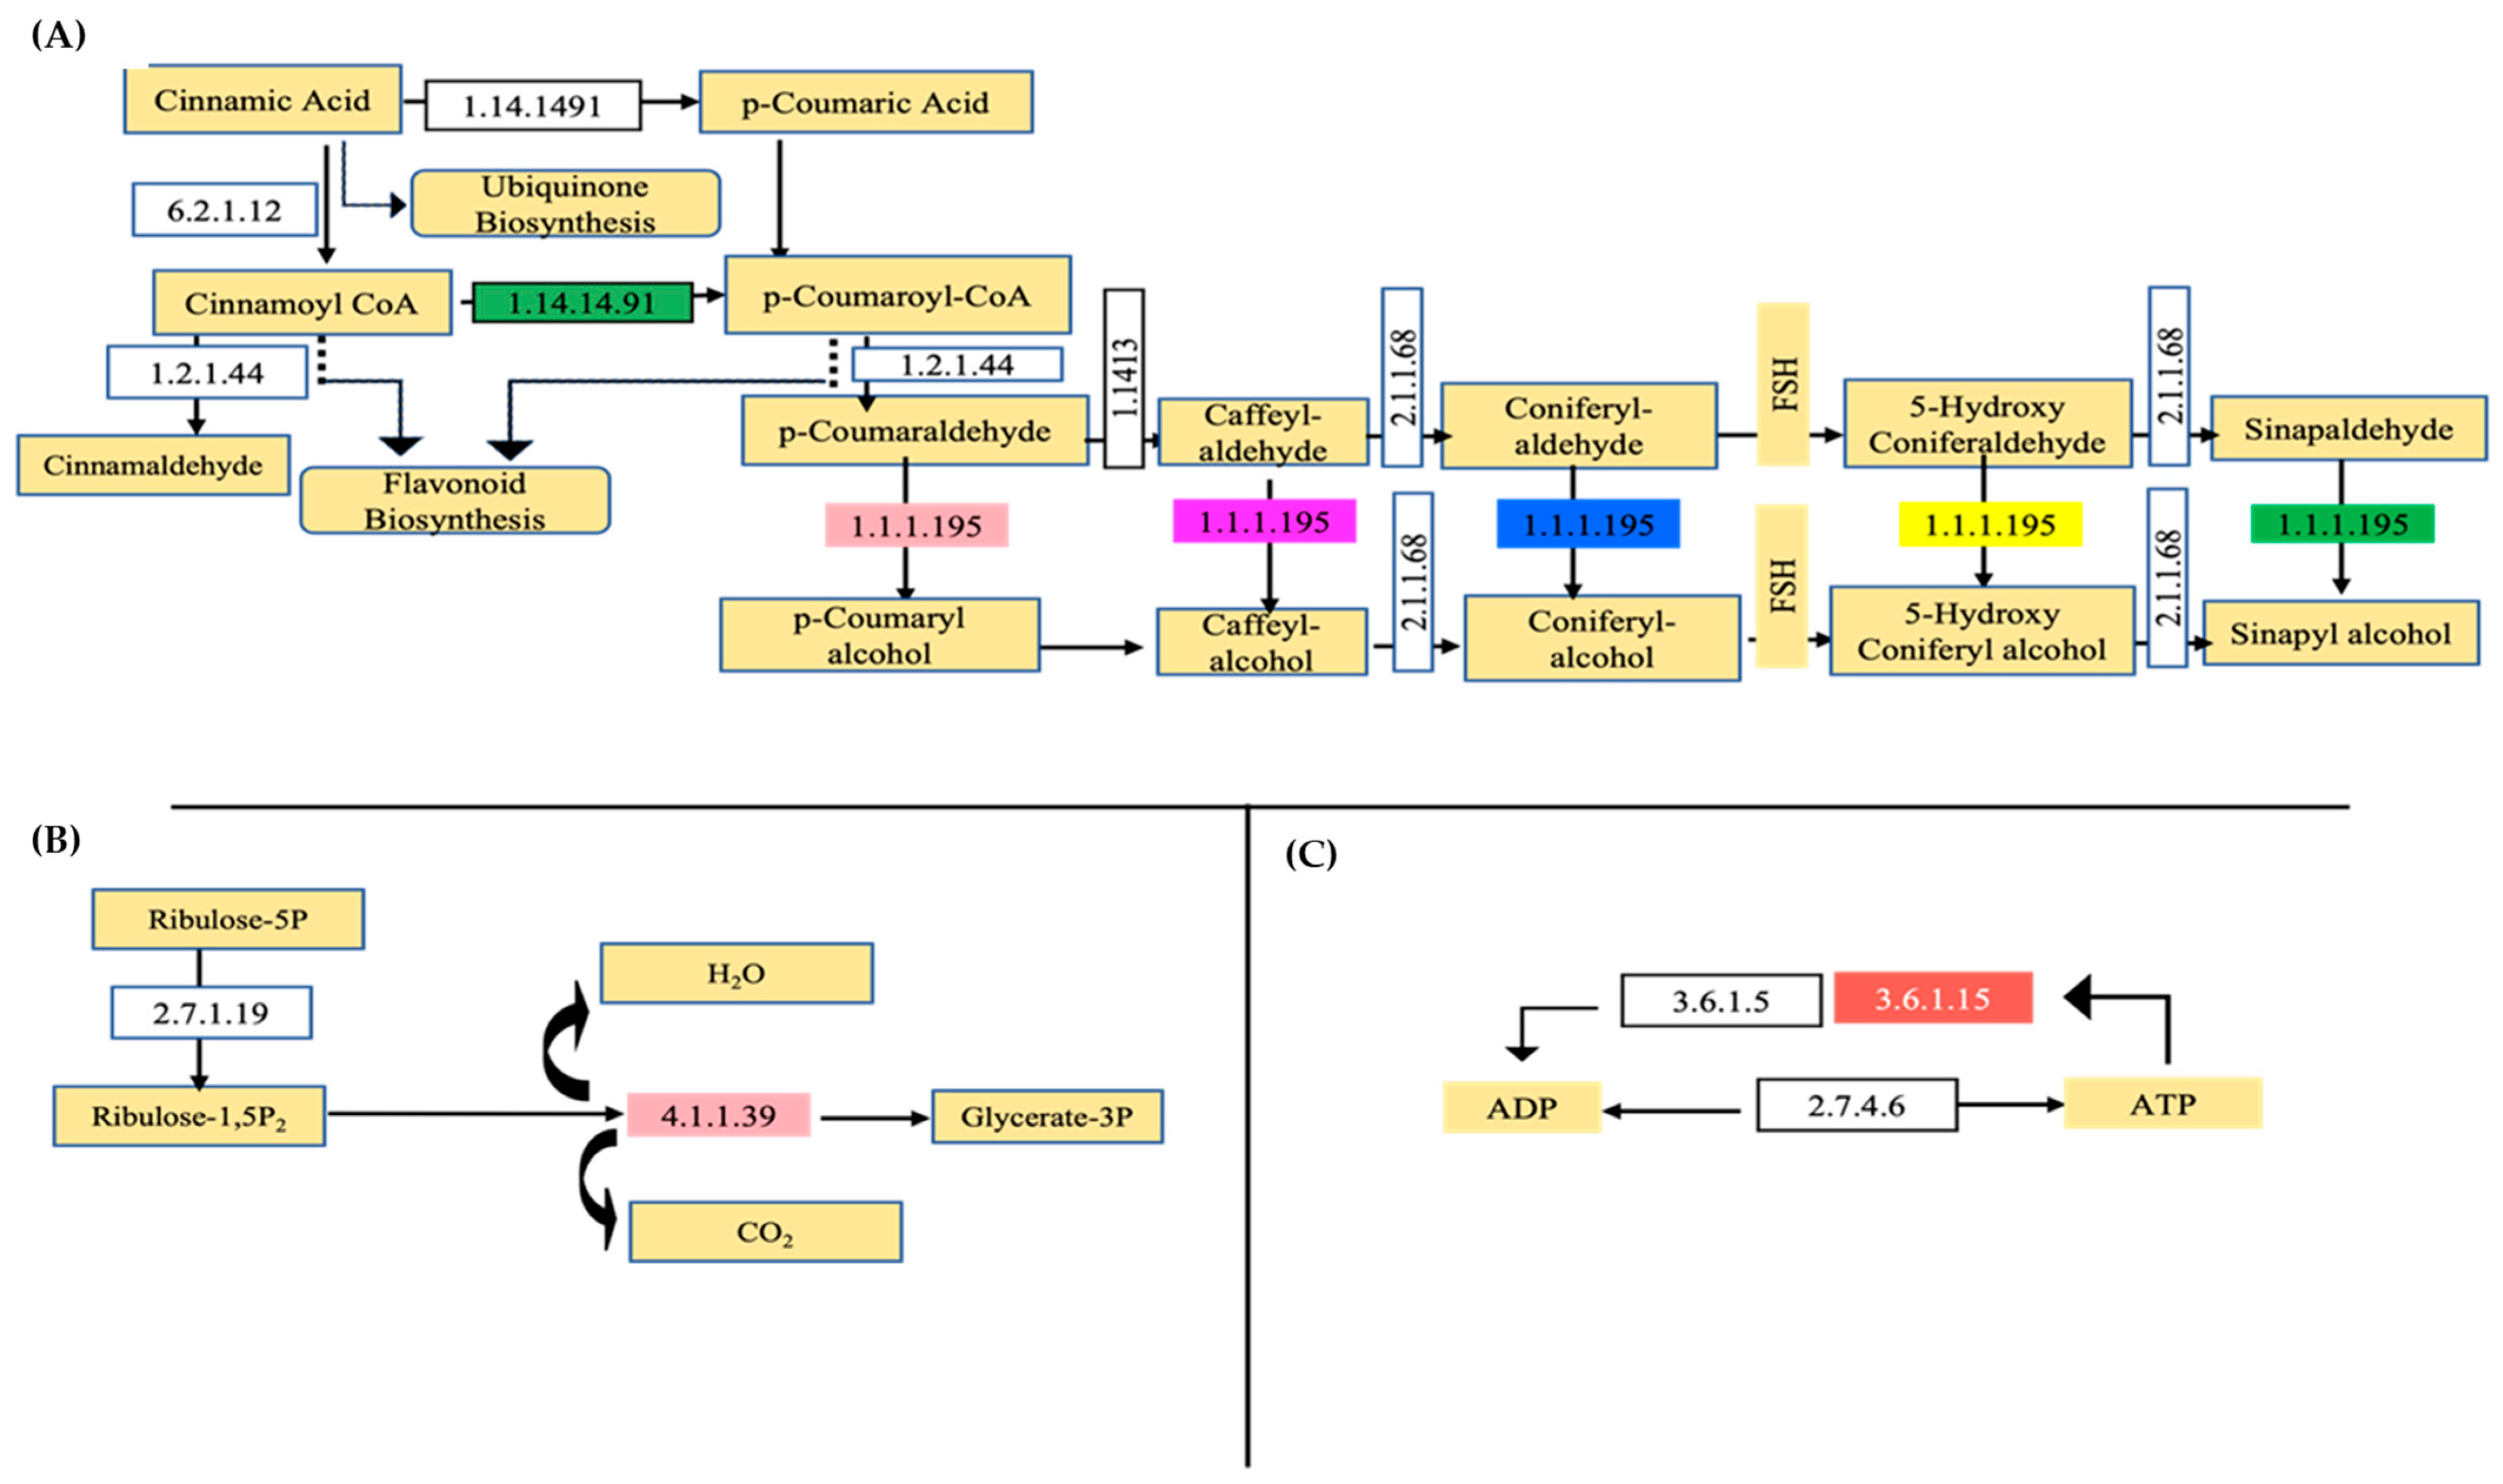
3.3. Regulation of Biosynthesis of Secondary-Metabolites-Related Pathways

3.3.1. Phenylpropanoids Pathway

Environmental stresses have the tendency to hinder plant growth and productivity by altering the metabolism of reactive oxygen and nitrogen species [55]. Plants under water stress experience oxidative stress, which changes how phenylpropanoids, flavonoids, and other secondary metabolites are synthesized. To detoxify ROS, plant cells evolve an antioxidant enzymatic defense system that uses both enzymatic and non-enzymatic antioxidants [55]. One of the most widely studied metabolic pathways among secondary metabolites is the phenylpropanoids pathway [56]. Metabolites from phenylpropanoid pathways are important for plant development, structural support, and responsiveness to internal and external stimuli. These metabolites are crucial mediators of plants’ interactions with other organisms and play a significant role in stress response to light variations [57] and mineral scarcity [58]. The phenylpropanoids pathway (ko00940) in the leaves of C. subternata contains the largest concentration of differentially expressed proteins in secondary metabolism (Figure 3a). From this pathway, two proteins were identified, namely, cinnamyl-alcohol dehydrogenase (EC:1.1.1.195), which is the most dominant, and heme-thiolate (EC:1.14.14.91). These results are comparable to studies by Yu et al. [59], where increased cinnamic acid accumulation and tolerance were imparted to millet through the regulation of genes involved in the phenylpropanoid biosynthesis pathway under drought stress.

3.3.2. Carbon Fixation in Photosynthetic Organism

Nearly all biological processes on earth rely on autotropic CO2 fixation, which has created prehistoric carbon reserves that are used today to meet more than 80% of the world’s energy needs [60]. The most biologically prevalent and commercially significant method for carbon fixation is the reductive pentose phosphate pathway (Calvin cycle), which has attracted most of the research attention [61]. Since ancient times, many plant species have been bred to increase their agricultural and commercial value. However, instead of increasing photosynthetic efficiencies, these methods typically produce varieties with a higher percentage of biomass directed towards a given product such as edible seeds or fruits [60].
During the onset of drought, a reduction in stomatal conductance can reduce the availability of CO2 for photosynthesis, subsequently leading to the inhibition of underlying biochemical processes such as Rubisco carboxylation and electron transport activity, relative water content, and even pigment content [62]. In this study, analyses of proteins related to the carbon fixation in photosynthetic organism pathway (ko00710) showed that the enzyme ribulose biosphosphate caroboxylase (EC:4.1.1.39) was differentially expressed in the leaves of C. subternata that were cultivated under different water stress conditions (Figure 3b). The most prevalent enzyme in the biosphere, rubisco, is one of the commonly known enzymes; it is the main carboxylase of the photosynthetic process. Carboxylation of ribulose bisphosphate is the initial step in the photosynthetic carbon reduction cycle, which results in the uptake of CO2 [63].

3.3.3. Purine Metabolism Pathways

Purine and pyridine serve as building blocks to produce nucleic acids and as an energy source. Therefore, nucleic acid biosynthesis and metabolism play a key role in the growth and development of plants [64]. The salvage process is used to use preformed purine bases and nucleosides for nucleotide synthesis. In some cases, purine nucleosides come from exogenous sources as catabolic products of nucleic acids in decomposing cells. Purine nucleosides result from the intercellular breakdown of unstable RNA [65,66]. In this study, analyses of proteins related to the purine metabolism pathway (ko00230) showed that an enzyme nucleoside-triphosphate phosphatase (EC: 3.6.1.15) was differentially expressed in the leaves of C. subternata that were cultivated under different water stress conditions (Figure 3c). This enzyme is in the plasma membrane and plays a role in breaking down extracellular triphosphate nucleotides [67].

4. Materials and Methods

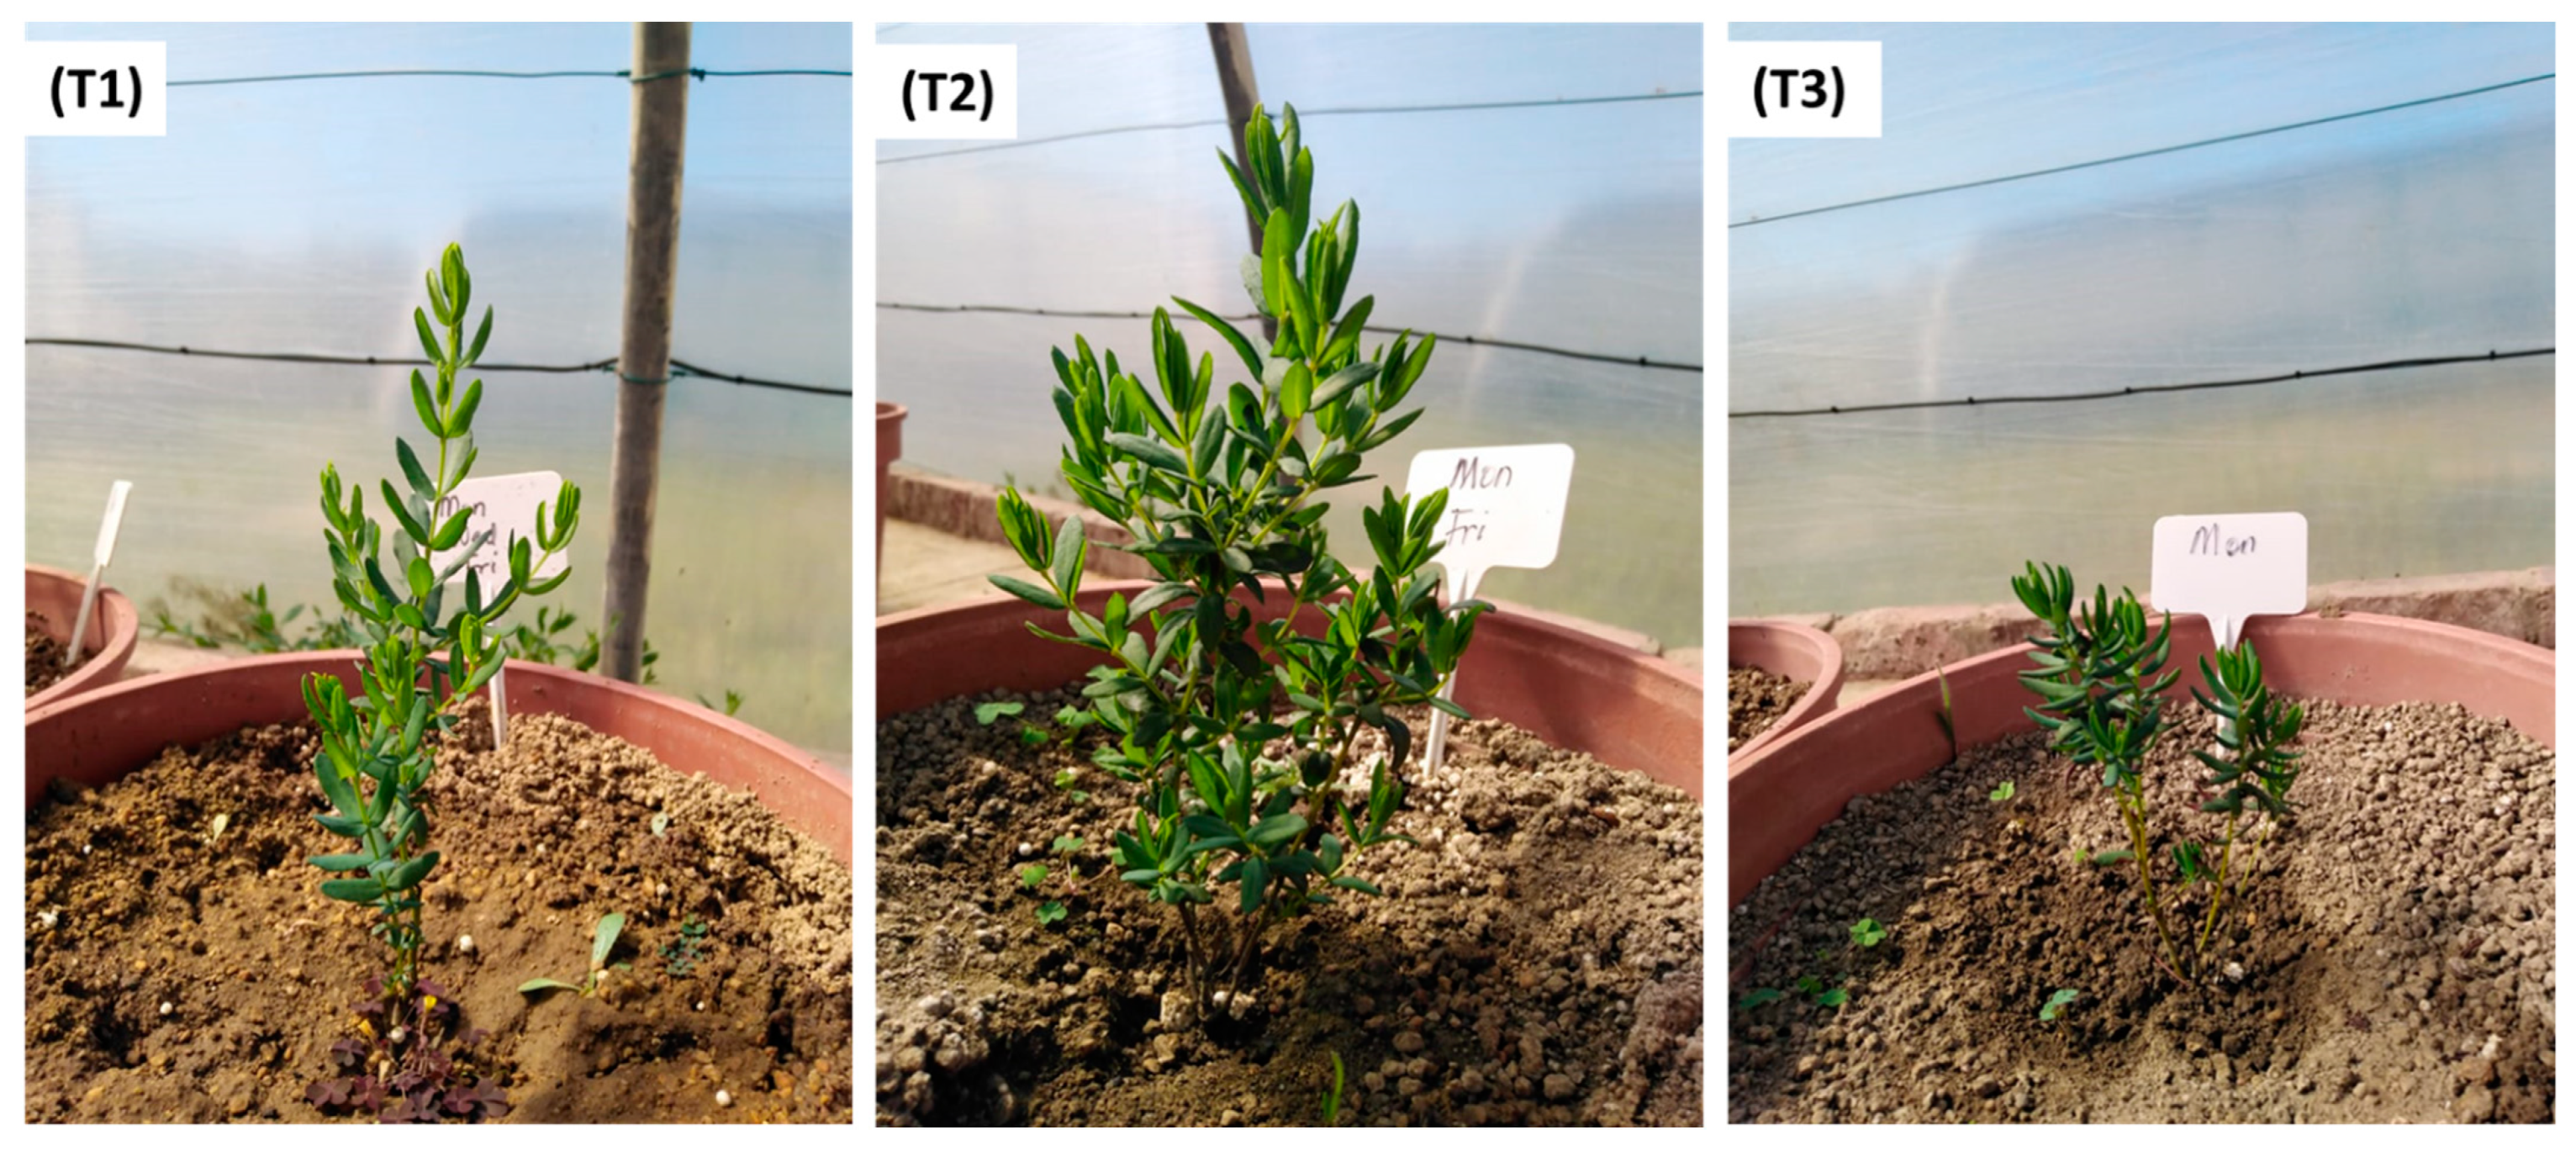
4.1. Plant Material and Sample Collection

To assess the effect of water deficit stress, a full-scale experiment was set up with potted C. subternata plants in a controlled glasshouse at the Agricultural Research Council (ARC), Infruitec, Stellenbosch (−33.925920°, 18.874259°), South Africa. The experiment was conducted for 112 days (from mid-May until early September 2021). All plants were watered uniformly with 300 mL of water for the first 81 days after transplanting (DAT) to ensure uniformity and strong root growth before treatment application. Thereafter, C. subternata plants were subjected to three irrigation treatments (from early August to early September 2021) until the study was terminated at 112 DAT. The watering cycles were irrigating thrice (3 days/week), twice (2 days/week), and once (1 day/week), which is described further as T1 = Nietvoorbij well-watered plant sample (Control), T2 = Nietvoorbij semi-stressed plant sample, and T3 = Nietvoorbij water-deprived plant sample (Figure 4). At every irrigation time, 300 mL of water was applied per pot. Each treatment was replicated eight times. The water needed per potted plant (300 mL) was based on extensive in-house preliminary trials.
Under semi-/mild-stressed water conditions, plants showed early vigor or maturity development (Figure 4, T2). Under this water stress condition, the plant undergoes low evapotranspiration to optimize water use efficiency and limit the loss of water due to direct evaporation from the soil surface. The early vigor enables water to be stored and made available later for developmental processes as the soil water becomes gradually depleted (Tuberosa, 2012) [68]. Furthermore, according to Seleiman et al. [69], plants have developed diverse adaptive strategies through evolution that make them more tolerant to the adverse effects of water stress. This survival strategy includes drought stress escape, avoidance, and tolerance approach. Based on the observed morphological changes in the semi-stressed C. subternata, escape and tolerance water stress survival strategy responses could be hypothesized. However, further investigation would be needed to validate this hypothesis.
Furthermore, the glasshouse experiment was compared to a commercially managed honeybush farm (Napier farm in Cape Agulhas, South Africa). The commercial farm was managed under good agricultural practice (GAP) with regular irrigation regimes, and the plants were never under any water stress. Samples were collected from the farm in May 2021, and batches were collected based on the year the honeybush was cultivated between 2013 and 2019; T13 = Napier well-watered plants cultivated in 2013, T17 = Napier well-watered plants cultivated in 2017, and T19 = Napier well-watered plants cultivated in 2017. Leaf samples were collected into pre-marked centrifuge tubes and immediately stored in liquid nitrogen. Samples were immediately sent to the Proteomics Research & Services Unit of the University of the Western Cape for protein extraction, 1D- SDS PAGE analysis, HILIC digestion, and other analysis.

4.2. Sample Preparation

Frozen samples were ground to a fine powder in liquid nitrogen using a mortar and pestle. Ground samples were stored at −20 °C until used. Ground tissue (0.5 g) containing 0.025 g polyvinylpolypyrrolidone (PVPP) was resuspended in 2 mL of 10% TCA/acetone. Polyvinylpolypyrrolidone (PVPP) has a high capacity to bind to polyphenols, and it is effective for the removal of phenolic impurities from plant tissue extracts [70]. The samples were thoroughly vortexed for 30 s and centrifuged at 16,000× g for 3 min at 4 °C. The resultant pellet was further rinsed with 2 mL of cold acetone and centrifuged for 3 min at 16,000× g at 4 °C. Acetone rinses were repeated until a white pellet was obtained. The protein pellet was air-dried at room temperature and further used for protein extraction.

4.3. Protein Extraction and Pellet Solubilization

Proteins were extracted using the phenol/SDS extraction protocol described previously by Wang et al. [71] with slight modifications. The protein pellet was resuspended in 0.7 mL SDS extraction buffer (30% sucrose, 2% SDS, 100 mM Tris-HCl, pH 8.0, 2.5% 2-mercaptoethanol, 1 mM PMSF) and 0.7 mL phenol (Tris-buffered, pH 8.0; Sigma-Adrich, St. Louis, MO, USA). The mixture was vortexed for 20 min and the phenol phase was separated by centrifugation at 16,000× g for 15 min at 4 °C. The phenol phase was backextracted with an equal volume of SDS extraction buffer for 3 min followed by centrifugation at 16,000× g for 10 min at 4 °C. At least 5 volumes of cold methanol containing 0.1 M ammonium acetate was added to the phenol phase, and the mixture was stored at −20 °C for 16 h. Precipitated proteins were recovered at 16,000× g for 20 min at 4 °C and washed with cold methanol once, followed by two 80% acetone washes. The final pellet was air-dried and dissolved in 100 µL protein solubilization buffer (4 M urea, 2% SDS, 50 mM Tris-HCl, pH 8.0), and the protein concentration was quantified using the Pierce microplate BCA protein assay kit (Thermo Scientific, Rockford, IL, USA) according to the manufacturer’s instructions with bovine serum albumin used as a standard.

4.4. Quality Control Using SDS–PAGE Analysis

The purity and quality of the extracted proteins were evaluated using SDS-PAGE analysis. Briefly, proteins (10 µg) were prepared in a 1:3 ratio with 4× Laemmli SDS-PAGE buffer (250 mM Tris-HCl, pH 6.8; 4% SDS; 30% glycerol; 350 mM β-mercaptoethanol; 0.02% bromophenol blue) and boiled at 95 °C for 3 min. The proteins were then resolved according to their molecular weight on 12% polyacrylamide gels under constant 100 V with the aid of the Mini—Protean III® Cell gel casting system (Bio-Rad Laboratories Ltd., Rosebank, Johannesburg, South Africa) until bromophenol blue reached the bottom of the gel. After electrophoresis, proteins were visualized using the Acqua Stain protein gel dye, and the gels were processed using Quantity One software on the Molecular Imager PharosFX Plus System (Bio-Rad Laboratories Ltd., Rosebank, Johannesburg, South Africa).

4.5. Protein Pellet Solubilization

All protein pellets were first solubilized in 50 mM Tris containing 2% SDS (Sigma-Adrich, St. Louis, MO, USA) and 4 M urea (Sigma-Adrich, St. Louis, MO, USA) by vortexing for 30 min. Samples were quantified using the Thermo-Fischer BCA kit following the manufacturer’s instructions. Approximately 50 µg of protein was aliquoted for trypsin digestion.

4.6. On-Bead Digest

All reagents used are of analytical grade or equivalent. Samples were resuspended in 50 mM ammonium bicarbonate (Sigma-Adrich, St. Louis, MO, USA) before reduction with 10 mM dithiothreitol (DTT) (Sigma) for 30 min at room temperature. This step was followed by alkylation with 30 mM iodoacetamide at room temperature in the dark. After the reduction and alkylation of the protein samples, the samples were diluted with an equal volume of binding buffer (200 mM sodium acetate, 30% acetonitrile, pH 4.5). The protein solution was added to MagResyn HILIC magnetic particles (Resyn Biosciences (Pty), Ltd. Gauteng, South Africa) prepared according to the manufacturer’s instructions and incubated overnight at 4 °C. After binding, the supernatant was removed, and the magnetic particles were washed twice with washing buffer (95% acetonitrile). After washing, the magnetic particles were suspended in 50 mM ammonium bicarbonate containing trypsin (New England Biolabs®, Ipswish, UK) to a final ratio of 1:50. After overnight incubation at 37 °C, the peptides were removed from the beads and collected in a fresh tube. The adsorbed peptides were removed by incubating them for 3 min at room temperature in 20 µL 1% trifluoroacetic acid (TFA).
Residual digest reagents were removed using Empore Octadecyl C18 extraction discs (SupelcoTM Analytical, Sigma-Adrich, St. Louis, MO, USA) as the C18 stage tip. The samples were loaded onto the stage tip after methanol (30 µL) equilibrated with 2% acetonitrile: water, 0.05% TFA (30 µL), was used to activate the C18 membrane. The bound sample was washed with 2% acetonitrile: water, 0.1% TFA (30 µL), and thereafter eluted with 50% acetonitrile: water 0.05% TFA (30 µL). The eluate was evaporated to dryness, and the dried peptides were dissolved in 2% acetonitrile: water, 0.1% FA, for LC-MS analysis.

4.7. LC–MS/MS Analysis—Dionex Nano-RSLC

The method for LC–MS/MS analysis was adapted from [72]. Thermo Scientific Ultimate 3000 RSLC equipped with a 5 mm x 300 µm C18 trap column (Thermo Scientific, Rockford, IL, USA) and a Charged Surface Hybrid (CSH) 25 cm × 75 µm of a 1.7 µm particle size C18 analytical column (WatersTM, Microsep Pty Ltd., Johannesburg, South Africa) was used for liquid chromatography. The loading solvent system employed was 2% acetonitrile: water, 0.1% FA; Solvent A: 2% acetonitrile: water, 0.1% FA; and Solvent B: 100% acetonitrile: water. The samples were loaded onto the trap column using a loading solvent at a flow rate of 2 µL/min from a temperature-controlled autosampler set at 7 °C. Loading was performed for 5 min before the sample was eluted onto the analytical column. The flow rate was set to 250 nL/min, and the gradient was generated as follows: 5–35% solvent B over 60 min and 35–50% solvent B from 60 to 75 min. Chromatography was performed at 40 °C, and the outflow was delivered to the mass spectrometer through a stainless-steel nano-bore emitter.

4.7.1. Mass Spectrometry

Mass spectrometry was performed using a Thermo Scientific Fusion MS fitted with a Nanospray Flex ionization source. The sample was introduced through a stainless-steel emitter. Data were collected in positive mode with spray voltage set to 1.8 kV and ion transfer capillary set to 280 °C. Spectra were internally calibrated using polysiloxane ions at m/z = 445.12003 and 371.10024. MS1 scans were performed using the orbitrap detector set at 120,000 resolutions over the scan range 350 to 1650 with an AGC target at 3 × 10⁵ and a maximum injection time of 50 min. Data were acquired in profile mode.
The MS2 acquisitions were performed using monoisotopic precursor selection for ions with charges +2 to +7 with error tolerance set to ±10 ppm. Precursor ions were excluded from fragmentation once for a period of 60 s. Precursor ions were selected for fragmentation in HCD mode using the quadrupole mass analyzer with HCD energy set to 30%. Fragment ions were detected in the orbitrap mass analyzer set to 30,000 resolutions. The AGC target was set to 5 × 10⁴ and the maximum injection time to 80 min, and data were acquired in centroid mode.

4.7.2. MS Data Analysis

The raw files generated via MS were imported into Proteome Discoverer v1.4 (Thermo Scientific, Rockford, IL, USA) and processed using the Sequest and Amanda algorithms. Database interrogation was performed against a concatenated database created using the Uniprot “Fabaceae-reviewed” (accessed in December 2021). Semi-tryptic cleavage with 2 missed cleavages was allowed. Precursor and fragment mass tolerance was set to 10 ppm and 0.02 Da, respectively. The deamidation (NQ), oxidation (M), and acetylation of protein N-terminal were allowed as dynamic modifications and thiomethyl of C as a static modification. Using the Target-Decoy PSM validator node, the peptides were validated. The search results were imported into Scaffold Q+ for further validation (www.proteomesoftware.com, accessed on 14 December 2021).

4.8. Gene Ontology and KEGG Analysis Pipeline

The proteins identified were mapped to Universal Protein Resource (UniProt https://www.uniprot.org/id-mapping, accessed 22 August 2022) to assess their function. Functional annotations of differentially abundant proteins (DAPs) were performed using Panther for gene ontology analysis (http://www.pantherdb.org, accessed 17 February 2023). The proteins were classified by Gene Ontology annotation based on three categories: biological process, cellular component and molecular function [73]. Moreover, the DAPs sequences were uploaded into EggNog-Mapper genome-wide functional annotation (http://eggnog-mapper.embl.de, accessed 18 February 2023). Sequences were assigned to various metabolic pathways using the Kyoto Encyclopedia of Genes and Genomes (KEGG) pathway analysis via EggNog-Mapper [74].

4.9. Experimental Design and Statistical Analysis

A full factorial experimental layout design was used in this study. The treatments were set up in a randomized block design (RBD) with three different irrigation treatments. All proteomics analyses were conducted using independent replicates in triplicate (n = 3). To test for normality, the Shapiro–Wilk test was performed. Data obtained were analyzed using ANOVA at p ≤ 0.05, and mean values were tested according to Tukey’s multiple comparison test at p ≤ 0.05, with F-values considered significant at p ≤ 0.01. Protein quantitation was performed using Fischer’s exact test at (p < 0.001) on the paired data with the Benjamini–Hochberg correction applied. Protein identifications were accepted if they could be established at greater than 95% probability, with a protein threshold of 1% false discovery rate, and contained at least two unique identified peptides.

5. Conclusions

This study demonstrated that water deficit stress had a critical influence on the biological processes, molecular activities, and cellular compartments of C. subternata. Only 11 differentially expressed proteins (DEPs) were found to be unique across all the treated and control C. subternata. The DEPs identified were associated with the biological processes linked to the cellular process, metabolic process, and response to a stimulus. Based on the KEGG analysis, five molecular pathways were identified, namely, phenylpropanoid biosynthesis, glyoxylate and dicarboxylate metabolism, purine metabolism, thiamine metabolism, and carbon fixation in a photosynthetic organism. Within these pathways, five enzymes (ribulose biphosphate carboxylase, glutamine synthetase, nucleoside-triphosphate phosphatase, heme-thiolate, and cinnamyl alcohol dehydrogenase) were identified. Overall, the use of proteomic tools helped identified proteins in honeybush plants that are water-stress-relevant. Future investigations to assess the mechanisms responsible for making C. subternata water-stress-tolerant compared to other crop species are required.

Author Contributions

M.-J.S.M.: Writing—original draft, Data curation, Formal analysis, and Investigation. L.H. and O.J.C.: Optimization of protein extractions, Formal analysis, and Software. O.J.C., C.B., M.N.L. and F.B.L. Conceptualized and Experimental design. C.B., M.N.L. and F.B.L.: Funding and resources. L.H., M.N.L. and O.J.C.: Writing—review and editing, Validation, and Visualization. M.N.L. and O.J.C.: Supervision of sample collection. C.B., M.N.L. and F.B.L.: Project administration. All authors have read and agreed to the published version of the manuscript.

Funding

This work is based upon research supported wholly/in part by the DEPARTMENT OF SCIENCE AND TECHNOLOGY (DST) of South Africa (grant nos. DST/CON 00029/2019). The National Research Foundation (NRF) of South Africa (grant nos. 137990) awarded to OJ Caleb is gratefully acknowledged.

Data Availability Statement

The data generated in this work will be made available by the corresponding authors upon request.

Acknowledgments

We gratefully acknowledge the research support provided by the Agricultural Research Council (ARC) of South Africa. Stellenbosch University, Central Analytical Facility, is acknowledged for the LC-MS/MS analysis.

Conflicts of Interest

The authors declare that they have no known competing financial interests or personal relationships that could have appeared to influence the work reported in this paper. The funders had no role in the design of the study; in the collection, analyses, or interpretation of data; in the writing of the manuscript; or in the decision to publish the results.

References

  1. Schutte, A.L.; Van Wyk, B.E. Evolutionary relationships in the Podalyrieae and Liparieae (Fabaceae) based on morphological, cytological, and chemical evidence. Plant Syst. Evol. 1998, 209, 1–31. [Google Scholar] [CrossRef]
  2. Ntlhokwe, G.E. Application of Comprehensive Two-Dimensional Gas Chromatography for the Characterization of the Volatile Composition of Honeybush tea. Ph.D. Thesis, Stellenbosch University, Stellenbosch, South Africa, 2016. [Google Scholar]
  3. Mabizela, G.S. Metabolic and Quality Profiling of Cyclopia subternata and C. genistoides in Response to Seasonal Variation and Drought Stress. Ph.D. Thesis, Tshwane University of Technology, Pretoria, South Africa, 2020. [Google Scholar]
  4. Koen, J.; Slabbert, M.M.; Booyse, M.; Bester, C. Honeybush (Cyclopia spp.) anther-stigma distance and intraspecies cross compatibilities. S. Afr. J. Plant Soil 2020, 38, 13–18. [Google Scholar] [CrossRef]
  5. Le Roux, M.; Cronje, J.C.; Burger, B.V.; Joubert, E. Characterization of Volatiles and Aroma-Active Compounds in Honeybush (Cyclopia subternata) by GC-MS and GC-O Analysis. J. Agric. Food Chem. 2012, 60, 2657–2664. [Google Scholar] [CrossRef]
  6. Soni, R.P.; Katoch, M.; Kumar, A.; Ladohiya, R.; Verma, P. Tea: Production, Composition, Consumption and its Potential as an Antioxidant and Antimicrobial Agent. Int. J. Food Ferment. Technol. 2015, 5, 95–106. [Google Scholar] [CrossRef]
  7. Joubert, E.; De Beer, D.; Malherbe, C.J.; Muller, M.; Louw, A.; Gelderblom, W.C.A. Formal honeybush tea industry reaches 20-year milestone–progress of product research targeting phenolic composition, quality, and bioactivity. S. Afr. J. Bot. 2019, 127, 58–79. [Google Scholar] [CrossRef]
  8. Jankun, J.; Selman, S.H.; Swiercz, R.; Skrzypczak-Jankun, E. Why drinking green tea could prevent cancer. Nature 1997, 387, 561. [Google Scholar] [CrossRef]
  9. Kanwar, J.; Taskeen, M.; Mohammad, I. Recent advances on tea polyphenols. Front. Biosci. 2012, 4, 11131. [Google Scholar]
  10. Joubert, E.; Joubert, M.E.; Bester, C.; De Beer, D.; De Lange, J.H. Honeybush (Cyclopia spp.): From local cottage industry to global markets—The catalytic and supporting role of research. S. Afr. J. Bot. 2011, 77, 887–907. [Google Scholar] [CrossRef]
  11. McGregor, G. An Overview of the Honeybush Industry; Department of Environmental Affairs and Development Planning: Cape Town, South Africa, 2017. [Google Scholar]
  12. Karsen, P.A.; Lötze, E.; Valentine, A.J.; Hoffman, E.W. Propagation and cultivation practices of honeybush (Cyclopia spp.) for the sustainable production of an export quality indigenous South African tea. Crop. Sci. 2022, 62, 1702–1733. [Google Scholar] [CrossRef]
  13. Zipfel, C.; Oldroyd, G.E.D. Plant signalling in symbiosis and immunity. Nature 2017, 543, 328–336. [Google Scholar] [CrossRef]
  14. Komatsu, S.; Mock, H.-P.; Yang, P.; Svensson, B. Application of proteomics for improving crop protection/artificial regulation. Front. Plant Sci. 2013, 4, 522. [Google Scholar] [CrossRef]
  15. Zahid, G.; Iftikhar, S.; Shimira, F.; Ahmad, H.M.; Kaçar, Y.A. An overview and recent progress of plant growth regulators (PGRs) in the mitigation of abiotic stresses in fruits: A review. Sci. Hortic. 2023, 309, 111621. [Google Scholar] [CrossRef]
  16. Henry, W.B.; Krutz, L.J. Water in Agriculture: Improving Corn Production Practices to Minimize Climate Risk and Optimize Profitability. Curr. Clim. Chang. Rep. 2016, 2, 49–54. [Google Scholar] [CrossRef]
  17. Farooqi, Z.U.R.; Ayub, M.A.; Rehman, M.Z.U.; Sohail, M.I.; Usman, M.; Khalid, H.; Naz, K. Regulation of drought stress in plants. In Plant Life under Changing Environment; Chapter 4; Academic Press: Cambridge, MA, USA, 2020; pp. 77–104. [Google Scholar] [CrossRef]
  18. Metwaly, E.-S.E.; Al-Yasi, H.M.; Ali, E.F.; Farouk, H.A.; Farouk, S. Deteriorating Harmful Effects of Drought in Cucumber by Spraying Glycinebetaine. Agriculture 2022, 12, 2166. [Google Scholar] [CrossRef]
  19. Farouk, S.; Al-Huqail, A.A. Sodium nitroprusside application regulates antioxidant capacity, improves phytopharmaceutical production and essential oil yield of marjoram herb under drought. Ind. Crop. Prod. 2020, 158, 113034. [Google Scholar] [CrossRef]
  20. Farouk, S.; Al-Ghamdi, A.A.M. Sodium nitroprusside application enhances drought tolerance in marjoram herb by promoting chlorophyll biosynthesis and enhancing osmotic adjustment capacity. Arab. J. Geosci. 2021, 14, 430. [Google Scholar] [CrossRef]
  21. Mittler, R. Abiotic stress, the field environment and stress combination. Trends Plant Sci. 2006, 11, 15–19. [Google Scholar] [CrossRef]
  22. Zhou, R.; Yu, X.; Ottosen, C.O.; Rosenqvist, E.; Zhao, L.; Wang, Y.; Yu, W.; Zhao, T.; Wu, Z. Drought stress had a predominant effect overheat stress on three tomato cultivars subjected to combined stress. BMC Plant Biol. 2017, 17, 1–13. [Google Scholar] [CrossRef]
  23. Osakabe, Y.; Osakabe, K.; Shinozaki, K.; Tran, L.S.P. Response of plants to water stress. Front. Plant Sci. 2014, 5, 1–8. [Google Scholar] [CrossRef]
  24. Wojtyla, L.; Paluch-Lubawa, E.; Sobieszczuk-Nowicka, E.; Garnczarska, M. Drought stress memory and subsequent drought stress tolerance in plants. In Priming-Mediated Stress and Cross-Stress Tolerance in Plants; Chapter 7; Elsevier Inc.: Amsterdam, The Netherlands, 2020; pp. 115–131. [Google Scholar] [CrossRef]
  25. Belay, Z.A.; Caleb, O.J. Role of integrated omics in unravelling fruit stress and defence responses during postharvest: A review. Food Chem. Mol. Sci. 2022, 5, 100118. [Google Scholar] [CrossRef]
  26. dos Santos, T.B.; Ribas, A.F.; de Souza, S.G.H.; Budzinski, I.G.F.; Domingues, D.S. Physiological Responses to Drought, Salinity, and Heat Stress in Plants: A Review. Stresses 2022, 2, 113–135. [Google Scholar] [CrossRef]
  27. Liu, Y.; Lu, S.; Liu, K.; Wang, S.; Huang, L.; Guo, L. Proteomics: A powerful tool to study plant responses to biotic stress. Plant Methods 2019, 15, 1–20. [Google Scholar] [CrossRef]
  28. Jorrin-Novo, J.V.; Komatsu, S.; Sanchez-Lucas, R.; de Francisco, L.E.R. Gel electrophoresis-based plant proteomics: Past, present, and future. Happy 10th anniversary Journal of Proteomics! J. Proteom. 2019, 198, 1–10. [Google Scholar] [CrossRef]
  29. Chandrasekhar, K.; Dileep, A.; Lebonah, D.E.; Pramoda Kumari, J. A short review on proteomics and its applications. Int. Lett. Nat. Sci. 2014, 12, 77–84. [Google Scholar] [CrossRef]
  30. Lyu, S.; Gao, L.; Zhang, R.; Zhang, C.; Hou, X. Correlation analysis of expression profile and quantitative iTRAQ-LC-MS/MS proteomics reveals resistance mechanism against TuMV in Chinese Cabbage (Brassica rapa ssp. pekinensis). Front. Genet. 2020, 11, 963. [Google Scholar] [CrossRef] [PubMed]
  31. Ma, Z.; Wang, L.; Zhao, M.; Gu, S.; Wang, C.; Zhao, J.; Tang, Z.; Gao, H.; Zhang, L.; Fu, L.; et al. iTRAQ proteomics reveals the regulatory response to Magnaporthe oryzae in durable resistant vs. susceptible rice genotypes. PLoS ONE 2020, 15, e0227470. [Google Scholar] [CrossRef] [PubMed]
  32. Wang, X.; Komatsu, S. Proteomic approaches to uncover the flooding and drought stress response mechanisms in soybean. J. Proteom. 2018, 172, 201–215. [Google Scholar] [CrossRef] [PubMed]
  33. Katam, R.; Shokri, S.; Murthy, N.; Singh, S.K.; Suravajhala, P.; Khan, M.N.; Bahmani, M.; Sakata, K.; Reddy, K.R. Proteomics, physiological, and biochemical analysis of cross tolerance mechanisms in response to heat and water stresses in soybean. PLoS ONE 2020, 15, e0233905. [Google Scholar] [CrossRef]
  34. Haddoudi, L.; Hdira, S.; Hanana, M.; Romero, I.; Haddoudi, I.; Mahjoub, A.; Ben Jouira, H.; Djébali, N.; Ludidi, N.; Sanchez-Ballesta, M.T.; et al. Evaluation of the morpho-physiological, biochemical, and molecular responses of contrasting Medicago truncatula lines under water deficit stress. Plants 2021, 10, 2114. [Google Scholar] [CrossRef]
  35. Gokul, A.; Carelse, M.F.; Niekerk, L.-A.; Klein, A.; Ludidi, N.; Mendoza-Cozatl, D.; Keyster, M. Exogenous 3,3′-Diindolylmethane Improves Vanadium Stress Tolerance in Brassica napus Seedling Shoots by Modulating Antioxidant Enzyme Activities. Biomolecules 2021, 11, 436. [Google Scholar] [CrossRef]
  36. Nsumpi, A.N.; Belay, Z.A.; Caleb, O.J. Good intentions, bad outcomes: Impact of mixed-fruit loading on banana fruit protein expression, physiological responses and quality. Food Packag. Shelf Life 2020, 26, 100594. [Google Scholar] [CrossRef]
  37. Ubiparip, Z.; Beerens, K.; Franceus, J.; Vercauteren, R.; Desmet, T. Thermostable alpha-glucan phosphorylases: Characteristics and industrial applications. Appl. Microbiol. Biotechnol. 2018, 102, 8187–8202. [Google Scholar] [CrossRef] [PubMed]
  38. Haworth, M.; Marino, G.; Brunetti, C.; Killi, D.; De Carlo, A.; Centritto, M. The impact of heat stress and water deficit on the photosynthetic and stomatal physiology of olive (Olea europaea L.)—A case study of the 2017 heat wave. Plants 2018, 7, 76. [Google Scholar] [CrossRef] [PubMed]
  39. Kang, J.; Chu, Y.; Ma, G.; Zhang, Y.; Zhang, X.; Wang, M.; Lu, H.; Wang, L.; Kang, G.; Ma, D.; et al. Physiological mechanisms underlying reduced photosynthesis in wheat leaves grown in the field under conditions of nitrogen and water deficiency. Crop. J. 2022, in press. [CrossRef]
  40. Morales, F.; Ancín, M.; Fakhet, D.; González-Torralba, J.; Gámez, A.L.; Seminario, A.; Soba, D.; Ben Mariem, S.; Garriga, M.; Aranjuelo, I. Photosynthetic Metabolism under Stressful Growth Conditions as a Bases for Crop Breeding and Yield Improvement. Plants 2019, 9, 88. [Google Scholar] [CrossRef]
  41. Wang, L.-F.; Lu, K.-K.; Li, T.-T.; Zhang, Y.; Guo, J.-X.; Song, R.-F.; Liu, W.-C. Maize phytomelatonin receptor1 functions in plant tolerance to osmotic and drought stress. J. Exp. Bot. 2022, 73, 5961–5973. [Google Scholar] [CrossRef]
  42. Mansell, R.L.; Gross, G.G.; Stöckigt, J.; Franke, H.; Zenk, M.H. Purification and properties of cinnamyl alcohol dehydrogenase from higher plants involved in lignin biosynthesis. Phytochemistry 1974, 13, 2427–2435. [Google Scholar] [CrossRef]
  43. Liu, Q.; Luo, L.; Zheng, L. Lignins: Biosynthesis and biological functions in plants. Int. J. Mol. Sci. 2018, 19, 335. [Google Scholar] [CrossRef]
  44. Chun, H.J.; Baek, D.; Cho, H.M.; Lee, S.H.; Jin, B.J.; Yun, D.-J.; Hong, Y.-S.; Kim, M.C. Lignin biosynthesis genes play critical roles in the adaptation of Arabidopsis plants to high-salt stress. Plant Signal. Behav. 2019, 14, 1625697. [Google Scholar] [CrossRef]
  45. Saqib, A.; Scheller, H.V.; Fredslund, F.; Welner, D.H. Molecular characteristics of plant UDP-arabinopyranose mutases. Glycobiology 2019, 29, 839–846. [Google Scholar] [CrossRef]
  46. Otto, M.; Wynands, B.; Lenzen, C.; Filbig, M.; Blank, L.M.; Wierckx, N. Rational Engineering of Phenylalanine Accumulation in Pseudomonas taiwanensis to Enable High-Yield Production of Trans-Cinnamate. Front. Bioeng. Biotechnol. 2019, 7, 312. [Google Scholar] [CrossRef] [PubMed]
  47. Shu, B.; Hu, Y.; Luo, C. The metabolites involved in phenylpropanoid biosynthesis increase the susceptibility of octoploid strawberry to crown rot caused by Colletotrichum siamense. Sci. Hortic. 2022, 306, 111447. [Google Scholar] [CrossRef]
  48. van Heeswijk, W.C.; Westerhoff, H.V.; Boogerd, F.C. Nitrogen Assimilation in Escherichia coli: Putting Molecular Data into a Systems Perspective. Microbiol. Mol. Biol. Rev. 2013, 77, 628–695. [Google Scholar] [CrossRef] [PubMed]
  49. Brink, C.; Postma, K.; Jacobs, K. Rhizobial diversity and functions in rooibos (Asphalathus linearis) and honeybush (Cyclopia spp.) plants, a review. S. Afr. J. Bot. 2017, 110, 80–86. [Google Scholar] [CrossRef]
  50. Bester, C. A model for commercialization of honeybush tea, an indigenous crop. Acta Hortic 2013, 1007, 889–894. [Google Scholar] [CrossRef]
  51. Postma, A.; Slabbert, E.; Postma, F.; Jacobs, K. Soil bacterial communities associated with natural and commercial Cyclopia spp. FEMS Microbiol. Ecol. 2016, 92, fiw016. [Google Scholar] [CrossRef]
  52. Ashraf, M.; Harris, P.J.C. Photosynthesis under stressful environments: An overview. Photosynthetica 2013, 51, 163–190. [Google Scholar] [CrossRef]
  53. Xu, Z.; Jiang, Y.; Jia, B.; Zhou, G. Elevated-CO2 Response of Stomata and Its Dependence on Environmental Factors. Front. Plant Sci. 2016, 7, 657. [Google Scholar] [CrossRef]
  54. Benešová, M.; Holá, D.; Fischer, L.; Jedelsky, P.; Hnilička, F.; Wilhelmova, N.; Rothová, O.; Kočová, M.; Procházková, D.; Honnerová, J.; et al. The Physiology and Proteomics of Drought Tolerance in Maize: Early Stomatal Closure as a Cause of Lower Tolerance to Short-Term Dehydration? PLoS ONE 2012, 7, e38017. [Google Scholar] [CrossRef]
  55. Chaki, M.; Begara-Morales, J.C.; Barroso, J.B. Oxidative stress in plants. Antioxidants 2020, 9, 481. [Google Scholar] [CrossRef]
  56. Biała, W.; Jasiński, M. The phenylpropanoid case–it is transport that matters. Front. Plant Sci. 2018, 9, 1610. [Google Scholar] [CrossRef]
  57. Yang, L.; Wen, K.-S.; Ruan, X.; Zhao, Y.-X.; Wei, F.; Wang, Q. Response of Plant Secondary Metabolites to Environmental Factors. Molecules 2018, 23, 762. [Google Scholar] [CrossRef]
  58. Clemens, S.; Weber, M. The essential role of coumarin secretion for Fe acquisition from alkaline soil. Plant Signal. Behav. 2015, 11, e1114197. [Google Scholar] [CrossRef]
  59. Yu, A.; Zhao, J.; Wang, Z.; Cheng, K.; Zhang, P.; Tian, G.; Liu, X.; Guo, E.; Du, Y.; Wang, Y. Transcriptome and metabolite analysis reveal the drought tolerance of foxtail millet significantly correlated with phenylpropanoids-related pathways during germination process under PEG stress. BMC Plant Biol. 2020, 20, 274. [Google Scholar] [CrossRef]
  60. Ducat, D.C.; Silver, P.A. Improving carbon fixation pathways. Curr. Opin. Chem. Biol. 2012, 16, 337–344. [Google Scholar] [CrossRef]
  61. Stitt, M.; Lunn, J.; Usadel, B. Arabidopsis and primary photosynthetic metabolism—More than the icing on the cake. Plant J. 2010, 61, 1067–1091. [Google Scholar] [CrossRef]
  62. Khalil, A.M.; Murchie, E.H.; Mooney, S.J. Quantifying the influence of water deficit on root and shoot growth in wheat using X-ray Computed Tomography. AoB Plants 2020, 12, plaa036. [Google Scholar] [CrossRef] [PubMed]
  63. von Caemmerer, S. Rubisco carboxylase/oxygenase: From the enzyme to the globe: A gas exchange perspective. J. Plant Physiol. 2020, 252, 153240. [Google Scholar] [CrossRef] [PubMed]
  64. Stasolla, C.; Katahira, R.; Thorpe, T.A.; Ashihara, H. Purine and pyrimidine nucleotide metabolism in higher plants. J. Plant Physiol. 2003, 160, 1271–1295. [Google Scholar] [CrossRef]
  65. Wasternack, C. Metabolism of pyrimidines and purines. In Encyclopedia of Plant Physiology; Pirson, A., Zimmermann, M.H., Eds.; New Series; Springer: Berlin, Germany, 1982; Volume 14B, pp. 263–301. [Google Scholar]
  66. Bray, C.M. Nitrogen Metabolism in Plants; Longman: London, UK, 1983. [Google Scholar]
  67. Beukers, M.W.; Pirovano, I.M.; van Weert, A.; Kerkhof, C.J.; Ijzerman, A.P.; Soudijn, W. Characterization of ECTO-ATPase on human blood cells: A physiological role in platelet aggregation? Biochem. Pharmacol. 1993, 46, 1959–1966. [Google Scholar] [CrossRef] [PubMed]
  68. Tuberosa, R. Phenotyping for drought tolerance of crops in the genomics era. Front. Physiol. 2012, 3, 347. [Google Scholar] [CrossRef] [PubMed]
  69. Seleiman, M.F.; Al-Suhaibani, N.; Ali, N.; Akmal, M.; Alotaibi, M.; Refay, Y.; Dindaroglu, T.; Abdul-Wajid, H.H.; Battaglia, M.L. Drought Stress Impacts on Plants and Different Approaches to Alleviate Its Adverse Effects. Plants 2021, 10, 259. [Google Scholar] [CrossRef] [PubMed]
  70. Ranatunge, I.; Adikary, S.; Dasanayake, P.; Fernando, C.D.; Soysa, P. Development of a Rapid and Simple Method to Remove Polyphenols from Plant Extracts. Int. J. Anal. Chem. 2017, 2017, 7230145. [Google Scholar] [CrossRef] [PubMed]
  71. Wang, W.; Vignani, R.; Scali, M.; Cresti, M. A universal and rapid protocol for protein extraction from recalcitrant plant tissues for proteomic analysis. Electrophoresis 2006, 27, 2782–2786. [Google Scholar] [CrossRef]
  72. Hooijberg, E.H.; Miller, M.; Cray, C.; Buss, P.; Steenkamp, G.; Goddard, A. Serum protein electrophoresis in healthy and injured southern white rhinoceros (Ceratotherium simum simum). PLoS ONE 2018, 13, e0200347. [Google Scholar] [CrossRef]
  73. Mi, H.; Muruganujan, A.; Casagrande, J.T.; Thomas, P.D. Large-scale gene function analysis with the PANTHER classification system. Nat. Protoc. 2013, 8, 1551–1566. [Google Scholar] [CrossRef]
  74. Cantalapiedra, C.P.; Hernández-Plaza, A.; Letunic, I.; Bork, P.; Huerta-Cepas, J. eggNOG-mapper v2: Functional annotation, orthology assignments, and domain prediction at the metagenomic scale. Mol. Biol. Evol. 2021, 38, 5825–5829. [Google Scholar] [CrossRef]
Figure 1. A representative one-dimensional electrophoresis gel profile of Cyclopia subternata leaf protein in response to different water stress treatments. Approximately 20 µg of protein sample were loaded on a 12% SDS-PAGE electrophoresis gel. M = Molecular weight marker (ladder); T1 = Nietvoorbij well-watered plant sample; T2 = Nietvoorbij semi-stressed plant sample; T3 = Nietvoorbij water-deprived plant sample; and T-19, -17, and -13 = Napier well-watered plants cultivated in 2019, 2017, and 2013, respectively. The red box and black annotated arrows indicate marked changes in protein intensity.
Plants 12 02181 g001
Figure 2. (A) Gene ontology (GO) analysis of common (shared) proteins differentially regulated in Cyclopia subternata leaf under water deficit stress and regularly watered as determined by Panther (http://www.pantherdb.org, accessed on 22 August 2022) (according to GO distribution by level 1. BP = biological processes; MF = molecular functions; CC = cellular components. (B) An illustration of metabolic pathways linked to differentially expressed proteins in the leaves of C. subternata under water deficit stress as well as regularly watered as retrieved by Kyoto Encyclopedia of Genes and Genomes (KEGG) pathway analysis via EggNog-Mapper.
Plants 12 02181 g002
Figure 3. KEGG pathway analysis revealing proteins differentially regulated in water deficit plants of C. subternata. (A) Differentially expressed proteins identified, i.e., E.C 1.14.14.91 (trans-cinnamate 4-monooxygenase) and E.C 1.1.1.195 (cinnamyl-alcohol dehydrogenase), affecting the phenylpropanoid biosynthesis pathway are shown by colored blocks. (B) The enzyme (E.C.4.1.1.39—ribulose-bisphosphate carboxylase) shown by colored block affecting the conversion of ribulose-1,5P2 to glycerate-3P in the carbon fixation in photosynthetic organism pathway. (C) In purine metabolism pathway, the enzyme identified is shown by red colored block, with relevant enzyme code E.C 3.6.1.15, nucleoside-triphosphate phosphatase in conjunction with E.C. 3.6.1.5 (ATP-diphosphatase) affecting the conversion of ATP to ADP.
Plants 12 02181 g003
Figure 4. Photos of irrigated and stressed Cyclopia subnernata, (T1) = Nietvoorbij well-watered plant sample (3 days/week, Control), (T2) = Nietvoorbij semi-stressed plant sample (watered 2 days/week), and (T3) = Nietvoorbij water-deprived plant sample (watered 1 day/week).
Plants 12 02181 g004
Table 1. List of proteins identified from C. subternata plants grown under well-watered and water-stressed conditions.
Protein NameCellular ComponentMolecular FunctionsBiological ProcessesMW (kDa)Tax. IDFET * FC (log2)FCExpression Change
Alpha-glucan phosphorylase, H isozymeCytoplasm Glycogen phosphorylase activity, pyridoxal phosphate binding, SHG alpha-glucan phosphorylase activity, linear malto-oligosaccharide phosphorylase activityCarbohydrate metabolism95.9 3906 0.000700.51.41Upregulated in T17 and downregulated in T19
Ribulose bisphosphate carboxylase large chainPlastid, ChloroplastMagnesium ion binding, monooxygenase activity, ribulose-bisphosphate carboxylase activity Photorespiration, reductive pentose-phosphate cycle 50 49830 0.000701.12.14Upregulated in T1 and downregulated in T19
Trans-cinnamate 4-monooxygenaseIntegral component of membraneHeme binding, iron ion binding, trans-cinnamate 4-monooxygenase activity, Lignin metabolic process58 38470.000290.01.00Downregulated in T1 and upregulated in T19
Probable UDP-arabinopyranose mutase 1Extracellular region (Secreted, cell wall, cell junction, plasmodesma, Golgi apparatus)UDP-arabinopyranose mutase activityCell wall organization, cellulose biosynthetic process, plant-type cell wall organization or biogenesis, protein glycosylation-38880.000810.11.07Downregulated in T1 and upregulated in T19
Probable cinnamyl alcohol dehydrogenaseStem, hypocotyl, root tissueCinnamyl-alcohol dehydrogenase activity, sinapyl alcohol dehydrogenase activity, zinc ion binding Lignin biosynthetic process-38790.00370.091.06Downregulated in T1 and upregulated in T19
Ribulose bisphosphate carboxylase large chainPlastid, ChloroplastMagnesium ion binding, monooxygenase activity, ribulose-bisphosphate carboxylase activity Photorespiration, reductive pentose phosphate cycle 50 49830 0.000741.22.30Downregulated in T19 and upregulated in T3
Ribulose bisphosphate carboxylase large chainPlastid, ChloroplastMagnesium ion binding, monooxygenase activity, ribulose-bisphosphate carboxylase activity Photorespiration, reductive pentose phosphate cycle 50 49830 0.000811.22.30Downregulated in T19 and upregulated in T3
Ribulose bisphosphate carboxylase large chainPlastid, ChloroplastMagnesium ion binding, monooxygenase activity, ribulose-bisphosphate carboxylase activityPhotorespiration, reductive pentose-phosphate cycle53498300.00151.22.30Downregulated in T19 and upregulated in T3
Glutamine synthetase nodule isozymeCytoplasmATP binding, glutamate-ammonia ligase activityGlutamine biosynthetic process3939180.00180.71.62Upregulated in T19 and downregulated in T3
Elongation factor 1-alphaCytoplasmGTP binding, translation elongation factor activity, GTPase activity-4939180.00371.63.03Downregulated in T19 and upregulated in T3
Chlorophyll a-b binding protein, chloroplasticChloroplast thylakoid membrane, integral component of membrane, photosystem I, photosystem IIChlorophyll binding, metal ion bindingPhotosynthesis, light harvesting in photosystem I, response to light stimulus2638470.00410.61.52Upregulated in T19 and downregulated in T3
T1 = well-watered Nietvoorbij field plants; T3 = water-stressed Nietvoorbij field plants; T17 = well-watered Napier field plants cultivated in 2017; T19 = well-watered Napier field plants cultivated in 2019 (UniProt https://www.uniprot.org, accessed 22 August 2022). * FC = Fold change, FET = Fisher’s Exact Test, MW = Molecular weight, Tax. ID = Taxonomic identifier.
Disclaimer/Publisher’s Note: The statements, opinions and data contained in all publications are solely those of the individual author(s) and contributor(s) and not of MDPI and/or the editor(s). MDPI and/or the editor(s) disclaim responsibility for any injury to people or property resulting from any ideas, methods, instructions or products referred to in the content.

