Article

Musa Germplasm A and B Genomic Composition Differentially Affects Their Susceptibility to Banana Bunchy Top Virus and Its Aphid Vector, Pentalonia nigronervosa

1
International Institute of Tropical Agriculture (IITA), Messa-Yaoundé P.O. Box 2008, Cameroon
2
Department of Plant Protection, University of Dschang, Dschang P.O. Box 96, Cameroon
3
Center for Tropical Research, Institute of the Environment and Sustainability, University of California, Los Angeles, CA 90095, USA
4
Departments of Microbiology and Parasitology, University of Buea, Buea P.O. Box 63, Cameroon
5
National Program of Fruit Crops (NPFC), Ministry of Agriculture and Rural Development (MINADER), Yaoundé P.O. Box 57, Cameroon
6
IITA, PMB 5320 Oyo Road, Ibadan 200285, Nigeria
*
Author to whom correspondence should be addressed.
Plants 2022, 11(9), 1206; https://doi.org/10.3390/plants11091206
Submission received: 4 March 2022 / Revised: 26 April 2022 / Accepted: 26 April 2022 / Published: 29 April 2022
(This article belongs to the Topic Integrated Pest Management of Crops)

Abstract

:
Banana bunchy top disease (BBTD), caused by the banana bunchy top virus (BBTV, genus Babuvirus), is the most destructive viral disease of banana and plantain (Musa spp.). The virus is transmitted persistently by the banana aphid, Pentalonia nigronervosa Coquerel (Hemiptera: Aphididae). While research efforts have focused on screening Musa genotypes for BBTD resistance, comparatively little work has been carried out to identify resistance to banana aphids. This study assessed 44 Musa germplasm of different A and B genome composition for the performance of banana aphids under semicontrolled environmental screenhouse conditions and in a field trial established in a BBTD endemic location. In the screenhouse, the AA diploid Calcutta 4 had the lowest apterous aphid density per plant (9.7 ± 4.6) compared with AAB triploid Waema, which had the highest aphid densities (395.6 ± 20.8). In the field, the highest apterous aphid density per plant (29.2 ± 6.7) occurred on the AAB triploid Batard and the lowest (0.4 ± 0.2) on the AA diploid Pisang Tongat. The AA diploid Tapo was highly susceptible to BBTD (100% infection) compared with the genotypes Balonkawe (ABB), PITA 21 (AAB), Calcutta 4 (AA), and Balbisiana Los Banos (BB), which remained uninfected. The Musa genotypes with apparent resistance to BBTD and least susceptibility to aphid population growth provide options for considering aphid and BBTD resistance in banana and plantain breeding programs.

1. Introduction

Banana (and plantain, Musa spp. L., Zingiberales: Musaceae) is among the top 20 food crops worldwide [1]. The cooking banana types are among the most important crops cultivated for household food security and income generation by millions of smallholder farmers under subsistence-farming conditions in sub-Saharan Africa (SSA), where they are largely grown in mixed-crop fields and backyards of household compounds. Banana productivity in SSA remains low at 7.3 million metric tonnes/ha [1], mainly because of the widespread negative impact of several endemic and exotic pests and diseases, including banana bunchy top disease (BBTD). BBTD is caused by the banana bunchy top virus (BBTV, genus Babuvirus) and is the most destructive virus disease of banana worldwide [2,3]. BBTD was first reported from Fiji in 1989 and is presently known to occur in 37 countries. In SSA, BBTD was first reported from the Democratic Republic of Congo. The virus is presently known to occur in 17 African countries (Available online: https://www.bbtvalliance.org/index.php/bbtv (accessed on 2 March 2022)) where BBTV has since emerged as a serious threat to banana production [3]. BBTV infection of banana plants results in a range of symptoms that generally culminate in a bunchy appearance at the top of severely stunted pseudostems [4]. The virus-infected plants do not produce fruit when the infection starts before flowering, while late infections result in deformed and inedible fruits [5]. Regardless of the time of infection, BBTV infection leads to 100% banana fruit yield loss from the infected plants [6,7].
BBTV is transmitted through vegetative propagation of infected banana propagules and by the banana aphid, Pentalonia nigronervosa Coquerel (Hemiptera: Aphididae), which occurs on plants in the Musaceae [8]. A closely related species, Pentalonia caladii van der Goot, frequently found on plants in the Araceae and Zingiberaceae [8,9], has been shown to transmit BBTV under experimental conditions, albeit much less efficiently than P. nigronervosa [10]. Considering its poor BBTV-transmission efficiency and its generally restricted distribution to non-Musa spp., P. caladii is unlikely to play a significant role in the natural transmission of BBTV in banana plantations. However, P. caladii could be a significant vector in BBTV transmission to other hosts in which BBTV was recently detected, including Heliconia sp. in Hawaii (USA) [11] and Alpinia galanga (L.) Willdenow and Curcuma longa L. in Indonesia [12].
The banana aphid transmits BBTV in a persistent, circulative, and non propagative manner [13,14], while there is no evidence for mechanical viral transmission [13,15]. The banana aphid can acquire the virus after at least 4 h of the acquisition access period (AAP) on infected tissue and requires a minimum inoculation access period (IAP) of 15 min to transmit the virus [13]. The aphid retains the virus throughout its life. BBTV-transmission efficiency by P. nigronervosa increases with increased AAP, IAP, virus titer in the source plant, and aphid abundance [13].
Several cultural and chemical approaches were developed for BBTD management, including the use of virus-free planting material, quarantine measures, roguing of diseased plants, and use of pesticides to control the aphid vector [16,17,18]. While these approaches were effective in large-scale monoculture banana plantations, they have not been widely adopted by smallholder farmers in SSA due to the low availability of virus-free planting materials, high costs of pesticide use for aphid control, and high labor requirement for rouging-based methods [19,20]. Host-plant resistance to the virus and/or the aphid vector, particularly in smallholder farming environments of SSA, offers the most economical and environmentally sound means for controlling virus diseases [21,22,23,24,25,26]. Previous studies focused on assessing Musa genotypes’ resistance against BBTD [5,27,28,29], while resistance to the banana aphid has rarely been evaluated.
This study covers the evaluation of a set of Musa genotypes representing all known Musa ploidy levels and genomic groups (Table 1) to identify resistance to BBTV and its banana aphid vector. Resistance to the banana aphid was evaluated in the absence of BBTV under a semi-controlled environment, while resistance to the aphid and BBTV was assessed over 36 months in the field under natural aphid colonization and BBTV infections. The results demonstrated the differential response of genotypes to both aphid performance and BBTD, and identified promising genotypes with high levels of tolerance to the virus vector and to the disease.

2. Materials and Methods

2.1. Planting Material

Musa genotypes used in this study were sourced from the international Musa collection held in genebanks of the International Institute of Tropical Agriculture (IITA) in Ibadan, Nigeria, the International Transit Center of Bioversity International in Leuven, Belgium, and the IITA station in Yaoundé, Cameroon (Table 1). Virus-free stocks of all sourced genotypes were propagated in vitro at the IITA tissue-culture laboratory in Yaoundé before their use in the screenhouse and field trials. Acclimatized plants were grown in 15 cm diameter pots containing a mixture of pasteurized forest topsoil, sand, and poultry manure at a ratio of 3:1:1 and maintained for 5–6 months in an insect-proof screenhouse at the IITA station in Yaoundé, Cameroon, a BBTV-free area of Cameroon.

2.2. Screening of Musa Genotypes for Banana Aphid Population Growth in the Screenhouse

Virus-free plants of 38 genotypes were evaluated for banana aphid growth potential under screenhouse conditions at the IITA-Cameroon campus in Yaoundé (03°51.839′ N/011°7.748′ E, ~770 m.a.s.l.) (Table 1). Banana aphids of mixed stages (nymphs and adults) were collected from banana plants at the IITA-Cameroon experimental farm to establish an aphid colony on virus-free potted plants of the cultivar ‘Williams’ (AAA). The plants were raised for about 55 days (approximately three generations) in an insect-proof screenhouse before their use. Pentalonia nigronervosa identity was established by examining morphological features of at least 20 aphids under a phase-contrast microscope [30]. Twelve plants per genotype arranged in three replicates of four plants each were evaluated. Using a fine camel-hair brush, five 4th instar aphids from stock cultures were gently teased-off the plant and transferred onto an unfurled top leaf of each test plant. All plants of the 38 genotypes were infested with aphids collected from the stock colony on the same day. The infested plants were maintained in an insect-proof cage (70 × 50 × 43 cm). The experiment was conducted from July to September 2013. Aphid census on the whole plant started one week after the transfer of aphids and continued weekly for nine weeks. Plants were taken out of the cage for a brief period for a census of aphids. Apterous and alate aphids were tallied separately. Test plants were watered as needed. Temperature and relative humidity within the screenhouse were monitored with a Hobo Pro v2 logger (Onset Computer Corporation, Bourne, MA, USA) suspended just above the cages in the center of the screenhouse. Temperatures during the experiment fluctuated between 18.4 and 36.2 °C with an average of 23.0 ± 0.04 °C. Relative humidity ranged from 37.7 to 99.4%, with an average of 85.8 ± 0.2%. The photoperiod was 12:12 L:D (±30 min).

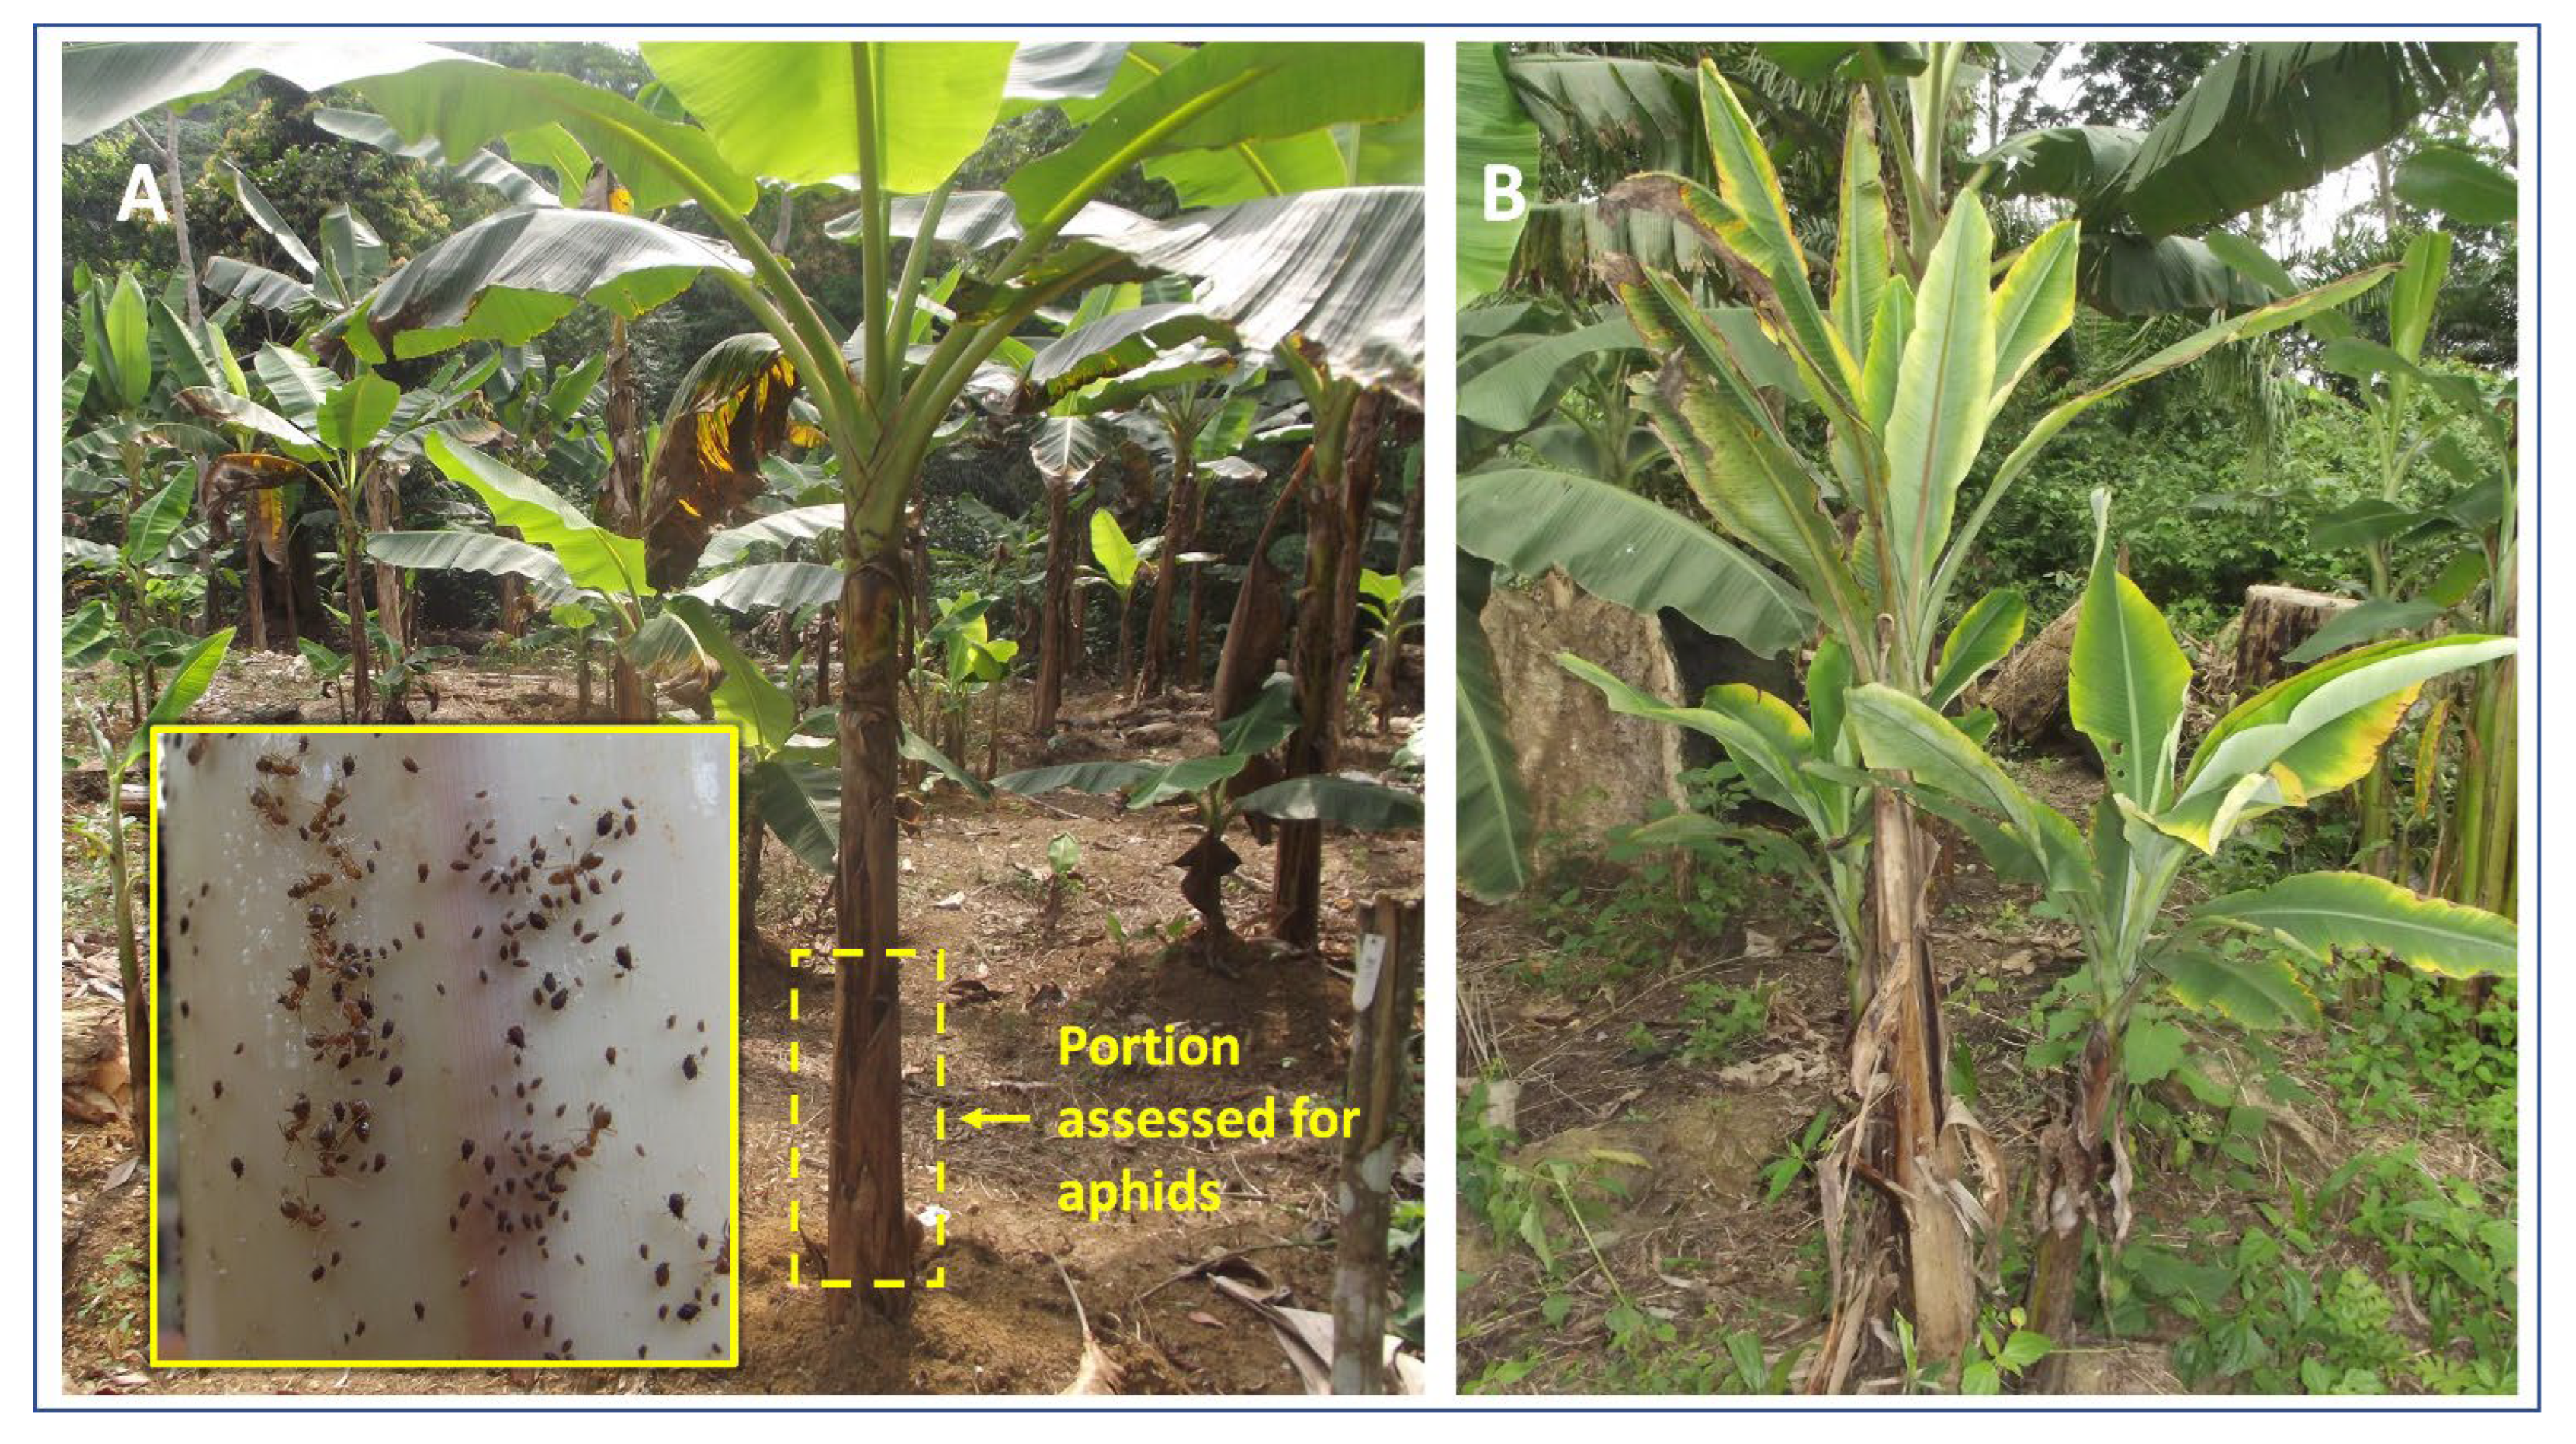
2.3. Evaluation of Musa Genotypes against Banana Aphid and BBTD under Field Conditions

The field trial was established in Abang Minko’o (02°19.513′ N/011°26.362′ E, 563 m.a.s.l.), an area in the South Region of Cameroon where BBTD is endemic [6]. BBTD is widely prevalent in the area, with 94.3% of fields with one or more BBTD-infected plants and a within-field disease incidence ranging between 0.17% and 36% (Ngatat et al., unpublished data). The nearest banana farms were at 30, 15, 24, and 1000 m from the field borders in the north, east, south, and west, respectively. This area of the field experiment is located in a humid forest zone with bimodal rainfall. Temperature and relative humidity were monitored with Hobo® Pro v2 logger (Onset Comp., Bourne, MA, USA) installed under a waterproof shelter, while rainfall data was collected with a Tru-Chek™ rain gauge (Edwards Man. Co., Albert Lea, MN, USA) placed in an open area. Temperatures in the experimental field ranged from 14 to 37 °C with an average of 24.1 ± 0.02 °C, while relative humidity ranged from 35 to 100%, with an average of 89.1 ± 0.07%. Average yearly rainfall for the 3 years was 1806 ± 122 mm.
Virus-free, hardened tissue-culture plants of 44 genotypes, including 34 genotypes evaluated for aphid population growth under the screenhouse experiment, were planted at 2 × 2 m row spacing in holes of 30 × 30 × 30 cm. One kg of poultry manure (2.1, 1.3, and 0.8% N, P, K, respectively) was mixed with soil at planting time in September 2013. The experiment was terminated 36 months after its initiation. The experimental layout followed a complete randomized block design with three blocks (=replicates), with an area of 704 m2 per block and a 4 m distance between blocks. Within each block, all genotypes were planted in plots of three rows and five plants per row for a total of fifteen plants per plot. All plants were free of banana aphids and BBTD at planting. To facilitate and augment the natural spread of the virus, 176 BBTD-symptomatic suckers, obtained from the virus-affected banana fields in the vicinity of the experimental field plot, were planted at the edges of rows between blocks [29]. Aphid infestation and BBTV infection of experimental plants occurred naturally. The field was weeded manually. Dead leaves were pruned as needed. The field was managed under rainfed conditions with no additional inputs during the 36 months of the experiment.
Census for banana aphid and BBTD-affected plants were initiated 2 months after planting (MAP) and continued monthly for 36 months. The number of banana aphids (all life stages) was counted on the bottom third of the oldest pseudostem on three plants per replicate (Figure 1) [31,32]. After flowering and bunch production of the oldest pseudostem, aphid census was shifted to the next oldest sucker of the same mat [29]. Occasionally, aphid occurrence was observed on the throat and leaves of the census plants, but they were not counted to maintain the standard assessment to only the lower portion of the pseudostem. BBTD incidence was recorded at the same time of aphid census. All the shoots (pseudostems) of a mat (=plant) in a replicate were carefully checked for the presence of BBTD symptoms. A mat was counted as symptomatic based on typical BBTV symptoms on at least one pseudostem. The time between planting and the first appearance of BBTD symptoms on a plant was evaluated for each genotype. At the end of the experiment (i.e., 36 MAP), leaf samples of all asymptomatic plants were collected for BBTV testing by polymerase chain reaction (PCR) as described previously [6]. Estimation of the number and weight of bunches at harvest time was not possible due to thefts.

2.4. Data Analysis

Aphid abundance, including apterous and alate forms, was estimated for each genotype present in screenhouse and field trials. The area under the infestation pressure curve (AUIPC), which represents the increase in aphid population over time, was computed for each genotype using the modified formula from Shaner and Finney [33]. AUIPC = i = 1 n 1 ( y i + y i + 1 2 ) × ( t i + 1 t i ) where i = the ranking of the assessment, n = number of days between i and i + 1 assessment, and y = number of insects at time t. BBTD incidence- based on symptom observation in the field of each genotype was calculated as BBTD   i n c i d e n c e = T o t a l   m a t s   i n f e c t e d T o t a l   m a t s   p l a n t e d × 100 .   A quantitative summary of disease over time represented by the area under the disease progress curve (AUDPC) was computed for each genotype using the formula from Shaner and Finney [33]. AUDPC = i = 1 n 1 ( y i + y i + 1 2 ) × ( t i + 1 t i ) , where yi is the proportion of infected plants at the ith observation, ti is time in days at the ith observation, and n is the total number of observations. Virus incidence, based on virus-positive leaves by PCR analysis, was calculated as the percentage of infected leaf samples for each genotype. All response variables, i.e., apterous aphids, alate aphids, BBTD incidence, and AUDPC, were tested for normal distribution using the Shapiro–Wilk test at p > 0.05 [34]. Response variables that were not normally distributed were analyzed with the Kruskall–Wallis nonparametric test. Bonferonni pairwise comparison of genotypes was used because of the large number of pairwise comparisons.
To select the genotypes that were most or least susceptible to banana aphid and/or to BBTD, in each genomic group for both screenhouse and field trials, four genotypes with an extreme mean (two highest and two lowest) aphid abundance or BBTD incidence were selected and compared. Correlation analysis was used to relate aphid densities in the screenhouse to those in the field on each of the 34 genotypes present both in the screenhouse and in the field. To rank the genotypes, while simultaneously considering their reaction under natural conditions to both banana aphid and BBTD, a heatmap with hierarchical clustering was used for classification based on both AUDPC and AUIPC values for each genotype obtained from the field trial. All statistical analyses were performed with R 3.6.2 package (R Development Core Team), while the heatmap was generated with JMP 8.2 (SAS Institute).

3. Results

3.1. Banana Aphid Abundance on Musa Genotypes in the Screenhouse

Apterous aphid densities were higher on triploid (155.3 ± 21.4) and tetraploid (139.7 ± 13.7) than on diploid (74. 8 ± 10.5) genotypes (χ2 = 14.7, df = 2, p < 0.001). Alate aphid densities were also greater on triploid (7.4 ± 1.4) and tetraploid (5.3 ± 1.4) than on diploid (1.4 ± 0.4) genotypes (χ2 = 13.6, df = 2, p = 0.001). A difference was observed among diploid genotypes for apterous aphid abundance (χ2 =17.7, df = 10, p = 0.006) but not for alate aphids (χ2 = 13.98, df = 10, p = 0.17) (Table 2). However, both apterous and alate aphid abundance differed among triploid genotypes (χ2 = 23.4, df = 14, p = 0.04 and χ2 = 32.2, df =14, p = 0.004, respectively). The highest aphid density was observed on the Waema (AAB), while the lowest density was observed on Ice cream (ABB) (Table 3). The highest alate density was observed on Ebang (AAB), while the lowest occurred on Yangambi Km5 (AAA). Similarly, both apterous and alate aphid abundance differed among genotypes in the tetraploids (χ2 = 21.5, df = 1, p = 0.03 and χ2 = 25.2, df = 11, p = 0.009, respectively) (Table 4). The highest apterous and alate aphid densities were observed on FHIA 03 (AABB), while the lowest occurred on T6 (AAAA). Comparison of two genotypes with highest and lowest aphid densities from each ploidy level showed significant differences among the sorted genotypes for apterous aphid (χ2 = 30.0, df = 11, p = 0.002) and alate aphid (χ2 = 30.1, df = 11, p = 0.002) densities. Apterous aphid density was highest on Waema (AAB) and lowest on Calcutta 4 (AA), while alate aphid density was highest on Ebang (AAB) and lowest on Calcutta 4 (AA) (Table 5).

3.2. Banana Aphid and BBTD Occurrence on Musa Genotypes under Field Conditions

Abundance of Banana Aphid in the Field

In the field trial, there were also large differences among ploidy levels in apterous aphid densities, but, not for alate aphid densities (χ2 = 22.9, df = 2, p < 0.001 and χ2 = 5.6, df = 2, p = 0.06, respectively). After 36-months, apterous aphid densities were similar on triploids (10.7 ± 1.4) and tetraploids (10.7 ± 1.3). In case of the diploid genotypes, differences were observed among genotypes for apterous aphid densities (χ2 = 15.8, df = 8, p = 0.04) but not for alate aphids (χ2 = 12.1, df = 8, p = 0.15). The highest apterous aphid density was on Chuoi Man (AB), while the lowest was on Pisang Tongat (AA) (Table 6). In the triploid group, both apterous and alate aphid abundance differed among genotypes (χ2 = 40.5, df = 18, p = 0.002, χ2 = 39.9, df = 18, p = 0.002, respectively). The highest apterous aphid density was recorded on Batard (AAB), while the lowest was recorded on PITA 24 (AAB). On the other hand, alate aphid densities were considerably lower than apterous aphids on all the genotypes, and the highest density of alates was recorded on Essong (AAB), while the lowest was on Lep Chang Kut (BBB) (Table 7). In the tetraploids, significant differences were observed between genotypes for apterous aphid densities (χ2 = 34.8, df = 15, p = 0.003) but not for alate aphid densities (χ2 = 20.6, df = 15, p = 0.15); the highest apterous aphid density was on CRBP 39 (AAAB), while the lowest density was on CRBP 37 (AAAB) (Table 8). Analysis performed on 12 genotypes to sort out the best and the worst genotypes for aphid performance under field conditions, with two from each ploidy group with highest aphid densities and two with lowest aphid densities, showed large differences among the sorted genotypes for apterous aphid densities (χ2 = 27.7, df = 11, p = 0.004) and alate aphid densities (χ2 = 20.5, df = 11, p = 0.02). The highest apterous aphid densities were observed on Batard (AAB) and the lowest on Pisang Tongat (AA). The highest alate aphid densities were recorded on Essong (AAB) and the lowest were on Yagambi km5 (AAA) (Table 9).

3.3. Time to First BBTD Symptoms

On diploids, the genotype Chuoi Man (AB) presented the first BBTD symptoms at 2 MAP while it took 36 months to observe the first symptoms on Ney Poovan (AB) (Table 6). On triploids, the first BBTD symptoms were observed at 2 MAP on Waema (AAB), 3 MAP on Williams (AAA), and PITA 23 (AAB), while symptoms were observed only at 36 MAP on Fougamou (ABB) (Table 6). On tetraploids, BBTD symptoms were first observed at 3 MAP the AAAA genotypes Buccaneer, SH 3436-9, T6 (AAAA) and on FHIA 03 (AABB), and the latest at 26 MAP on CRBP 37 (AAAB) and 28 MAP on CRBP 535 (AAAB) (Table 7). Four genotypes—Calcutta 4 (AA), Balbissiana Los Banos (BB), PITA 21 (AAB), and Balonkawe (ABB)—did not show any BBTD symptoms at any time during the 36 months of the experiment.
Overall, latent BBTV infection was detected by PCR assays in asymptomatic plants of 13 genotypes, all ploidy considered at 36 MAP at the end of the experiment. Of the dipoids, BBTV was detected in 15.6% of the 45 leaf samples from Kunnan (AB), while the virus was not detected in any of the asymptomatic plants of other diploid genotypes (Table 6). On the triploid genotypes, the highest virus incidence (16.7% for total 6 plants tested) was detected in Williams (AAA); BBTV was not detected in the asymptomatic plants of Yagambi Km5 (AAA), the AAB genotypes (Batard, Ebang, Elat, Essong, Waema), Fougamou (ABB), Balonkawe (ABB), and Lep Chang Kut (BBB) (Table 7). On the tetraploids, 17.8% virus incidence (15 plants tested) was observed on SH 3436-6 (AAAA), while no virus was detected on the asymptomatic leaves of 12 genotypes, including the AAAA genotypes (BITA 2, Buccaneer, FHIA 23, T6), the AAAB (BITA 8, CRBP 37, CRBP 535, CRBP 568, FHIA 21, IRFA 908), FHIA 03 (AABB) (Table 8).

3.4. BBTD Incidence and Area under Disease Progress Curve (AUDPC)

No significant difference was observed among the ploidy levels for the disease incidence (df = 2, χ2 = 0.7, p = 0.7) and AUDPC (df = 2, χ2 = 0.9, p = 0.7). In the diploid group, significant differences were observed among genotypes for both BBTD incidence (χ2 = 19.6, df = 8, p = 0.01) and AUDPC (χ2 = 20.2, df = 8, p = 0.009). At 36 MAP, Tapo (AA) was the genotype with highest disease incidence—100% of the plants expressed BBTD symptoms. Tapo also had the highest AUDPC, which together with its disease incidence indicate that Tapo was the most susceptible genotype to BBTD. On the contrary, none of plants of the wild genotypes Calcutta 4 (AA) and Balbisiana Los Banos (BB) showed any BBTD symptoms at any time during the experiment (Table 6), which along with their virus-free status at 36 MAP indicate that these two genotypes are resistant to BBTD—at least for the duration of our experiment. In the triploids, significant differences were similarly observed among genotypes for BBTD incidence (χ2 = 32.2, df = 18, p = 0.02) and AUDPC (χ2 = 34.9, df = 18, p = 0.01); 66.7 % of plants of FHIA 25 (AAB) expressed BBTD symptoms, while no disease was observed on Balonkawe (ABB) and PITA 21 (AAB). Moreover, the highest AUDPC was observed on Yangambi Km5 (AAA) and FHIA 25, while the lowest was recorded on both Balonkawe (ABB) and PITA 21 (AAB) (Table 7). In the tetraploid group, there was no difference among genotypes for both disease incidence (χ2 = 19.5, df = 15, p = 0.2) and AUDPC (χ2 = 18.7, df = 15, p = 0.2) (Table 8).
Analysis performed on 12 genotypes sorted from the four divergent genotypes of each ploidy group (four from each ploidy group, two with highest AUDPC, and two with lowest AUDPC) showed significant differences among the sorted genotypes for disease incidence (χ2 = 26.9, df = 11, p = 0.005) and AUDPC (χ2 = 28.5, df = 11, p = 0.003), the highest disease incidence and AUDPC was recorded on the AA diploid Tapo, while the lowest incidence and AUDPC were recorded on Calcutta 4 (AA), Balbisiana Los Banos (BB), Balonkawe (ABB) and PITA 21 (AAB) (Table 10). Generally, at the field level, average BBTD incidence was 15.3, 26.1, and 34.1%, respectively, at 12, 24, and 36 MAP.

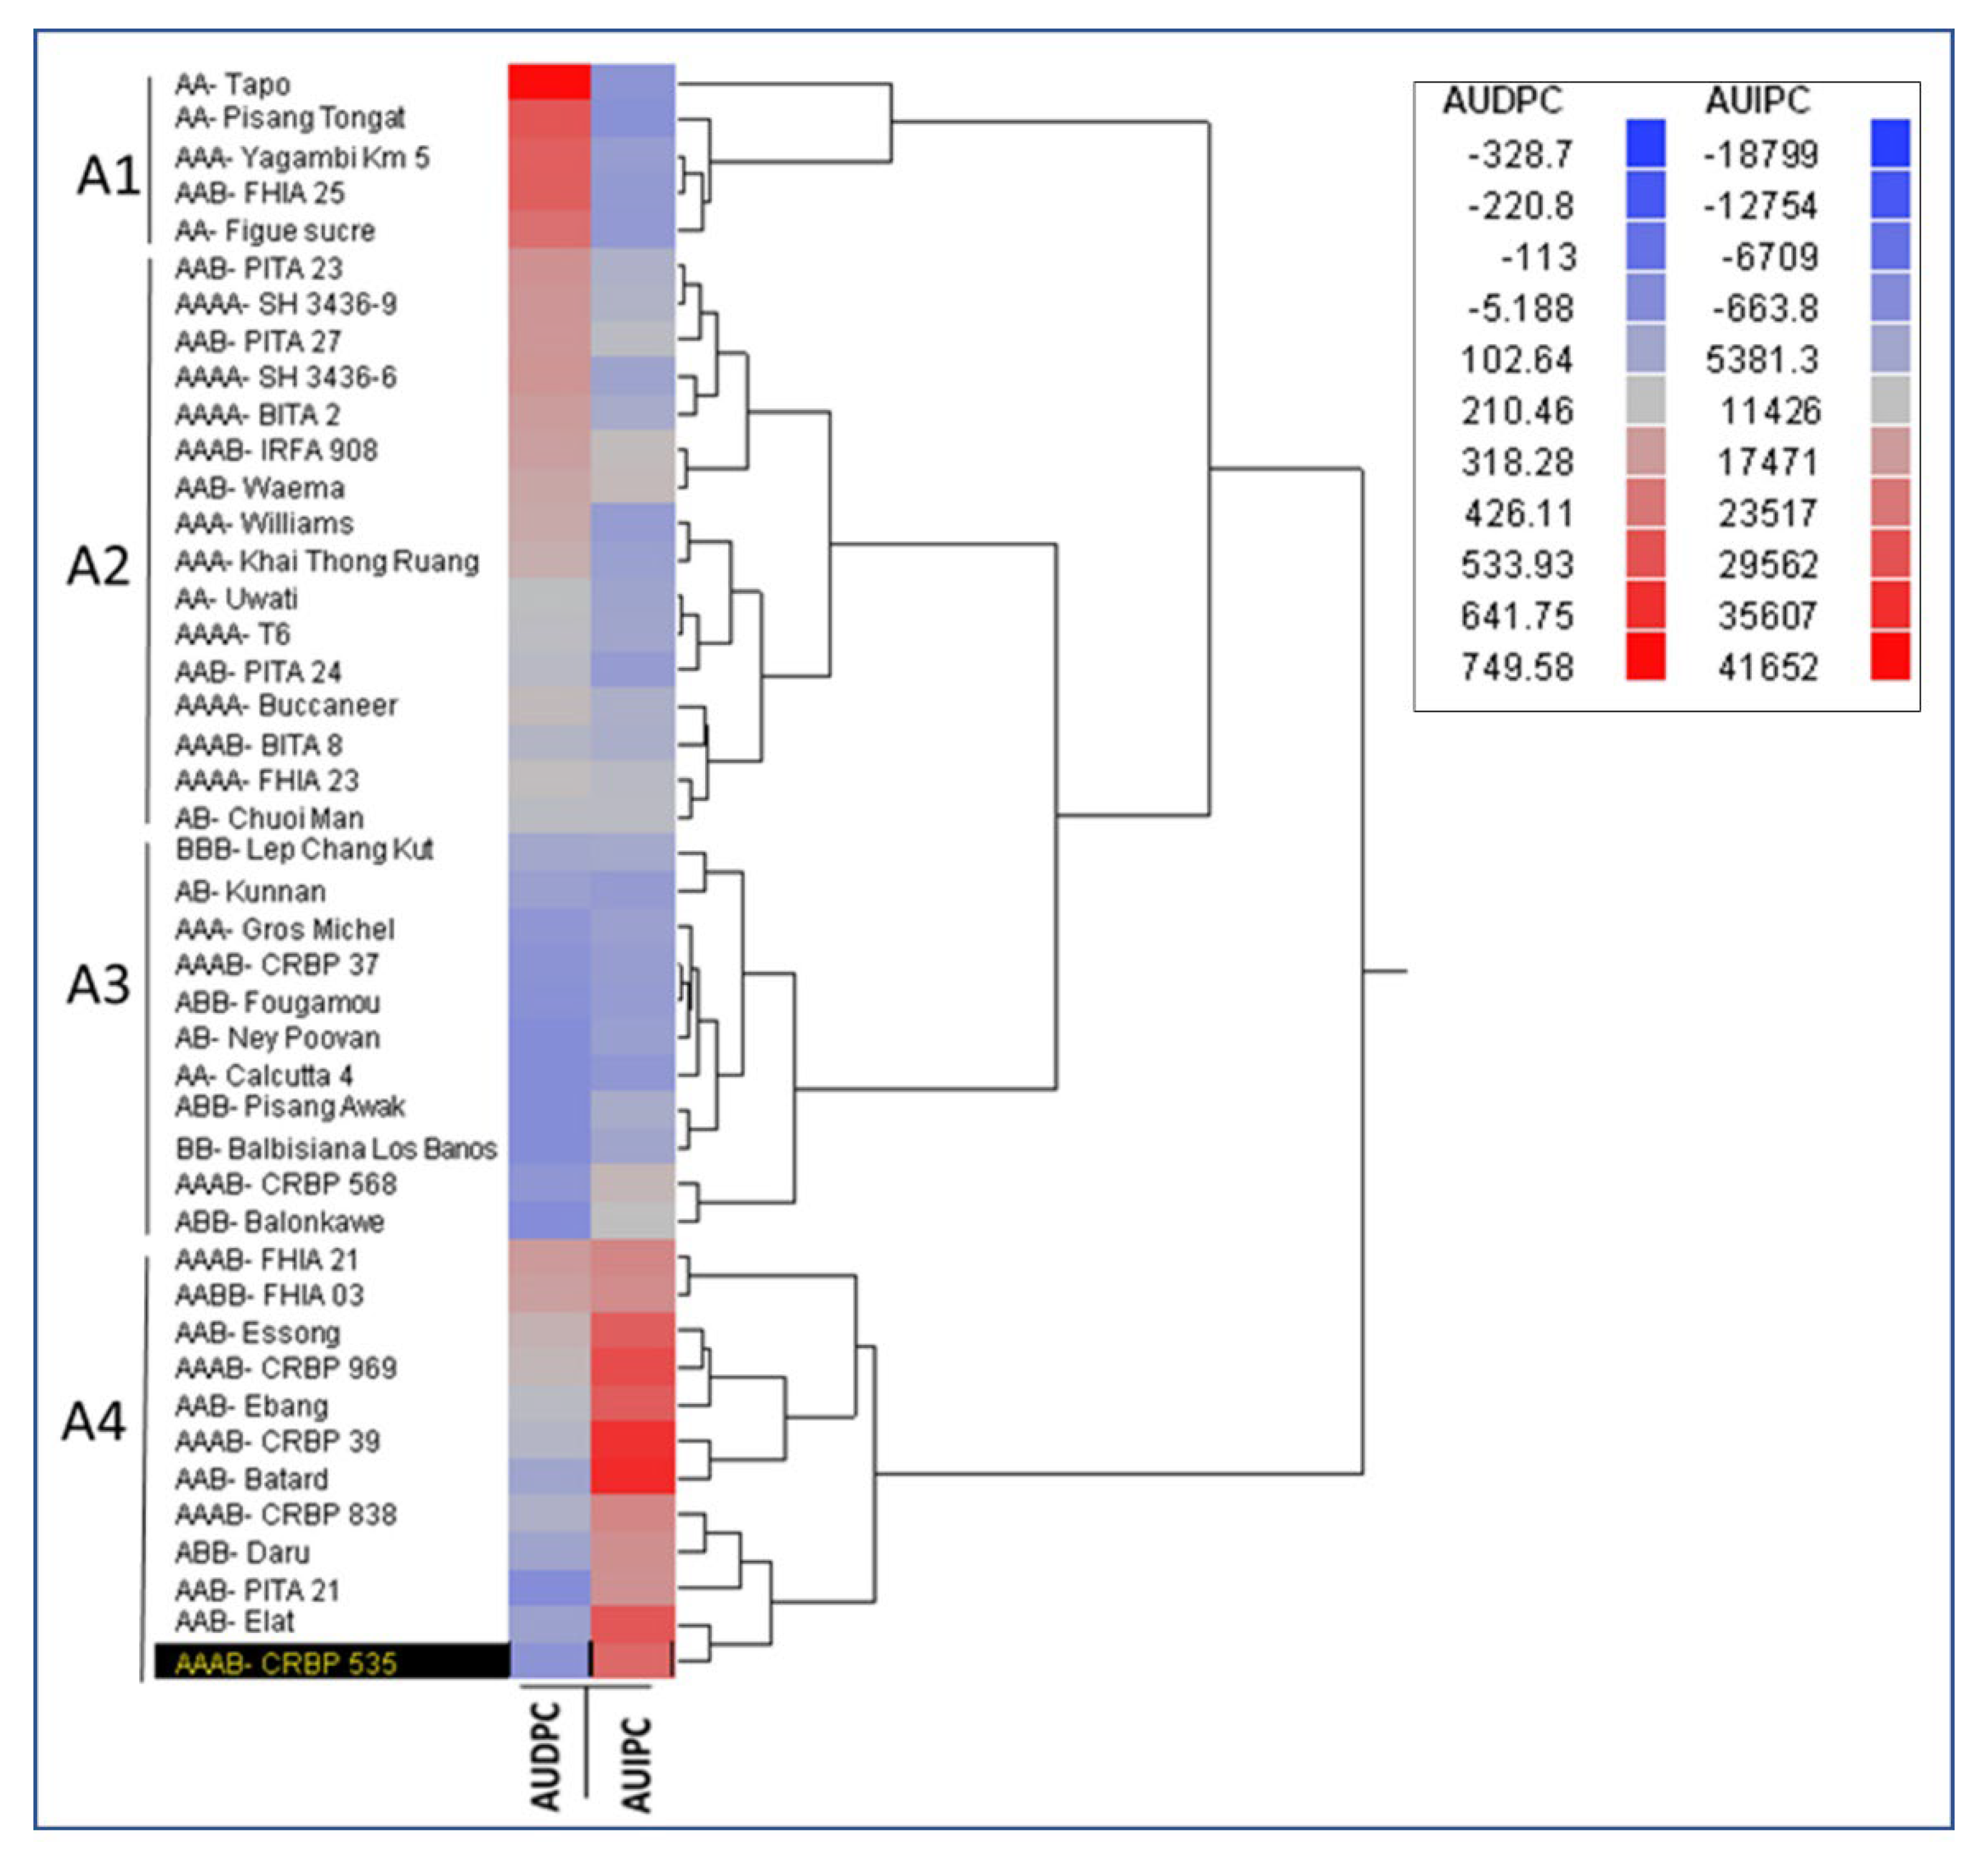
3.5. Classification of Musa Genotypes for the Response to Banana Aphid and BBTD in Field

The heatmap with hierarchical cluster showed that genotypes were clustered into four groups: A1, A2, A3, and A4 (Figure 2). All the five genotypes in group A1 were highly susceptible to BBTD and least susceptible to the banana aphid, including Figue Sucree (AA), Pisang Tongat (AA), Yangambi Km5 (AAA), and FHIA 25 (AAB). Group A2 included 18 genotypes of different genomic compositions, from moderate susceptibility to both BBTD and the banana aphid. Group A3 included 11 genotypes of different genomic compositions with least or slight susceptibility to both BBTD and banana aphid. Group A4 included 10 genotypes slightly susceptible to BBTD and highly susceptible to the banana aphid (Figure 2).

3.6. Correlation for Aphid Performance in Screenhouse and Field

There was a positive and moderately high correlation between screenhouse and field aphid densities on each of the 34 genotypes present both in the screenhouse and the field (r = 0.529, p = 0.001). The genotypes with the highest aphid densities, in both screenhouse and field trials, were from the AAB genomic group followed by the AAAB group, while the lowest aphid densities occurred on the AA genomic group in both the screenhouse and the field (Table S1).

4. Discussion

Most banana cultivars originated from intraspecific or interspecific hybridization between wild diploid M. acuminata (A-genome, 2n = 22) and M. balbisiana (B-genome, 2n = 22) species of section Eumusa, including diploid (AA, BB and AB), triploid (AAA, AAB and ABB), and tetraploid (AAAB, AABB, ABBB) variants [35]. This study showed that in the screenhouse and the field trials, there was a wide variation in the performance of banana aphids on the Musa genotypes with different A and B genome composition and ploidy levels. In the screenhouse, aphid densities on triploid and tetraploid genotypes were higher than on diploid genotypes. The rates of aphid population growth were faster and reached higher densities on two AAB triploids, Waema and Ebang, than any other genotype. Aphid densities under field conditions were relatively lower than in the screenhouse, but the trend of banana aphid performance on Musa genotypes was similar under both screenhouse and field conditions. For instance, the AAB triploids Batard, Ebang, Essong, and Elat and the AAAB tetraploid hybrids CRBP 39, CRBP 969, and CRBP 535 were highly suitable to banana aphid population growth, resulting in the highest aphid densities both under field and screenhouse conditions. Aphid densities were lowest (about 10-fold lower population) on AA diploid genotypes Pisang Tongat, Figue Sucree, and Calcutta 4 compared with AAB and AAAB genotypes under field conditions. In general, aphids were more abundant on triploid and tetraploid genotypes combining both A and B genomes (AAB, AAAB) than on those combining only A (AA or AAA) or only B (BB and BBB) genomes. Only one genotype, Yawa 2, evaluated in this study corresponds to the ABBT group, which is a natural cross of section Musa (Eumusa) (AA and BB) × section Australimusa (TT). This genotype under screenhouse evaluation supported high densities of banana aphids, but the genotype was not assessed under field conditions due to insufficient planting material.
Further studies are necessary to understand the underlying factors contributing to the differential aphid establishment rates in relation to host genomic composition. One aspect of investigation should focus on the thickness of epicuticular wax on leaf- petiole, and pseudostem. For instance, a thick epicuticular wax was reported to increase resistance to black Sigatoka of banana [36]. Several studies have shown that successful aphid colonization and performance are affected by multiple factors, including (i) chemical content of the sap (e.g., nitrogen and carbon levels, and free-amino-acid composition in sap) [37,38]; (ii) defensive compounds that reduce aphid feeding and multiplication rate [39]; (iii) plant physical properties, which serve as barriers to feeding and growth (e.g., leaf pubescence, smoothness or roughness of leaves, the presence of trichomes or the shape and color of the leaves) [40]; (iv) leaf and plant color, which affect attractiveness and landing behavior [41]; and (v) chemical cues affecting landing decision [42,43]. Further studies should consider comparisons of the physical and chemical properties of Musa genotypes supporting low and high aphid population densities to understand the mechanisms contributing differential rate of establishment and population growth on different Musa genotypes evaluated in this study.
As observed for most aphid species, apterous banana aphids were more abundant than alates in both the screenhouse and the field. Owing to their higher mobility, alates play a major role in the horizontal transmission of BBTV within and between the fields. Alate abundance is generally linked to increasing density of apterous forms. Consequently, a Musa genotype that supports the establishment of high densities of banana aphids poses an increased risk for the horizontal spread of BBTV and heightens virus spread in the field. In the field trial of this study, Musa genotypes with high BBTD incidence did not support relatively high numbers of alate aphids, and the genotypes with high alate populations were moderately affected by BBTV. Plant viruses are known to induce specific changes in the host plant, modifying the behavior of its vector, which may favor or impair virus transmission. A similar observation was made in a recent study that demonstrated differential emissions of volatile organic compounds (VOCs) by healthy and BBTV-infected banana plants of Williams (AAA) and a Pacific triploid (AAB) plantain [42]. Relatively higher VOCs detected in the BBTV-infected plants were attributed to a stronger attraction to alate and apterous banana aphids than in uninfected plants [42]. The diversity and concentration of VOCs were greater in the AAB plantain than in AAA Williams, which implies differential production of VOCs depending on the genomic composition.
The Musa genotypes evaluated in the field showed large variations in BBTD incidence ranging from 0 to 100%. BBTD expression varied significantly with Musa genotypes, with the highest AUDPC on the AA diploid Tapo, which conversely was among the genotypes with low aphid densities. This was followed by two AA diploids, Pisang Tongat and Figue Sucree; and two triploids, FHIA 25 (AAB) and Yangambi Km 5 (AAA). Generally, genotypes with only A genome (AA and AAA genomic groups) were more susceptible to BBTV infection, except for the wild diploid Calcutta 4 (AA), which was not infected after 36 months of exposure in the field, compared with genotypes with B genome. In regard to the genotypes with both A and B genomes, triploids can be found throughout the BBTV susceptibility spectrum; for example, the triploid FHIA 25 (AAB) was highly susceptible while PITA 21 (AAB) and Balonkawe (ABB) remained uninfected after 36 MAP in the field. In general, genotypes with more than one copy of the B genome (BB, BBB, ABB, and AABB) showed less susceptibility (0 to <20% incidence) to BBTV infection. For instance, low infection was recorded on the ABB triploids Daru, Pisang Awak, Fougamou, and BBB triploid, Lep Chang Kut. No infection was recorded on the wild diploid Balbisiana Los Banos (BB) and the triploid Balonkawe (ABB). This leads to the hypothesis that Musa genotypes with two or more copies of the B genome possess better tolerance to BBTV infection. However, the exception was the synthetic hybrid FHIA 03 (AABB), which despite having two sets of BB chromosomes showed a relatively high BBTD incidence (62.5%). Another genotype, the synthetic hybrid PITA 21 (AAB), despite having only one copy of the B chromosome, showed a very high tolerance to BBTV infection. Musa genomic studies can shed light on the potential role of the B genome in banana resistance to BBTD. The observations on BBTD occurrence on some of the genotypes in this study corroborate with previous studies [28,29].
Wild genotypes often harbour some traits linked to resistance to disease and/or pests, as observed in the present studies with Balbisiana Los Banos (BB) and Calcutta 4 (AA). The diploid Calcutta 4 is known to be resistant to black leaf streak disease (BLSD) caused by Mycosphaerella fijiensis [44]. Calcutta 4 (AA) has been used extensively in Musa breeding as a source of black Sigatoka and BLSD resistance [44] and for its partial resistance to banana weevil [45]. Calcutta 4 has also been reported as resistant to some races of Fusarium oxysporum f. sp. cubense in subtropical Australia [46], and M. balbisiana accessions have shown resistance to Xanthomonas wilt in a greenhouse trial [47]. The B genome is also known to confer some drought resistance in Musa genotypes [48]. The four genotypes—Calcutta 4 (AA), Balbisiana Los Banos (BB), PITA 21 (AAB), and Balonkawe (ABB)—that showed high tolerance to BBTV infection are of interest for breeding programs. PITA 21, a plantain hybrid developed by IITA and resistant to BLSD, is among hybrids grown by farmers in at least four countries in Africa, including Cameroon and Nigeria [49], where BBTD is present. Balonkawe is a traditional landrace widely used in the Philippines. Both PITA 21 and Balonkawe can be used to broaden sources of resistance to BBTV. However, further research is necessary to assess the robustness of resistance by experimental inoculation of these plants with viruliferous aphids under controlled conditions.
The grouping based on reaction to banana aphid and BBTD identified a group of five genotypes that are highly susceptible to BBTD and less susceptible to the banana aphid, including Tapo, Pisang Tongat, Figure sucre, Yagambi Km5, and FHIA 25. The second group of 10 genotypes, Batard, Essong, Ebang, Elat, PITA 21, CRBP 39, CRBP 535, CRBP 838, CRBP 969, and Daru, were less susceptible to BBTD and highly susceptible to the banana aphid. These groupings indicate that BBTD incidence is a genotype trait and is not positively related to aphid abundance on a genotype [29]. Although aphids were found on PITA 21 (AAB), Balonkawe (ABB), Calcutta 4 (AA), and Balbisiana Los Banos (BB), these genotypes were free of BBTV at 36 MAP in a BBTV endemic area. The lack of BBTV infection on these four genotypes could result from cases where aphids fed on them may not have been viruliferous, or the plants were difficult to infect by aphid inoculation. However, considering the establishment of the trial in a BBTV hotspot, with high levels of inoculum in the vicinity and the presence of spreader plants (BBTV symptomatic plants), and the same banana aphid population moving randomly in the field, there is a high probability that viruliferous aphids would have spread onto the plants of these four genotypes. However, due to evidently high tolerance, the plants remained uninfected. These genotypes may be resistant to virus inoculation. Hooks et al. [5] stated that despite susceptibility to BBTV, some banana cultivars have some resistance to virus inoculation by the banana aphid. Further experimental inoculation with viruliferous aphids is important to understand the reason for the uninfected status of these genotypes, even after prolonged exposure to BBTV in an endemic location.

5. Conclusions

Musa genotypes evaluated in this study exhibited differential reactions to the banana aphid under screenhouse and field conditions. Aphid densities were higher on triploid and tetraploid genotypes containing both A and B genomes than those combining only A (AA or AAA) or B (BB and BBB) genomes. Similarly, genotypes responded differently to BBTD. In general, Musa genotypes with two copies of the B genome showed high tolerance to BBTV, and none of the plants of four genotypes [PITA 21 (AAB), Balonkawe (ABB), Calcutta 4 (AA), and Balbisiana Los Banos (BB)] were infected by BBTV after 36 months of exposure to BBTV inoculum in the field. These genotypes could be used as a source of resistance for breeding BBTV-resistant hybrids. Further studies are necessary to elucidate the underlying mechanisms contributing to the reduced susceptibility to banana aphid and BBTV.

Supplementary Materials

The following supporting information can be downloaded at: https://www.mdpi.com/article/10.3390/plants11091206/s1, Table S1: Summary of Musa genotype response to banana aphid (Pentalonia nigronervosa) and banana bunchy top disease (BBTD) under screenhouse and field conditions.

Author Contributions

Conceptualization, S.N., R.H., P.L.K. and R.T.G.; methodology, S.N., R.H. and P.L.K.; investigation, S.N., J.L., S.P.K.N., A.C.E., A.F.K., K.K.M.F. and P.L.K.; data analysis, S.N., J.L., S.K., S.N.N. and K.K.M.F.; funding acquisition, P.L.K., R.H., K.K.M.F. and. B.N.; first draft was prepared by S.N., P.L.K., R.H. and K.K.M.F. All authors have read and agreed to the published version of the manuscript.

Funding

This research was undertaken as part of the ALLIANCE for BBTV Control in Africa initiative managed by the International Institute of Tropical Agriculture (IITA), funded by the CGIAR Research Program on Roots, Tubers and Bananas (RTB), supported by CGIAR Trust Fund contributors; and the University of Queensland Project on “BBTV mitigation: Community Management in Nigeria and Screening Wild Banana Progenitors for Resistance (OPP1130226)”, supported by the Bill & Melinda Gates Foundation (BMGF), including the open access publication fees under the grant conditions of the Foundation. A Creative Commons Attribution 4.0 Generic License has been assigned by the Foundation to the author-accepted manuscript version that might arise from this submission.

Data Availability Statement

Datasets generated during the study is available online: https://doi.org/10.25502/8107-0255/d (accessed on 28 March 2022), and the data summary presented in Supplementary Table S1.

Acknowledgments

We thank the International Transit Centre (ITC) for Musa germplasm, Leuven, Belgium, and the Centre Africain de Recherches sur Bananiers et Plantains (CARBAP), Cameroon for providing genotypes used in this study. Part of this research is included in the Ph.D. thesis of the senior author at the University of Dschang, Cameroon.

Conflicts of Interest

The authors declare no conflict of interest.

References

  1. FAO. Banana Market Review Preliminary Results 2020; FAO: Rome, Italy, 2021; 21, Available online: https://www.fao.org/3/cb5150en/cb5150en.pdf (accessed on 8 February 2022).
  2. Hooks, C.R.R.; Wright, M.G.; Kabasawa, D.S.; Manandhar, R.; Almeida, R.P.P. Effect of banana bunchy top virus infection on morphology and growth characteristics of banana. Ann. Appl. Biol. 2008, 153, 1–9. [Google Scholar] [CrossRef]
  3. Kumar, P.L.; Selvarajan, R.; Iskra-Caruana, M.L.; Chabannes, M.; Hanna, R. Biology, etiology, and control of virus diseases of banana and plantain. Adv. Vir. Res. 2015, 91, 229–269. [Google Scholar] [CrossRef]
  4. Dale, J.L. Banana bunchy top: An economically important tropical plant virus disease. Adv. Virus Res. 1987, 33, 301–325. [Google Scholar] [CrossRef]
  5. Hooks, C.R.R.; Manandhar, R.; Perez, E.P.; Wang, K.H.; Almeida, R.P.P. Comparative susceptibility of two banana cultivars to banana bunchy top virus under laboratory and field environments. J. Econ. Entomol. 2009, 102, 897–904. [Google Scholar] [CrossRef] [PubMed]
  6. Kumar, P.L.; Hanna, R.; Alabi, O.J.; Soko, M.M.; Oben, T.T.; Vangu, G.H.P.; Naidu, R.A. Banana bunchy top virus in sub-Saharan Africa: Investigations on virus distribution and diversity. Virus Res. 2011, 159, 171–182. [Google Scholar] [CrossRef] [PubMed]
  7. Qazi, J. Banana bunchy top virus and the bunchy top disease. J. Gen. Plant Pathol. 2016, 82, 2–11. [Google Scholar] [CrossRef]
  8. Eastop, V.F. A taxonomic study of australian aphidoidea (Homoptera). Aust. J. Zool. 1965, 14, 399–592. [Google Scholar] [CrossRef]
  9. Foottit, R.G.; Maw, H.E.L.; Pike, K.S.; Miller, R.H. The identity of Pentalonia nigronervosa Coquerel and P. caladii van der Goot (Hemiptera: Aphididae) based on molecular and morphometric analysis. Zootaxa 2010, 2358, 25–38. [Google Scholar] [CrossRef]
  10. Watanabe, S.; Greenwell, A.M.; Bressan, A. Localization, concentration, and transmission efficiency of banana bunchy top virus in four asexual lineages of Pentalonia aphids. Viruses 2013, 5, 758–776. [Google Scholar] [CrossRef] [Green Version]
  11. Hamim, I.; Green, J.C.; Borth, W.B.; Melzer, M.J.; Wang, Y.N.; Hu, J.S. First report of banana bunchy top virus in Heliconia spp. on Hawaii. Plant Dis. 2017, 101, 2153. [Google Scholar] [CrossRef]
  12. Rahayuniati, R.F.; Hartono, S.; Somowiyarjo, S.; Subandiyah, S.; Thomas, J.E. Characterization of banana bunchy top virus on Sumatra (Indonesia) wild banana. Biodivers. J. Biol. Divers. 2021, 22, 1243–1249. [Google Scholar] [CrossRef]
  13. Hu, J.S.; Wang, M.; Sether, D.; Xie, W.; Leonhardt, K.W. Use of polymerase chain reaction (PCR) to study transmission of banana bunchy top virus by the banana aphid (Pentalonia nigronervosa). Ann. Appl. Biol. 1996, 128, 55–64. [Google Scholar] [CrossRef]
  14. Anhalt, M.D.; Almeida, R.P.P. Effect of temperature, vector life stage, and plant access period on transmission of Banana bunchy top virus to banana. Phytopathology 2008, 98, 743–748. [Google Scholar] [CrossRef] [PubMed] [Green Version]
  15. Magee, C.J.P. Investigation on the bunchy top disease of the banana. Bull. Counc. Sci. Ind. Res. Aust. 1927, 30, 64. [Google Scholar]
  16. Smith, M.C.; Holt, J.; Kenyon, L.; Foot, C. Quantitative epidemiology of Banana Bunchy Top Virus Disease and its control. Plant Pathol. 1998, 47, 177–187. [Google Scholar] [CrossRef]
  17. Allen, R.N. Epidemiological factors influencing the success of roguing for the control of bunchy top disease of bananas in New South Wales. Aust. J. Agric. Res. 1978, 29, 535–544. [Google Scholar] [CrossRef]
  18. Robson, J.D.; Wright, M.G.; Almeida, R.P.P. Effect of imidacloprid foliar treatment and banana leaf age on Pentalonia nigronervosa (Hemiptera, Aphididae) survival. N. Z. J. Crop Hortic. Sci. 2007, 35, 415–422. [Google Scholar] [CrossRef]
  19. Abiola, A.; Zandjanakou-Tachin, M.; Aoudji, K.N.A.; Avocevou-Ayisso, C.; Kumar, P.L. Adoption of roguing to contain banana bunchy top disease in south-east Bénin: Role of farmers’ knowledge and perception. Int. J. Fruit Sci. 2020, 20, 720–736. [Google Scholar] [CrossRef]
  20. Nkengla-Asi, L.; Eforuoku, F.; Olaosebikan, O.; Ladigbolu, T.A.; Amah, D.; Hanna, R.; Kumar, P.L. Gender roles in sourcing and sharing of banana planting material in communities with and without banana bunchy top disease in Nigeria. Sustainability 2021, 13, 3310. [Google Scholar] [CrossRef]
  21. Metcalf, R.L.; Luckmann, W.H. Introduction to Insect Pest Management; John Wiley & Sons, Inc.: New York, NY, USA, 1994; 672. [Google Scholar]
  22. Jones, R.A.C. Control of Plant Virus Diseases. Adv. Virus Res. 2006, 67, 205–244. [Google Scholar]
  23. Rodrigues, S.P.; Lindsey, G.G.; Bueno Fernandes, P.M. Biotechnological approaches for plant virus resistance: From general to the modern RNA silencing pathway. Braz. Arch. Biol. Technol. 2009, 52, 795–808. [Google Scholar] [CrossRef]
  24. Hill, J.H.; Whitham, S.A. Control of virus diseases in soybeans. Adv. Vir. Res. 2014, 90, 355–390. [Google Scholar] [CrossRef]
  25. Nicaise, V. Crop immunity against viruses: Outcomes and future challenges. Front. Plant Sci. 2014, 5, 660. [Google Scholar] [CrossRef] [PubMed]
  26. Schädler, M.; Brandl, R.; Kempel, A. Host plant genotype determines bottom-up effects in an aphid-parasitoid-predator system. Entomol. Exp. Appl. 2010, 135, 162–169. [Google Scholar] [CrossRef]
  27. Hapsari, L.; Masrum, A. Preliminary screening resistance of Musa germplasms for banana bunchy top disease in Purwodadi Botanic Garden, Pasuruan, East Java. Bul. Kebun Raya 2012, 15, 57–70. [Google Scholar]
  28. Espino, R.C.; Magnaye, L.V.; Johns, A.P.; Juanillo, C. Evaluation of Philippine banana cultivars for resistance to bunchy top and fusarium wilt. In Proceedings of the International Symposium on Recent Developments in Banana Cultivation Technology, Pingtung, Taiwan, 14–18 December 1992; Valmayor, R.V., Hwang, S.C., Ploetz, R., Lee, R.C., Roa, N.V., Eds.; INIBAP/ASPNET: Los Baños, Philippines, 1993; pp. 89–102. [Google Scholar]
  29. Ngatat, S.; Hanna, R.; Kumar, P.L.; Gray, S.M.; Cilia, M.; Ghogomu, R.T.; Fontem, D.A. Relative susceptibility of Musa genotypes to banana bunchy top disease in Cameroon and implication for disease management. Crop Prot. 2017, 101, 116–122. [Google Scholar] [CrossRef]
  30. Blackman, R.L.; Eastop, V.F. Aphids on World’s Crops: An Identification and Information Guide, 2nd ed.; Wiley: Chichester, UK, 2000. [Google Scholar]
  31. Robson, J.D.; Wright, M.G.; Almeida, R.P.P. Within-plant distribution and binomial sampling of Pentalonia nigronervosa (Hemiptera: Aphididae) on banana. J. Econ. Entomol. 2006, 99, 2185–2190. [Google Scholar] [CrossRef] [Green Version]
  32. Hanna, R.; Kumar, P.L. Banana aphid and banana bunchy top virus in Africa: Distribution and development of management options. In Proceedings of the Annual Meeting of the Entomological Society of America, Indianapolis, IN, USA, 13–16 December 2009. [Google Scholar]
  33. Shaner, G.; Finney, R. The effect of nitrogen fertilization on the expression of slow-mildewing resistance in knox wheat. Phytopathology 1977, 77, 1051. [Google Scholar] [CrossRef] [Green Version]
  34. Shapiro, S.S.; Wilk, M.B. An analysis of variance test for normality (complete samples). Biometrika 1965, 52, 591. [Google Scholar] [CrossRef]
  35. Wang, Z.; Miao, H.; Liu, J.; Xu, B.; Yao, X.; Xu, C.; Zhao, S.; Fang, X.; Jia, C.; Wang, J.; et al. Musa balbisiana genome reveals subgenome evolution and functional divergence. Nat. Plants 2019, 5, 810–882. [Google Scholar] [CrossRef] [Green Version]
  36. Mobambo, K.N.; Pasberg-Gauhl; Gauhk, F.; Zuofa., K. Criblage précoce pour la résistance à la maladie des raies noires ou cercosporiose noire en conditions d’inoculation naturelle (Early screening for black leaf streak/black Sigatoka disease resistance under natural inoculation conditions). InfoMusa 1994, 3, 14–16. [Google Scholar]
  37. Karley, A.J.; Douglas, A.E.; Parker, W.E. Amino acid composition and nutritional quality of potato leaf phloem sap for aphids. J. Exp. Biol. 2002, 205, 3009–3018. [Google Scholar] [CrossRef] [PubMed]
  38. Powell, G.; Tosh, C.R.; Hardie, J. Host plant selection by aphids: Behavioral, evolutionary, and applied perspectives. Annu. Rev. Entomol. 2006, 51, 309–330. [Google Scholar] [CrossRef] [PubMed]
  39. Meihls, L.N.; Handrick, V.; Glauser, G.; Barbier, H.; Kaur, H.; Haribal, M.M.; Lipka, A.E.; Gershenzon, J.; Buckler, E.S.; Erb, M.; et al. Natural variation in maize aphid resistance is associated with 2,4-dihydroxy-7-methoxy-1,4-benzoxazin-3-one glucoside methyltransferase activity. Plant Cell 2013, 25, 2341–2355. [Google Scholar] [CrossRef] [Green Version]
  40. Awmack, C.S.; Leather, S.R. Host plant quality and fecundity in herbivorous insects. Annu. Rev. Entomol. 2002, 47, 817–844. [Google Scholar] [CrossRef]
  41. Döring, T.F.; Chittka, L. Visual ecology of aphids—A critical review on the role of colours in host finding. Arthropod-Plant. Interact. 2007, 1, 3–16. [Google Scholar] [CrossRef] [Green Version]
  42. Murhububa, I.S.; Tougeron, K.; Bragard, C.; Fauconnier, M.-L.; Basengere, E.B.; Masamba, J.W.; Hance, T. Banana tree infected with banana bunchy top virus attracts Pentalonia nigronervosa aphids through increased volatile organic compounds emission. J. Chem. Ecol. 2021, 47, 755–767. [Google Scholar] [CrossRef]
  43. Pickett, J.A.; Birkett, M.A.; Bruce, T.J.A.; Chamberlain, K.; Gordon-Weeks, R.; Matthes, M.C.; Napier, J.A.; Smart, L.E.; Woodcock, C.M. Developments in aspects of ecological phytochemistry: The role of cis-jasmone in inducible defence systems in plants. Phytochemistry 2007, 68, 2937–2945. [Google Scholar] [CrossRef]
  44. Carlier, J.; De Waele, D.; Escalant, J.-V.; Vezina, A.; Picq., C. Global Evaluation of Musa Germplasm for Resistance to Fusarium Wilt, Mycosphaerella Leaf Spot Diseases and Nematodes: In-dept Evaluation; INIBAP Technical Guidelines No. 6; INIBAP: Montpellier, France, 2002; 64, Available online: https://hdl.handle.net/10568/105201 (accessed on 1 March 2022)ISBN 978-2-910810-52-8.
  45. Fogain, R.; Price, N.S. Varietal screening of some Musa cultivars for susceptibility to the banana weevil, Cosmopolites sordidus (Coleoptera: Curculionidae). Fruits 1994, 49, 247–251. [Google Scholar]
  46. Jones, D.R. (Ed.) Diseases of Banana, Abacá and Enset; CABI: Wallingford, UK, 2000; ISBN 0-85199-355-9. [Google Scholar]
  47. Tripathi, L.; Odipio, J.; Tripathi, J.N.; Tusiime, G. A rapid technique for screening banana cultivars for resistance to Xanthomonas wilt. Eur. J. Plant Pathol. 2008, 121, 9–19. [Google Scholar] [CrossRef]
  48. Ravi, I.; Uma, S.; Vaganan, M.M.; Mustaffa, M.M. Phenotyping bananas for drought resistance. Front. Physiol. 2013, 4, 9. [Google Scholar] [CrossRef] [PubMed] [Green Version]
  49. Tenkouano, A.; Swennen, R.L. Plantain and banana: Progress in breeding and delivering improved plantain and banana to African farmers. Chron. Hortic. 2004, 44, 9–15. [Google Scholar]
Figure 1. (A) The lower part of the pseudostem of a banana shoot used for aphid counting in the field trial; inset: banana aphids on pseudostem. (B) Musa plant with typical bunchy top disease symptoms in the field.
Plants 11 01206 g001
Figure 2. Heatmap and hierarchical cluster analysis dendrogram of the 44 Musa genotypes evaluated based on area under disease pressure-curve (AUDPC) values of banana bunchy top disease (BBTD) and area under infestation progress-curve (AUIPC) values of banana aphids (Pentalonia nigronervosa) obtained after 36 months of evaluation in a field trial. The range of AUDPC and AUIPC values is given in the inset. Accessions in the A1 cluster are highly susceptible to BBTD and least preferred by banana aphids, accessions in the A4 cluster are highly susceptible to banana aphids, and accessions in the A3 cluster are resilient to BBTD and banana aphids.
Plants 11 01206 g002
Table 1. The list of Musa genotypes evaluated against BBTV and banana aphid, Pentalonia nigronervosa.
Ploidy LevelGenomic GroupGenotype Source
DiploidAACalcutta 4ITC
Figue SucréeITC
Pisang TongatITC
UwatiITC
TapoITC
ABNey PoovanITC
Auko *ITC
Vunapope *ITC
KunnanITC
Chuoi ManITC
BBBalbisiana Los BanosITC
TriploidAAAGros MichelITC
Khai Thong RuangITC
Yangambi Km5ITC
WilliamsIITA
AABBatard #IITA
EbangIITA
Elat #IITA
EssongIITA
FHIA 25IITA
PITA 21IITA
PITA 23IITA
PITA 24 #IITA
PITA 27 #IITA
WaemaITC
ABBIce cream *ITC
Pisang AwakITC
BalonkaweITC
DaruITC
Fougamou #IITA
BBBLep Chang KutITC
TetraploidAAAAT6ITC
BuccaneerITC
SH3436-9ITC
SH3436-6ITC
FHIA 23IITA
BITA-2ITC
AAABBITA 8 #IITA
IRFA 908ITC
FHIA-21ITC
CRBP 37ITC
CRBP 39ITC
CRBP 568 #CARBAP
CRBP 535 #CARBAP
CRBP 838 #CARBAP
CRBP 969 #CARBAP
AABBFHIA-03ITC
ABBTYawa 2 *ITC
* Genotypes evaluated only in the screenhouse experiment. # Genotypes evaluated only in the field experiment. IITA = International Institute of Tropical Agriculture; ICT = International Transit Center; CARBAP = African Center for Banana and Plantain Research.
Table 2. Apterous and alate banana aphid abundance (mean ± SE) on diploid genotypes for nine weeks after experimental infestation under screenhouse conditions.
Genomic GroupGenotypeApterous Aphid AbundanceAlate Aphid Abundance
AACalcutta 49.7 ± 4.6 a0 a
AAFigue sucrée120.9 ± 35.5 a1.3 ± 0.2 a
AAPisang Tongat73.2 ± 16.6 a2.1 ± 1.0 a
AATapo58.4 ± 20.6 a4.1 ± 3.3 a
AAUwati82.8 ± 28.9 a1.0 ± 0.6 a
ABAuko118.3 ± 48.4 a0 a
ABChuoi Man40.3 ± 19.9 a0.2 ± 0.2 a
ABKunnan136.7 ± 66.6 a2.9 ± 1.4 a
ABNey Poovan17.9 ± 7.5 a0.1 ± 0.0 a
ABVunapope67.4 ± 23.8 a2.8 ± 2.1 a
BBBalbisiana111.4 ± 18.4 a0.2 ± 0.2 a
Chisq 17.6613.9
df 1010
p 0.060.17
Means with the same letter in a column are not significantly different (Bonferroni test, p = 0.05).
Table 3. Apterous and alate banana aphid abundance (mean ± SE) on triploid genotypes for nine weeks after experimental infestation under screenhouse conditions.
Genomic GroupGenotypeApterous Aphid AbundanceAlate Aphid Abundance
AAAGros Michel115.6 ± 55.8 ab2.9 ± 2.8 ab
AAAKhai Tang Wang86.7 ± 34.8 ab1.0 ± 0.8 ab
AAAWilliam79.5 ± 18.3 ab2.7 ± 1.4 ab
AAAYangambi Km580.3 ± 9.3 ab0 b
AABEbang366.1 ± 24.7 ab34.7 ±11.7 a
AABEssong262.3 ± 49.3 ab22.0 ± 8.4 a
AABFHIA 25138.9 ± 43.9 ab2.1 ± 1.2 ab
AABPITA 2396.8 ± 13.6 ab2.6 ± 0.6 ab
AABWaema521.0 ± 126.0 a31.8 ± 8.1 a
ABBDaru114.2 ± 43.3 ab6.5 ± 5.2 ab
ABBFougamou124.9 ± 56.1 ab3.4 ± 2.0 ab
ABBIce Cream63.5 ± 5.9 b0.5 ± 0.3 ab
ABBPisang Awak117.9 ±25.7 ab6.8 ± 3.0 ab
ABBBalonkawe97.7 ± 44.1 ab0.3 ± 0.3 b
BBBLep Chang Kut64.6 ± 22.0 ab0.1 ± 0.0 b
Chisq 24.3832.22
df 1414
p 0.040.004
Means with the same letter in a column are not significantly different (Bonferroni test, p = 0.05).
Table 4. Apterous and alate banana aphid (mean ± SE) on tetraploid genotypes for 9 weeks after experimental infestation under screenhouse conditions.
Genomic GroupGenotypeApterous Aphid AbundanceAlate Aphid Abundance
AAAABITA 2190.4 ± 34.6 ab8.0 ± 4.4 ab
AAAABuccaneer153.0 ± 35.6 ab2.5 ± 0.5 ab
AAAAFHIA 23101.6 ± 38.9 ab1.3 ± 1.0 b
AAAASH 3436-6117.0 ± 14.6 ab0.3 ± 0.1 b
AAAASH 3436-990.0 ± 34.8 ab0.6 ± 0.4 b
AAAAT650.7 ± 11.0 b0.3 ± 0.2 b
AAABCRBP 3782.1 ± 7.8 b0.6 ± 0.4 b
AAABCRBP 39115.5 ± 18.2 ab3.9 ± 1.8 ab
AAABFHIA 21167.2 ± 55.1 ab5.6 ± 2.7 ab
AAABIRFA 908153.1 ± 25.2 ab7.4 ± 3.9 ab
AABBFHIA 03327.0 ± 40.1 a27.3 ± 6.6 a
ABBTYawa 2128.8 ± 19.4 ab5.6 ± 2.5 ab
Chisq 21.4925.19
df 1111
p 0.030.009
Means with the same letter in a column are not significantly different (Bonferroni test, p = 0.05).
Table 5. Apterous and alate banana aphid abundance (mean ± SE) on the 12 Musa genotypes sorted from ploidy groups 9 weeks after experimental infestation under screenhouse conditions.
Genomic GroupGenotypesApterous AphidAlate Aphid
Genotypes with high aphid densities
AABWaema395.6 ± 20.8 a24.9 ± 7.1 a
AABEbang366.1 ± 24.7 ab34.7 ± 11.7 a
AABBFHIA 03327.0 ± 40.1 ab27.3 ± 6.6 a
AAAABITA 2190.4 ± 34.6 abc8.0 ± 4.4 ab
ABKunnan136.7 ± 66.7 bcd2.9 ± 1.4 abc
AAFigue sucrée120.9 ± 35.5 abcd1.3 ± 0.2 abc
Genotypes with low aphid densities
AAABCRBP 3782.1 ± 7.8 bcde0.6 ± 0.4 bcd
BBBLep Chang Kut64.6 ± 22.0 cde0.1 ± 0.0 cd
ABBIce Cream63.5 ± 5.9 cde0.5 ± 0.3 bcd
AAAAT650.7 ± 11.0 cde0.3 ± 0.2 bcd
ABNey Poovan17.9 ± 7.6 de0.1 ± 0.0 cd
AACalcutta 49.7 ± 4.6 e0 d
Chisq 30.030.1
Df 1111
p 0.0020.002
Means with the same letter in a column are not significantly different (Bonferroni test, p = 0.05).
Table 6. Apterous and alate banana aphid abundance, banana bunchy top disease (BBTD) incidence, area under disease progress curve (AUDPC) and virus incidence on the diploid Musa genotypes after 36 months in the field.
Genomic GroupGenotype Total Plants PlantedMonth to First SymptomsApterous Aphid AbundanceAlate
Aphid Abundance
BBTD IncidenceAUDPCTotal Tested for BBTVBBTV Incidence
(%)
AACalcutta 49NS1.4 ± 0.4 bcd0.2 ± 0.1 a0 c 0 c70
AAFigue sucree1432.1 ± 0.6 bcd0.2 ± 0.1 a56.7 ± 12.0 abc449 ± 110 abNA-
AAPisang Tongat1330.4 ± 0.1 d0.2 ± 0.1 a61.7 ± 7.3 ab527 ± 70.4 ab30
AATapo931.4 ± 1.1 cd0.2 ± 0.1 a100 ± 0.0 a869 ± 37.5 aNA-
AAUwati1273.9 ± 0.9 abc0.1 ± 0.0 a33.3 ± 17.6 abc202 ± 117 bc240
ABChuoi Man1429.2 ± 1.6 a0.4 ± 0.1 a21.7 ± 11.7 bc187 ± 107 bc470
ABKunnan15182.5 ± 0.6 abc0.1 ± 0.0 a33.3 ± 6.7 abc80.6 ± 64.4 bc4515.6
ABNey Poovan15362.5 ± 0.9 abc0.3 ± 0.1 a6.7 ± 6.7 c1.1 ± 1.1 c990
BBBalbisiana Los Banos8NS5.2 ± 1.9 ab0.1 ± 0.1 a0 c0 c70
Chisq 15.8412.119.5520.15--
Df 8888--
p 0.040.150.010.009--
NS = no symptoms; NA= not available (samples not available for testing due to plant death); BBTV = banana bunchy top virus; Data are means ± standard errors. Means with the same letter in a column are not significantly different (Bonferroni test, p = 0.05).
Table 7. Apterous and alate banana aphid abundance, banana bunchy top disease (BBTD) incidence, area under disease progress curve (AUDPC) and virus incidence on the triploid Musa genotypes after 36 months in the field.
Genomic GroupGenotypesTotal Plants PlantedMonth to First InfectionApterous Aphid AbundanceAlate Aphid AbundanceBBTD Incidence (%)AUDPCSamples Tested for BBTVBBTV Incidence (%)
AAAGros Michel10215.4 ± 2.5 bcde0.22 ± 0.05 abc8.3 ± 8.3 a38.8 ± 38.8 ab234.2
AAAKhai Thong Ruang1563.9 ± 0.9 bcde0.19 ± 0.05 bc40.0 ± 11.5 a261.8 ± 84.8 ab762.6
AAAWilliams1332.4 ± 0.5 de0.10 ± 0.03 c60.0 ± 10.0 a278.2 ± 108.0 ab616.7
AAAYagambi Km57112.4 ± 1.3 de0.05 ± 0.03 c55.0 ± 5.0 a498.5 ± 51.8 a120
AABBatard15629.2 ± 6.7 a0.44 ± 0.05 ab20.0 ± 0.0 a98.5 ± 51.3 ab360
AABEbang151621.4 ± 8.6 abc0.45 ± 0.12 ab40.0 ± 11.5 a186.6 ± 42.5 ab210
AABElat14420.7 ± 3.8 ab0.37 ± 0.12 abc26.7 ± 17.6 a83.6 ± 76.4 ab320
AABEssong15423.5 ± 9.6 abcd0.55 ± 0.11 a33.3 ± 17.6 a253.1 ± 127.1 ab150
AABFHIA 251542.0 ± 0.6 e0.11 ± 0.04 c66.7 ±17.6 a497.1 ± 128.7 a100
AABPITA 2114NS19.9 ± 8.0 abcd0.34 ± 0.07 abc0 a0 b300
AABPITA 231535.8 ± 1.5 abcde0.31 ± 0.09 abc53.3 ± 24.0 a348.4 ± 244.6 ab224.8
AABPITA 2415102.4 ± 0.8 e0.15 ± 0.04 bc53.3 ± 17.6 a183.0 ± 89.9 ab234.2
AABPITA 271279.5 ± 1.3 abcde0.27 ± 0.06 abc50.0 ± 14.4 a332.6 ± 69.4 ab160
AABWaema1529.3 ± 2.6 abcde0.28 ± 0.08 abc40.0 ± 11.5 a287.9 ± 53.7 ab440
ABBDaru15413.9 ± 1.3 abcd0.32 ± 0.07 abc13.3 ± 6.7 a93.8 ± 56.3 ab484.2
ABBFougamou11363.3 ± 1.5 cde0.22 ± 0.06 abc8.3 ± 8.3 a19.2 ± 19.2 ab470
ABBPisang Awak13286.6 ± 1.7 abcde0.23 ± 0.06 abc6.7 ± 6.7 a1.1 ± 1.1 ab814.8
ABBBalonkawe 10NS10.9 ± 3.6 abcde0.5 ± 0.2 abc0 a0 a90
BBBLep Chang Kut7156.2 ± 2.5 abcde0.01 ±0.01 c12.5 ± 12.5 a106.1 ± 106.1 ab30
Chisq 40.4739.9532.2234.92--
Df -18181818--
p -0.0020.0020.020.01--
NS = no symptoms; BBTV = banana bunchy top virus; Data are means ± standard errors. Means with the same letter in a column are not significantly different (Bonferroni test, p = 0.05).
Table 8. Apterous and alate banana aphid abundance, BBTD incidence, area under disease progress curve (AUDPC) and virus incidence on the tetraploid Musa genotypes after 36 months in the field.
Genomic GroupGenotypes Total Plants PlantedMonth to First InfectionApterous
Aphid Abundance
Alate Aphid AbundanceBBTD IncidenceAUDPCTotal Samples Tested for BBTVBBTV Incidence (%)
AAAABITA29144.9 ± 1.1 bc0.3 ± 0. 1 a55.6 ± 29.4 a317.6 ± 191.8 a60
AAAABuccaneer1437.2 ± 1.5 abc0.1 ± 0.0 a35.0 ± 5.0 a228.0 ± 46.5 a510
AAAAFHI A231546.5 ± 2.5 abc0.3 ± 0.1 a33.3 ± 6.7 a217.3 ± 51.0 a250
AAAASH 3436-61343.7 ± 0.7 c0.3 ± 0.1 a48.3 ± 15.9 a338.1 ± 136 a1517.8
AAAASH 3436-91435.6 ± 2.0 bc0.2 ± 0.1 a50.0 ± 5.8 a335.6 ± 73.7 a118.3
AAAAT61433.0 ± 1.0 c0.1 ± 0.1 a33.3 ± 24.0 a197 ± 144 a90
AAABBITA 81276.6 ± 1.3 abc0.4 ± 0.1 a25.0 ± 14.4 a169 ± 87.0 a170
AAABCRBP 3715261.97 ± 0.6 c0.1 ± 0.1 a6.7 ± 6.7 a23.1 ± 23.1 a190
AAABCRBP 39151124.0 ± 5.5 a0.3 ± 0.1 a33.3 ± 6.7 a168 ± 75.7 a146.7
AAABCRBP 535142821.0 ± 4.5 a0.5 ± 0.1 a8.3 ± 8.3 a28.9 ± 28.9 a250
AAABCRBP 56815189.2 ± 2.0 abc0.2 ± 0.1 a6.7 ± 6.7 a37.8 ± 37.8 a240
AAABCRBP 838141317.1 ± 4.1 ab0.3 ± 0.1 a25.0 ± 25.0 a146 ± 146 a352.6
AAABCRBP 96915424.9 ± 6.5 abc0.3 ± 0.1 a33.3 ± 17.6 a237 ± 119 a214.8
AAABFHIA 2115415.0 ± 3.2 abc0.4 ± 0.1 a53.3 ± 6.7 a323 ± 38.5 a90
AAABIRFA 9081547.9 ± 2.4 abc0.7 ± 0.4 a66.7 ± 13.3 a308 ± 84.9 a300
AABBFHIA 037314.5 ± 3.2 abc0.6 ± 0.1 a62.5 ± 37.5 a303 ± 46.8 a70
Df -16161616--
p 0.0030.180.140.16--
BBTV = banana bunchy top virus; Data are means ± standard errors. Means with the same letter in a column are not significantly different (Bonferroni test, p = 0.05).
Table 9. Apterous and alate banana aphid abundance (mean ± SE) on the 12 Musa genotypes sorted from ploidy groups based on highest and lowest aphid abundance after 36 months in the field.
Genomic GroupsGenotypesApterous AphidsAlate Aphids
Genotypes with high aphid densities
AABBatard29.2 ± 6.7 a0.4 ± 0.0 a
AAABCRBP 96924.9 ± 10.8 ab0.3 ± 0.1 ab
AAABCRBP 3924.0 ± 4.2 ab0.3 ± 0.1 ab
AABEssong23.5 ± 9.6 ab0.5 ± 0.0 ab
ABChuoi Man9.2 ± 2.2 abc0.4 ± 0.1 ab
BBBalbisiana Los Banos5.2 ± 3.0 abcd0.1 ±0.0 b
Genotypes with low aphid densities
AAAAT63.0 ± 1.0 bcd0.1 ± 0.1 ab
AAAYagambi Km52.4 ± 1.4 bcd0.0 ± 0.0 b
AABFHIA 252.0 ± 0.3 cd0.1 ± 0.0 b
AAABCRBP 372.0 ± 0.8 cd0.1 ± 0.1 b
AATapo1.2 ± 0.9 cd0.1 ± 0.1 b
AAPisang Tongat0.4 ± 0.2 d0.2 ± 0.1 ab
Chisq 27.723.5
Df 1111
p 0.0040.02
Data are means ± standard errors. Means with the same letter in a column are not significantly different (Bonferroni test, p = 0.05).
Table 10. Banana bunchy top disease (BBTD) incidence and area under disease progress curve (AUDPC) (mean ± SE) of the 12 Musa genotypes sorted from three ploidy groups after 36 months in the field.
Genomic Group GenotypesTotal Plants PlantedBBTD
Incidence
AUDPC
AATapo9100 ± 0.0 a869 ± 37.5 a
AABFHIA 251566.7 ± 17.6 a497 ± 128.7 ab
AAABIRFA 9081566.7 ± 13.3 a308 ± 84.9 bc
AABBFHIA 03762.5 ± 37.5 ab303 ± 46.8 abc
AAPisang Tongat1361.7 ± 7.3 ab527 ± 70.4 ab
AAAWilliams1360.0 ± 10.0 ab278 ± 108 bc
AAABCRBP 568156.7 ± 6.7 bc37.8 ± 37.8 cd
AAABCRBP 3715 6.7 ± 6.7 bc 23.1 ± 23.1 cd
AACalcutta 490 bc0 d
BBBalbisiana Los Banos80 bc 0 d
ABBBolankawe100 bc 0 d
AABPITA 21140 bc0 d
Chisq 26.928.5
Df 1111
p 0.0050.003
Data are means ± standard errors. Means with the same letter in a column are not significantly different (Bonferroni test, p = 0.05).
Publisher’s Note: MDPI stays neutral with regard to jurisdictional claims in published maps and institutional affiliations.

