
Modeling Bark Thickness and Bark Biomass on Stems of Four Broadleaved Tree Species


Abstract
1. Introduction
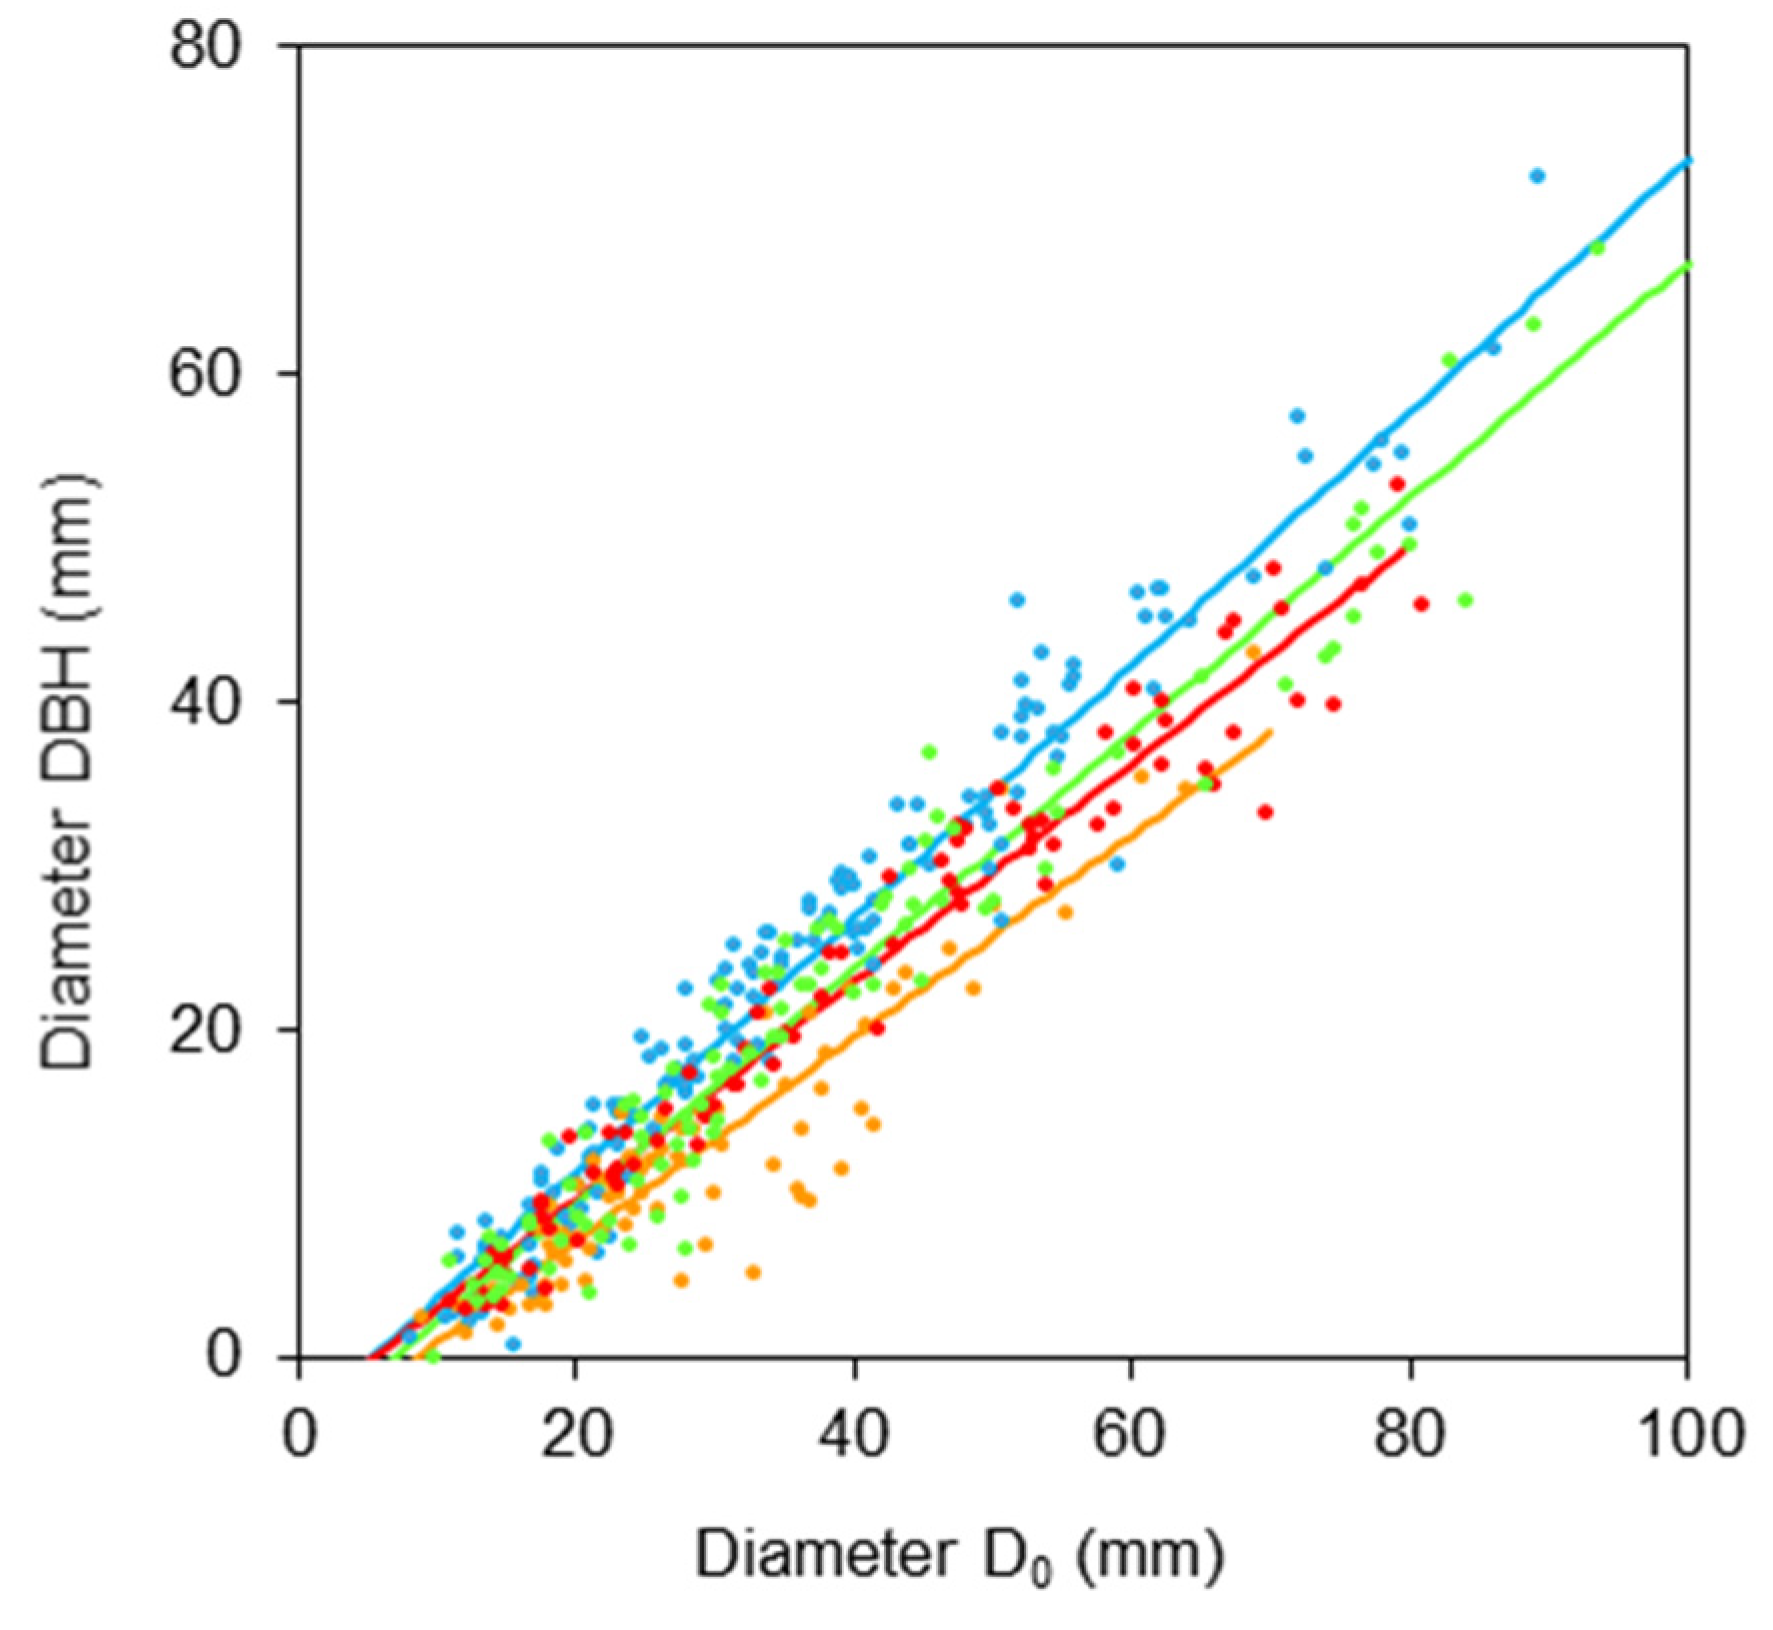
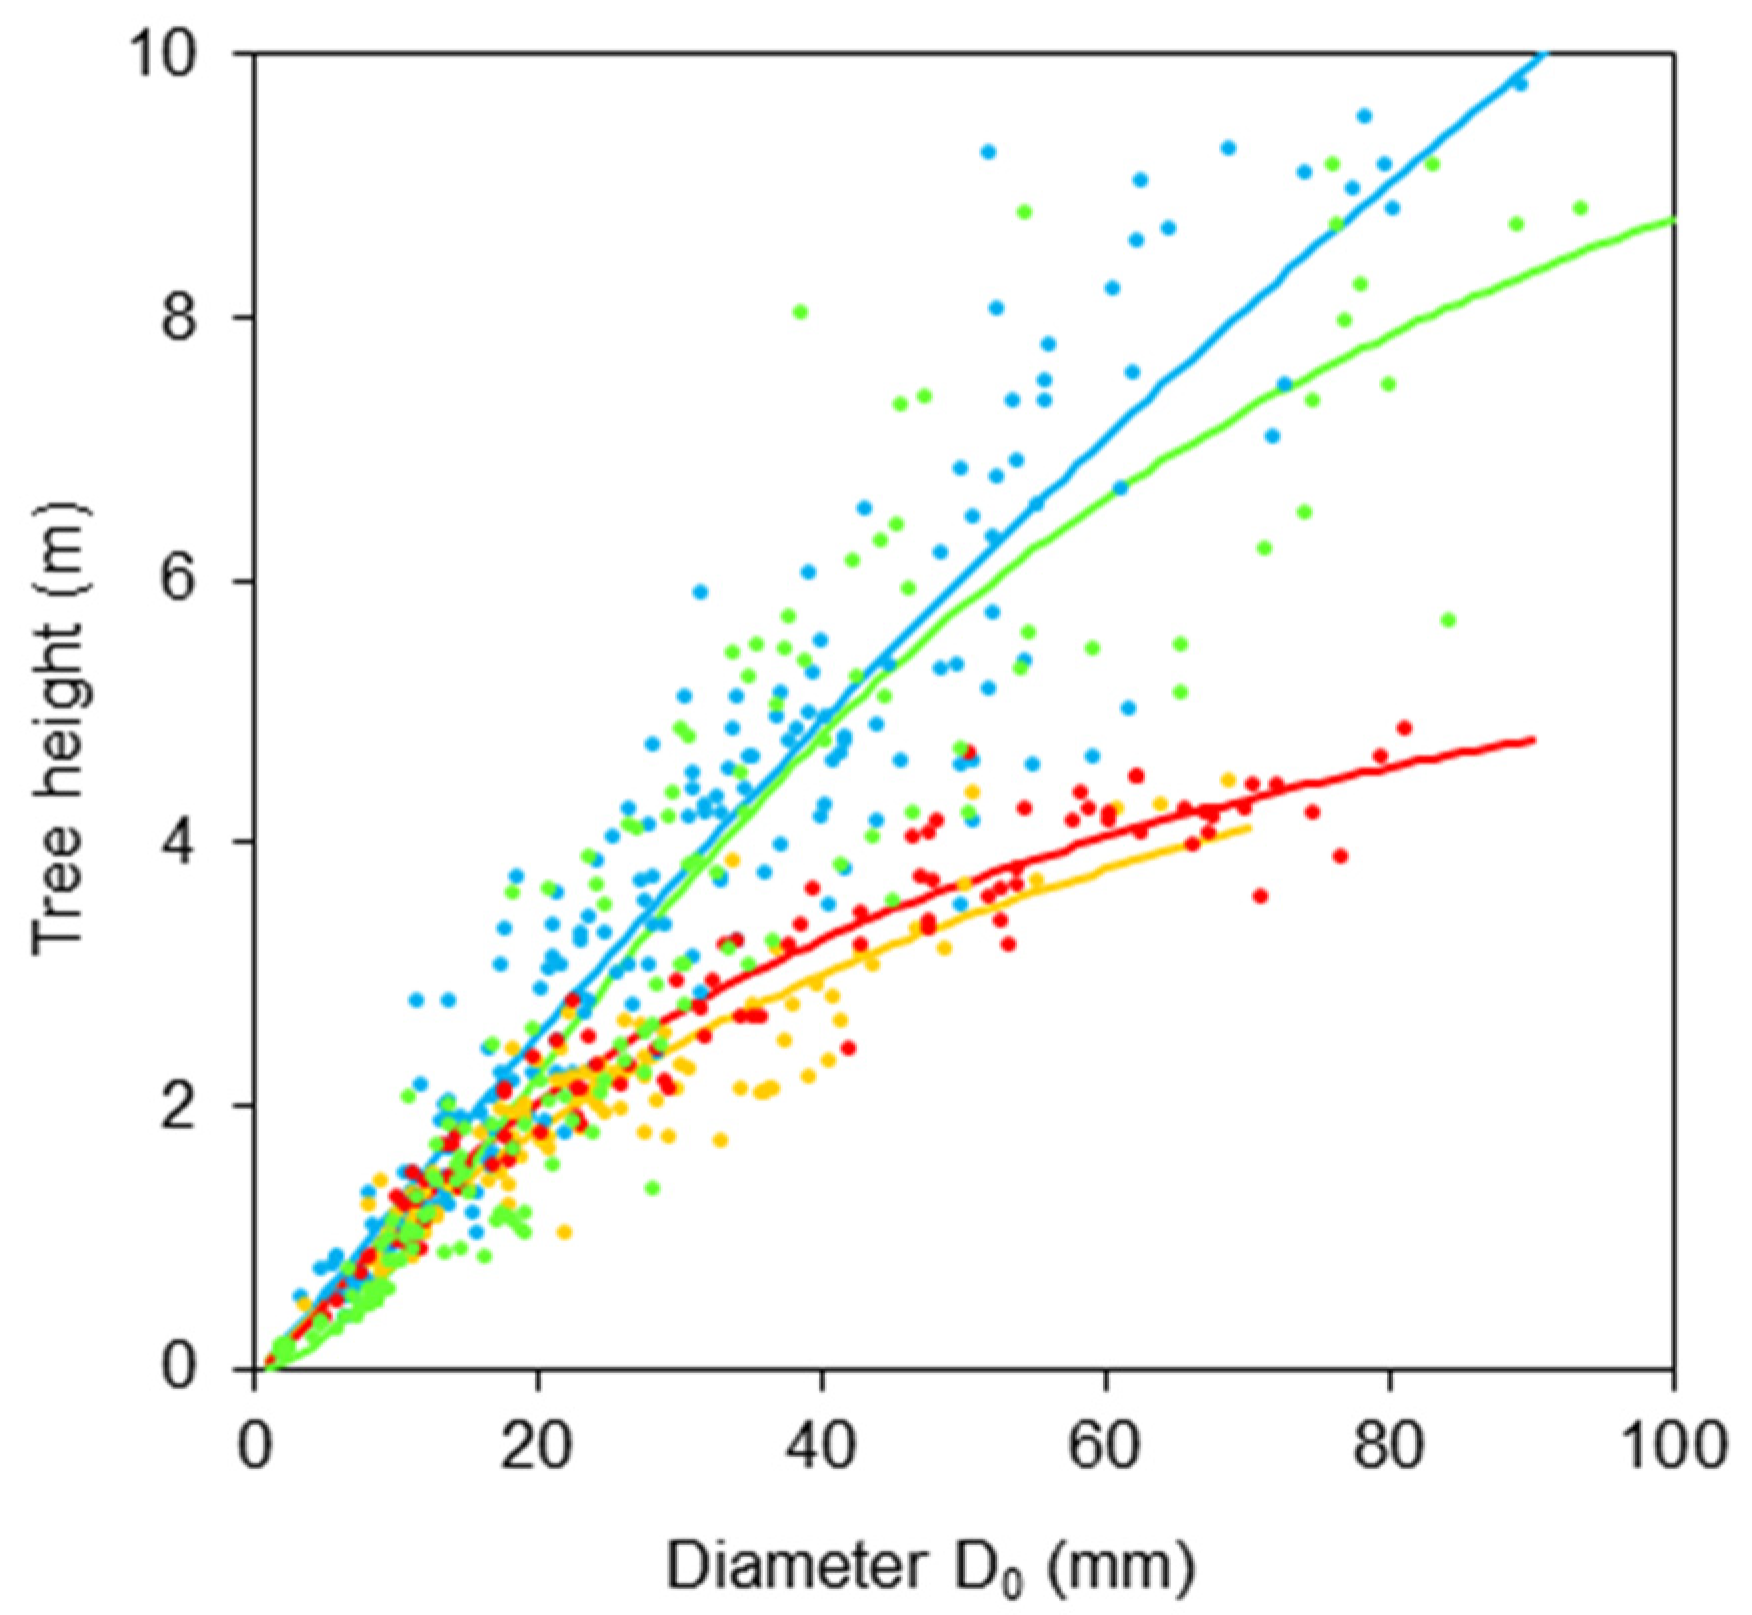
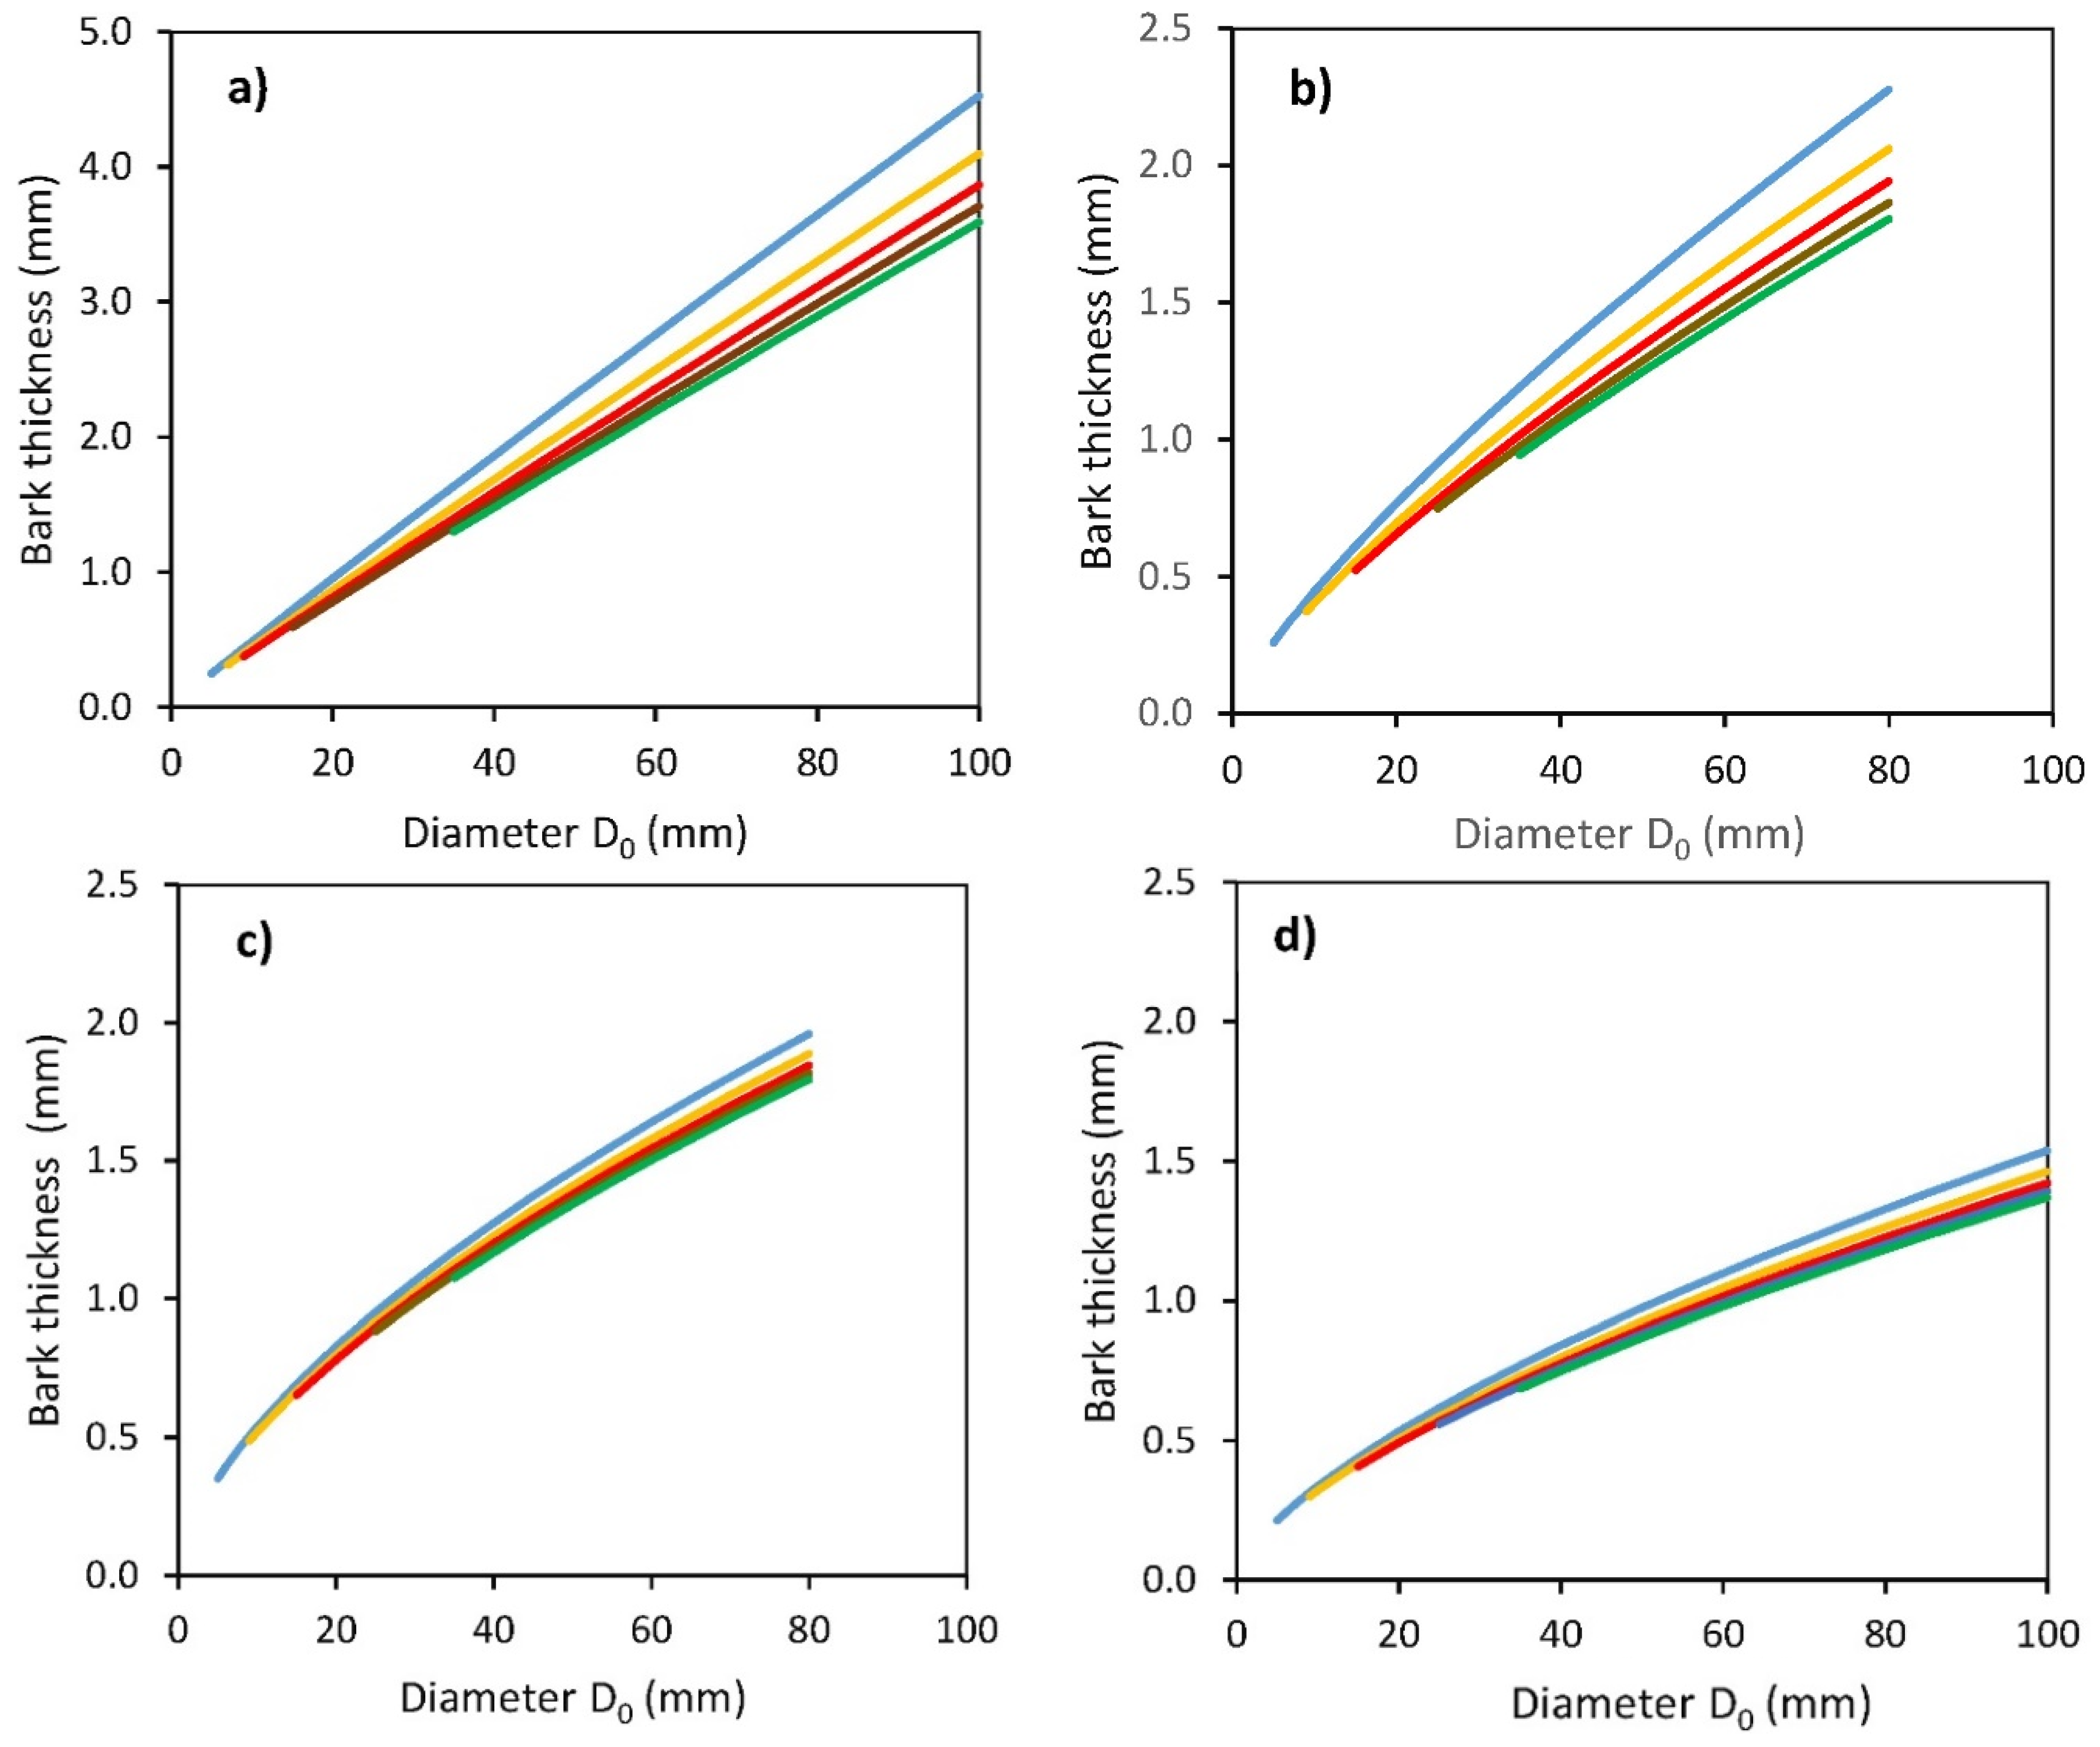
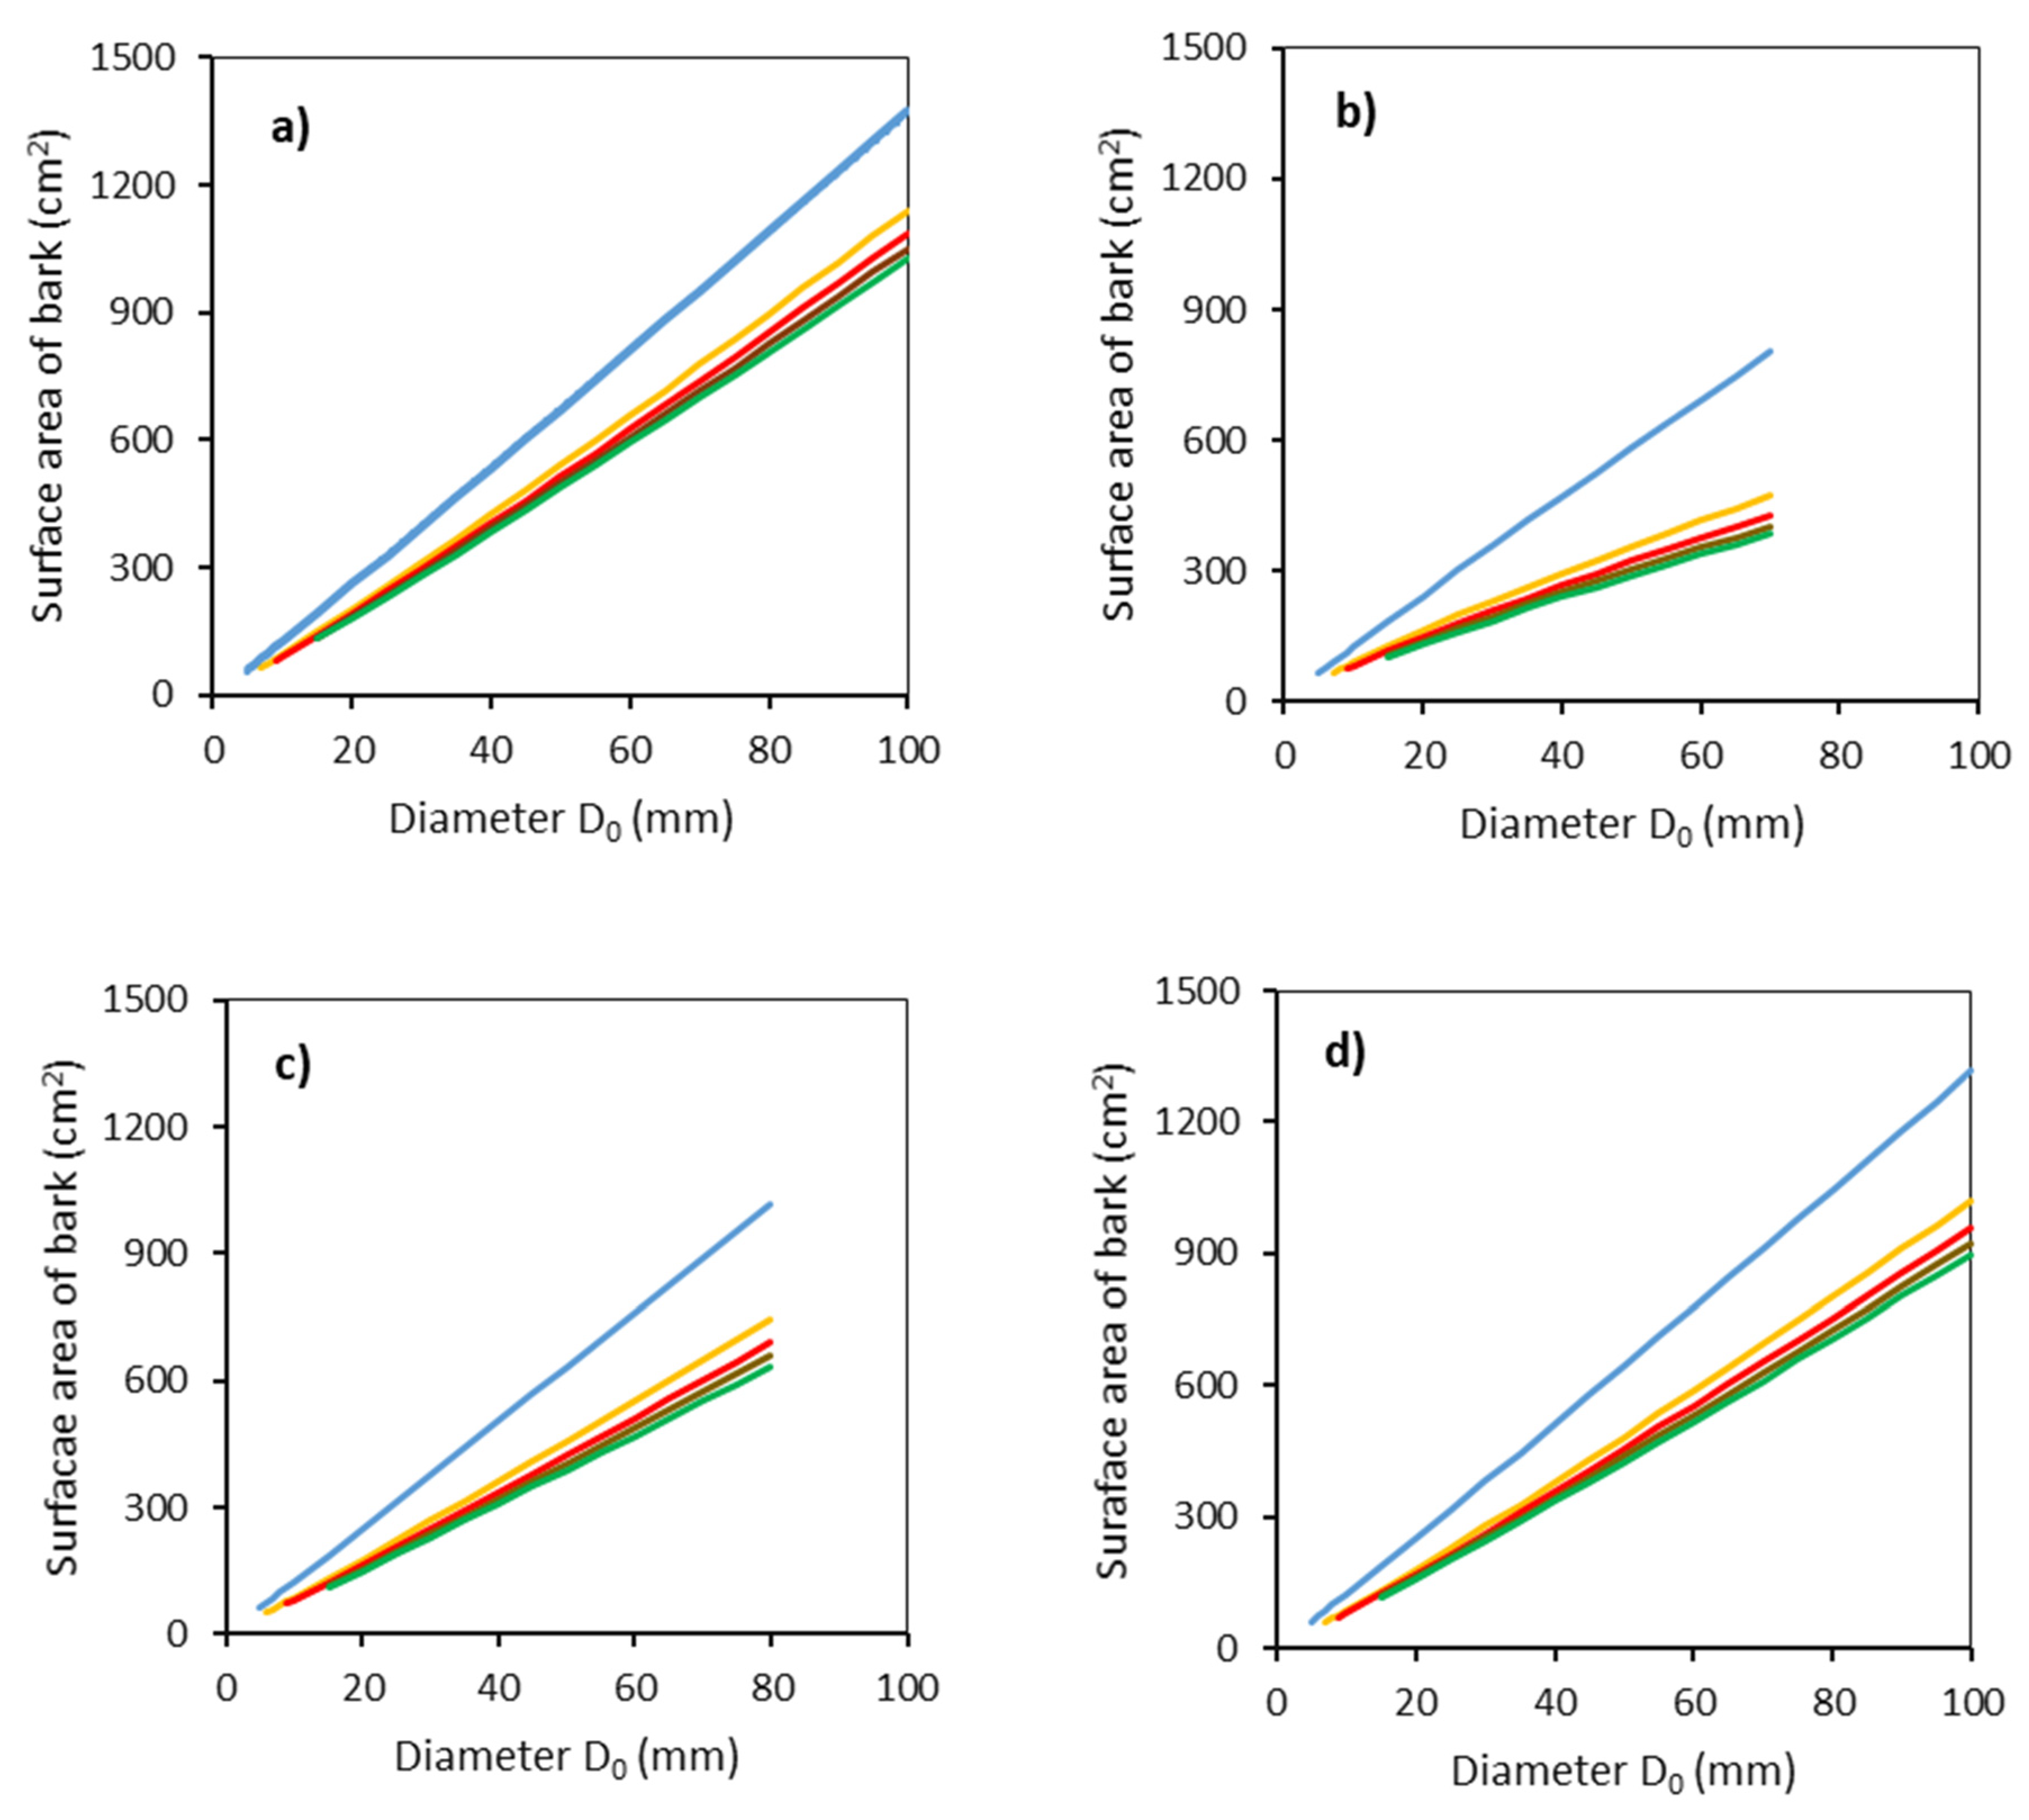
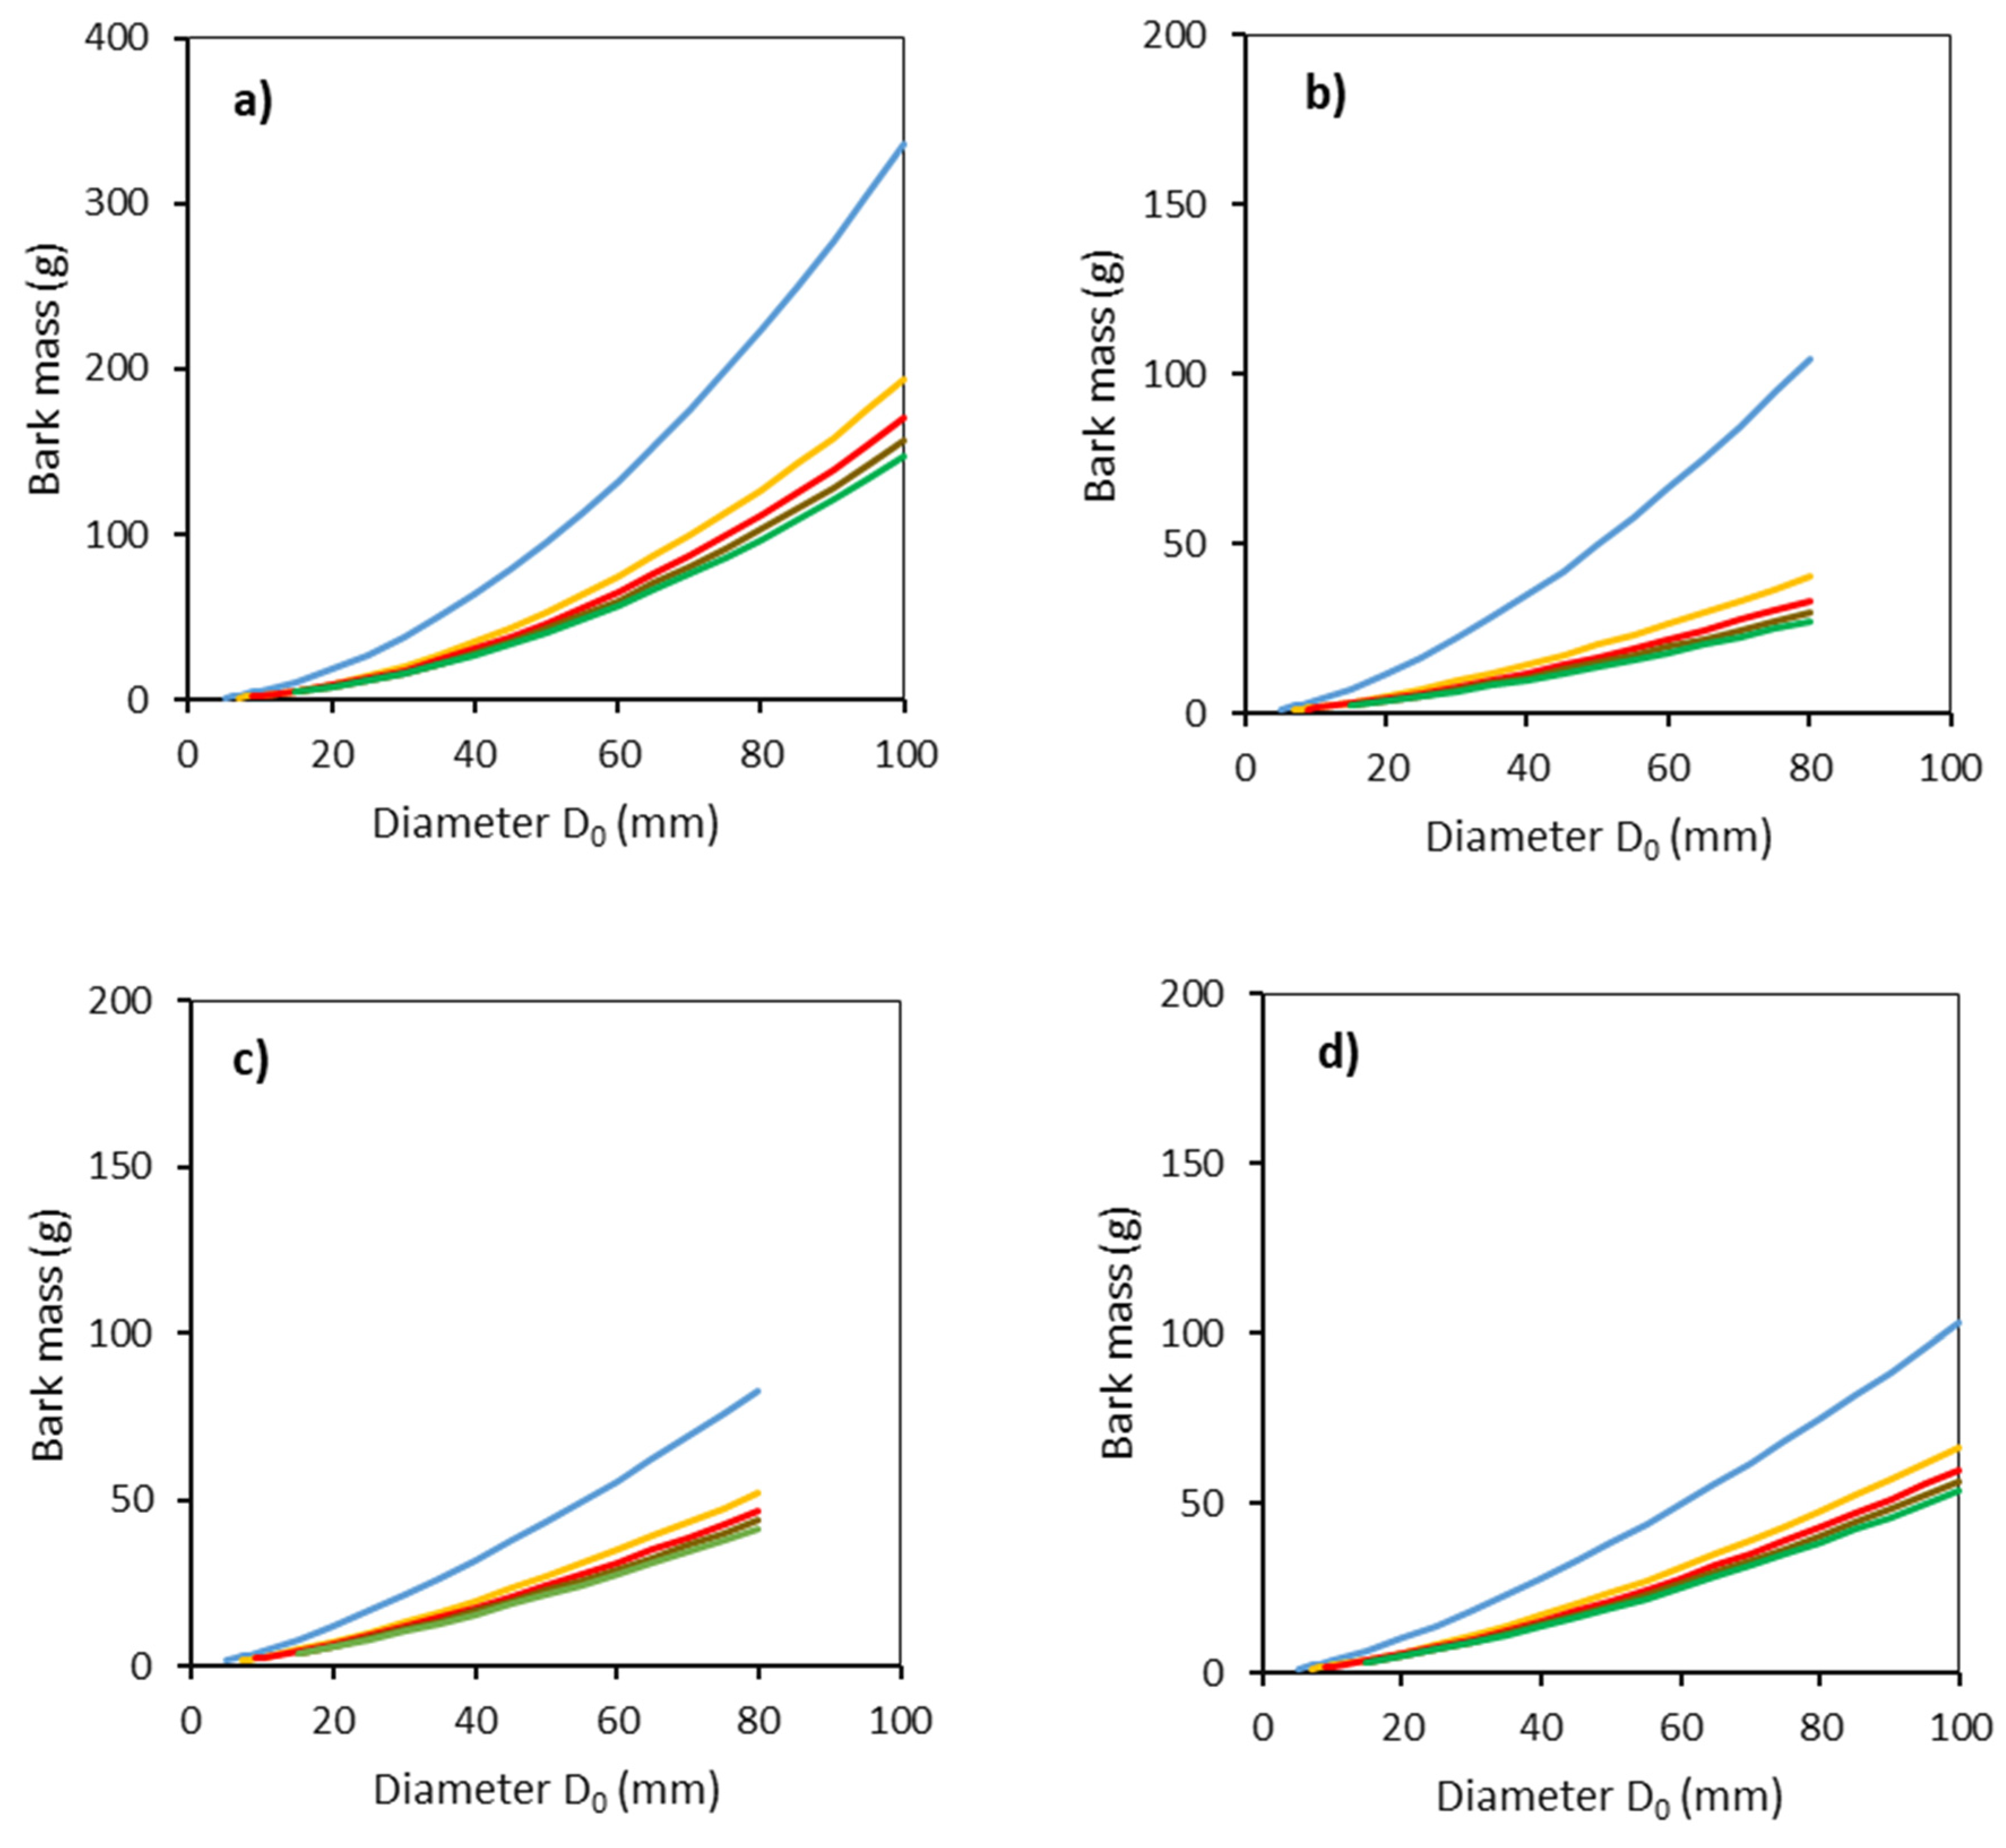
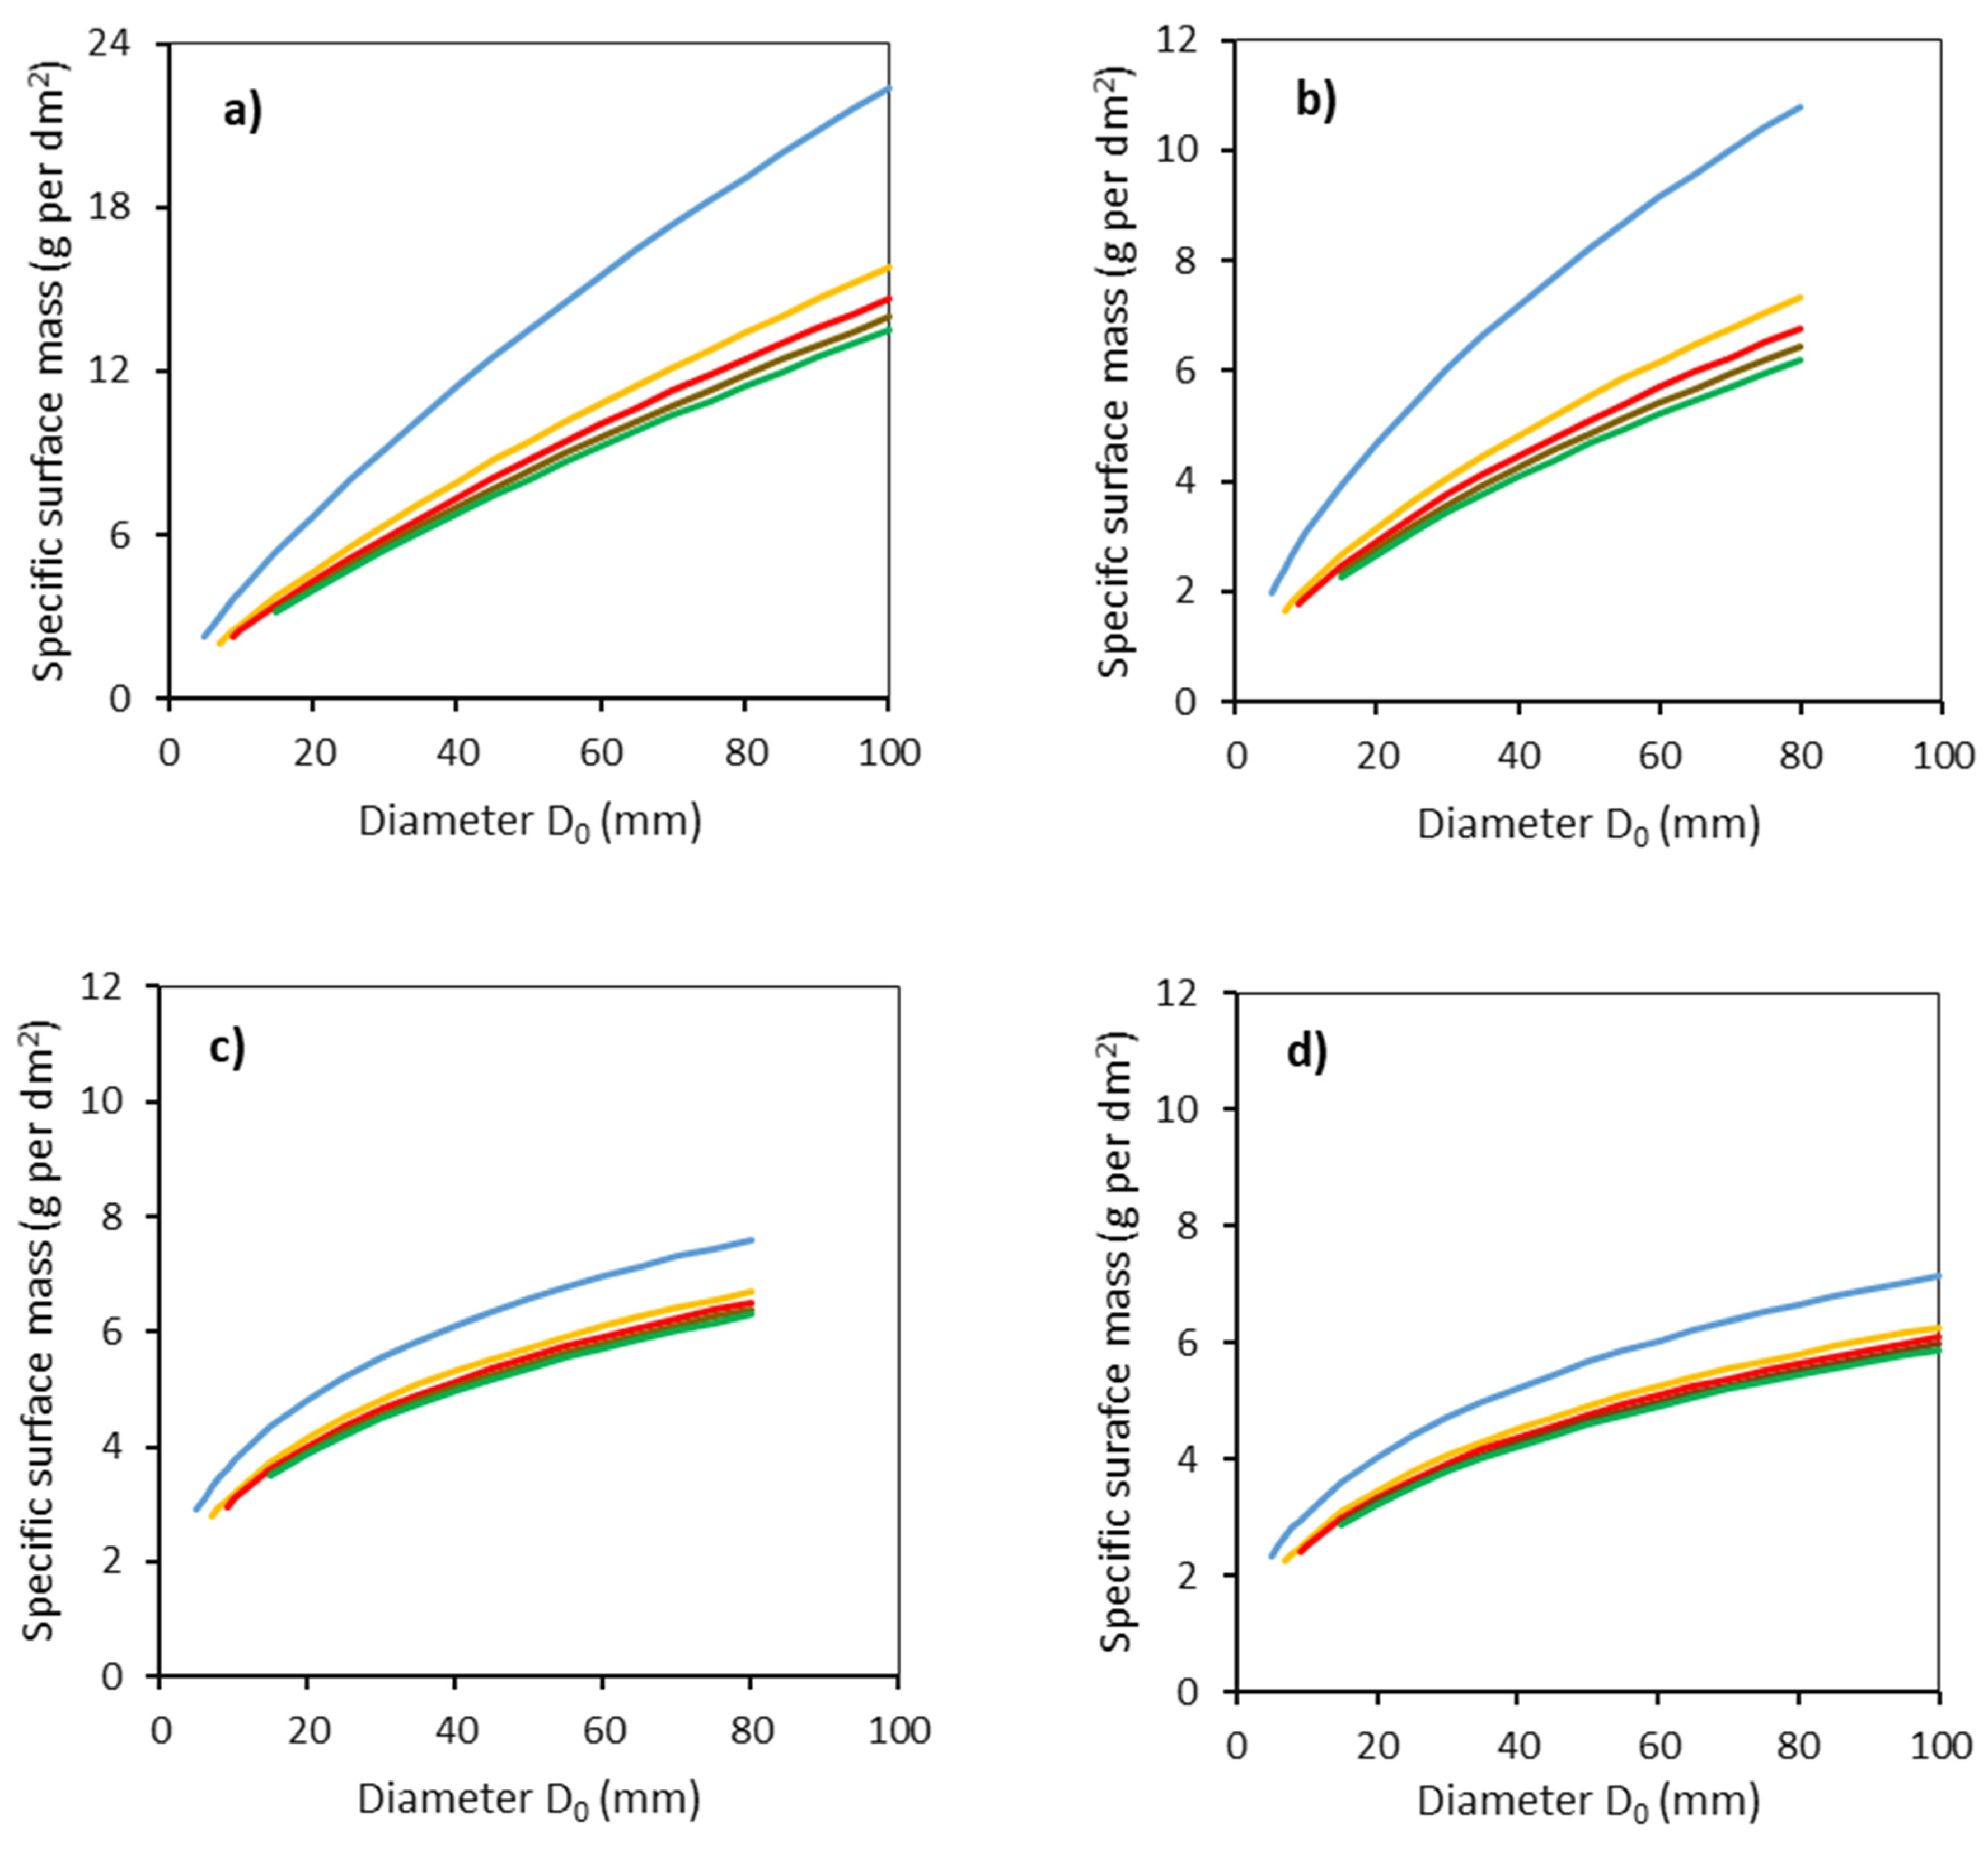
2. Results
3. Discussion
4. Materials and Methods
4.1. Sampling and Data Collection
4.2. Data Processing and Modeling
- H is a tree height (m);
- D0 is a diameter at stem base (mm);
- b0, b1, b2 are regression coefficients.
- DBH is a diameter at breast height (mm);
- D0 is a diameter at stem base (mm);
- b0, b1 are regression coefficients.
- Tb is bark thickness (mm);
- D0 is a diameter at stem base (mm);
- Hg is a distance from the ground level (cm);
- b0, b1, b2 are regression coefficients.
- Sb is bark surface (cm2);
- r1 is a radius of the bottom end (cm);
- r2 is a radius of the top end (cm);
- ls is the length of the section (cm).
- r is a stem radius (mm);
- D0 is a diameter at stem base (mm);
- Hg is a distance from the ground level (cm);
- b0, b1, b2 are regression coefficients.
- Wb is bark mass weight (g);
- Vb is bark volume (cm3);
- ρb is bark density (kg per m3).
- SPH is specific surface mass of bark (g per dm2);
- Wb is bark mass (g);
- Sb is bark surface (dm2).
5. Conclusions
Author Contributions
Funding
Institutional Review Board Statement
Informed Consent Statement
Data Availability Statement
Conflicts of Interest
References
- Crang, R.; Lyons-Sobaski, S.; Wise, R. Plant Anatomy; Springer International Publishing: Berlin/Heidelberg, Germany, 2018; p. 725. [Google Scholar]
- Kozlowski, T.T.; Pallardy, S.G. Physiology of Woody Plants, 2nd ed.; Academic Press, Inc.: London, UK, 1997; p. 411. [Google Scholar]
- Harkin, J.M.; Rowe, J.W. Bark and Its Possible Uses; Research Note Forest Products Laboratory 091: Madison, WI, USA, 1971; p. 76. [Google Scholar]
- Ryan, M.G.; Asao, S. Phloem transport in trees. Tree Physiol. 2013, 34, 1–4. [Google Scholar] [CrossRef] [PubMed]
- Wolfe, B.T. Bark eater vapour conductance is associate with drought performance in tropical trees. Biol. Lett. 2020, 16, 20200263. [Google Scholar] [CrossRef] [PubMed]
- Biggs, A.R.; Merrill, W.; Davis, D.D. Discussion: Response of bark tissues to injury and infection. Can. J. For. Res. 1984, 14, 351–356. [Google Scholar] [CrossRef]
- Teskey, T.; Wertin, T.; Bauweraerts, I.; Ameye, M.; McGuire, M.A.; Steppe, K. Responses of tree species to heat waves and extreme heat events. Plant Cell Environ. 2015, 38, 1699–1712. [Google Scholar] [CrossRef] [PubMed]
- Pellegrini, A.F.A.; Anderegg, W.R.; Paine, C.E.; Hoffmann, W.A.; Kartzinel, T.; Rabin, S.S.; Sheil, D.; Franco, A.C.; Pacala, S.W. Convergence of bark investment according to fire and climate structures ecosystem vulnerability to future change. Ecol. Lett. 2017, 20, 307–316. [Google Scholar] [CrossRef]
- Christiainsen, E.; Krokene, P.; Berryman, A.A.; Franceschi, V.R.; Krekling, T.; Lieutier, F.; Lönneborg, A.; Solheim, H. Mechanical injury and fungal infection induce acquired resistance in Norway spruce. Tree Physiol. 1999, 19, 399–409. [Google Scholar] [CrossRef]
- Boland, J.M.; Woodward, D.L. Thick bark can protect trees from a severe ambrosia beetle attack. PeerJ 2021, 9, e10755. [Google Scholar] [CrossRef]
- Romero, C. Bark: Structure and functional ecology. In Bark: Use, Management, and Commerce in Africa; Cunningham, A.B., Campbell, B.M., Luckert, M.K., Eds.; New York Botanical Garden Press: New York, NY, USA, 2013; Volume 17, pp. 5–25. [Google Scholar]
- Ilek, A.; Van Stan, J.T.; Morkisz, K.; Kucza, J. Vertical Variability in Bark Hydrology for Two Coniferous Tree Species. Front. For. Glob. Change 2021, 4, 687907. [Google Scholar] [CrossRef]
- Williams, V.L.; Witkowski, E.T.F.; Balkwill, K. Relationship between bark thickness and diameter at breast height for six tree species used medicinally in South Africa. S. Afr. J. Bot. 2007, 73, 449–465. [Google Scholar] [CrossRef]
- Paine, C.E.T.; Stahl, C.; Courtois, E.A.; Patino, S.; Sarmiento, C.; Baraloto, C. Functional explanations for variation in bark thickness in tropical rain forest trees. Funct. Ecol. 2010, 24, 1202–1210. [Google Scholar] [CrossRef]
- Schafer, J.J.; Breslow, B.P.; Hohmann, G.; Hoffmann, A. Relative bark thickness is correlated with tree species distributions along a fire frequency gradient. Fire Ecol. 2015, 11, 74–87. [Google Scholar] [CrossRef]
- Zeibig-Kichas, N.E.; Ardis, C.W.; Berrill, J.-P.; King, J.P. Bark Thickness Equations for Mixed-Coniferous Forest Type in Klamath and Sierra Nevada Mountains of California. Int. J. For. Res. 2016, 2016, 1864039. [Google Scholar]
- Stängle, S.M.; Dormann, C.F. Modelling the variation of bark thickness within and between European silver fir (Abies alba Mill.) trees in southwest Germany. Forestry 2018, 91, 283–294. [Google Scholar] [CrossRef]
- Doruska, P.F.; Patterson, D.; Hartley, J.; Hurd, M.; Hart, T. Newer technologies and bioenergy bring focus back to bark factor equations. J. For. 2009, 107, 38–43. [Google Scholar]
- Pizzi, A. Wood products and green chemistry. Ann. For. Sci. 2016, 73, 185–203. [Google Scholar] [CrossRef]
- Poeiras, A.P.; Oliveira, T.; Reis, J.; Surový, P.; Silva, M.E. Influence of water supply on cork increment and quality in Quercus suber L. Cent. Eur. For. J. 2021, 1, 3–14. [Google Scholar] [CrossRef]
- Morhart, C.; Sheppard, J.P.; Schuler, J.K.; Spiecker, H. Above-ground woody biomass allocation and within tree carbon and nutrient distribution of wild cherry (Prunus aviunm L.)—A case study. For. Ecosyst. 2016, 3, 4. [Google Scholar] [CrossRef]
- Temesgen, H.; Affleck, D.; Poudel, K.; Gray, A.; Sessions, J. A review of the challenges and opportunities in estimating ground forest biomass using tree-level models. Scand. J. For. Res. 2015, 30, 326–335. [Google Scholar] [CrossRef]
- Pajtík, J.; Konôpka, B.; Šebeň, B. Mathematical Biomass Models for Young Individuals of Forest Tree Species in the Region of the Western Carpathians; National Forest Centre: Zvolen, Slovakia, 2018; p. 89. [Google Scholar]
- Myking, T.; Bohler, F.; Austrheim, G.; Solberg, E.J. Life history strategies of aspen (Populus tremula L.) and browsing effects: A literature review. Forestry 2011, 84, 61–71. [Google Scholar] [CrossRef]
- Myking, T.; Solberg, E.J.; Austrheim, G.; Speed, J.D.M.; Bohler, F.; Astrup, R.; Eriksen, R. Browsing of sallow (Salix caprea L.) and rowan (Sorbus aucuparia L.) in the context of life history strategy: A literature review. Eur. J. Forest Res. 2013, 132, 399–409. [Google Scholar] [CrossRef]
- Edenius, L.; Ericsson, G. Effects of ungulate browsing on recruitment of aspen and rowan: A demographic approach. Scand. J. For. Res. 2015, 30, 283–288. [Google Scholar] [CrossRef]
- Konôpka, B.; Pajtík, J.; Shipley, L.A. Intensity of red deer browsing on young rowans differs between freshly-felled and standing individuals. For. Ecol. Manag. 2018, 429, 511–519. [Google Scholar] [CrossRef]
- Borowski, Z.; Gill, W.; Barton, K.; Zajaczkowski, G.; Lukaszewicz, J.; Tittenbrun, A.; Radlisnki, B. Density-related effect of red deer browsing on palatable and unpalatable tree species and forest regeneration dynamics. For. Ecol. Manag. 2021, 496, 119442. [Google Scholar] [CrossRef]
- Konôpka, B.; Šebeň, V.; Pajtík, J.; Shipley, L. Excluding large wild herbivores reduced Norway spruce dominance and supported tree species richness in a young, naturally regenerated stand. Forests 2021, 12, 737. [Google Scholar] [CrossRef]
- Ligot, G.; Gheysen, T.; Lehaire, F.; Hébert, J.; Licoppe, A.; Lejeune, P.; Brostaux, Y. Modelling recent bark stripping by red deer (Cervus elaphus) in South Belgium coniferous stands. Ann. For. Sci. 2012, 70, 309–318. [Google Scholar] [CrossRef]
- Valente, A.M. Overabundant wild ungulate populations in Europe: Management with consideration of socio-ecological consequences. Mamm. Rev. 2020, 50, 353–366. [Google Scholar] [CrossRef]
- Vospernik, S. Probability of Bark Stripping Damage by Red Deer (Cervus elaphus) in Austria. Silva Fenn. 2006, 40, 589–601. [Google Scholar] [CrossRef][Green Version]
- Speer, H.J. The Fundamentals of Tree-Ring Research; University of Arizona: Terre Haute, Indiana, 2012; p. 510. [Google Scholar]
- Ayanz, J.S.; de Rigo, D.; Caudullo, G.; Durrant, T.H.; Mauri, A. European Atlas of Forest Tree Species; European Commission, Official Journal of European Union: Luxembourg, 2006; Volume 54, p. 200. [Google Scholar]
- Zhao, Q.; Mäkinen, M.; Haapala, A.; Jänis, J. Variation of Bark from Short Rotation Trees by Temperature-Programmed Slow Pyrolysis. ACS Omega 2021, 6, 9771–9779. [Google Scholar] [CrossRef]
- Graves, S.J.; Rifai, S.W.; Putz, F.E. Outer bark thickness decreases more with height on stems of fire-resistant than fire-sensitive Floridian oaks (Quercus spp.; Fagaceae). Am. J. Bot. 2014, 101, 2183–2188. [Google Scholar] [CrossRef]
- Johansson, T. Site Index Curves for European aspen (Populus tremula L.) Growing on Forest Land of Different Soils in Sweden. Silva Fenn. 1996, 30, 437–458. [Google Scholar] [CrossRef][Green Version]
- Smith, H.C. Bark thickness related to tree diameter in sugar maple (Acer saccharum Marsh.). USDA For. Serv. Res. Note 1967, 107, 1–4. [Google Scholar]
- Li, R.; Weiskittel, A.R. Estimating and predicting bark thickness for seven conifer species in the Acadian Region of North America using a mixed effects modelling approach: Comparison of model forms and subsampling strategies. Eur. J. For. Res. 2011, 130, 219–233. [Google Scholar] [CrossRef]
- Kurt, Y.; Calikoglu, M.; Isik, K. Relationship between bark thickness, tree age and tree diameter in Pinus brutia ten. plantations. Fresenius Environ. Bull. 2021, 30, 3122–3129. [Google Scholar]
- Sommez, T.; Keles, S.; Tilki, F. Effect of aspect, tree age and tree diameter on bark thickness of Picea orientalis. Scand. J. For. Res. 2007, 22, 193–197. [Google Scholar] [CrossRef]
- Berrill, J.-P.; O’Hara, K.L.; Kichas, N.E. Bark Thickness in Coat Redwood (Sequoia sempervivens (D.Don) Endl.) Varies According to Tree- and Crown Size, Stand Structure, Latitude and Genotype. Forests 2020, 11, 637. [Google Scholar] [CrossRef]
- Wilson, B.G.; Witkowski, E.T.F. Seed banks, bark thickness and change in age and size structure (1978–1999) of the African savanna tree, Burkea africana. Plant Ecol. 2003, 167, 151–162. [Google Scholar] [CrossRef]
- Konôpka, B.; Pajtík, J.; Kaštier, P.; Šebeň, V. Estimates of young ash trees dendromass eaten by red deer using allometric models. Zprávy Lesníckého Výzkumu 2012, 57, 283–294. [Google Scholar]
- Rautio, P.; Bergvall, U.A.; Tuomi, J.; Kesti, K.; Leimar, O. Food selection by herbivores and neighbourhood effects in the evolution if plant defences. Ann. Zool. Fenn. 2012, 49, 45–57. [Google Scholar] [CrossRef]
- Standgard, M.; Walsh, D. Improving harvester estimates of bark thickness for radiate pine (Pinus radiata D.Don). South. For. 2011, 73, 101–108. [Google Scholar] [CrossRef]
- Vaško, M.; Garčár, M. Lesnícka typológia a jej význam pri plánovaní drevinového zloženia lesov Slovenska. In Výstupy NLC Pre Lesnícku Prax III; National Forest Centre: Zvolen, Slovakia, 2021; pp. 56–70. (In Slovak) [Google Scholar]
- Konôpka, B.; Pajtík, J.; Šebeň, V.; Bošeľa, M.; Máliš, F.; Priwitzer, T.; Pavlenda, P. The Research Site Vrchslatina—An experimental design and the main aims. Lesn. Cas. For. J. 2013, 59, 203–213. [Google Scholar] [CrossRef]
- Marklund, L.G. Biomass Functions for Norway Spruce (Picea abies (L.) Karst.) in Sweden; Dep. Forest Surwey, Rep. 43; Swedish University of Agricultural Sciences: Umea, Sweden, 1987. [Google Scholar]
- Ledermann, T.; Neuman, M. Biomass equations from data of old long-term experimental plots. Austrian J. For. Sci. 2006, 123, 47–64. [Google Scholar]
- Cienciala, E.; Černý, M.; Apltauer, J.; Exnerová, Z. Biomass functions applicable to European beech. J. For. Sci. 2005, 51, 147–154. [Google Scholar] [CrossRef]


| Tree Species | b0 | S.E. | b1 | S.E. | R2 | MSE |
|---|---|---|---|---|---|---|
| Common aspen | −3.422 | 0.911 | 0.763 | 0.022 | 0.890 | 29.46 |
| Goat willow | −5.285 | 0.971 | 0.620 | 0.031 | 0.838 | 11.60 |
| Rowan | −3.629 | 0.711 | 0.665 | 0.016 | 0.958 | 7.83 |
| Sycamore | −4.948 | 0.732 | 0.718 | 0.017 | 0.950 | 12.38 |
| Tree Species | b0 | S.E. | P | b1 | S.E. | P | b2 | S.E. | P | R2 | MSE |
|---|---|---|---|---|---|---|---|---|---|---|---|
| Common aspen | 8.221 | 11.812 | 0.487 | 7.077 | 0.693 | <0.001 | 0.021 | 0.009 | 0.017 | 0.897 | 1218.609 |
| Goat willow | 6.921 | 4.691 | 0.143 | 8.127 | 0.542 | <0.001 | 0.126 | 0.016 | <0.001 | 0.812 | 237.939 |
| Rowan | 14.640 | 13.260 | 0.273 | 6.486 | 0.969 | <0.001 | 0.135 | 0.014 | <0.001 | 0.933 | 287.626 |
| Sycamore | 84.237 | 25.897 | 0.001 | 3.273 | 1.311 | 0.014 | 0.073 | 0.014 | <0.001 | 0.882 | 723.968 |
| Tree Species | b0 | S.E. | P | b1 | S.E. | P | b2 | S.E. | P | R2 | MSE |
|---|---|---|---|---|---|---|---|---|---|---|---|
| Common aspen | 0.038 | 0.002 | <0.001 | 1.076 | 0.010 | <0.001 | −0.092 | 0.002 | <0.001 | 0.916 | 0.057 |
| Goat willow | 0.088 | 0.010 | <0.001 | 0.847 | 0.034 | <0.001 | −0.179 | 0.007 | <0.001 | 0.594 | 0.107 |
| Rowan | 0.045 | 0.004 | <0.001 | 1.038 | 0.020 | <0.001 | −0.139 | 0.003 | <0.001 | 0.886 | 0.075 |
| Sycamore | 0.036 | 0.002 | <0.001 | 1.079 | 0.014 | <0.001 | −0.110 | 0.004 | <0.003 | 0.851 | 0.089 |
| Tree Species | b0 | S.E. | b1 | S.E. | b2 | S.E. | R2 | MSE |
|---|---|---|---|---|---|---|---|---|
| Common aspen | 0.092 | 0.016 | 0.968 | 0.016 | −0.144 | 0.004 | 0.786 | 0.287 |
| Goat willow | 0.129 | 0.010 | 0.784 | 0.023 | −0.145 | 0.004 | 0.671 | 0.097 |
| Rowan | 0.160 | 0.011 | 0.620 | 0.018 | −0.055 | 0.005 | 0.681 | 0.089 |
| Sycamore | 0.098 | 0.006 | 0.659 | 0.016 | −0.072 | 0.005 | 0.587 | 0.059 |
| Tree Species | Altitude Range (m a.s.l.) | Number of Stands | Mean Stand Ages | Number of Sampled Trees | Mean Tree Height (Standard Deviation) (m) | Mean Diameter D0 (Standard Deviation) (mm) |
|---|---|---|---|---|---|---|
| Common aspen | 335–870 | 7 | 2–11 | 180 | 3.84 (2.45) | 31.9 (21.1) |
| Goat willow | 750–1030 | 5 | 2–12 | 120 | 2.04 (0.85) | 25.0 (13.2) |
| Rowan | 941–1122 | 5 | 2–12 | 100 | 2.82 (1.21) | 36.7 (21.4) |
| Sycamore | 415–970 | 10 | 2–12 | 200 | 2.85 (2.30) | 25.8 (13.2) |
Publisher’s Note: MDPI stays neutral with regard to jurisdictional claims in published maps and institutional affiliations. |
© 2022 by the authors. Licensee MDPI, Basel, Switzerland. This article is an open access article distributed under the terms and conditions of the Creative Commons Attribution (CC BY) license (https://creativecommons.org/licenses/by/4.0/).
Share and Cite
Konôpka, B.; Pajtík, J.; Šebeň, V.; Merganičová, K. Modeling Bark Thickness and Bark Biomass on Stems of Four Broadleaved Tree Species. Plants 2022, 11, 1148. https://doi.org/10.3390/plants11091148
Konôpka B, Pajtík J, Šebeň V, Merganičová K. Modeling Bark Thickness and Bark Biomass on Stems of Four Broadleaved Tree Species. Plants. 2022; 11(9):1148. https://doi.org/10.3390/plants11091148
Chicago/Turabian StyleKonôpka, Bohdan, Jozef Pajtík, Vladimír Šebeň, and Katarína Merganičová. 2022. "Modeling Bark Thickness and Bark Biomass on Stems of Four Broadleaved Tree Species" Plants 11, no. 9: 1148. https://doi.org/10.3390/plants11091148
APA StyleKonôpka, B., Pajtík, J., Šebeň, V., & Merganičová, K. (2022). Modeling Bark Thickness and Bark Biomass on Stems of Four Broadleaved Tree Species. Plants, 11(9), 1148. https://doi.org/10.3390/plants11091148