Article

Comparison of Maize Genotypes Using Drought-Tolerance Indices and Graphical Analysis under Normal and Humidity Stress Conditions

1
Department of Biotechnology and Plant Breeding, Science and Research Branch, Islamic Azad University, Tehran 1477893855, Iran
2
Department of Agronomy and Plant Breeding, Karaj Branch, Islamic Azad University, Karaj 3149968111, Iran
3
Crop and Horticultural Science Research Department, Ardabil Agricultural and Natural Resources Research and Education Center, AREEO, Moghan 193951113, Iran
4
Institute of Land Use, Engineering and Precision Farming Technology, Faculty of Agricultural and Food Sciences and Environmental Management, University of Debrecen, 138 Böszörményi St., 4032 Debrecen, Hungary
5
Plant Breeding and Genetics, Department of Agronomy and Plant Breeding, Isfahan University of Technology, Isfahan 84156-83111, Iran
*
Author to whom correspondence should be addressed.
Plants 2022, 11(7), 942; https://doi.org/10.3390/plants11070942
Submission received: 2 March 2022 / Revised: 21 March 2022 / Accepted: 29 March 2022 / Published: 30 March 2022
(This article belongs to the Special Issue Advances in Plant Physiology and Ecophysiology)

Abstract

:
This study aimed to identify drought-tolerant genotypes and to evaluate and compare the response of genotypes under normal conditions and humidity stress. The experiment was conducted in a Randomized Complete Block Design (RCBD) on 12 commercial single cross hybrids of maize (Zea mays L.) with three replications in two separate experiments under normal and stress conditions. GT biplot was used to compare genotypes under normal conditions and humidity stress. Based on the polygon diagrams’ graphical analysis, KSC206, KSC704, KSC705 and KSC706 genotypes were identified as desirable hybrids. The ranking diagram of genotypes based on ideal genotype also showed that the KSC704 genotype had high desirability in all evaluated traits in normal and stress conditions. TOL, MP, HARM, GMP, SSI and STI indices were used to identify drought-tolerant genotypes, and the genotypes were ranked based on this index. Based on this, KSC260, SC302 and KSC400 hybrids were selected as resistant hybrids. Based on the correlation analysis between drought-tolerance indices, a positive correlation was observed between MP, GMP, HARM and STI indices. Based on the analysis of the PCA on the indices, the first and second principal components were given the titles of grain yield tolerance component under humidity stress conditions and grain yield stability component under normal humidity conditions, respectively. KSC704 was superior to other hybrids in terms of grain yield under normal conditions and stress, and the KSC260 hybrid was identified as a tolerant hybrid in terms of all studied traits under drought stress.

1. Introduction

Corn (Zea mays L.) is an annual monocotyledonous plant of the cereal family [1]. After wheat and rice, it is the third most important crop among cereals [2]. Environmental stress is one of the most important factors in reducing the yield and production of crops. To increase the yield of these products, dealing with the effects of stress is considered one of the useful methods [3]. Among abiotic stresses, drought stress is one of the biggest environmental constraints that reduces and limits crop production [4]. Drought stress is one of the most important constraints on agricultural production in most developing countries located in arid and semi-arid regions of the world. Drought stress is one of the most important factors limiting yield in maize [5]. One of the first needs of corn cultivation is water required for irrigation, which is declining in most parts of the world [6]. The most common drought-tolerance indices are the tolerance index (TOL) [7], harmonic mean (HARM) [8], mean productivity (MP), geometric mean productivity (GMP), and stress-tolerance index (STI) [9], and stress-sensitivity index (SSI) [10] to identify drought-tolerant hybrid. In most experiments, the correlation between TOL and SSI indices is positive, and selection based on SSI index is effective in low-yield genotypes under stress conditions and in high-yield genotypes under stress conditions [11]. Based on Ranjbar and Rousta’s study on wheat genotypes, the STI index was introduced as an effective indicator in genotype selection [12]. In another study conducted by Sedri, it was reported as the best indicator for selecting maize hybrids in STI stress conditions [13]. The GGE biplot method can be used to analyze multivariate experiments; this method can also be used in line × tester, genotype × environment and genotype × traits [14,15]. The GGE biplot method, due to its high flexibility in analysis, can graphically play a very important role in selecting the desired genotypes [14]. To investigate the interaction between genotype and trait (GT biplot), one of the GGE biplot methods, Yan and Rajkan used different traits in the studied genotypes in their experiments [16]. A study of eight commercial maize hybrids used drought-tolerance indices to select the most tolerant genotypes under stress conditions [17]. Many studies have been conducted on various plants using drought-tolerance indices, including wheat [18] and safflower [19]. Drought-tolerance depends on morphological and physiological characteristics in plants. Morphological traits correlated with drought-tolerance included early maturity; shape; the size and structure of stomata; size; the number and direction of leaves; the presence of cuticle, waxiness of stem, or leaf blade and rooting pattern; and physiological traits including photosynthesis rate, transpiration rate, osmotic concentration, etc., which are different genotypes due to the poly-genetic nature of these traits [20]. One of the most important factors in selecting particle hybrids (Zea mays L.) is phenotypic evaluation, and high yield under normal conditions and humidity stress in a specific area. This study investigated the relationship between different traits with grain yield, selected the most important morphological characteristics affecting grain yield under normal conditions and humidity stress, and determined the most tolerant hybrid under stress conditions using drought-tolerance indices. The purpose of this study includes: (1) to compare traits in maize hybrids under normal conditions and water stress, (2) to study and select stress-resistant genotypes using drought-tolerance indices, (3) to investigate the correlation between traits under normal and stress conditions, (4) selection of superior genotypes based on the evaluated traits, and (5) investigation of the relationship between grain yield traits and traits related to grain yield.

2. Results and Discussion

2.1. Analysis of Variance and Mean Comparison

Analysis of variance in terms of traits was performed on the tested hybrids. Under normal humidity conditions, different hybrids had significant differences in all traits except plant height, number of rows per ear, grain length and grain thickness. Under stress conditions, genotypes showed significant differences in all traits except plant height, the number of grains per row, grain width and grain thickness. In both normal and stress conditions, the highest percentage of coefficient of variation was related to the grain thickness trait, and the lowest was related to the ear length trait (p ≤ 0.01) (Table 1). The significant difference between different genotypes in maize yield and yield-dependent traits indicates genetic diversity and the possibility of selection for genotype tolerant to drought stress [21]. Comparing the mean of Duncan method genotypes under normal and stress conditions showed that KSC707, SC301 and KSC704 genotypes had better performance than other hybrids in all evaluated traits, respectively. Additionally, the DC307 genotype under normal conditions and the KSC400 genotype under stress conditions were identified as hybrids with low yield and rank (Table 2), Mousavi et al. [22]. In their experiments under normal humidity conditions, the KSC704 genotype had the highest yield compared to other hybrids.

2.2. Analysis of Correlations between Traits

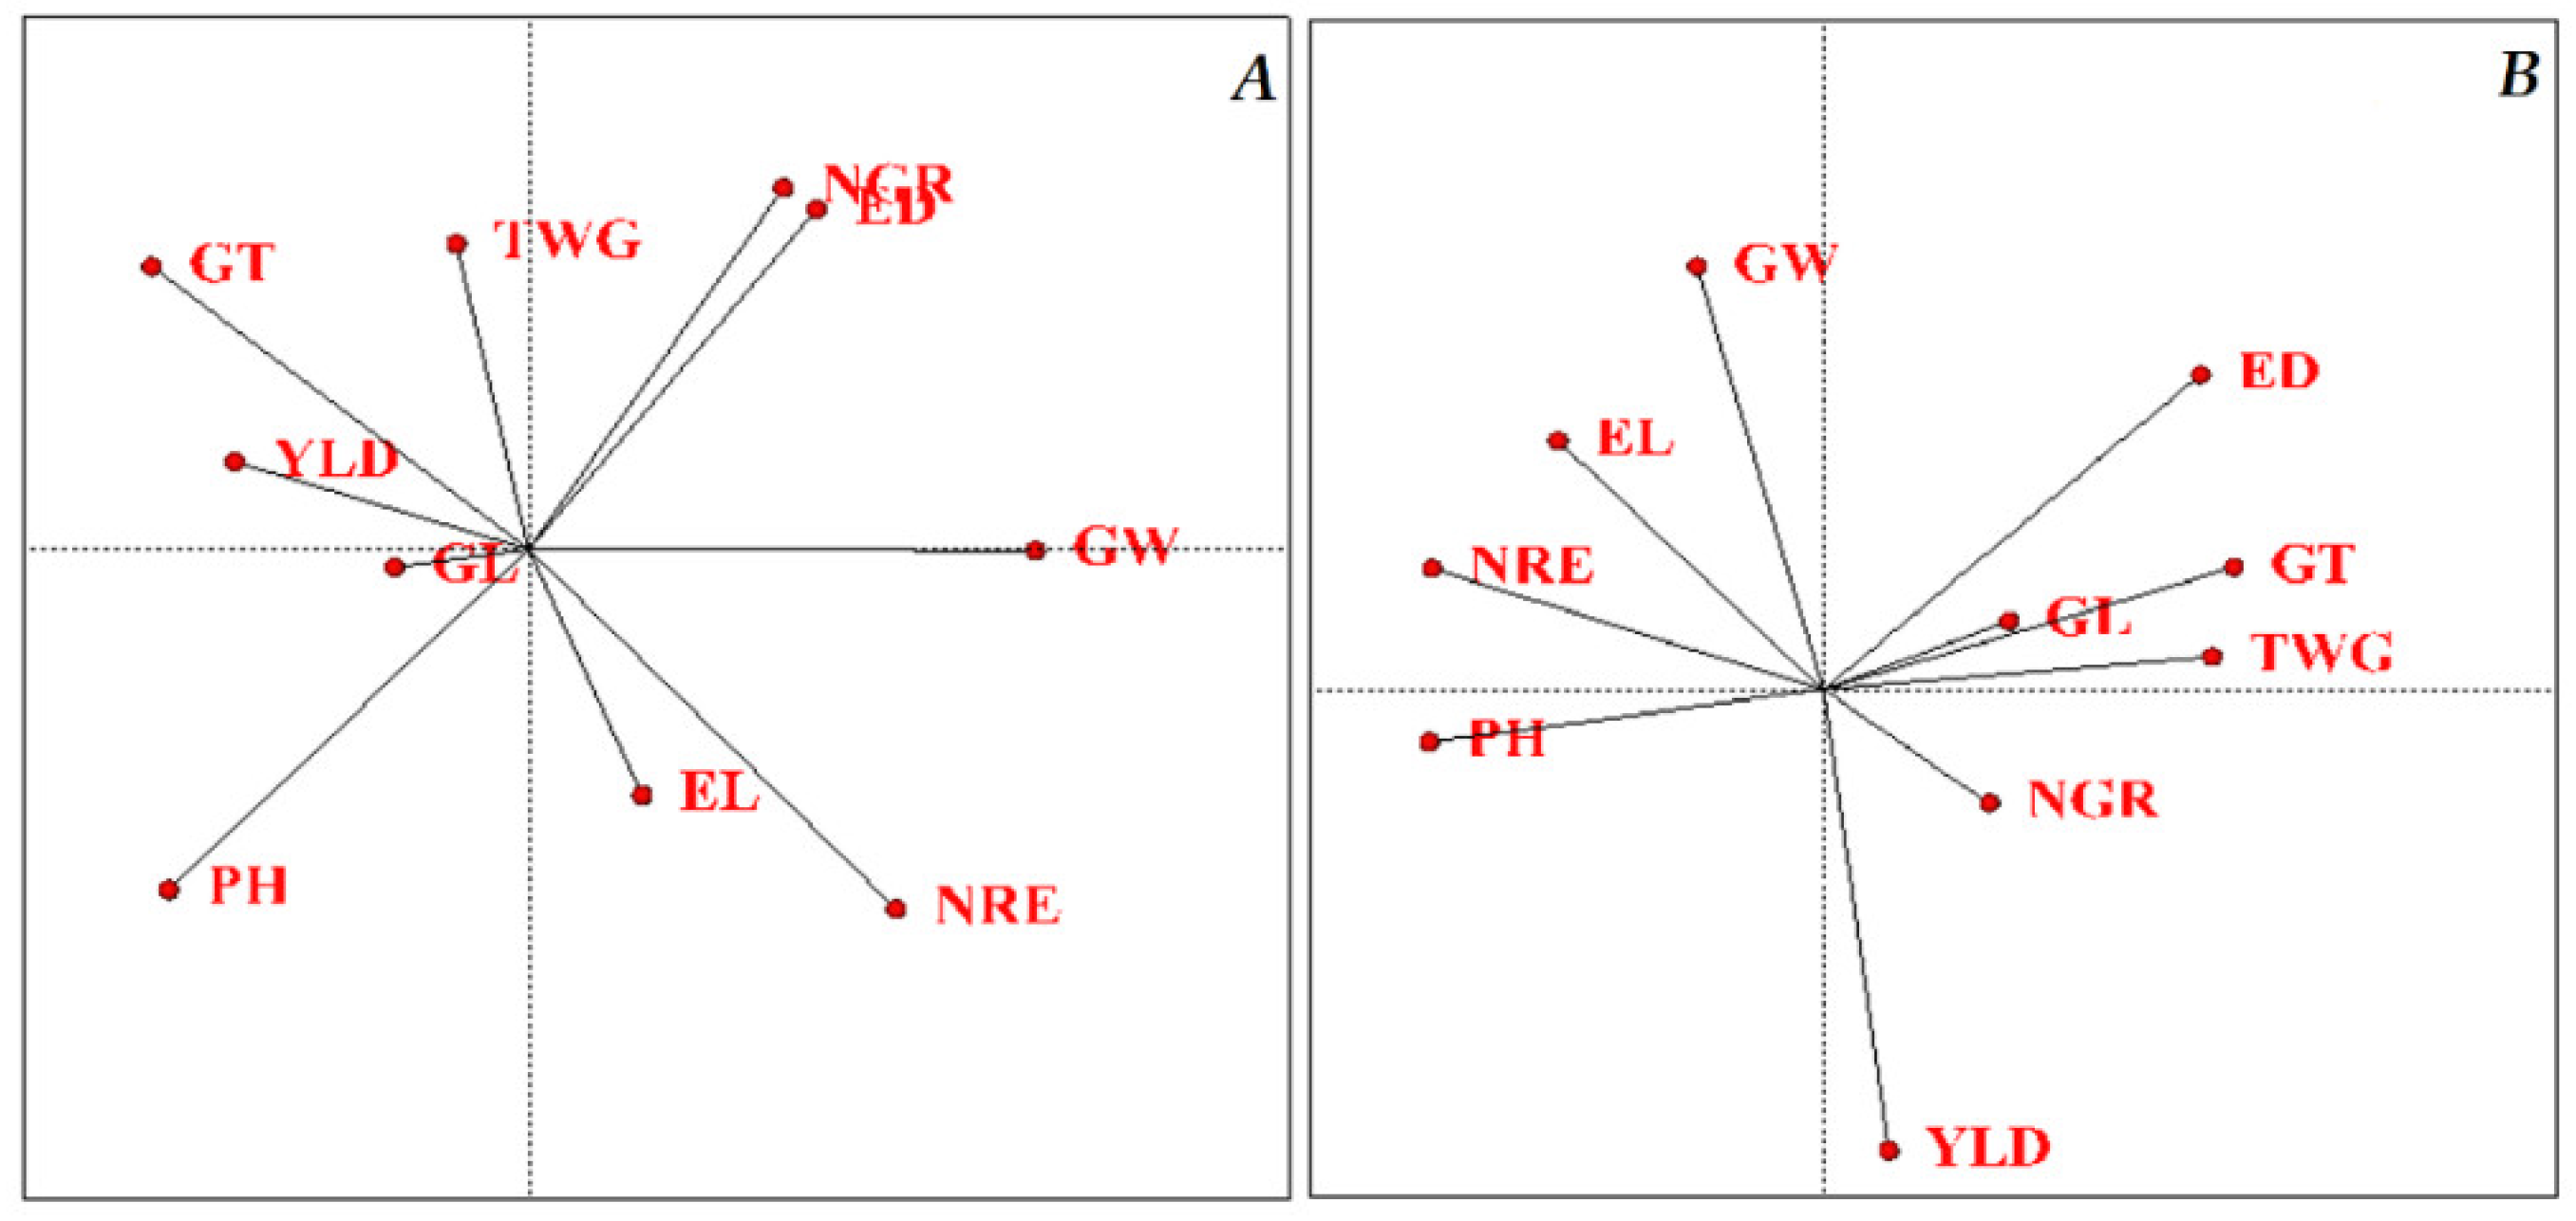
The correlation coefficient matrix for normal humidity conditions also showed the number of grains per row with the trait of ear width, the number of rows per ear with the number of grains per ear, the grain width trait with the ear width, and the grain length trait with the ear length; the trait Grain thickness had a positive and significant correlation with grain width and grain yield with grain length and 1000-grain weight. There was also a significant negative correlation between ear width, number of grains per row and grain width–plant height, grain thickness-ear length, grain yield-ear width, grain length and grain thickness-number of rows per ear. The results of correlation coefficients under stress conditions also showed a positive and significant correlation between ear length, grain length and 1000-grain weight-plant height, ear width, number of seeds per row and number of rows per ear-ear length, grain width, grain thickness, 1000-grain weight and grain yield-ear width, grain thickness-number of rows per ear, grain length and grain yield-grain thickness, 1000-grain weight-grain length and grain thickness, and grain yield-1000-grain weight. Additionally, a negative and significant correlation was observed between the number of rows per ear with the ear’s width, the grain thickness with the grain length and the trait of 1000-grain weight with the grain width (Table 3). Refiq et al. The authors of [23] reported a significant positive correlation between 1000-grain weight and grain yield in the plot. To investigate the correlation of the studied traits, a graphical analysis of the correlation between the traits was used (Figure 1). In this cosine biplot diagram, the angle between the trait vectors indicates the intensity of the correlation between the traits. Suppose the angle between the vectors is less than 90 degrees. In that case, the correlation between the vectors is equal to +1. If the angle between the vectors of the attributes is 90 degrees, the correlation between the vectors of the attributes is zero. If the angle between the vectors is 180 degrees, the correlation is −1 [24]. Based on the graph obtained under normal conditions (Figure 1A); the number of grains per row and ear width together; the number of rows per ear and ear length together; the plant height traits with grain length; and finally, the grain yield traits, grain length, grain thickness and 1000-grain weight showed a positive and significant correlation. The 180-degree angle between the plant height and ear width vectors showed a significant negative correlation between these two traits. Based on the graph obtained under stress conditions (Figure 1B), ear width; grain thickness; ear length; 1000-grain weight together and grain width; ear length and number of rows per ear together; and, finally, grain yield trait with the number of grain per row had a positive correlation. A negative correlation was observed between plant height and 1000-grain weight and grain yield with grain width, Farajzadeh et al. [25]. In the study of grain yield and yield components of 22 maize genotypes, a positive and significant correlation was observed in the number of grains per row, the number of grains per ear, and ear length with grain yield [21]. Mousavi et al. also reported a significant positive correlation between grain yield traits and many grains per row [26].

2.3. Ranking and Grouping of Genotypes in Terms of Traits

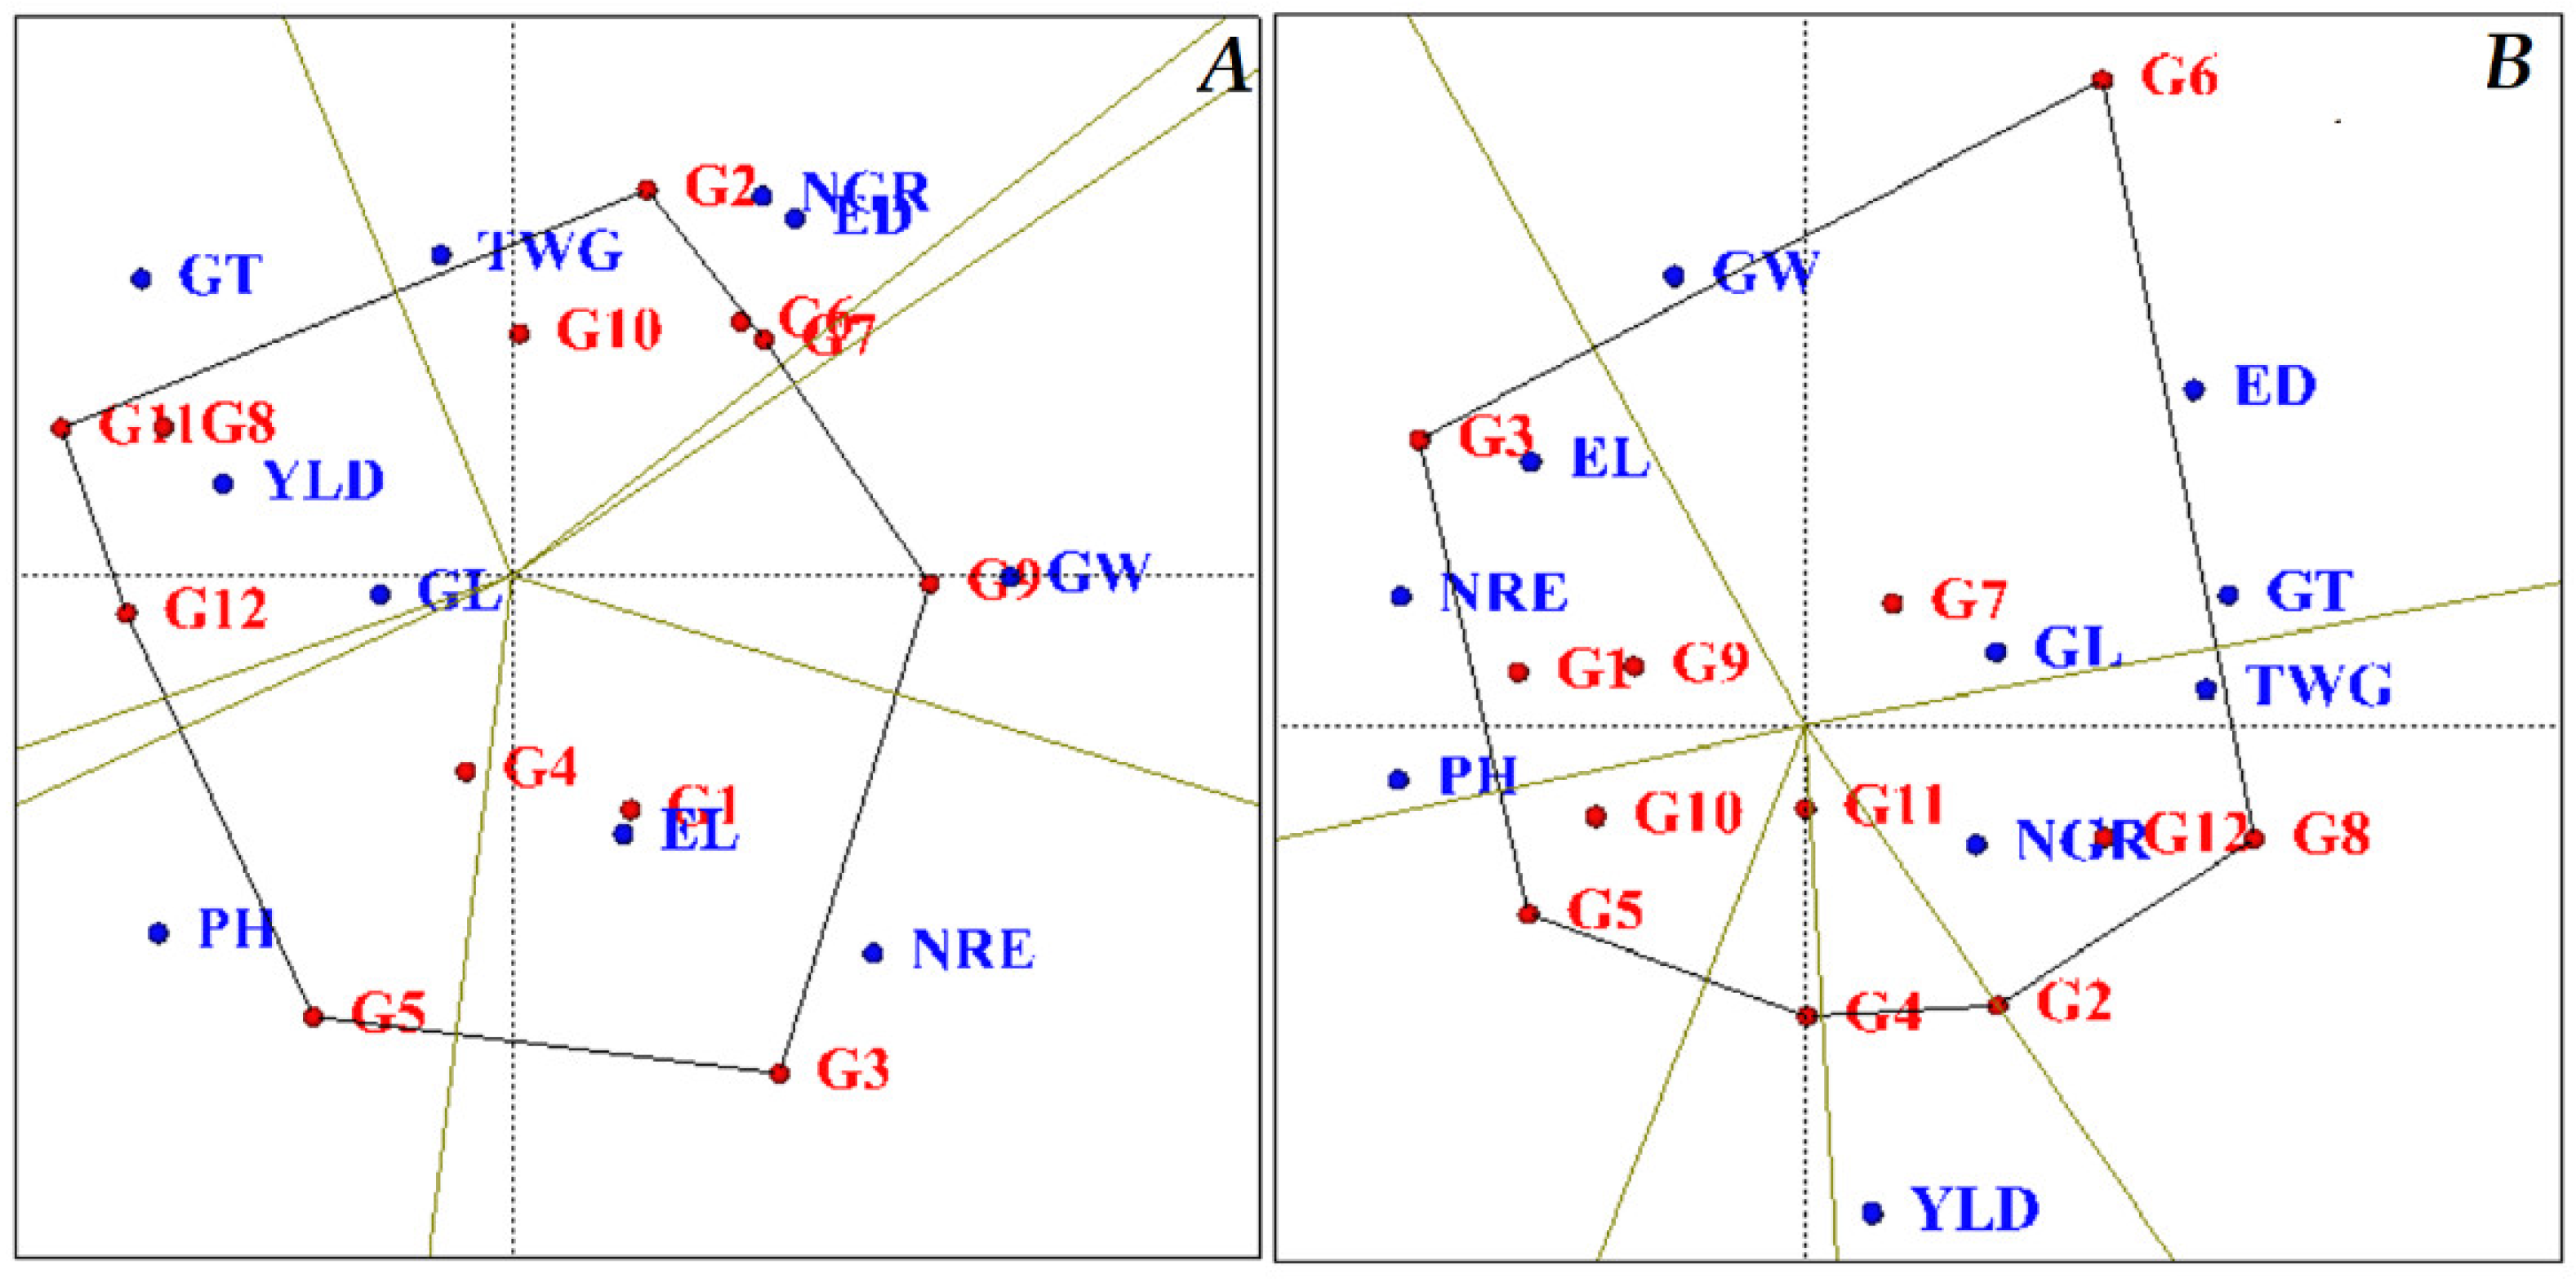
A polygon diagram identifies the best genotypes among the studied traits. This diagram is drawn by connecting the genotypes farthest from the origin so that the other genotypes fit into this polygon. In each section, genotypes with higher yield and desirability with specific traits are separated by lines [27,28]. The authors of [29] used this type of graph for their studies on rapeseed cultivars and maize cultivars [29]. Based on the polygon diagram obtained under normal humidity conditions (Figure 2A), KSC260, KSC704, KSC707, SC647, KSC705, KSC706, SC301 and SC604 hybrids had the longest distance from the origin of the diagram. They were placed at the vertex of the polygon. Titles of desirable hybrids were identified in terms of traits. In each section, KSC260 hybrid in terms of the number of grains per row and ear width, SC647 hybrid in terms of grain width, KSC705 hybrid in terms of a number of rows per ear, KSC706 genotype in terms of plant height, and SC604 and DC370 genotypes in terms of traits grain yield and grain thickness were identified as more favorable hybrids than other genotypes (Figure 2A). The diagram obtained under stress identified KSC704, DC370, KSC260, KSC400, KSC706 and KSC705 genotypes as more favorable genotypes than other genotypes. In each section, DC370 and SC301 genotypes were identified in terms of numbers of grain per row and KSC705 hybrid in terms of ear length and number of rows per ear as high-performance genotypes in these traits (Figure 2B). Considering the comparison of normal and stress conditions, it can be concluded that based on this diagram, KSC260, KSC704, KSC705 and KSC706 genotypes are identified as desirable hybrids in both conditions. In terms of adjective, the number of rows per ear shows good stability and performance.

2.4. Ranking of Genotypes Based on Ideal Genotype

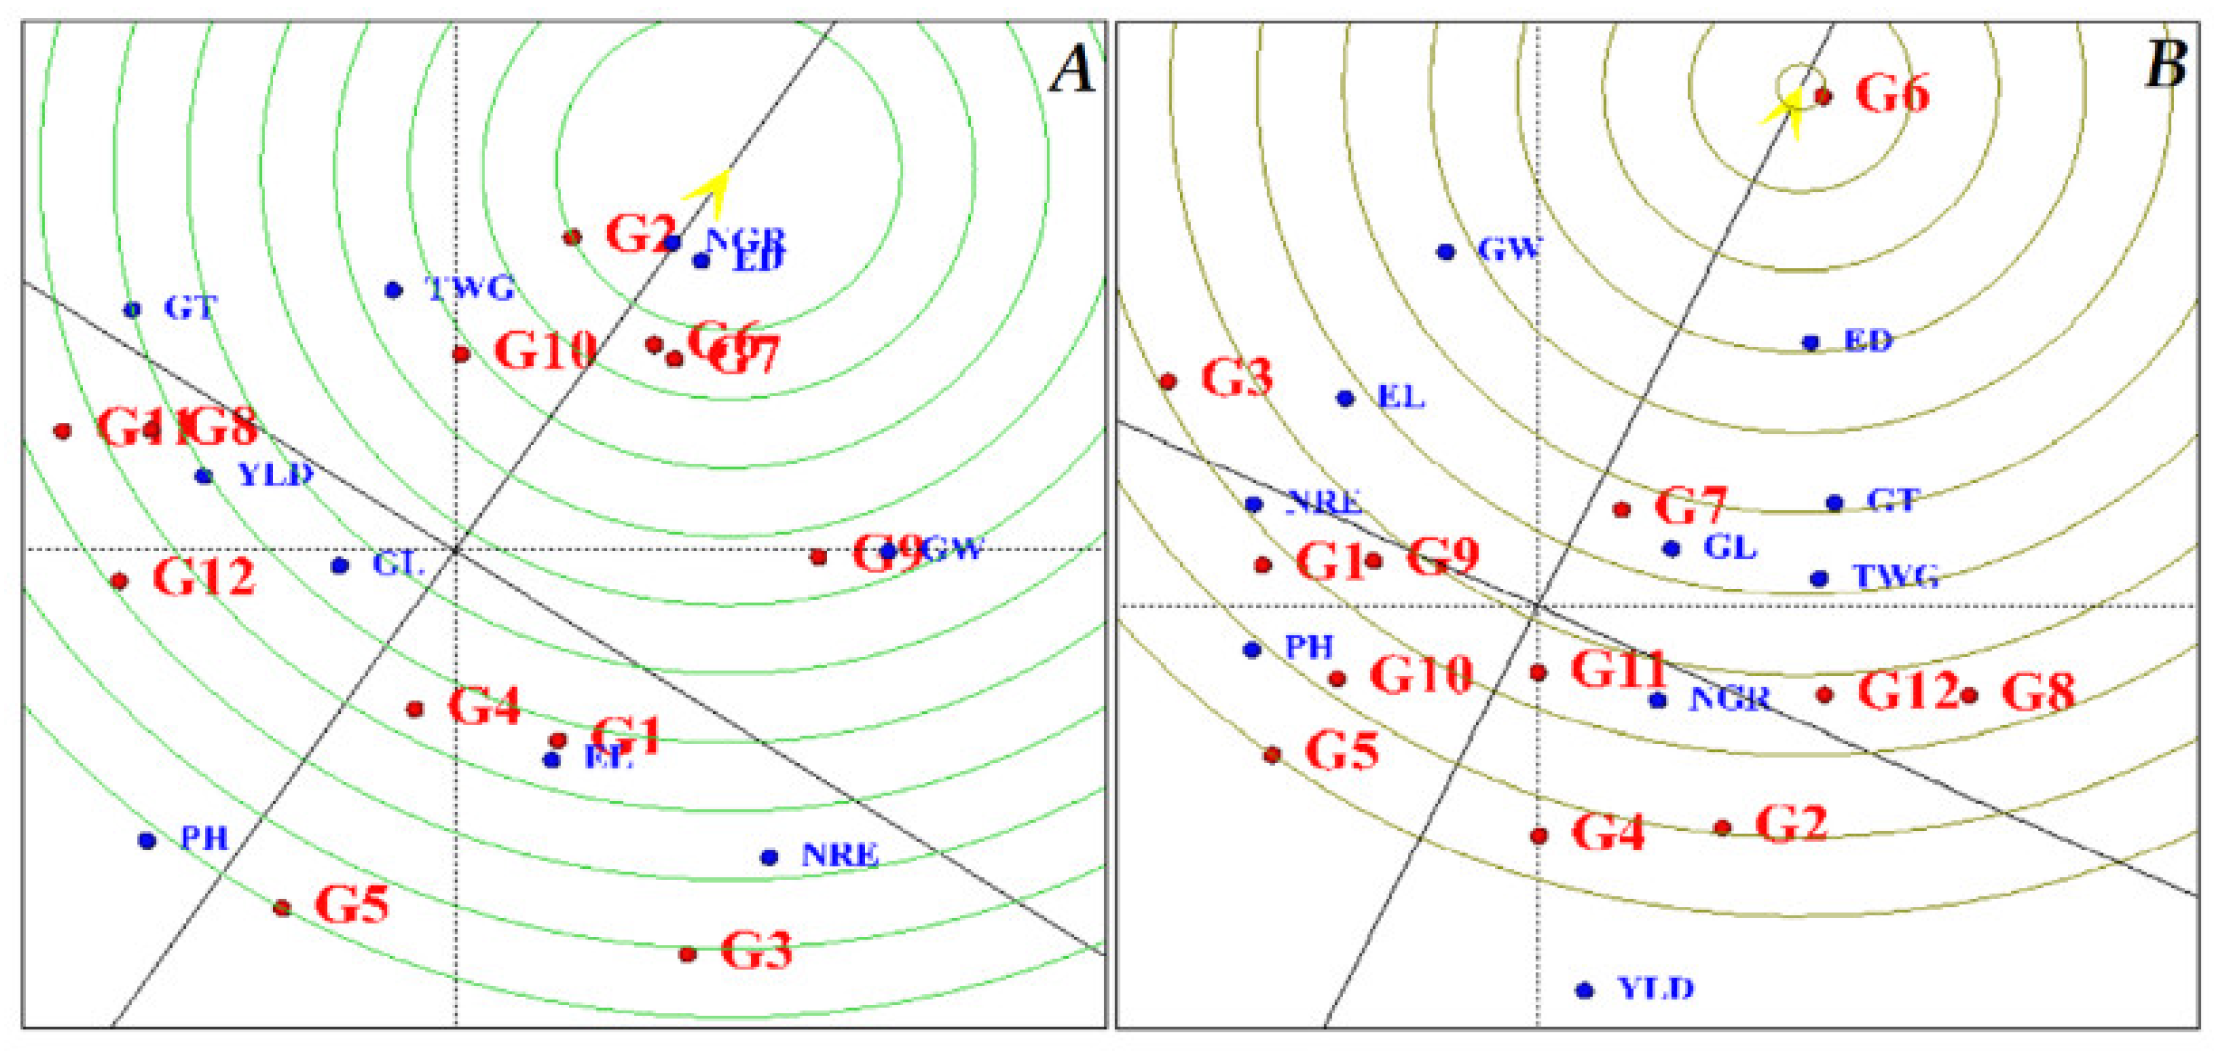
According to the genotype-ranking diagram, the ideal genotype (Figure 3) is connected to the mean point from the origin of the coordinates of the linear graph and continues to both sides. In this form, the best point is the center of the concentric circle, which is marked with an arrow, and other genotypes are ranked according to this point. Based on the diagram obtained under normal moisture conditions (Figure 3A), KSC260 and KSC704 genotypes were preferred to other hybrids. KSC706 and KSC705 genotypes were also identified as unfavorable genotypes. The order of genotypes from the best hybrid to the most unfavorable hybrid is as follows:
KSC260 > KSC704 > KSC707 > SC302 > SC647 > DC370 > SC604 > SC301 > KSC400 > KSC703 > KSC705 > KSC706.
In the diagram obtained under stress conditions, KSC704 and KSC707 hybrids were identified as desirable hybrids and KDC260, KSC400 and KSC706 genotypes were based on the ideal genotype unfavorable hybrids (Figure 3B). The order of genotypes from the best genotype to the most unfavorable genotype in stress conditions is as follows:
KSC704 > KSC707 > KSC705 > SC647 > SC604 > SC301 > DC370 > KSC703 > SC302 > KSC260 > KSC400 > KSC706.

2.5. Grouping of Hybrids

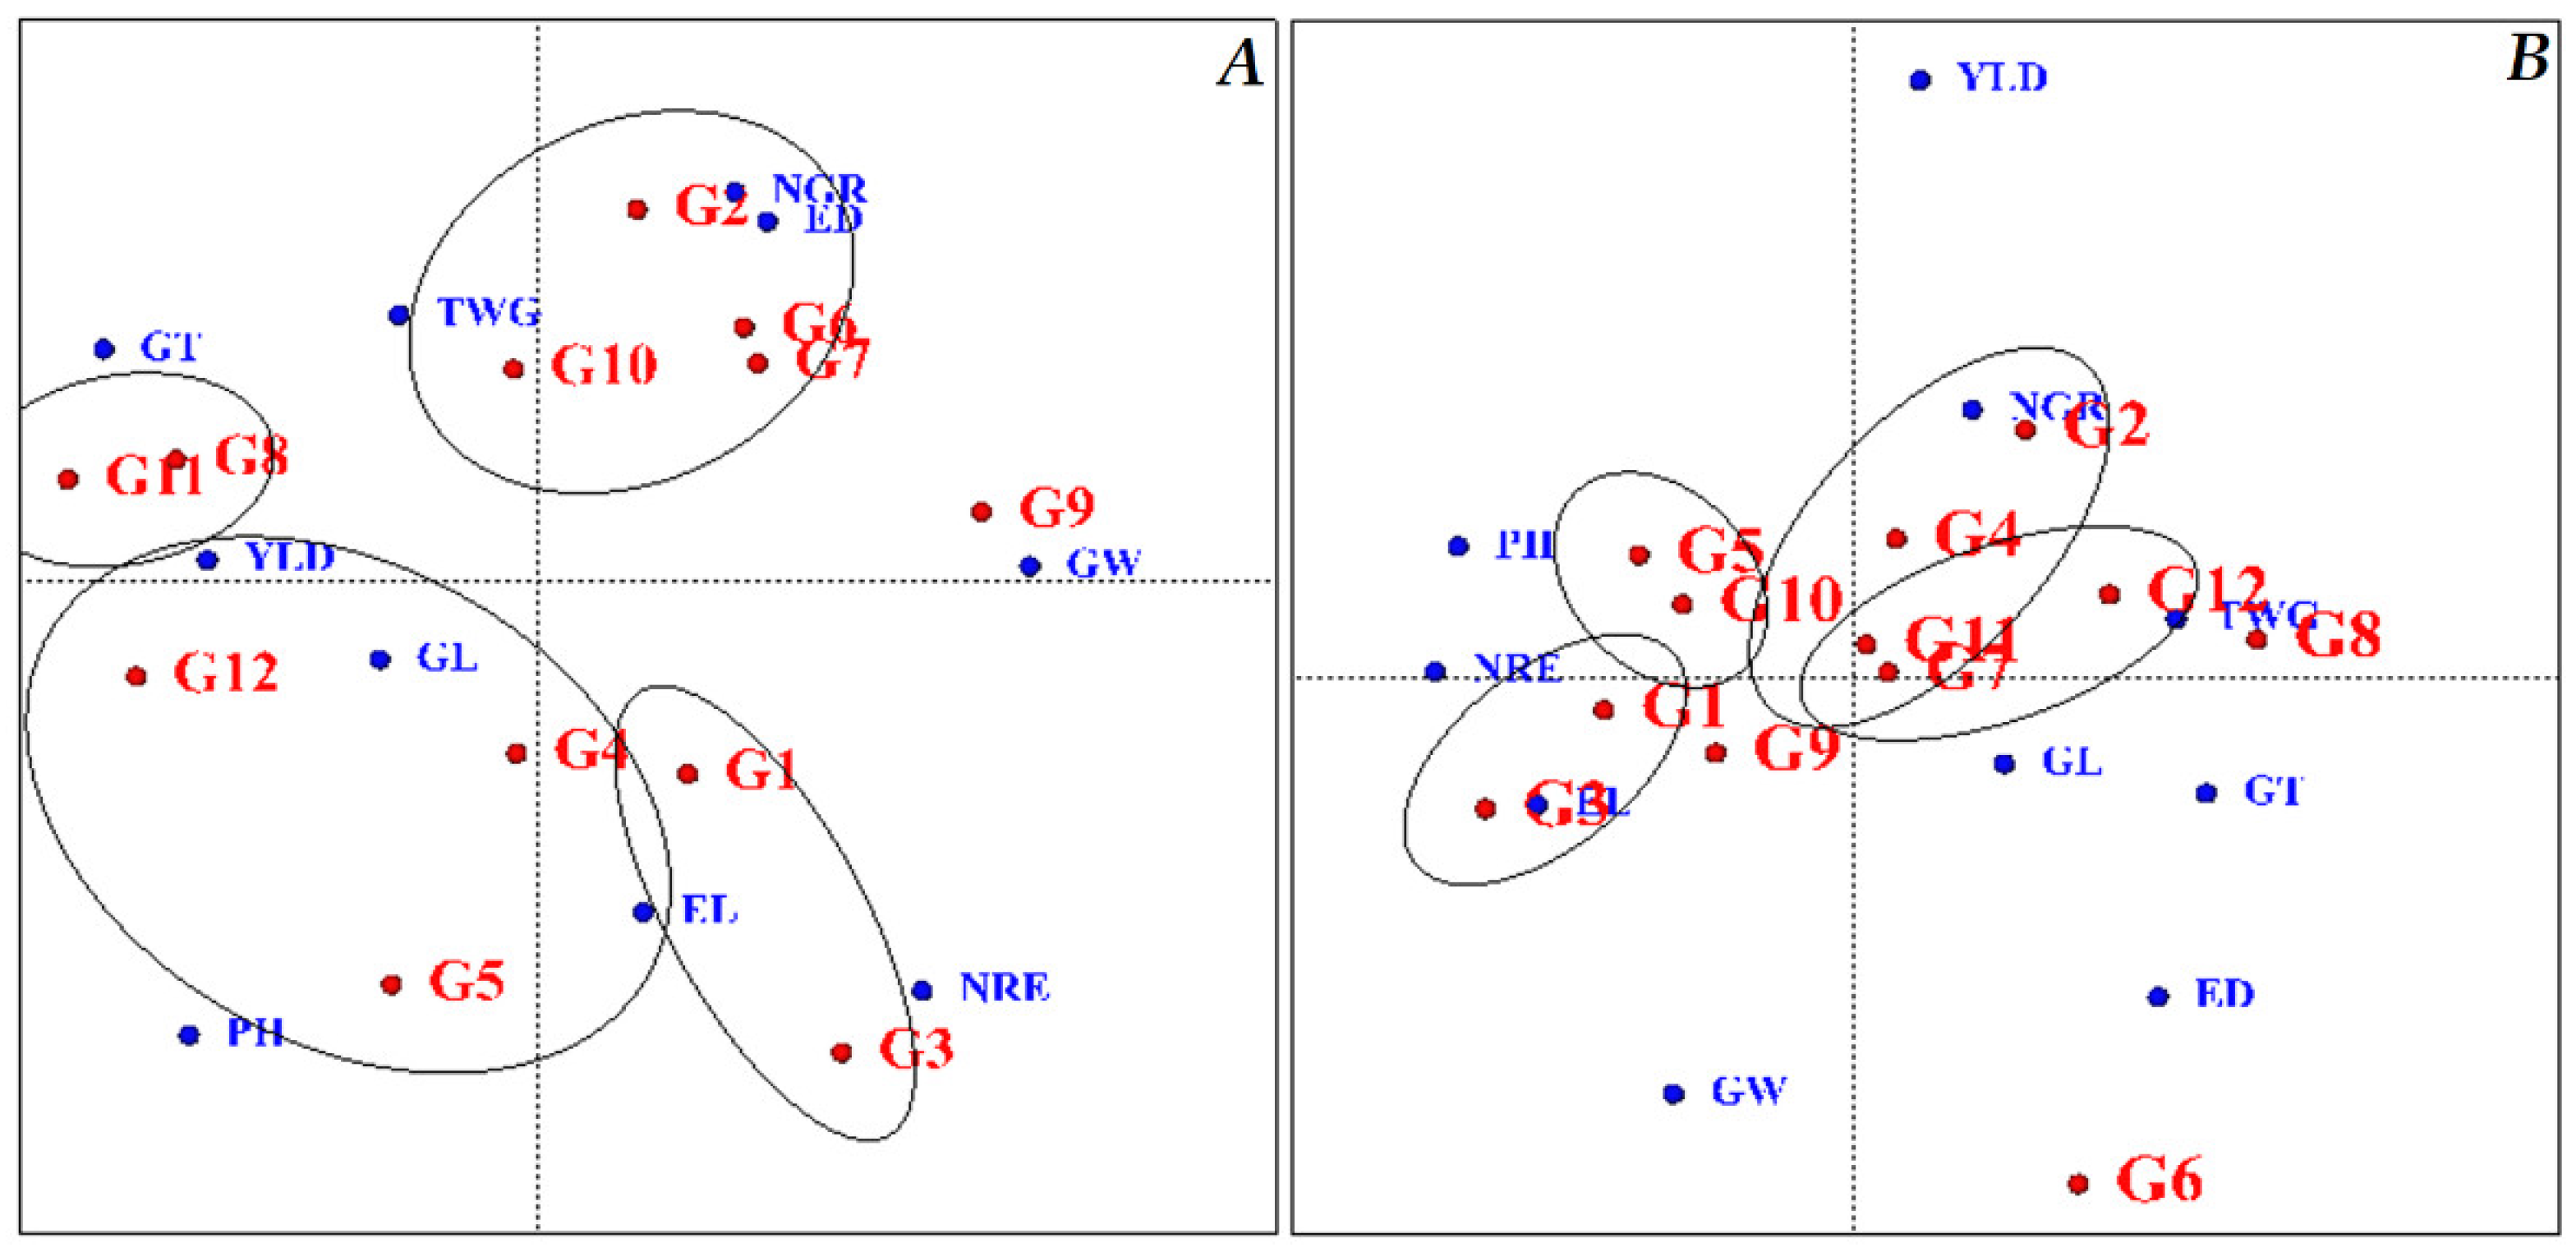
The genotype grouping diagram evaluates hybrids based on stability and yield in different traits and groups the genotypes based on the traits (Figure 4). Based on the grouping diagram under normal humidity conditions, four groups were formed regarding yield and desirability in all traits. The first group included KSC260, KSC704, KSC707 and SC302 genotypes; the second group included DC370 and SC604 genotypes; the third group included SC301 KSC400 KSC706 genotypes; and the fourth group included KSC703 and KSC705 genotypes. The SC647 genotype was not grouped (Figure 4A). Under stress conditions, the grouping diagram classified the genotypes into four groups. The first group included KSC707, SC301 and SC604 genotypes; the second group included KSC260, KSC400, SC604 and KSC707 genotypes. In these two groups, two hybrids, KSC707 and SC604, were common between these groups. KSC706 and SC302 genotypes were in the third group, and KSC703 and KSC705 were in the fourth group. In this diagram, DC370, SC647 and KSC704 genotypes were not in any group (Figure 4B). By examining the graphs of normal and stress conditions, KSC703 and KSC705 genotypes were in the same group in both conditions, indicating the stability of these two genotypes in terms of the studied traits under stress.

2.6. The Centred Scatter Plot

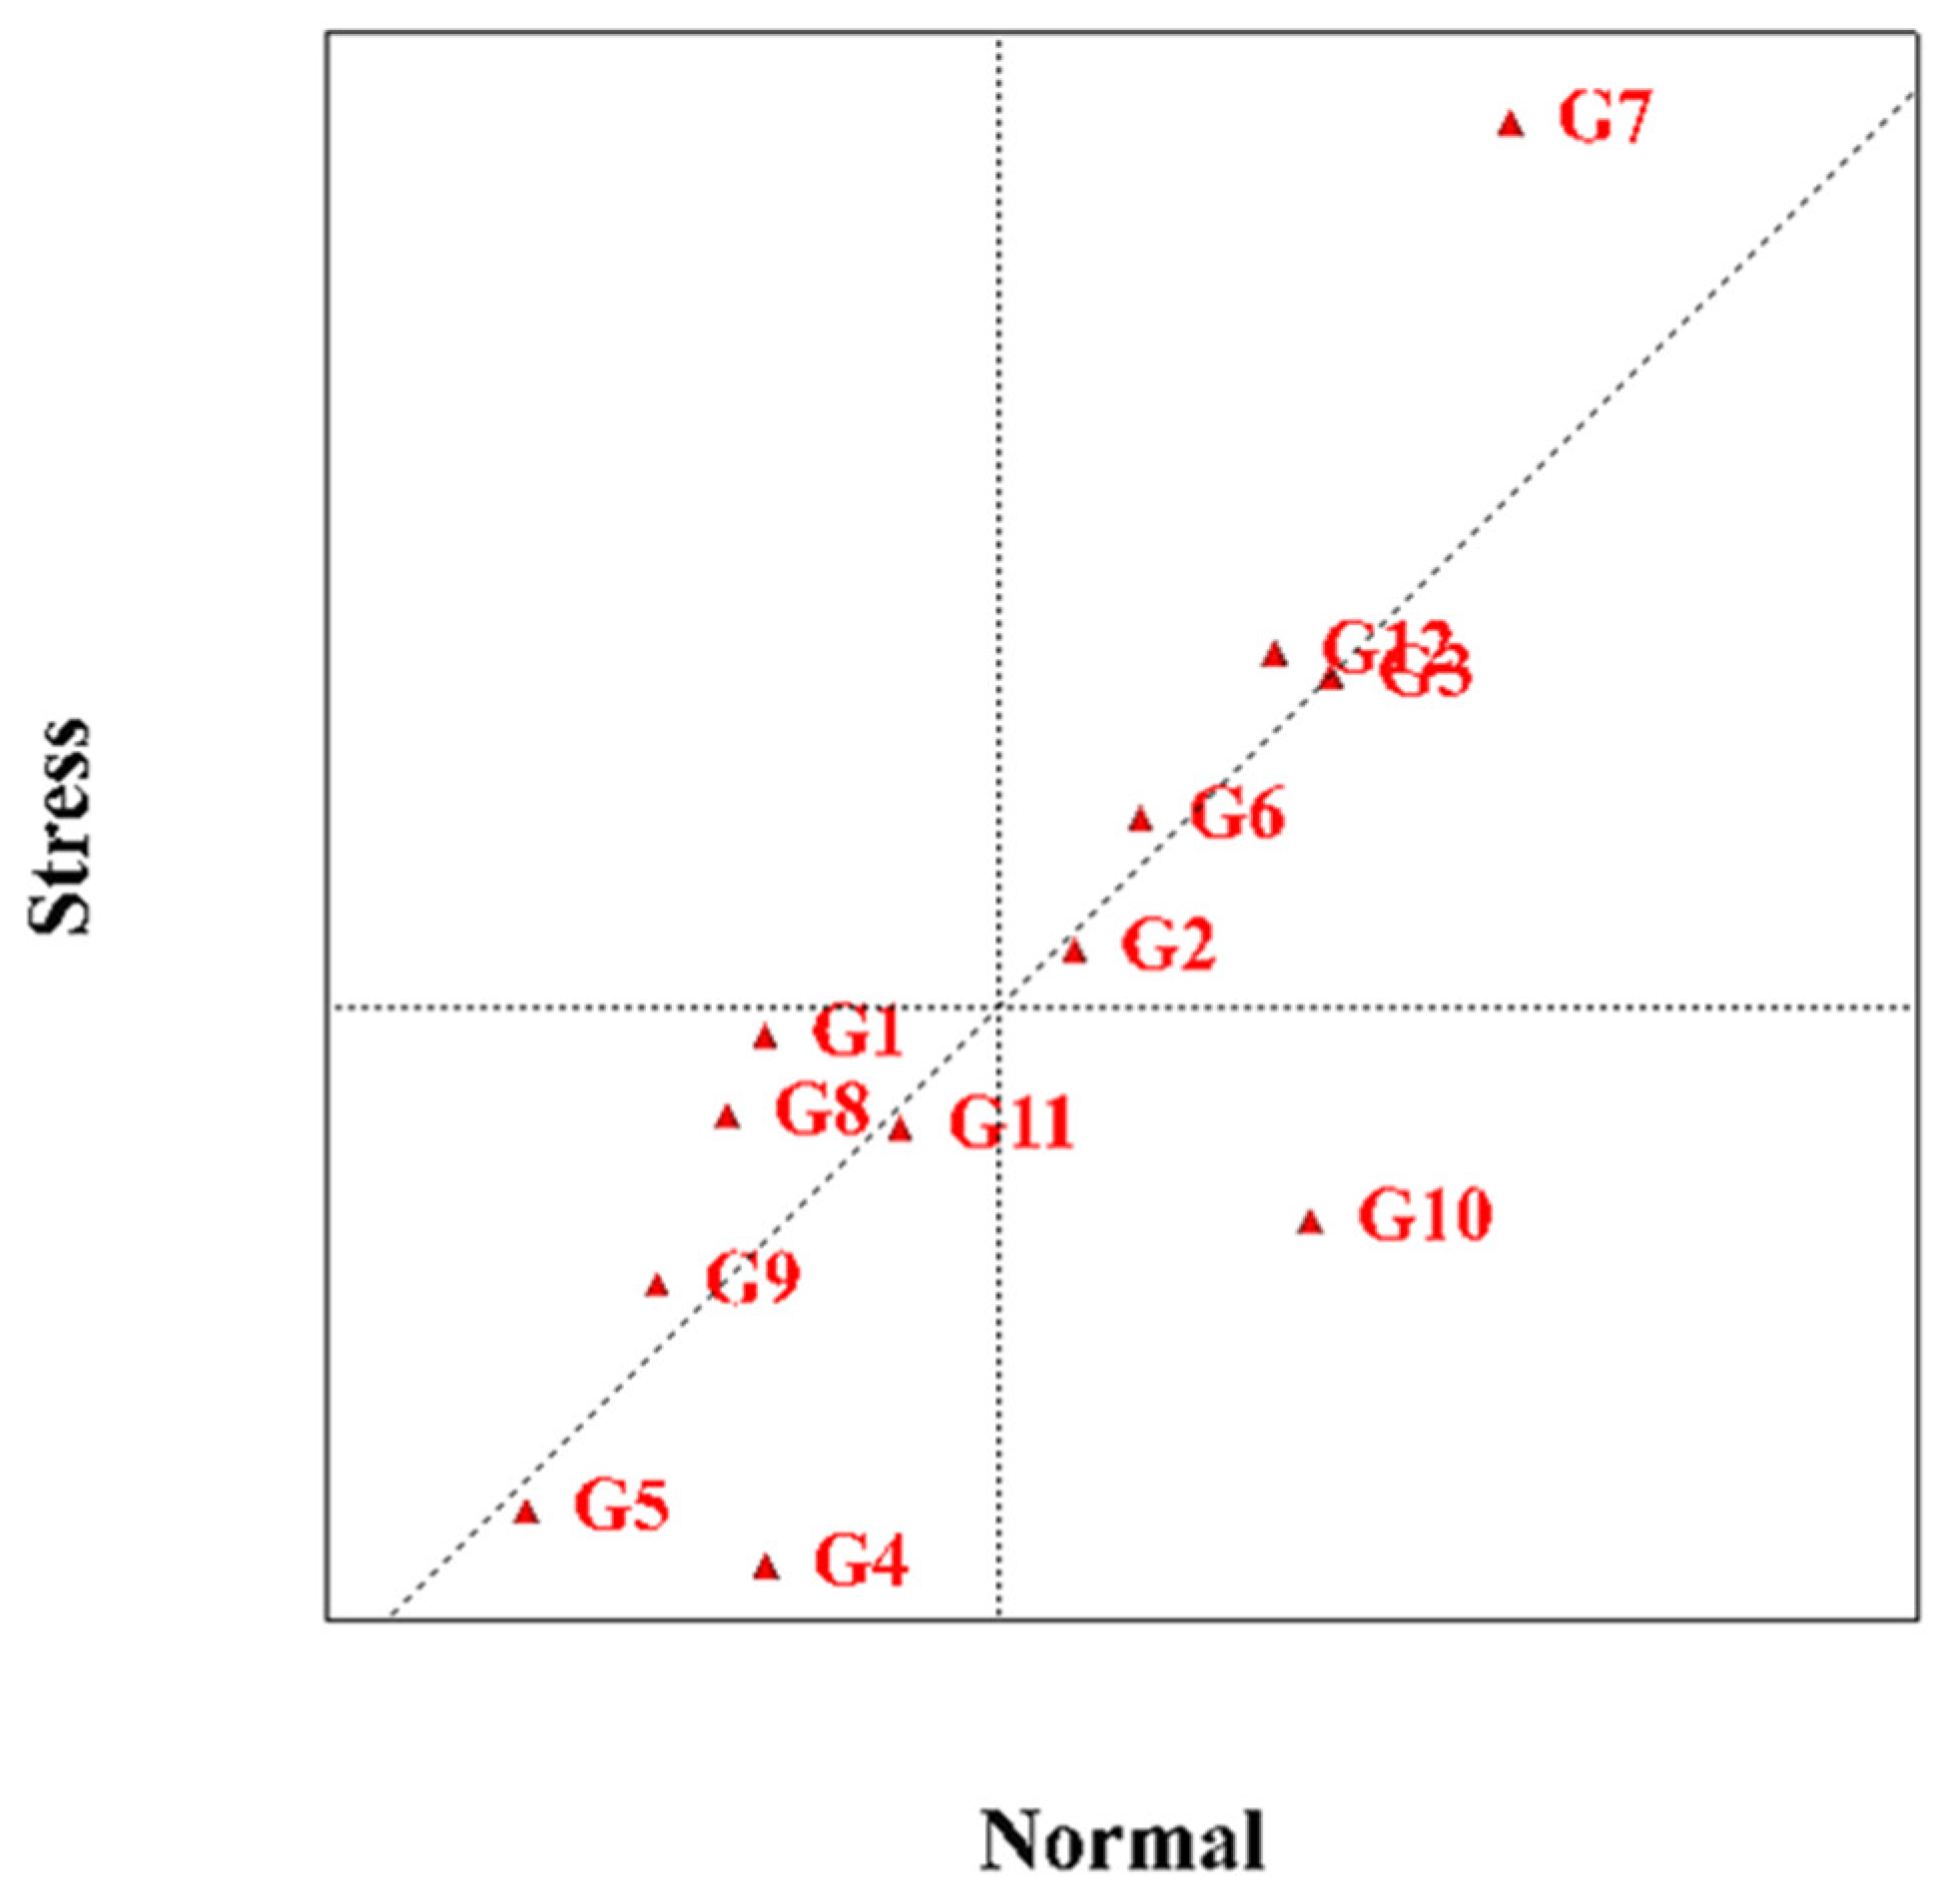
This diagram is a two-dimensional graph used to compare genotypes in two different positions or compare different positions and test environments in two genotypes. This diagonal linear diagram is divided into two parts and shows compatible and stable genotypes in each environment. According to Figure 5, which shows the genotypes in terms of all the traits evaluated in the experiment under normal conditions and moisture stress, KSC400 and SC302 hybrids are among the hybrids that have good performance in all traits under normal conditions. KSC707, KSC703 and DC370 are also hybrids that have better performance under drought stress conditions. The rest of the genotypes were identified as stable intermediate hybrids in both conditions due to their proximity to the line separating the normal and stress positions.

2.7. Evaluation of Drought Stress Using Drought-Tolerance Indices

Drought-tolerance indices were analyzed to evaluate the evaluated hybrids under drought stress conditions (Table 4). The highest and lowest mean yields under normal conditions of humidity and stress did not belong to a specific genotype, so the use of stress tolerance and sensitivity indices is effective in evaluating genotypes. According to the Drought-Tolerance Index (TOL), which is obtained from the difference in the performance of each genotype under normal and stress conditions, tolerant hybrids are considered to be less than this index [30]. Based on this index, the KSC260 genotype was the most resistant hybrid with 1.38, and in the second and third ranks were DC370 (1.42) and KSC400 (1.53) hybrids, respectively. The highest TOL index was related to the SC302 genotype (2.34). Based on the mean productivity index (MP), genotypes are tolerated that have a higher value of this index [7]. Based on this index, KSC260 (6.95), SC302 (6.83) and KSC400 (6.63) genotypes as tolerant genotypes and KSC704 (5.245) and SC647 (5.635) hybrids as sensitive hybrids were identified. Based on the Harmonic Mean (HARM), the genotype with the highest index value was identified as the resistant genotype. Based on this, KSC260 (6.881), SC302 (629.6) and KSC400 (6.546) hybrids were identified as resistant hybrids, and KSC704 (0.512) and SC647 (5.525) genotypes were identified as susceptible hybrids. Based on the Geometric Mean Performance Index (GMP), tolerant genotypes accounted for more of this index. Accordingly, KDC260 (6.91), SC302 (6.72) and KSC400 (6.59) hybrids were identified as resistant hybrids, and KSC704 (5.12) and SC647 (5.58) genotypes were identified as susceptible hybrids. According to the Stress Sensitivity Index (SSI), which is mostly used to remove sensitive genotypes, any genotype with higher values of this index is more sensitive to stress [10]. Accordingly, hybrids of KDC260 (0.71), DC370 (0.81) and KSC400 (0.82) as the most resistant hybrids and genotypes SC302 (1.6) and KSC704 (1.38) as susceptible genotypes were identified. According to the stress tolerance index (STI), the higher the value of this index, the more tolerance of the genotype, based on the genotypes KSC260 (17.3), SC302 (16) and KSC400 (15.9) as resistant genotypes, and KSC704 (10.4) and SC647 (12.2) hybrids were identified as susceptible hybrids. Based on the results obtained from Table 4, it can be concluded that based on drought-tolerance indices on hybrids studied in this experiment, KSC260, SC302 and KSC400 hybrids are drought-tolerant hybrids. KSC704 and SC647 genotypes were identified as susceptible hybrids (Table 4). Table 5 also shows the selected hybrids based on drought-tolerance indices.

2.8. Correlation of Drought-Tolerance Indices

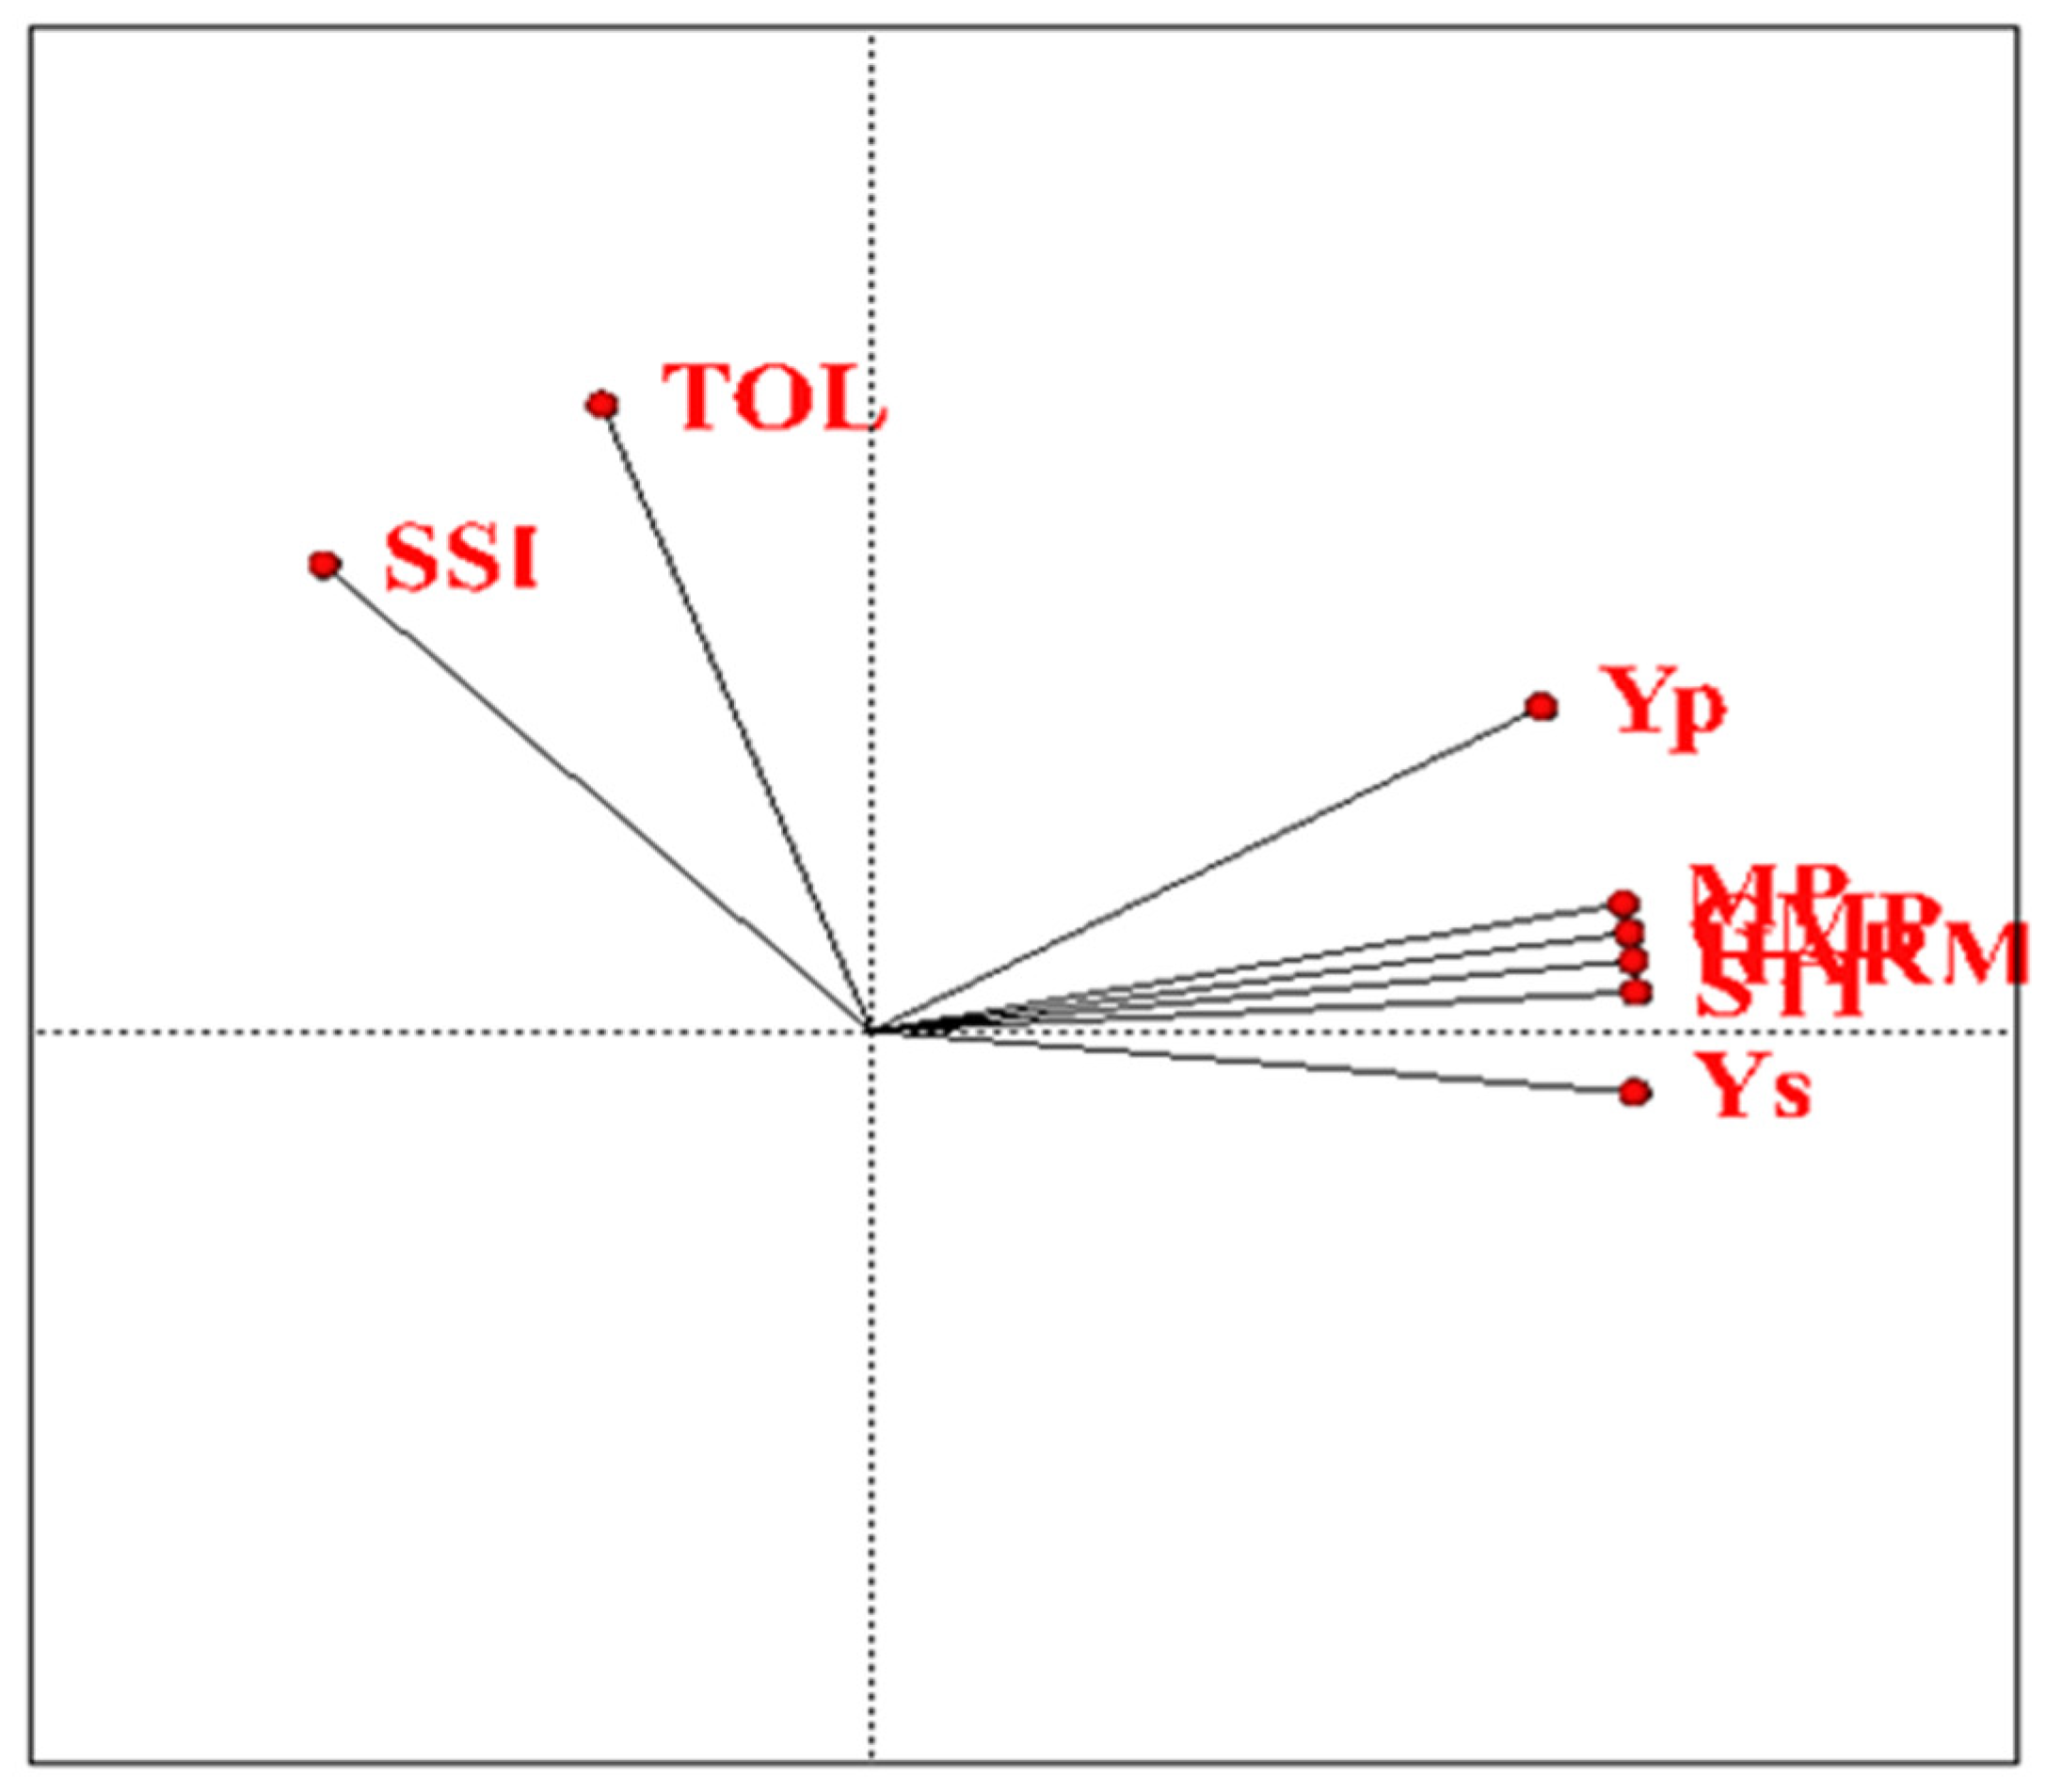
Correlation coefficients based on data obtained from grain yield under normal humidity and stress conditions with drought-tolerant indices showed that TOL, MP, HARM and SSI indices with average grain yield under normal humidity conditions (Yp); index GMP with mean grain yield under stress (Ys); MP, HARM and SSI indices with TOL index; HARM and SSI indices with MP index; and SSI index with HARM index had a positive and significant correlation at the probability level of 0.01. (Table 6). Additionally, based on the correlation diagram drawn between the data obtained from the average grain yield under normal conditions of moisture (Yp) and moisture stress (Ys) as well as drought-tolerance indices, it can be concluded that between MP GMP, there is a significant positive correlation between HARM, STI, Yp and Ys. According to the 90-degree angle between the vectors of MP and TOL, the correlation was estimated to be zero (Figure 6). Many researchers have reported a significant positive correlation between Yp and Ys, suggesting that high-yielding genotypes under normal conditions can perform well under stress conditions [13,30].

2.9. Polygon Diagram

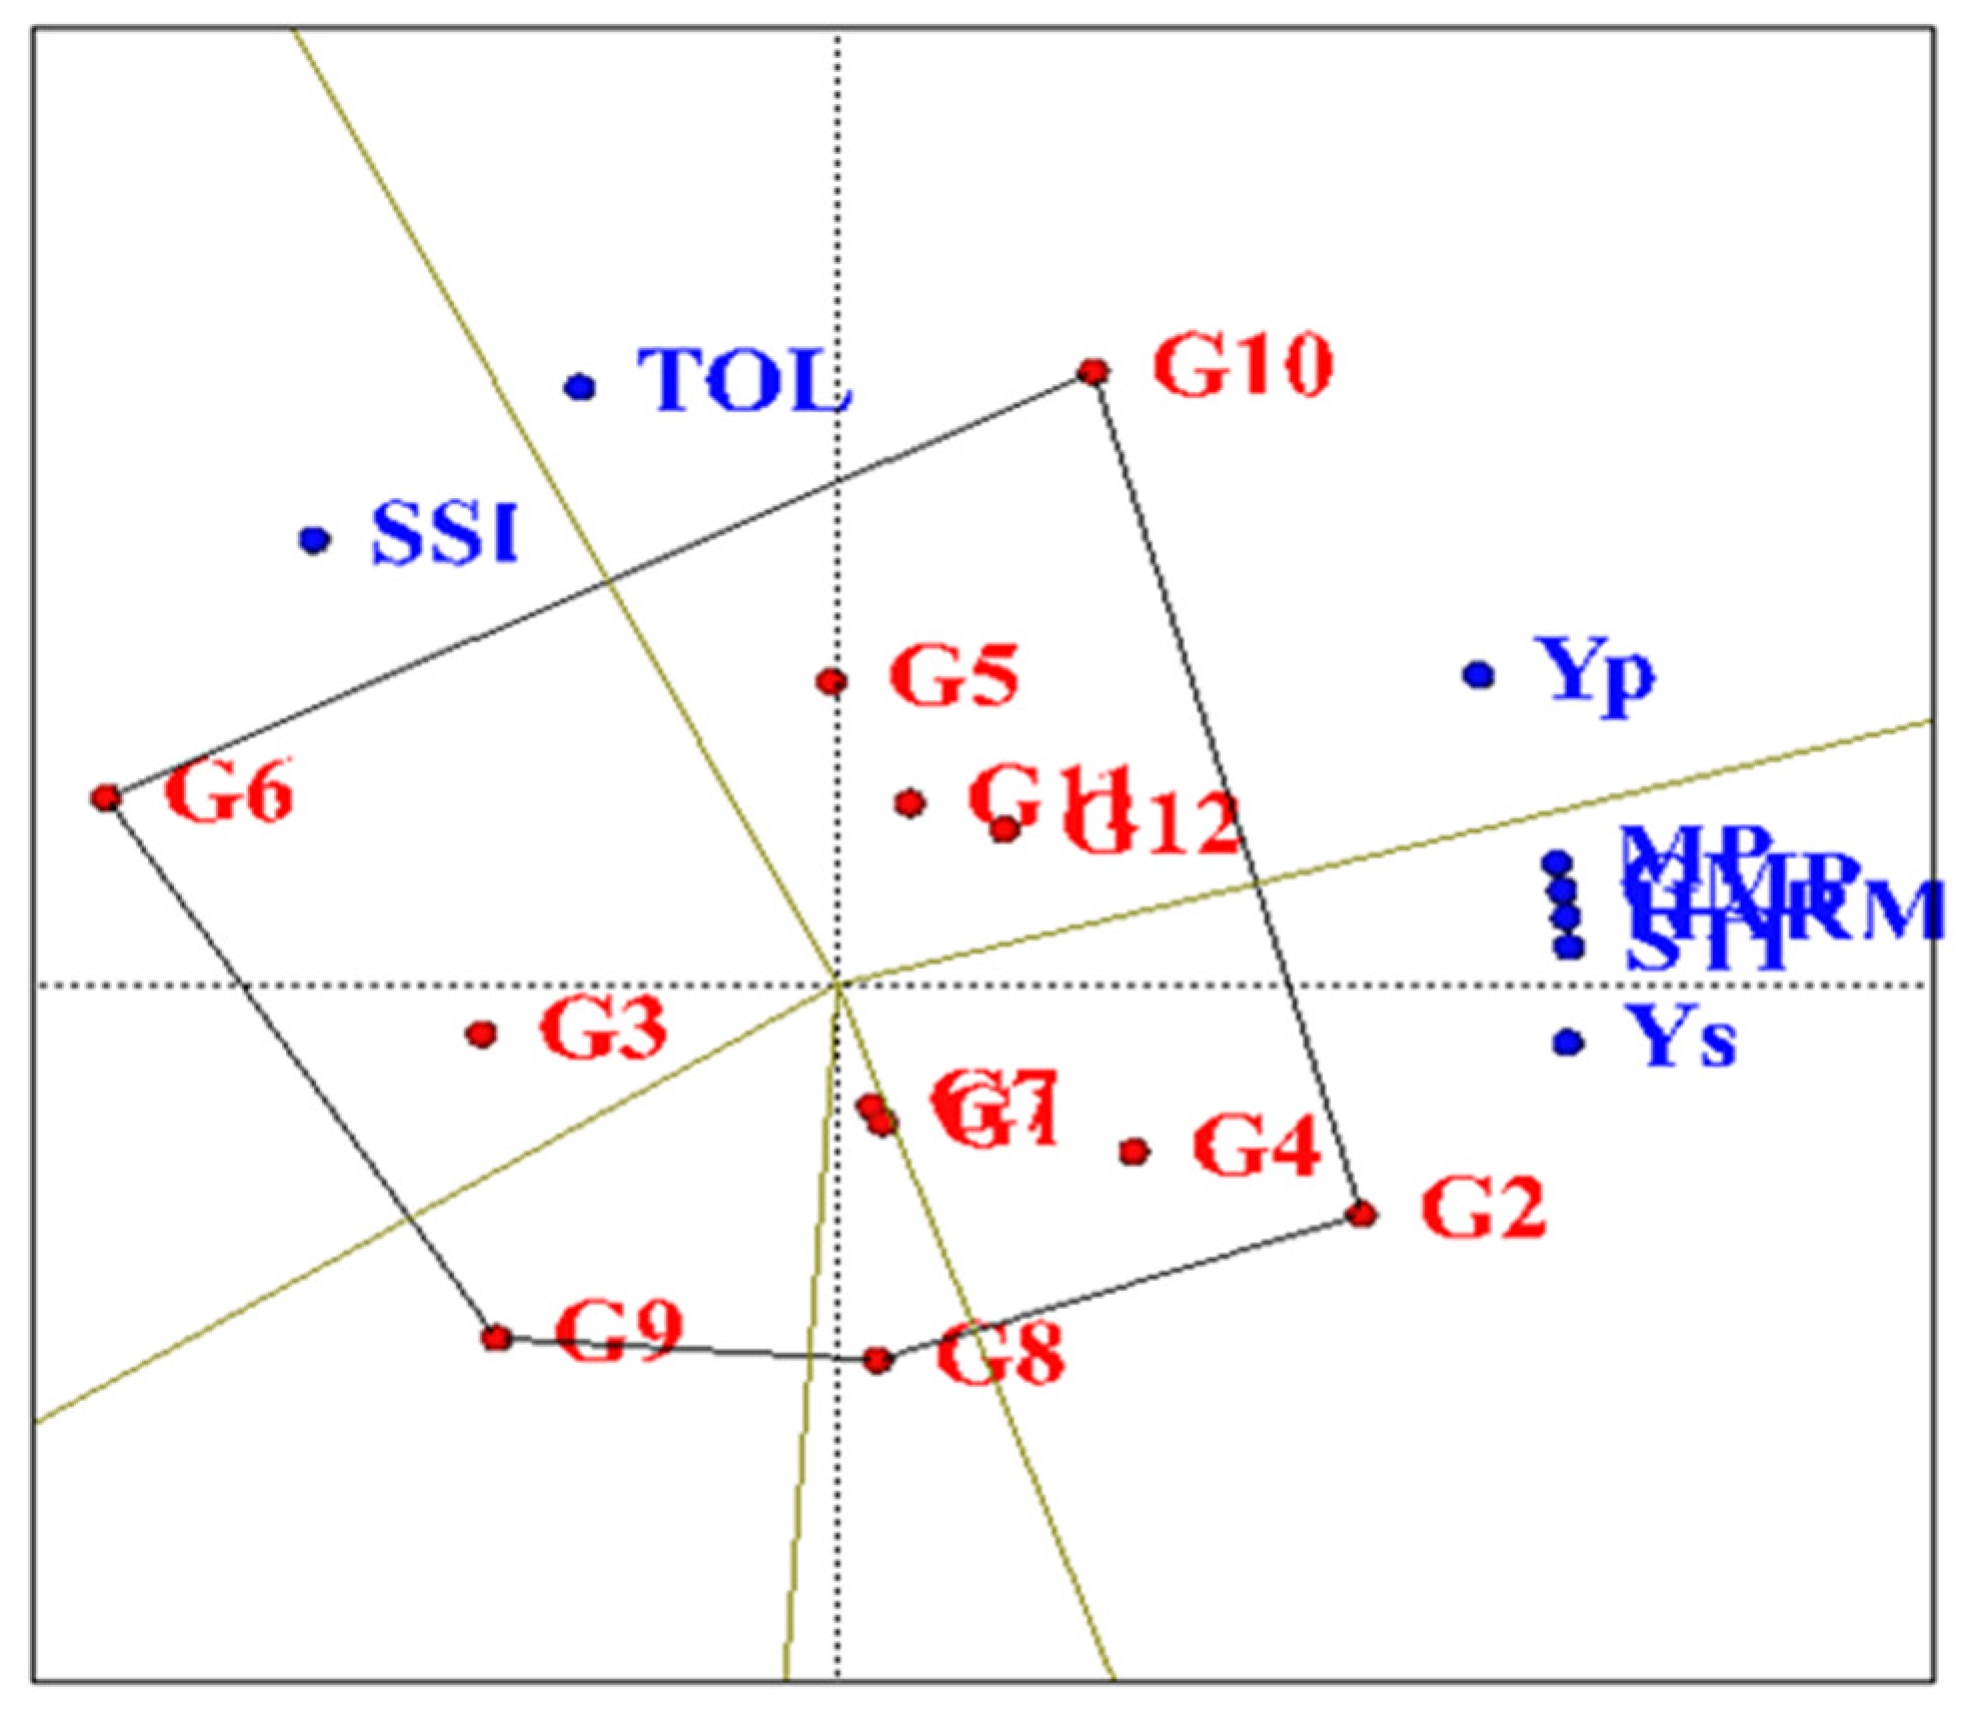
Based on the obtained polygon diagram in terms of drought-tolerance indices (Figure 7), SC302, KSC260, DC370, SC647 and KSC704 genotypes were identified as more favorable hybrids than other evaluated hybrids. Additionally, in each section, the KSC260 genotype was more desirable than other genotypes in MP, GMP, STI, HARM and Ys indices. The KSC704 genotype was superior to other genotypes in the SSI index. In his study on wheat genotypes, Karaman used this type of graph to investigate the response of different genotypes to drought-tolerance indices [31].

2.10. Principal Components Analysis in Drought-Tolerance Indices

After analyzing drought-tolerance indices and mean grain yield under normal conditions and moisture stress in the studied hybrids, based on principal component analysis, the most changes were expressed in the first two components, and more than 99% of the data variance by the two components was justified (Table 7). The first component accounted for more than 78% of the data variance in this analysis. This component showed a high correlation with the average performance under water stress (Ys), MP, HARM, GMP and STI indices. A negative correlation was identified with TOL and SSI indices. Hence, under stress conditions, the first component was named the grain yield tolerance component. The second component explained more than 20% of the data variance. A positive correlation was observed with the mean grain yield under normal conditions (Yp), and the highest correlation was with TOL and SSI indices. This component negatively correlated with the average grain yield under moisture stress (Ys) and was named the grain yield stability component under normal moisture conditions. In their study, Ali and El-Sadek evaluated drought-tolerance indices using the analysis of principal components under stress and non-stress conditions. As a result, the first two components comprised more than 98% of the total changes related to the index for drought tolerance [32].

3. Materials and Methods

In this experiment, the effect of drought stress on grain yield and morphological characteristics and yield components, as well as a comparison of 12 commercial single cross hybrids (Table 8) under normal conditions and humidity stress in a randomized complete block design (RCBD) in three replications in the research field Islamic Azad University, Karaj Branch, was examined. Karaj region has a longitude of ‘54°50′ E’ and latitude of ‘55°35′ N’, is 1312 m above sea level and has an average annual rainfall of 247.3 mm. A separate experiment was considered for each environmental condition (normal and drought stress). Specifications of each experimental plot were planted, including four lines with a length of 2 m and planting lines with a distance of 75 cm. Planting, holding and harvesting operations were performed accurately under normal conditions and humidity stress. It was determined based on soil sampling and 50% (normal irrigation), and stress was applied to apply irrigation stress. Sampling and taking notes were performed from the two middle rows and the plant height pre-harvest and other post-harvest traits. The studied traits include plant height (PH), ear length (EL), ear diameter (ED), number of seeds per row (NGR), number of rows per ear (NRE), grain width (GW), grain length (GL), grain thickness (GT), 1000-grain weight (TWG) and grain yield (YLD). (Table 8). The soil characteristics of the cultivated area are presented in Table 9.
To calculate drought-tolerance indices from tolerance index (TOL), mean productivity (MP), harmonic mean (HARM), geometric mean productivity (GMP), stress sensitivity index (SSI) and stress tolerance index (STI), the following formulas were used:
TOL = Yp Ys
MP = Yp + Ys 2
HARM = 2 ( Yp × Ys ) Yp + Ys
GMP = ( Yp ) ( Ys )
SSI = ( Ys Yp ) 1 ( Ӯ s Ӯ p )
STI = Yp × Ys Yp Ys
In these equations, Yp is the average yield under normal moisture conditions, Ӯp is the average yield of all genotypes under normal moisture conditions, Ys is the average yield under moisture stress conditions and Ӯp is the average yield all genotypes under drought stress conditions.
For studying the genotype × trait interaction, Yan and Rajcan [16] method was used as below (Equation (7)):
α ij β j σ j = n = 1 2 λ n ξ in η jn + ε ij = n = 1 2 ξ in * η jn * + ε ij
where αij: the average amount of genotype i for every trait j, βj: the average amount of all the genotypes for the traits, and σj: standard deviation of the trait j in the average genotypes. εij: the amount of genotype i remained in the trait j, λn: certain amount for the main element (PCn), ξi: the amount of PCn for the genotype i, and ηjn: the amount of PCn for the genotype j.
SAS.v9.2 software was used in the statistical analyzes, which included analysis of variance, comparison of means by Duncan method, correlation coefficients between traits and drought-tolerance indices, and principal components analysis (PCA). Excel software was also used to analyze drought-tolerance indices, and Genstat.v12 software was used to analyze correlation graphically, polygon diagrams, rank genotypes based on ideal genotype, the grouping of genotypes, and Centered Scatter Plot.

4. Conclusions

KSC260, SC302 and KSC400 hybrids were identified as drought-tolerant hybrids, and KSC704 and SC647 genotypes were identified as susceptible hybrids based on drought-tolerance indices for the hybrids studied in this experiment. KSC260, KSC704, KSC705 and KSC706 genotypes are identified as desirable hybrids in both conditions. It can be concluded based on this diagram that the number of rows per ear shows good stability and performance in terms of adjectives. Based on the correlation coefficients of drought-tolerance indices, mean grain yield under normal moisture conditions (Yp) with TOL, MP, HARM and SSI indices and mean grain yield under humidity stress (Ys) with GMP index had a positive and significant correlation. The principal components (PCA) analysis on drought-tolerance indices also showed that the first two components explained more than 99% of the variance. The first component was the grain yield tolerance component under stress conditions, and the second component was the grain yield stability component under conditions. Finally, it can be concluded that the KSC704 hybrid as a hybrid was superior to other studied hybrids in terms of grain yield under normal conditions and stress and the KSC260 hybrid was superior as a hybrid in terms of all studied traits in drought stress.

Author Contributions

S.H.S. data collection; K.M. design of the experiments, A.O. design of the experiments, reviewing, and editing; Á.I. completed the plant sampling in the field; C.B. wrote the manuscript; S.O. reviewing and editing; S.M.N.M. carried out the statistical analysis and writing the manuscript; and J.N. reviewed and finalized the manuscript. All authors have read and agreed to the published version of the manuscript.

Funding

Project no. TKP2021-NKTA-32 has been implemented with the support provided from the National Research, Development and Innovation Fund of Hungary, financed under the TKP2021-NKTA funding scheme and supported by the project EFOP-3.6.3-VEKOP-16-2017-00008.

Institutional Review Board Statement

Not applicable.

Informed Consent Statement

Not applicable.

Data Availability Statement

All data supporting the conclusions of this article are included in this article.

Conflicts of Interest

The authors declare that they have no conflict of interest.

References

  1. Nagy, J. Maize Production. Akadémiai Kiadó: Budapest, Hungary, 2006. [Google Scholar]
  2. Bojtor, C.; Illés, Á.; Nasir Mousavi, S.M.N.; Széles, A.; Tóth, B.; Nagy, J.; Marton, C.L. Evaluation of the Nutrient Composition of Maize in Different NPK Fertilizer Levels Based on Multivariate Method Analysis. Int. J. Agron. 2021, 2, 138–148. [Google Scholar] [CrossRef]
  3. Ceccarelli, S.; Grando, S.; Maatougui, M.; Michael, M.; Slash, M.; Haghparast, R.; Nachit, M. Plant breeding and climate changes. J. Agric. Sci. 2010, 148, 627–637. [Google Scholar] [CrossRef]
  4. Hassan, M.H.; Arafat, E.F.A.; Sabagh, A.E. Genetic studies on agro-morphological traits in rice (Oryza sativa L.) under water stress conditions. J. Agric. Biotechnol. 2016, 1, 76–84. [Google Scholar] [CrossRef]
  5. Golbashy, M.; Ebrahimi, M.; Khorasani, S.K.; Choukan, R. Evaluation of drought tolerance of some corn (Zea mays L.) hybrids in Iran. Afr. J. Agric. Res. 2010, 5, 2714–2719. [Google Scholar]
  6. Farré, I.; Faci, J.M. Deficit irrigation in maize for reducing agricultural water use in a Mediterranean environment. Agric. Water Manag. 2009, 96, 383–394. [Google Scholar] [CrossRef]
  7. Rosielle, A.A.; Hamblin, J. Theoretical aspects of selection for yield in stress and non-stress environment 1. Crop Sci. 1981, 21, 943–946. [Google Scholar] [CrossRef]
  8. Chakherchaman, S.A.; Mostafaei, H.; Imanparast, L.; Eivazian, M.R. Evaluation of drought tolerance in lentil advanced genotypes in Ardabil region, Iran. J. Food Agric. Environ. 2009, 7, 283–288. [Google Scholar]
  9. Fernandez, G.C. Effective selection criteria for assessing plant stress tolerance. In Proceedings of the International Symposium on Adaptation of Vegetables and Other Food Crops in Temperature and Water Stress, Shanhua, Taiwan, 13–16 August 1992; pp. 257–270. [Google Scholar]
  10. Fischer, R.A.; Maurer, R. Drought resistance in spring wheat cultivars. I. Grain yield responses. Aust. J. Agric. Res. 1978, 29, 897–912. [Google Scholar] [CrossRef]
  11. Harrison, M.T.; Tardieu, F.; Dong, Z.; Messina, C.D.; Hammer, G.L. Characterizing drought stress and trait influence on maize yield under current and future conditions. Glob. Change Biol. 2014, 20, 867–878. [Google Scholar] [CrossRef]
  12. Ranjbar, G.H.; Rousta, M.J. Effective Stability Index for Selecting Wheat Genotypes under Saline Conditions. Iran. J. Soil Res. 2011, 24, 283–290. [Google Scholar]
  13. Sedri, M.H.; Amini, A.; Golchin, A. Evaluation of nitrogen effects on yield and drought tolerance of rainfed wheat using drought stress indices. J. Crop Sci. Biotechnol. 2019, 22, 235–242. [Google Scholar] [CrossRef]
  14. Yan, W. Crop Variety Trials: Data Management and Analysis; John Wiley & Sons: Hoboken, NJ, USA, 2014. [Google Scholar]
  15. Chaieb, N.; Bouslama, M.; Mars, M. Growth and yield parameters variability among faba bean (Vicia faba L.) genotypes. J. Nat. Prod. Plant Resour. 2011, 1, 81–90. [Google Scholar]
  16. Yan, W.; Rajcan, I. Biplot analysis of test sites and trait relations of soybean in Ontario. Crop Sci. 2002, 42, 11–20. [Google Scholar] [CrossRef] [PubMed]
  17. Sadegi, F. Evalusation of drought tolerance indices of maize hybrids in low irrigation conditions. J. Crop Breed. 2019, 10, 81–90. [Google Scholar]
  18. Hejazi, P.; Mousavi, S.M.N.; Mostafavi, K.; Ghomshei, M.S.; Hejazi, S.; Mousavi, S.M.N. Study on hybrids maize response for drought tolerance index. Adv. Environ. Biol. 2013, 7, 333–338. [Google Scholar]
  19. Wang, B.; Liu, C.; Zhang, D.; He, C.; Zhang, J.; Li, Z. Effects of maize organ-specific drought stress response on yields from transcriptome analysis. BMC Plant Biol. 2019, 19, 335. [Google Scholar] [CrossRef] [Green Version]
  20. Liu, S.; Qin, F. Genetic dissection of maize drought tolerance for trait improvement. Mol. Breed. 2021, 41, 8. [Google Scholar] [CrossRef]
  21. El-Sabagh, A.; Barutcular, C.; Islam, M.S. Relationships between stomatal conductance and yield under deficit irrigation in maize (Zea mays L.). J. Exp. Biol. Agric. Sci. 2017, 5, 14–21. [Google Scholar] [CrossRef]
  22. Mousavi, S.M.N.; Illés, Á.; Bojtor, C.; Nagy, J. The impact of different nutritional treatments on maize hybrids morphological traits based on stability statistical methods. Emir. J. Food Agric. 2020, 6, 666–672. [Google Scholar] [CrossRef]
  23. Rafiq, C.M.; Rafique, M.; Hussain, A.; Altaf, M. Studies on heritability, correlation and path analysis in maize (Zea mays L.). J. Agric. Res. 2010, 48, 35–38. [Google Scholar]
  24. Yan, W.; Kang, M.S. GGE Biplot Analysis: A Graphical Tool for Breeders, Geneticists, and Agronomist; CRC Press: Boca Raton, FL, USA, 2003. [Google Scholar]
  25. Farajzadeh Memari Tabrizi, N.; Aharizad, S.; Rashidi, V.; DarvishKajouei, F. Khavari Khorasani S Evaluation of correlation and regression between traits and grain yield of maize genotypes under normal and dehydration conditions. J. Plant Ecophysiol. 2017, 9, 21–29. [Google Scholar]
  26. Mousavi, S.M.N.; Bojtor, C.; Illés, Á.; Nagy, J. Genotype by Trait Interaction (GT) in Maize Hybrids on Complete Fertilizer. Plants 2021, 10, 2388. [Google Scholar] [CrossRef] [PubMed]
  27. Okoye, M.; Okwuagwu, C.; Uguru, M.; Ataga, C.; Okolo, E. Genotype by trait relations of oil yield in oil palm (Elaeis guineensis Jacq.) based on GT biplot. In African Crop Science Conference Proceedings; African Crop Science Society: El-Minia, Egypt, 2007; Volume 8, pp. 723–728. [Google Scholar]
  28. Dehghani, H.; Omidi, H.; Sabaghnia, N. Graphic analysis of trait relations of rapeseed using the biplot method. Agron. J. 2008, 100, 1443–1449. [Google Scholar] [CrossRef]
  29. Dolatabad, S.S.; Choukan, R.; Hervan, E.M.; Dehghani, H. Multienvironment analysis of traits relation and hybrids comparison of maize based on the genotype by trait biplot. Am. J. Agric. Biol. Sci. 2010, 5, 107–113. [Google Scholar] [CrossRef] [Green Version]
  30. Grzesiak, S.; Hordyńska, N.; Szczyrek, P.; Grzesiak, M.T.; Noga, A.; Szechyńska-Hebda, M. Variation among wheat (Triticum easativum L.) genotypes in response to the drought stress: I—Selection approaches. J. Plant Interact. 2019, 14, 30–44. [Google Scholar] [CrossRef] [Green Version]
  31. Karaman, M. Evaluation of bread wheat genotypes in irrigated and rainfed conditions using biplot analysis. Appl. Ecol. Environ. Res. 2019, 17, 1431–1450. [Google Scholar] [CrossRef]
  32. Ali, M.B.; El-Sadek, A.N. Evaluation of drought tolerance indices for wheat (Triticum aestivum L.) under irrigated and rain fed conditions. Commun. Biometry Crop Sci. 2016, 11, 77–89. [Google Scholar]
Figure 1. Correlation diagram between the studied traits under normal conditions and water stress. (A): normal conditions; (B): stress conditions. PH: Plant height, EL: Ear length, ED: Ear diameter, NGR: Number of grains in a row, NRE: Number of rows in-ear, GW: Grain weight, GL: Grain Length, GT: Grain Thickness, TWG: Thousand-grain weight, and YLD: Grain yield.
Plants 11 00942 g001
Figure 2. Ranking and Grouping of Genotypes in Terms of Traits. (A): normal conditions; (B): stress conditions. PH: Plant height, EL: Ear length, ED: Ear diameter, NGR: Number of grains in a row, NRE: Number of rows in-ear, GW: Grain weight, GL: Grain Length, GT: Grain Thickness, TWG: Thousand-grain weight, and YLD: Grain yield. G1: KSC703, G2: KSC260, G3: KSC705, G4: KSC400, G5: KSC706, G6: KSC704, G7: KSC707, G8: DC370, G9: SC647, G10: SC302, G11: SC604, and G12: SC301.
Plants 11 00942 g002
Figure 3. Diagram of the reaction of maize hybrids based on the ideal genotype under normal conditions and water stress. (A): normal conditions, (B): stress conditions. PH: Plant height, EL: Ear length, ED: Ear diameter, NGR: Number of grains in a row, NRE: Number of rows in-ear, GW: Grain weight, GL: Grain Length, GT: Grain Thickness, TWG: Thousand-grain weight, and YLD: Grain yield. G1: KSC703, G2: KSC260, G3: KSC705, G4: KSC400, G5: KSC706, G6: KSC704, G7: KSC707, G8: DC370, G9: SC647, G10: SC302, G11: SC604, and G12: SC301.
Plants 11 00942 g003
Figure 4. Graphing diagram of Maize hybrids based on the traits studied in the experiment under normal conditions and moisture stress. (A): normal conditions, (B): stress conditions. PH: Plant height, EL: Ear length, ED: Ear diameter, NGR: Number of grains in a row, NRE: Number of rows in-ear, GW: Grain weight, GL: Grain Length, GT: Grain Thick-ness, TWG: Thousand-grain weight, and YLD: Grain yield. G1: KSC703, G2: KSC260, G3: KSC705, G4: KSC400, G5: KSC706, G6: KSC704, G7: KSC707, G8: DC370, G9: SC647, G10: SC302, G11: SC604, and G12: SC301.
Plants 11 00942 g004
Figure 5. The Centred Scatter Plot Maize hybrids examined in experiments under normal conditions and humidity stress. G1: KSC703, G2: KSC260, G3: KSC705, G4: KSC400, G5: KSC706, G6: KSC704, G7: KSC707, G8: DC370, G9: SC647, G10: SC302, G11: SC604, and G12: SC301.
Plants 11 00942 g005
Figure 6. Correlation diagram between drought-tolerance indices studied under water stress conditions. Yp: Yield under normal condition, Ys: yield under drought condition, TOL: Tolerance, MP: Mean Productivity, GMP: Geometric Mean Productivity, HARM: Harmonic Mean Productivity, SSI: Stress Susceptibility Index, STI: Stress Tolerance Index.
Plants 11 00942 g006
Figure 7. Diagram of a polygon diagram of the reaction of maize hybrids to drought-tolerance indices studied under water stress conditions. Yp: Yield under normal condition, Ys: yield under drought condition, TOL: Tolerance, MP: Mean Productivity, GMP: Geometric Mean Productivity, HARM: Harmonic Mean Productivity, SSI: Stress Susceptibility Index, STI: Stress Tolerance Index. G1: KSC703, G2: KSC260, G3: KSC705, G4: KSC400, G5: KSC706, G6: KSC704, G7: KSC707, G8: DC370, G9: SC647, G10: SC302, G11: SC604, and G12: SC301.
Plants 11 00942 g007
Table 1. Analysis of variance of studied hybrids in terms of traits under normal conditions and humidity stress.
MS
StateS.O.V.DFPHELEDNGRNREGWGLGTTWGYLD
Normal ConditionBlock2110.1 ns0.06 *9.59 *4.68 *31.6 ns0.57 *1.31 ns1.27 ns277.6 ns0.21 ns
Genotype11519.2 ns10.8 **62.6 **9.48 *73.79 ns2.91 **5.95 ns2.21 ns3961.9 *0.77 *
Error22331.91.6914.473.5653.30.754.81.873035.21.83
CV%---9.917.89.2811.4619.315.8122.830.1618.918.87
Stress ConditionBlock2577.6 ns0.36 ns10.08 ns1.33 ns17.33 ns0.13 ns8.14 *8.37 ns6385.08 *2.33 *
Genotype11390.35 ns8.96 **40.5 *6.5 ns68.2 *0.66 ns4.5 *1.45 ns2037.8 *0.91 *
Error22832.32.5519.933.8735.390.732.631.292083.31.23
CV%---22.513.1917.3815.5421.523.0322.428.823.920.72
*, **, and ns: significant at 5%, 1% and not-significant. PH: Plant height, EL: Ear length, ED: Ear diameter, NGR: Number of grains in a row, NRE: Number of rows in-ear, GW: Grain weight, GL: Grain Length, GT: Grain Thickness, TWG: Thousand-grain weight, and YLD: Grain yield.
Table 2. Comparison of Duncan’s mean for traits in 12 hybrids of maize under normal conditions and humidity stress.
GenotypeRankPHELEDNGRNREGWGLGTTWGYLD
Normal ConditionKSC7037182ab17.7b38.4cde15.1bc39.1ab6.3ab9.4ab2.9bc258.4ab7.1abc
KSC2605162.4b17.1bc42.3abcd19.7a35.6ab5.5abc6.8b4.1ab316.6ab7.64ab
KSC7056197.8ab21.4a40.9bcd15.1bc48.6a5.9ab8.4ab2.7bc290.5ab6.65bc
KSC40010185.9ab14.8cd36.8de14.5c40.2ab5.6ab10.9ab2.6bc297.1ab7.4ab
KSC7069198.7a17.1bc32.5e14.6c40.8ab4.9bcd8.6ab3.7abc225.8ab7.4ab
KSC7043167.3ab16.8bcd49.4a16.7abc37.7ab5.8ab10.2ab4.3ab297.8ab6.35bcd
KSC7071171.9ab16.8bcd42.9abcd18.4ab38.1ab7.01a10ab3.6abc336.6a7.1abc
DC37011160.8ab14.4d38.4cde14.5c30.5b4.9bcd10.2ab4.6ab337.4a6.9bc
SC6478176.6ab14.4d44.3abc18.7ab40.5ab6.5ab9.8ab2.4c232.6ab6.42bcd
SC3024176.2ab15.6bcd46.2ab17abc36.3ab5.5abc9.17ab3.5abc310.5ab8a
SC60412202.7a16.1bcd41.8abc16.9abc29.9b3.6d8.5ab5.1a276.6ab7.4a
SC3012193.1ab17.6b37.5cde15.9bc35.2ab3.9cd12.4a4.2ab306ab7.5ab
Stress ConditionKSC7035137.3abc13.3ab22.8bc12b28abc4.26ab7.2abc1.76cd161.6cd5.45bc
KSC2606110de11.26bcd27.1abc16a27.3abc3.4bc5.48c2.28bcd195bc6.26a
KSC7054133bcd15.8a23.9bc12.6ab36.6a4.13ab7.2abc1.3d188.6bcd4.78cd
KSC40012121cde9.3d23.2bc12b26abc3.4bc8.9ab1.48cd166.6cd5.87ab
KSC70611136abc12.6bc20.4c11.3bc32.6ab3c6.06bc2.4bcd166.3cd5.29bc
KSC7043108.6e12.4bc34.2a11.3bc26.6abc4.5a7.8abc3.42a193.6bc4.14d
KSC7071134bc13.13ab25.5abc14.6ab31.3abc3.93bc7.03abc2.68bc228ab5.43bc
DC3707119.6de9.66cd29.2ab12.6ab20c3.3bc7.2abc2.93bc236a5.48bc
SC6479141.6a11.66bcd25.7bc13.3ab25.3abc4.13ab7.2abc1.65cd155.3d4.85cd
SC3028133.6bcd11.96bcd24.4bc11.3bc32ab3.66bc5.6c1.85bcd188cd5.66ab
SC60410140ab12.2bcd23.2bc11.3bc22.6bc3.5bc7.05abc2.95bc191.3bc5.44bc
SC3012121.6cd12.5bc24.8bc13.3ab23.3bc3.2bc9.7a3.09ab216.6ab5.6ab
PH: Plant height, EL: Ear length, ED: Ear diameter, NGR: Number of grains in a row, NRE: Number of rows in-ear, GW: Grain weight, GL: Grain Length, GT: Grain Thickness, TWG: Thousand-grain weight, and YLD: Grain yield.
Table 3. Correlation coefficients between the evaluated traits under normal conditions and water stress.
Normal Condition PHELEDNGRNREGWGLGTTWG
EL0.14 ns
ED−0.46 **−0.08 ns
NGR−0.39 *−0.1 ns0.31 *
NRE0.08 ns0.2 ns−0.15 ns0.07 *
GW−0.34 *−0.1 ns0.22 *0.33 ns0.4 *
GL0.22 ns0.01 *−0.14 ns0.003 ns−0.04 *0.03 ns
GT0.28 ns−0.06 *0.05 ns0.04 *−0.39 *0.31 *0.03 ns
TWG0.13 ns−0.12 ns0.008 ns−0.11 *0.004 ns0.01 ns0.1 ns0.41 *
YLD0.18 ns0.08 ns−0.19 *0.07 ns−0.003 ns0.14 ns0.1 *0.26 ns0.46 **
Stress ConditionEL0.2 *
ED−0.12 ns0.26 *
NGR−0.14 ns0.06 *0.09 ns
NRE0.06 ns0.51 **−0.31 *0.08 ns
GW0.07 ns0.15 ns0.03 *0.19 *0.23 ns
GL0.53 *−0.02 ns−0.16 ns0.13 ns−0.06 ns0.12 *
GT0.02 ns0.04 ns0.35 *0.09 ns0.29 *0.14 ns−0.02 *
TWG0.1 *0.07 ns0.01 *0.05 ns−0.004 ns−0.16 *0.21 *0.41 *
YLD−0.06 ns0.04 ns0.25 *0.14 ns0.006 ns0.1 *−0.03 ns0.17 ns0.29 *
ns: non significant; * p < 0.05; ** p < 0.01; PH: Plant height, EL: Ear length, ED: Ear diameter, NGR: Number of grains in a row, NRE: Number of rows in-ear, GW: Grain weight, GL: Grain Length, GT: Grain Thickness, TWG: Thousand-grain weight, and YLD: Grain yield.
Table 4. Evaluation of hybrids evaluated in the test under stress conditions through drought-tolerance indices.
GenotypesYpRYsRTOLRMPRHARMRGMPRSSIRSTIR
KSC7037.185.4561.6556.27576.16676.2270.92414.56
KSC2607.6466.2611.3816.9516.88116.9110.71117.31
KSC7056.65104.78111.8775.715105.562105.63101.11912.310
KSC4007.455.8721.5336.63536.54636.5930.82315.93
KSC7067.445.2992.11106.34566.16966.2561.131014.38
KSC7046.35124.14122.21115.245125.012125.12121.381110.412
KSC7077.175.4381.6766.26586.15386.280.93514.47
DC3706.995.4851.4226.1996.10896.1490.81214.39
SC6476.42114.85101.5745.635115.525115.58110.97612.211
SC302815.6632.34126.8326.62926.7221.612162
SC6047.435.4471.9696.4256.27056.3451.05814.75
SC3017.525.641.986.5546.4146.4841715.34
Table 5. Selected hybrids based on drought-tolerance indices.
IndexSelected Hybrids
Based on YpSC604, SC301, SC302
Based on YsSC302, KSC400, KSC260
Based on TOLKSC400, DC370, KSC260
Based on MPKSC400, SC302, KSC260
Based on HARMKSC400, SC302, KSC260
Based on GMPKSC400, SC302, KSC260
Based on SSIKSC400, DC370, KSC260
Based on STIKSC400, SC302, KSC260
Table 6. Correlation coefficients between drought-tolerance indices evaluated under water stress conditions.
YpYsTOLMPHarmGMPSSI
Ys−0.15 ns
TOL0.95 **0.44 ns
MP0.97 **0.36 ns0.99 **
Harm0.96 **0.4 ns0.99 **0.98 **
GMP−0.35 ns0.87 *−0.05 ns−0.13 ns−0.09 ns
SSI0.98 **0.33 ns0.98 **0.9 **0.9 **−0.18 ns
STI−0.36 ns−0.67 ns−0.53 ns−0.49 ns−0.51 ns−0.45 ns−0.46 ns
*, **, and ns: significant at 5%, 1% and not-significant.
Table 7. Principal components analysis for average grain yield under normal conditions and moisture stress and drought-tolerance indices.
% Variance% Cumulative VarianceYpYsTOLMPHarmGMPSSISTI
Factor 10.7890.7890.3480.396−0.130.390.3950.393−0.280.397
Factor 20.2090.9990.374−0.070.7220.1470.0810.1130.5380.045
Table 8. Name and code of hybrids, traits and drought-tolerance indices studied in the experiment.
Genotype No.GenotypeTraits CodeTraitsIndices CodeIndices
G1KSC 703PHPlant heightYpYield under normal condition
G2KSC 260ELEar lengthYsYield under drought condition
G3KSC 705EDEar diameterTOLTolerance
G4KSC 400NGRNumber of grains in rowMPMean Productivity
G5KSC 706NRENumber of rows in earGMPGeometric Mean Productivity
G6KSC 704GWGrain weightHARMHarmonic Mean Productivity
G7KSC 707GLGrain LengthSSIStress Susceptibility Index
G8DC 370GTGrain ThicknessSTIStress Tolerance Index
G9SC 647TWGThousand grain weight
G10SC 302YLDGrain yield
G11SC 604
G12SC 301
Table 9. Soil characteristics of the cultivated area in the experiment.
RegionEC (ds/m)AcidityLime (%)Organic Carbon (%)Organic Materials (%)Clay (%)Silt (%)Sand (%)
Karaj0.208.273245322522
Publisher’s Note: MDPI stays neutral with regard to jurisdictional claims in published maps and institutional affiliations.