
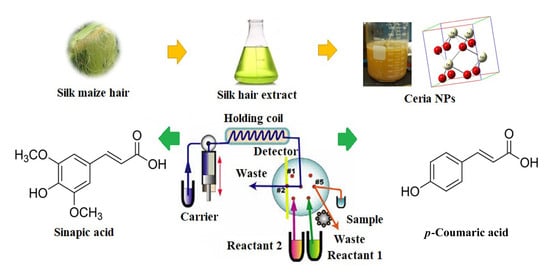
Maize Silk Biogenic Nanoceria (CeO2NPs) Enhanced Sequential Injection-Chemiluminescence Detection of Ferulic, Sinapic and p-Coumaric in Yellow Maize Kernels

Abstract
:
1. Introduction
2. Materials and Methods
2.1. Chemicals and Reagents
2.2. Plant Materials and Samples
2.3. Extraction of Bound Phenolic Compounds and Ferulic, Sinapic, and p-Coumaric Acids
2.4. Biogenic Synthesis of CeO2NPs (Nanoceria) Using Maize Silk
2.5. Spectroscopic and Microscopic Characterization of the Prepared Nanoceria
2.6. SIA-CL Procedure
2.7. The Suggested Control Program
2.8. The Plotted Calibration Graphs
2.9. Antioxidant Activity
2.9.1. Antioxidant Activity Using (DPPH•) Radical Scavenging Assay
2.9.2. 2-2′-Azino-bis(3-ethylbenzthiazoline-6-sulfonic acid) Radical Cation (ABTS +) Scavenging Activity
2.10. Statistical Analyses
3. Results
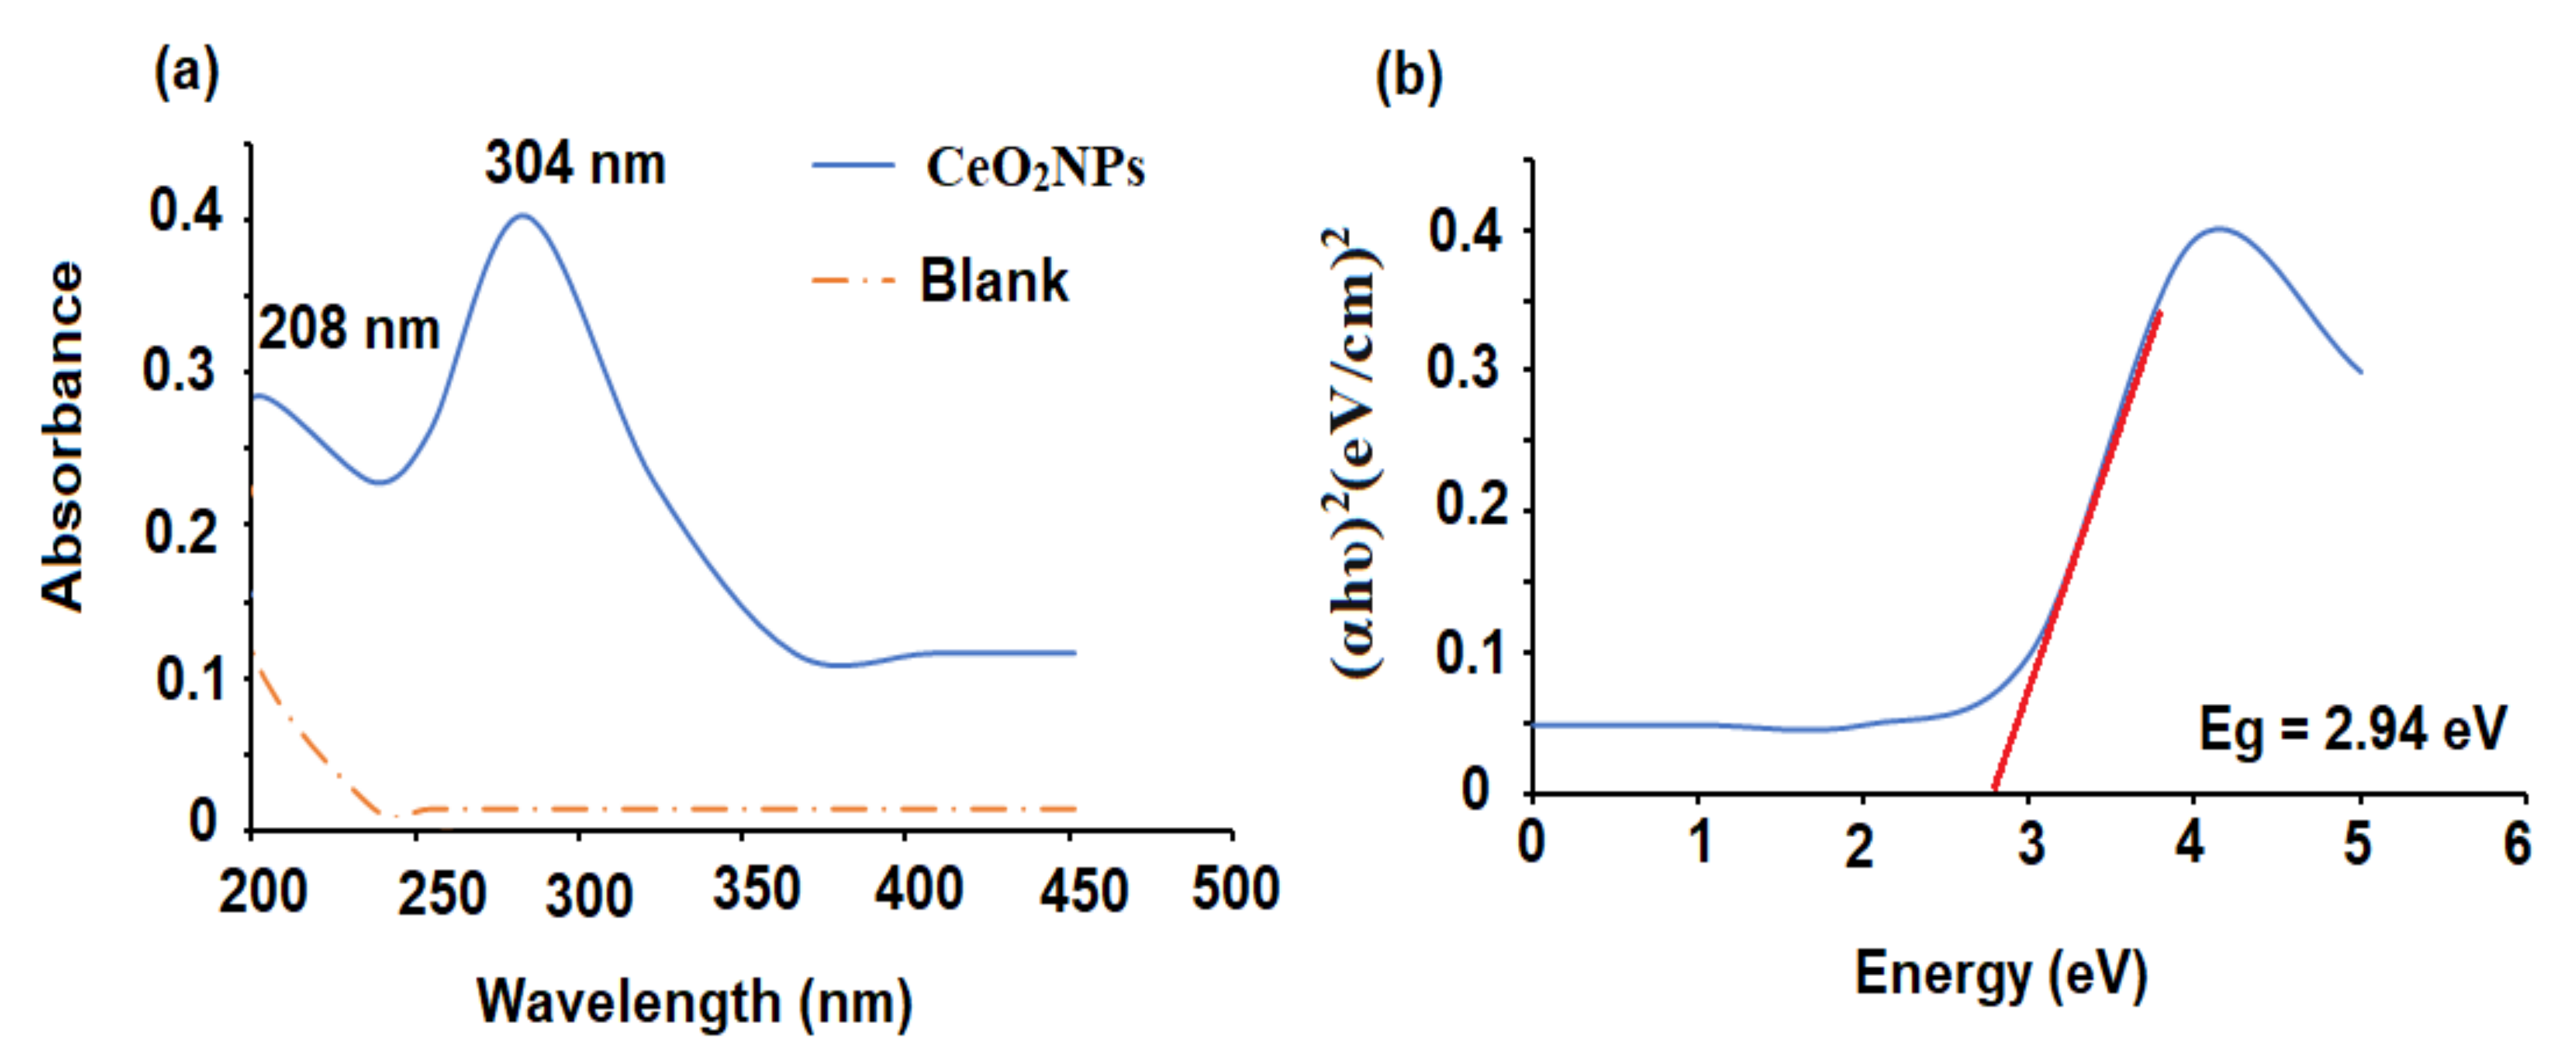
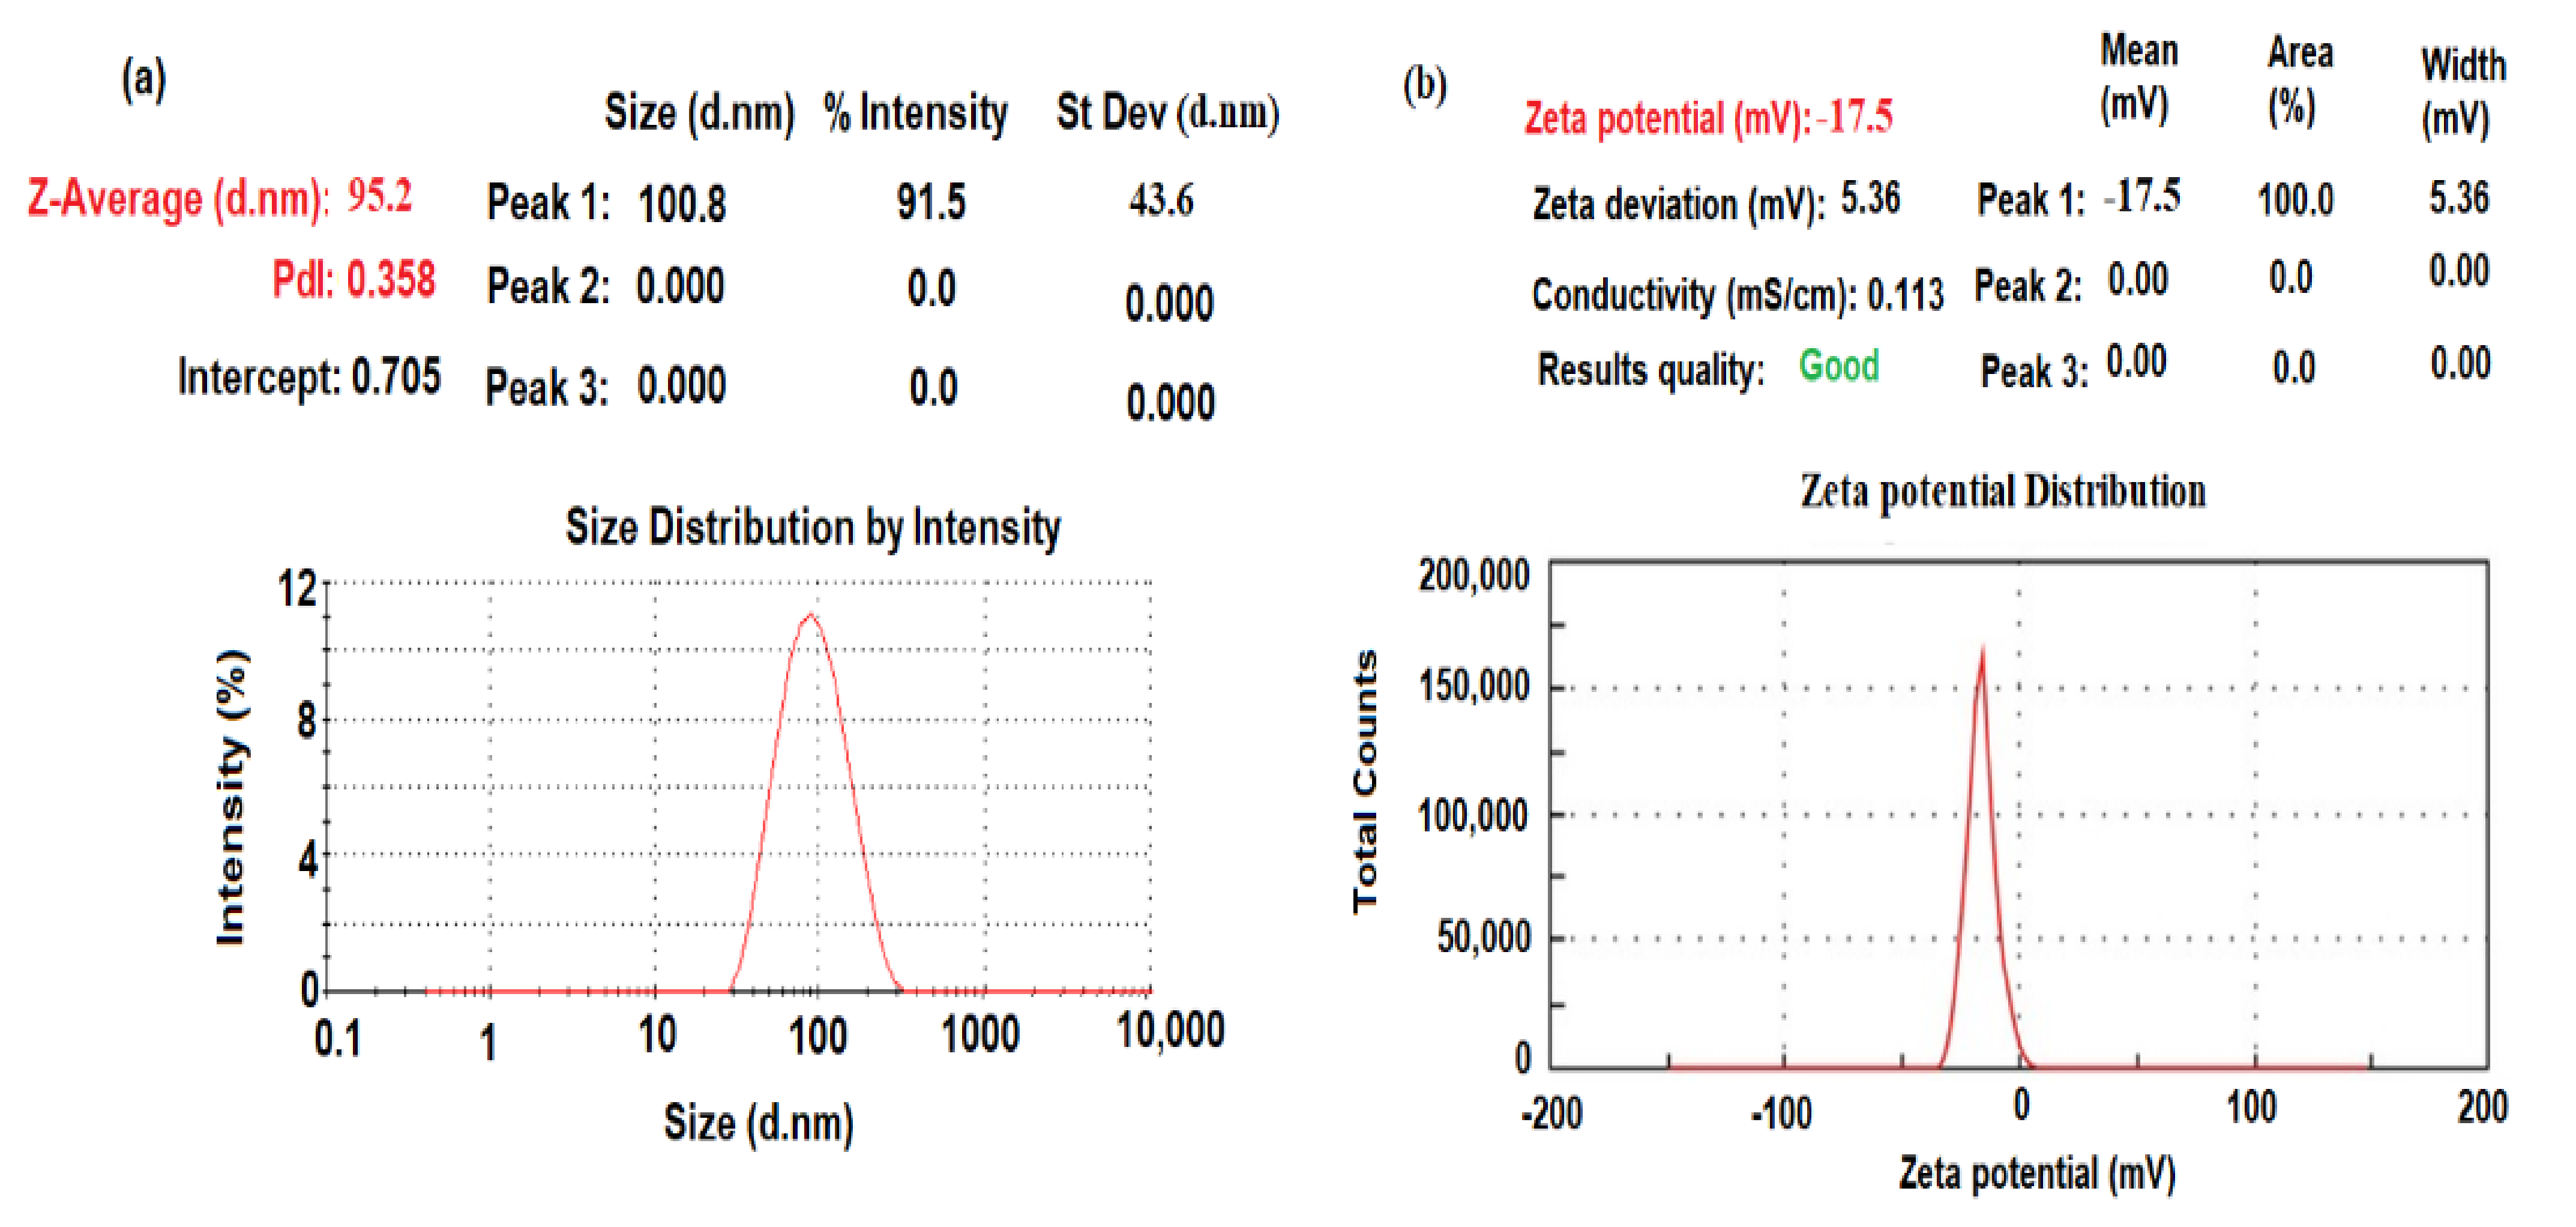
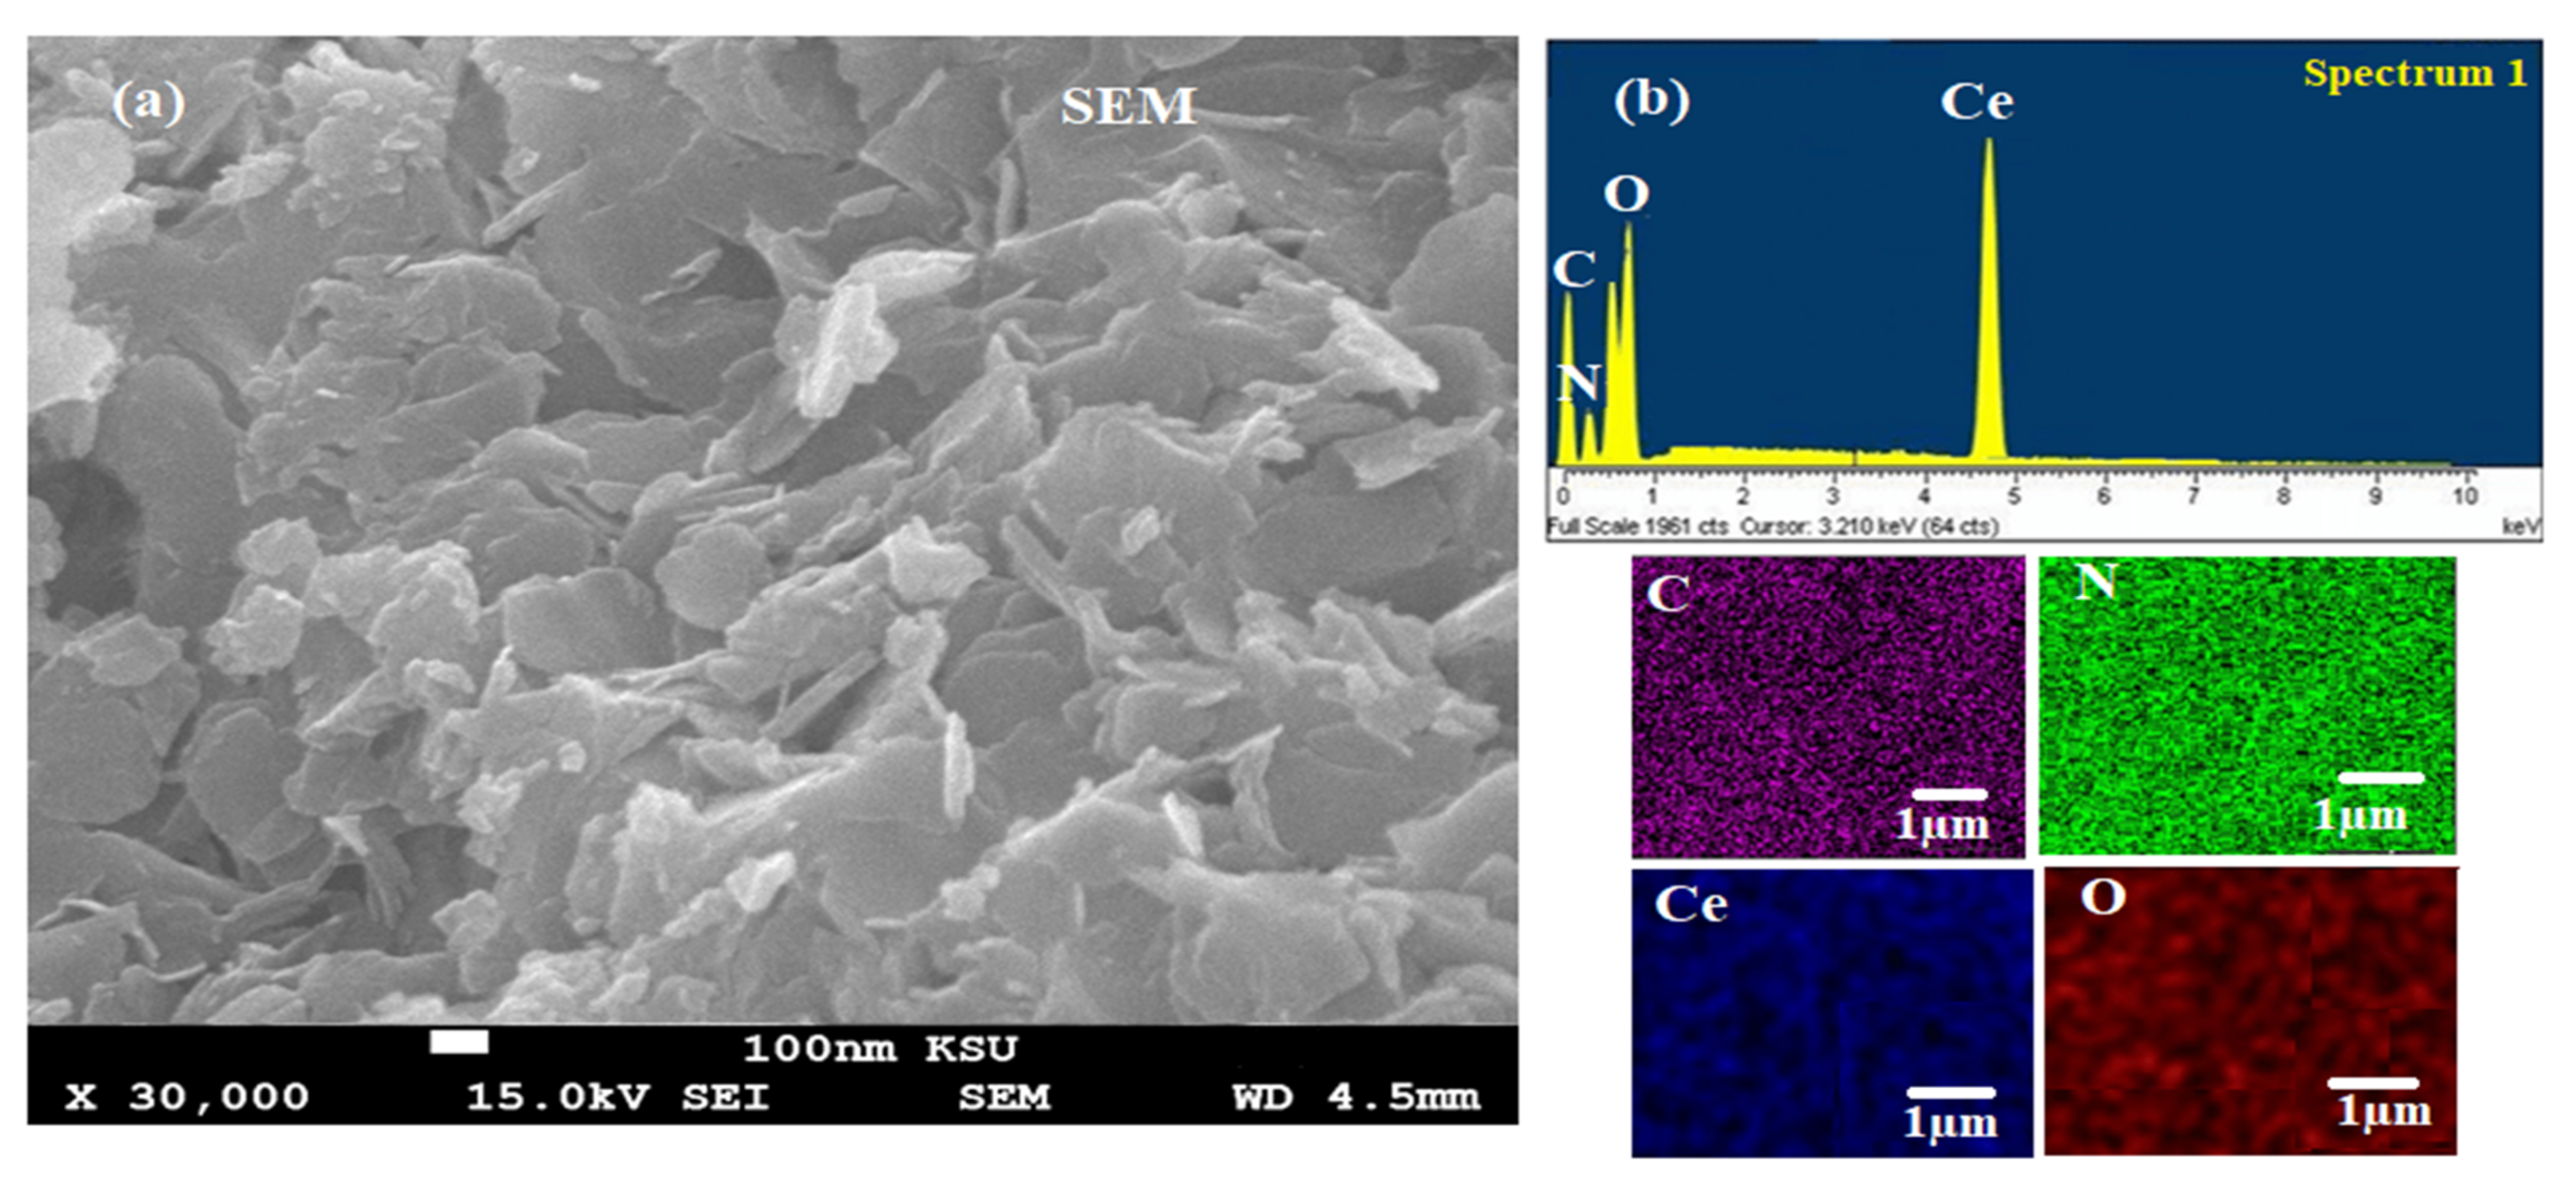
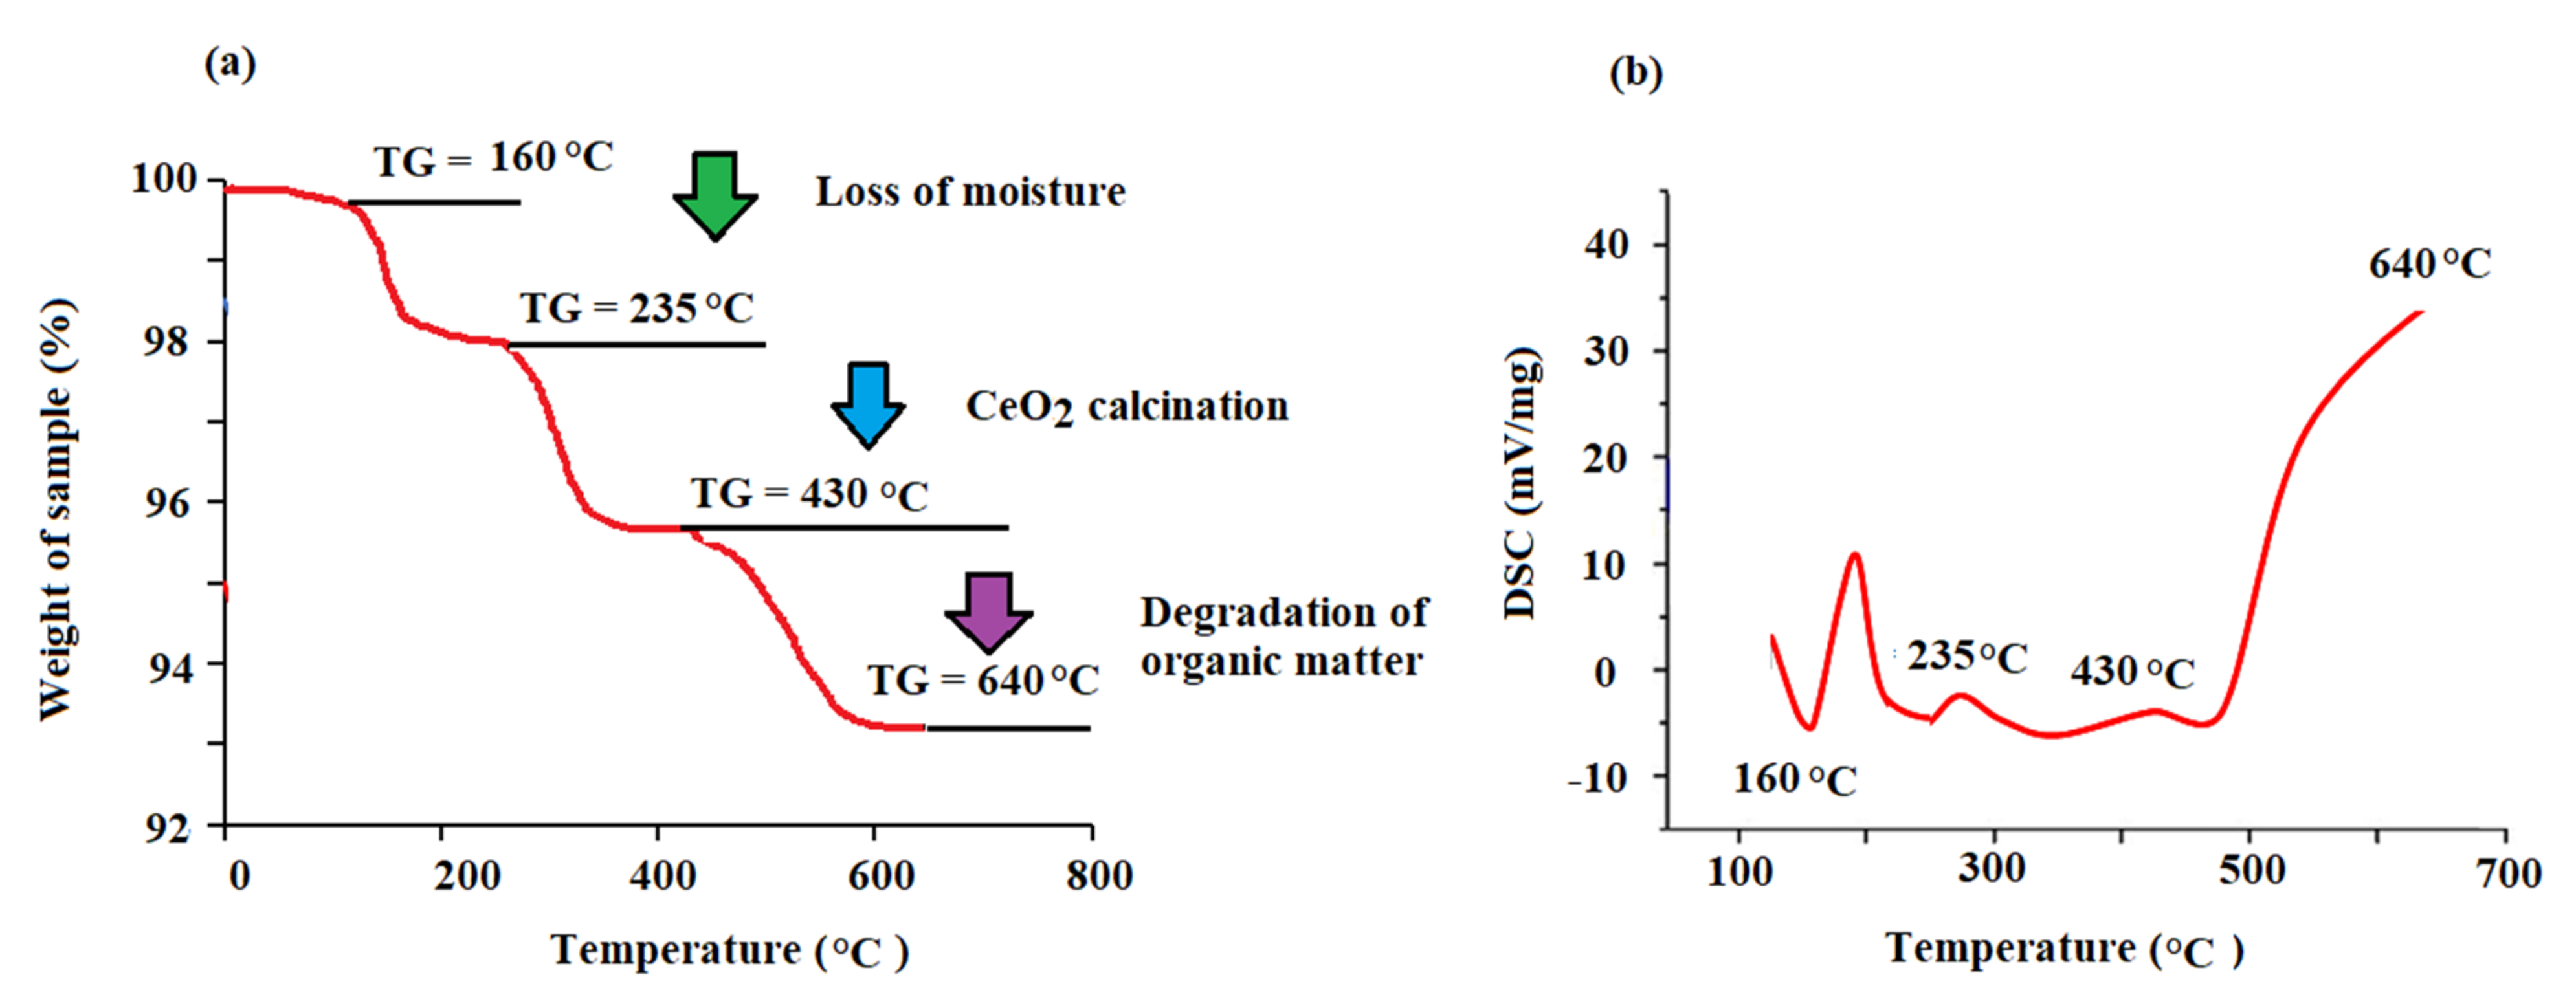
3.1. Characterization of the Biogenic Synthesized CeO2NPs
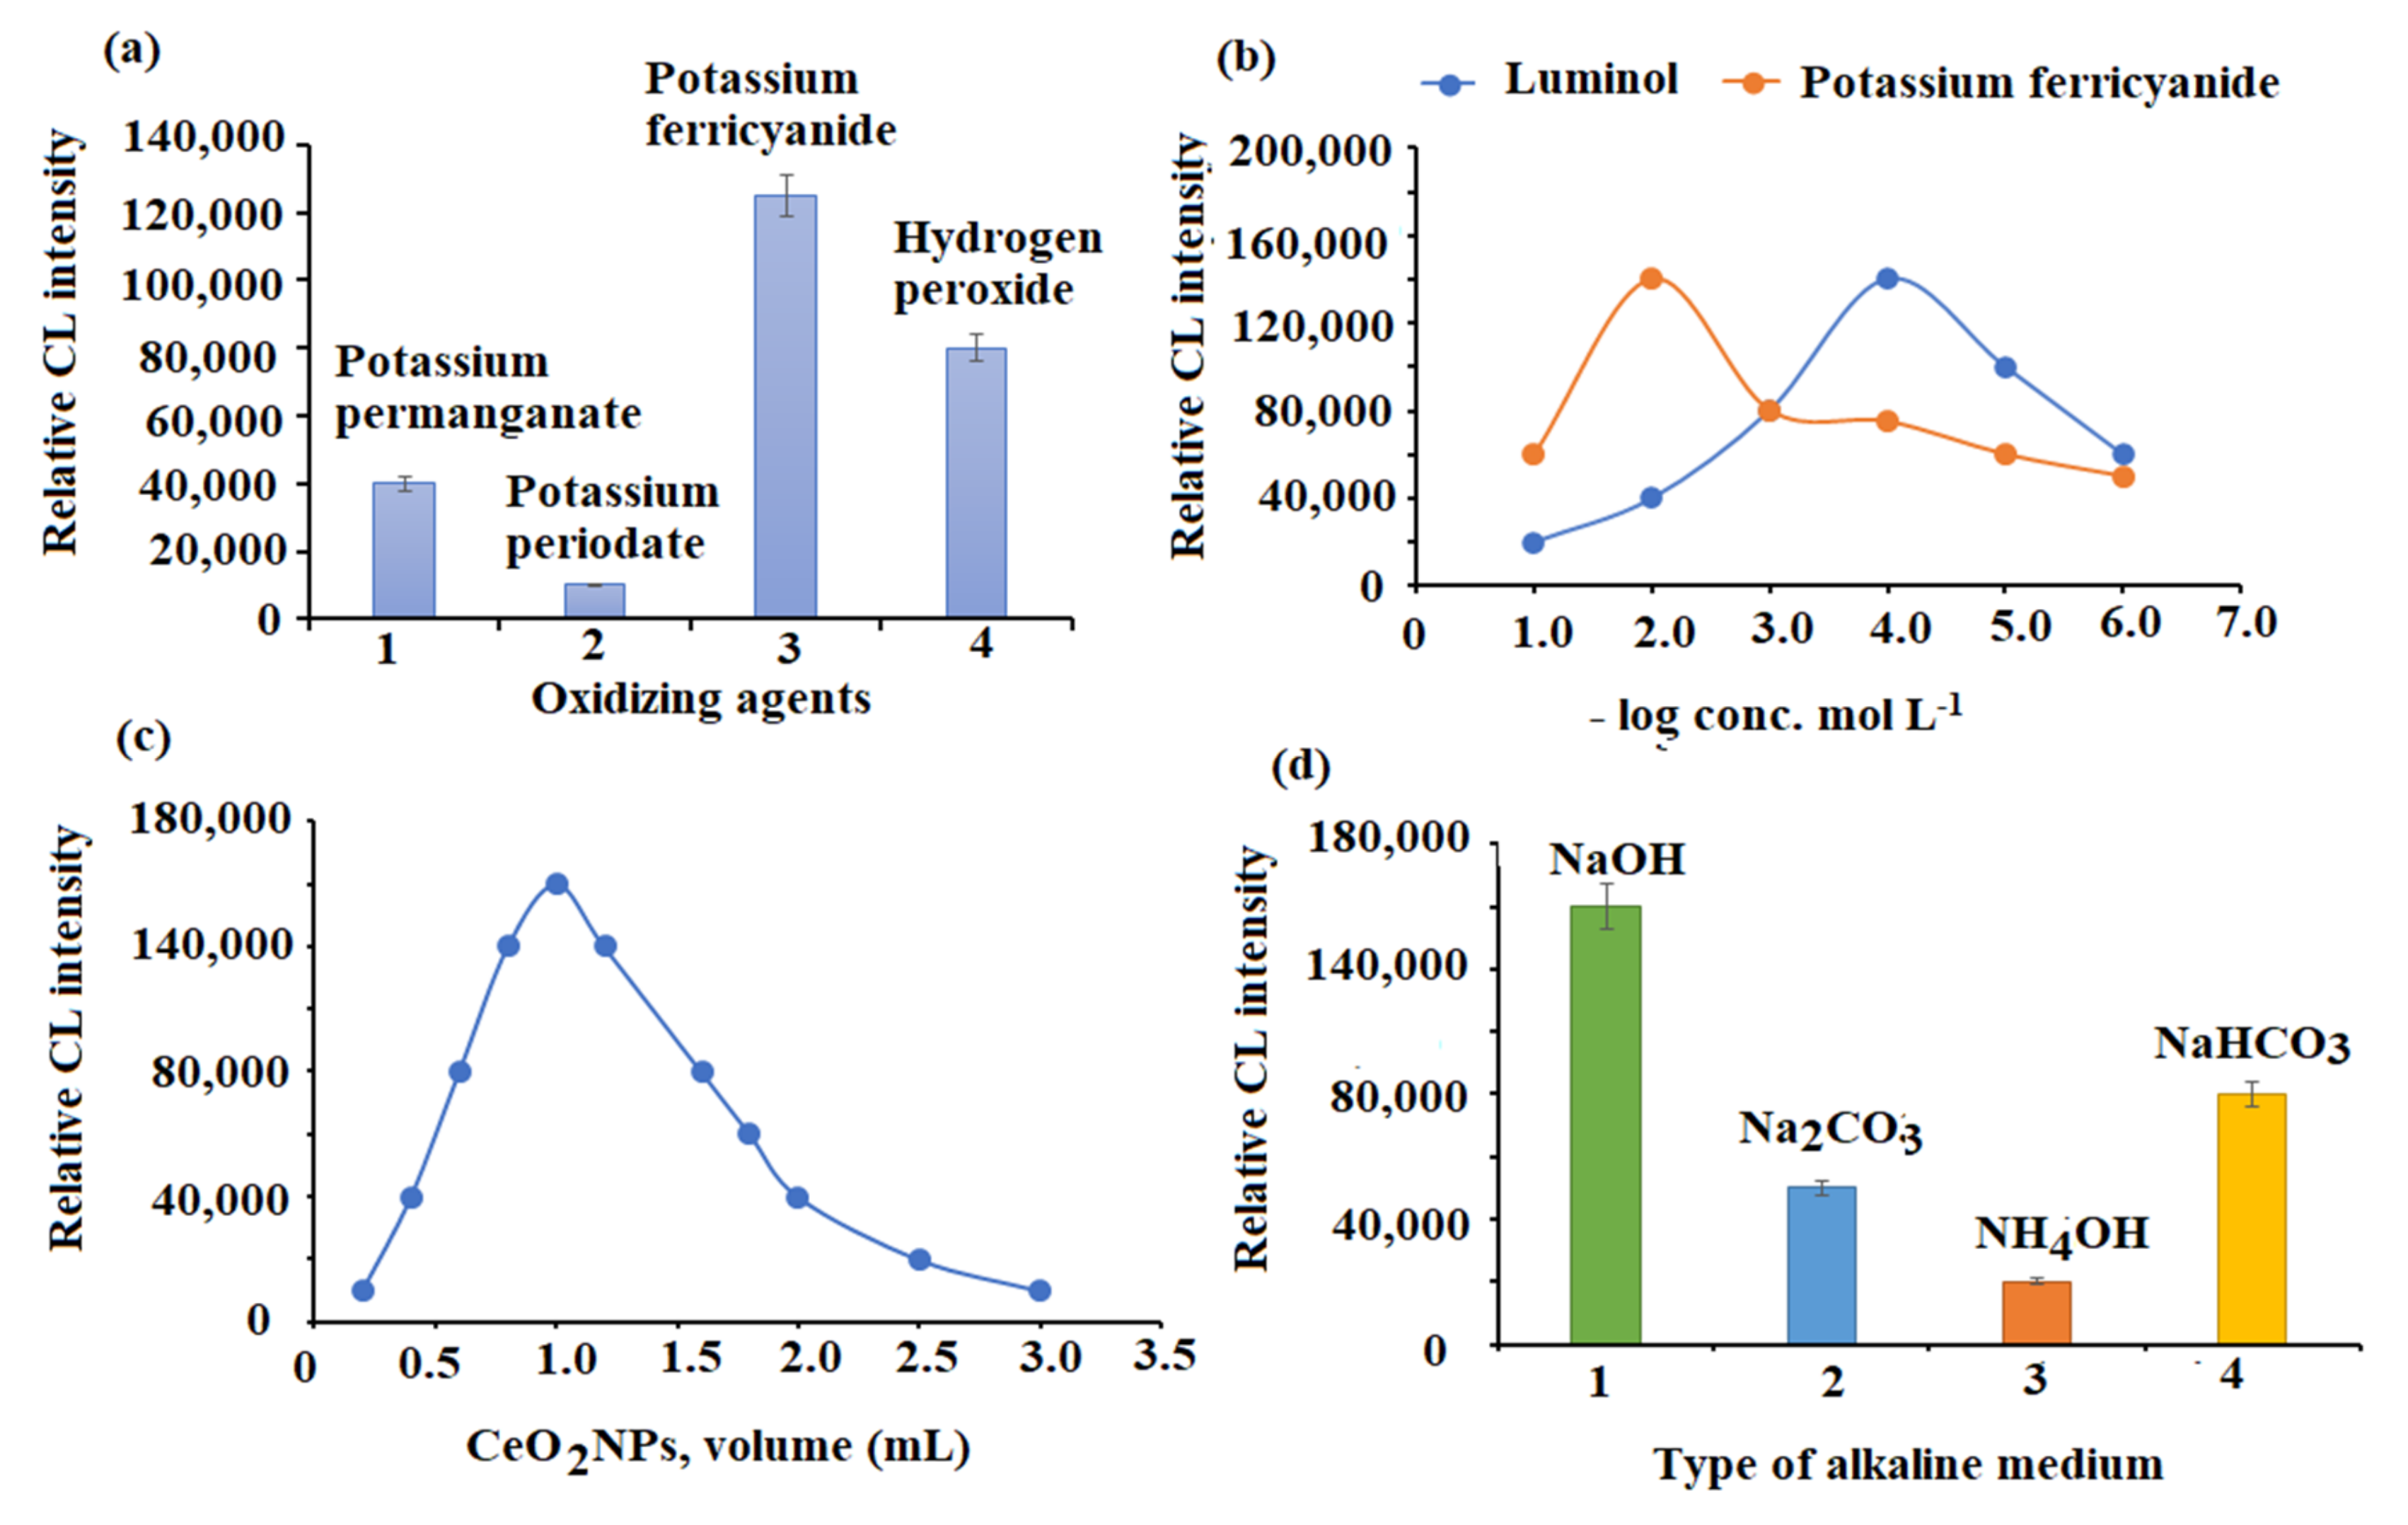
3.2. Optimization of CL Conditions
3.3. SIA-CL Procedure
3.4. Method Validation
3.4.1. Specificity
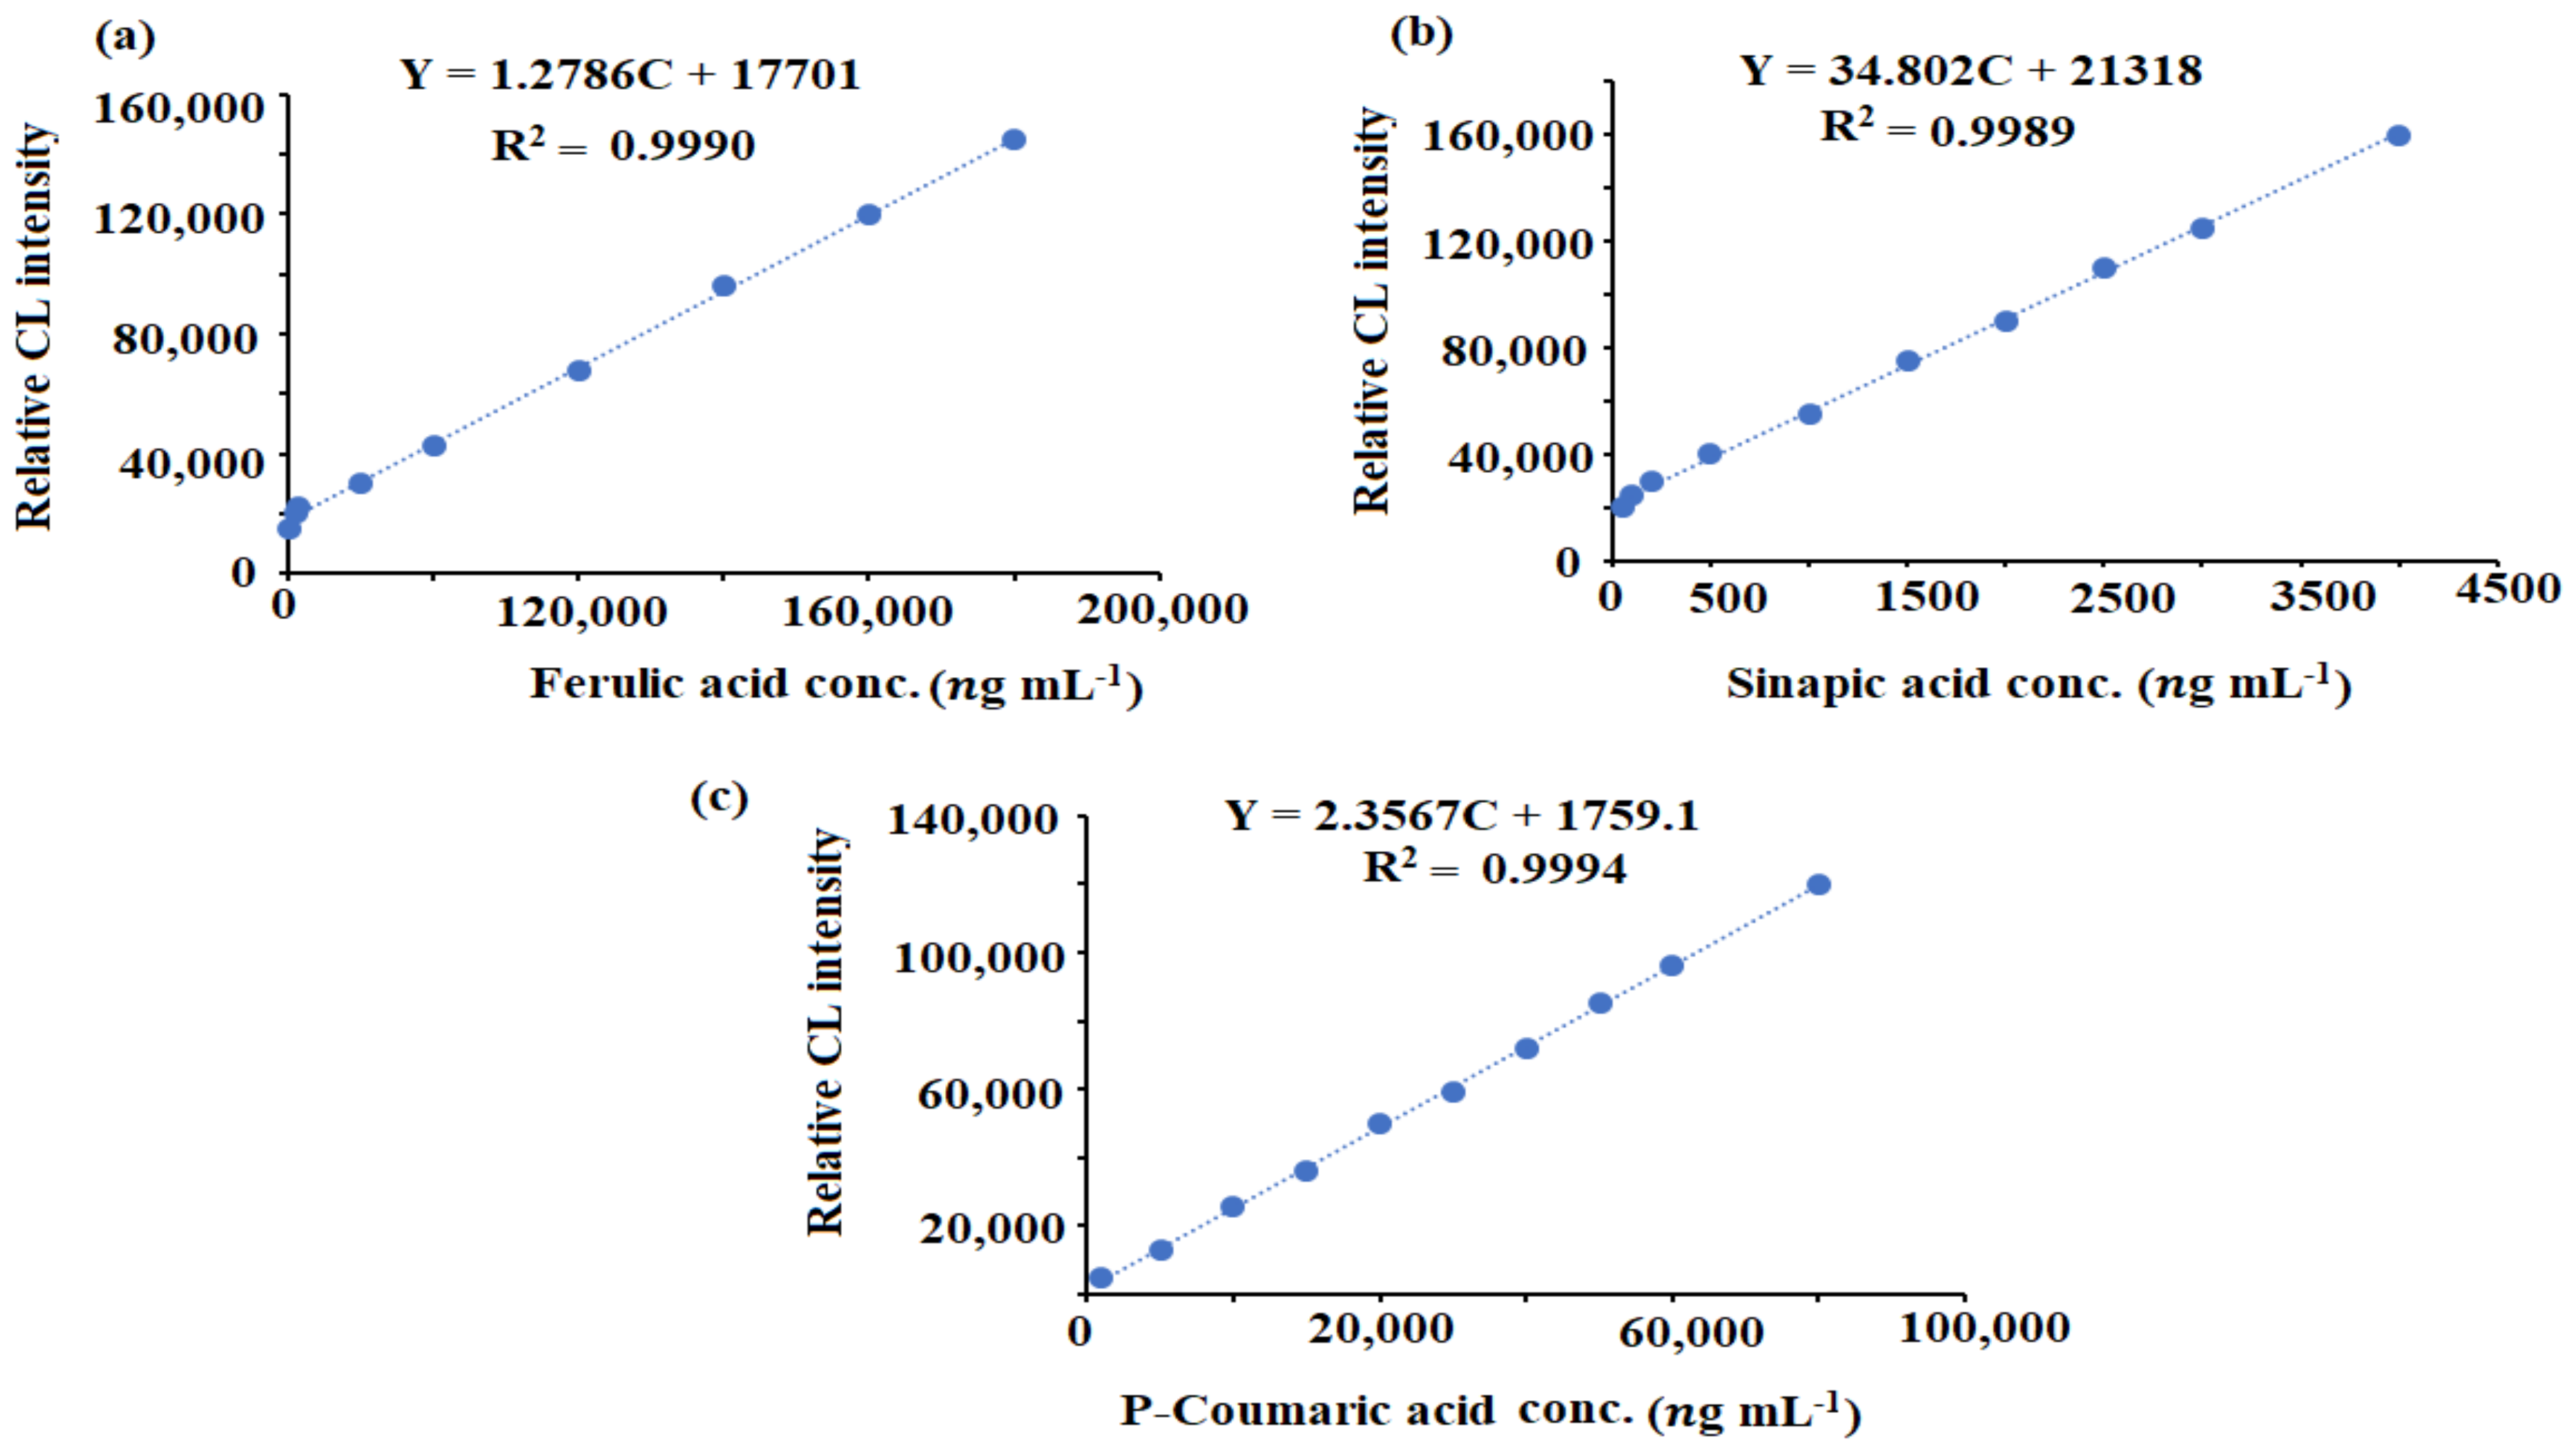
3.4.2. Linearity
3.4.3. Limit of Detection (LOD) and Limit of Quantification (LOQ)
3.4.4. Accuracy, Precision, and Robustness
3.5. Antiradical Capacity
3.6. Levels of Ferulic, Sinapic, and p-Coumaric Acids
4. Conclusions
Funding
Institutional Review Board Statement
Informed Consent Statement
Data Availability Statement
Acknowledgments
Conflicts of Interest
References
- Mansoor, S.; Ali Wani, O.; Lone, J.K.; Manhas, S.; Kour, N.; Alam, P.; Ahmad, A.; Ahmad, P. Reactive Oxygen Species in plants: From source to sink. Antioxidants 2022, 11, 225. [Google Scholar] [CrossRef] [PubMed]
- Oraby, H.F.; El-Tohamy, M.F.; Kamel, A.M.; Ramadan, M.F. Changes in the concentration of avenanthramides in response to salinity stress in CBF3 transgenic oat. J. Cereal Sci. 2017, 76, 263–270. [Google Scholar] [CrossRef]
- Juan, C.A.; de la Lastra, J.M.P.; Plou, F.J.; Pérez-Lebeña, E. The Chemistry of Reactive Oxygen Species (ROS) revisited: Outlining their role in biological macromolecules (DNA, lipids and proteins) and induced pathologies. Int. J. Mol. Sci. 2021, 22, 4642. [Google Scholar] [CrossRef] [PubMed]
- Mittler, R. ROS are good. Trends Plant Sci. 2017, 22, 11–19. [Google Scholar] [CrossRef] [PubMed] [Green Version]
- Nardini, M. Phenolic compounds in food: Characterization and health benefits. Molecules 2022, 27, 783. [Google Scholar] [CrossRef] [PubMed]
- Salinas-Moreno, Y.; García-Salinas, C.; Ramírez-Díaz, J.L.; Alemán-de la Torre, I. Phenolic compounds in maize grains and its nixtamalized products. In Phenolic Compounds-Natural Sources, Importance and Applications; InTechOpen: London, UK, 2017; pp. 215–232. [Google Scholar]
- Zavala-López, M.; Flint-García, S.; García-Lara, S. Compositional variation in trans-ferulic, p-coumaric, and diferulic acids levels among kernels of modern and traditional maize (Zea mays L.) hybrids. Front. Nutr. 2020, 7, 600747. [Google Scholar] [CrossRef]
- Choi, S.W.; Sung, K.L.; Eun, O.K.; Ji, H.O.; Kyung, S.Y.; Parris, N.; Hicks, K.B.; Moreau, R.A. Antioxidant and antimelanogenic activities of polyamine conjugate from corn bran and related hydroxicinnamic acids. J. Agric. Food Chem. 2007, 55, 3920–3925. [Google Scholar] [CrossRef]
- Silambarasan, T.; Manivannan, J.; Priya, M.K.; Suganya, N.; Chatterjee, S.; Raja, B. Sinapic acid prevents hypertension and cardiovascular remodeling in pharmacological model of nitric oxide inhibited rats. PLoS ONE 2014, 9, e115682. [Google Scholar] [CrossRef] [Green Version]
- Wang, K.J.; Zhao, J.L. Corn silk (Zea mays L.), a source of natural antioxidants with α-amylase, α-glucosidase, advanced glycation and diabetic nephropathy inhibitory activities. Biomed. Pharmacother. 2019, 110, 510–517. [Google Scholar] [CrossRef]
- Hasanudin, K.; Hashim, P.; Mustafa, S. Corn silk (Stigma maydis) in healthcare: A phytochemical and pharmacological review. Molecules 2012, 17, 9697–9715. [Google Scholar] [CrossRef] [Green Version]
- Gazit, E.; Mitraki, A. (Eds.) Introduction: Nanobiotechnology and bionanotechnology. In Plenty of Room for Biology at the Bottom: Introduction to Bionanotechnology; Imperial College Press: London, UK, 2013; pp. 1–15. [Google Scholar]
- Amina, M.; Al Musayeib, N.M.; Alarfaj, N.A.; El-Tohamy, M.F.; Oraby, H.F.; Al Hamoud, G.A.; Bukhari, S.I.; Moubayed, N.M. Biogenic green synthesis of MgO nanoparticles using Saussurea costus biomasses for a comprehensive detection of their antimicrobial, cytotoxicity against MCF-7 breast cancer cells and photocatalysis potentials. PLoS ONE 2020, 15, e0237567. [Google Scholar] [CrossRef] [PubMed]
- Dhall, A.; Self, W. Cerium oxide nanoparticles: A brief review of their synthesis methods and biomedical applications. Antioxidants 2018, 7, 97. [Google Scholar] [CrossRef] [PubMed] [Green Version]
- Nadeem, M.; Khan, R.; Afridi, K.; Nadhman, A.; Ullah, S.; Faisal, S.; Mabood, Z.U.; Hano, C.; Abbasi, B.H. Green synthesis of cerium oxide nanoparticles (CeO2NPs) and their antimicrobial applications: A review. Int. J. Nanomed. 2020, 15, 5951–5961. [Google Scholar] [CrossRef] [PubMed]
- Zavala-López, M.; García-Lara, S. An improved microscale method for extraction of phenolic acids from maize. Plant Methods 2017, 13, 81. [Google Scholar] [CrossRef] [PubMed] [Green Version]
- Limmatvapirat, C.; Nateesathittarn, C.; Dechasathian, K.; Moohummad, T.; Chinajitphan, P.; Limmatvapirat, S. Phytochemical analysis of baby corn silk extracts. J. Ayurveda Integr. Med. 2020, 11, 344–351. [Google Scholar] [CrossRef]
- Musarat, A.; Alarfaj, N.A.; El-Tohamy, M.F.; Al Musayeib, N.M.; Oraby, H.F. Sequential injection-chemiluminescence evaluation of stigmasterol glucoside and luteolin via green synthesis of silver nanoparticles using biomass of Plectranthus asirensis. Green Chem. Lett. Rev. 2018, 11, 523–533. [Google Scholar]
- Lopez-Martinez, L.X.; Oliart-Ros, R.M.; Valerio-Alfaro, G.; Lee, C.H.; Parkin, K.L.; Garcia, H.S. Antioxidant activity, phenolic compounds and anthocyanins content of eighteen strains of Mexican maize. LWT Food Sci. Technol. 2009, 42, 1187–1192. [Google Scholar] [CrossRef]
- Prabaharan, D.M.; Sadaiyandi, K.; Mahendran, M.; Sagadevan, S. Structural, optical, morphological and dielectric properties of cerium oxide nanoparticles. Mater. Res. 2016, 19, 478–482. [Google Scholar] [CrossRef]
- Seftel, E.M.; Puscasu, M.C.; Mertens, M.; Cool, P.; Carja, G. Assemblies of nanoparticles of CeO2–ZnTi-LDHs and their derived mixed oxides as novel photocatalytic systems for phenol degradation. Appl. Catal. B 2014, 150, 157–166. [Google Scholar] [CrossRef]
- Tian, J.; Chen, H.; Chen, S.; Xing, L.; Wang, Y. Comparative studies on the constituents, antioxidant and anticancer activities of extracts from different varieties of corn silk. Food Funct. 2013, 4, 1526–1534. [Google Scholar] [CrossRef]
- Tumkur, P.P.; Gunasekaran, N.K.; Lamani, B.R.; Bayon, N.N.; Prabhakaran, K.; Hall, J.C.; Ramesh, G.T. Cerium oxide nanoparticles: Synthesis and characterization for biosafe applications. Nanomanufacturing 2021, 3, 176–189. [Google Scholar] [CrossRef]
- Pujar, M.S.; Hunagund, S.M.; Desai, V.R.; Patil, S.; Sidarai, A.H. One-step synthesis and characterizations of cerium oxide nanoparticles in an ambient temperature via Co-precipitation method. AIP Conf. Proc. 2018, 1942, 050026. [Google Scholar]
- Lizunova, A.A.; Loshkarev, A.A.; Tokunov, Y.M.; Ivanov, V.V. Comparison of the results of measurements of the sizes of nanoparticles in stable colloidal solutions by the methods of acoustic spectroscopy, dynamic light scattering, and transmission electron microscopy. Meas. Tech. 2017, 59, 1151–1155. [Google Scholar] [CrossRef]
- Swiech, O.; Kaim, A.; Hrynkiewicz-Sudnik, N.; Palys, B.; Bilewicz, R. Anchoring gold nanoparticles to gold surfaces through nitroxyl radicals. ECS Trans. 2011, 35, 39–45. [Google Scholar] [CrossRef]
- Khan, P.; Idrees, D.; Moxley, M.; Corbett, J.; Ahmad, F.; von Figura, G.; Sly, W.; Waheed, A.; Hassan, I. Luminol-based chemiluminescent signals: Clinical and non- clinical application and future uses. Appl. Biochem. Biotechnol. 2014, 173, 333–355. [Google Scholar] [CrossRef] [Green Version]
- Amorati, R.; Valgimigli, L. Advantages and limitations of common testing methods for antioxidants. Free Radic. Res. 2015, 49, 633–649. [Google Scholar] [CrossRef]
- Adom, K.K.; Liu, R.H. Antioxidant activity of grains. J. Agric. Food Chem. 2002, 50, 6182–6187. [Google Scholar] [CrossRef]
- Rodríguez-Salinas, P.A.; Zavala-García, F.; Urías-Orona, V.; Muy-Rangel, D.; Heredia, J.B.; Niño-Medina, G. Chromatic, nutritional and nutraceutical properties of pigmented native maize (Zea mays L. genotypes from the northeast of mexico). Arab. J. Sci. Eng. 2020, 45, 95–112. [Google Scholar] [CrossRef]
- Ndolo, V.U.; Beta, T. Comparative studies on composition and distribution of phenolic acids in cereal grain botanical fractions. Cereal Chem. 2014, 91, 522–530. [Google Scholar] [CrossRef]
- Horvat, D.; Šimić, G.; Drezner, G.; Lalić, A.; Ledenčan, T.; Tucak, M.; Plavšić, H.; Andrić, L.; Zdunić, Z. Phenolic acid profiles and antioxidant activity of major cereal crops. Antioxidants 2020, 9, 527. [Google Scholar] [CrossRef]
- Li, R.; Pan, Y.; Li, N.; Wang, Q.; Chen, Y.; Phisalaphong, M.; Chen, H. Antibacterial and cytotoxic activities of a green synthesized silver nanoparticles using corn silk aqueous extract. Colloid Surf. A Phys. Eng. Asp. 2020, 598, 124827. [Google Scholar] [CrossRef]
- Lord, M.S.; Berret, J.F.; Singh, S.; Vinu, A.; Karakoti, A.S. Redox active cerium oxide nanoparticles: Current status and burning issues. Small 2021, 17, 2102342. [Google Scholar] [CrossRef] [PubMed]
- Duan, C.; Cui, H.; Zhang, Z.; Liu, B.; Guo, J.; Wang, W. Size-dependent inhibition and enhancement by gold nanoparticles of luminol− ferricyanide chemiluminescence. J. Phys. Chem. C 2007, 111, 4561–4566. [Google Scholar] [CrossRef]
- Oraby, H.F.; Alarfaj, N.A.; El-Tohamy, M.F. Gold nanoparticle-enhanced luminol/ferricyanide chemiluminescence system for aristolochic acid-I detection in medicinal plants and slimming products. Green Chem. Lett. Rev. 2017, 10, 138–147. [Google Scholar] [CrossRef]


| Interferents Species | Tolerable Level (ng mL−1) |
|---|---|
| Na+, K+, Fe3+, Mn3+, Mg2+, Ca2+, Cu2+ and Zn2+ | 1,200,000 |
| Lysine and tryptophan | 600,000 |
| Starch, sucrose, glucose, and fructose | 100,000 |
| Vitamin E, thiamine (vitamin B1), riboflavin (vitamin B2), niacin (vitamin B3), and ascorbic acid | 800,000 |
| Sample | Precision % RSD | |
|---|---|---|
| Ferulic acid conc. (ng mL−1) | Intra-day | Inter-day |
| 20,000 | 1.2 | 1.1 |
| 100,000 | 1.4 | 0.9 |
| 200,000 | 0.8 | 1.3 |
| Sinapic acid conc. (ng mL−1) | Intra-day | Inter-day |
| 50 | 0.5 | 0.9 |
| 1500 | 1.5 | 1.2 |
| 4000 | 0.9 | 1.1 |
| p-Coumaric acid conc. (ng mL−1) | Intra-day | Inter-day |
| 1000 | 1.4 | 1.2 |
| 25,000 | 1.1 | 1.3 |
| 50,000 | 0.7 | 0.8 |
| DPPH Radical Scavenging Activity | ABTS Radical Scavenging Activity | |||
|---|---|---|---|---|
| Samples | Concentration (ug mL−1) | Scavenging (%) | Concentration (ug mL−1) | Scavenging (%) |
| MSE | 25 | 35.69 ± 0.53 | 25 | 37.21 ± 0.13 |
| 50 | 42.84 ± 0.27 | 50 | 47.42 ± 0.26 | |
| 100 | 55.89 ± 0.22 | 100 | 52.44 ± 0.45 | |
| CeO2NPs | 25 | 60.21 ± 0.55 | 25 | 55.81 ± 0.49 |
| 50 | 66.90 ± 0.32 | 50 | 69.95 ± 0.19 | |
| 100 | 75.11 ± 0.14 | 100 | 75.70 ± 0.76 | |
| Ascorbic Acid | 25 | 62.43 ± 0.42 | 25 | 59.22 ± 0.32 |
| 50 | 71.87 ± 0.61 | 50 | 71.17 ± 0.89 | |
| 100 | 79.12 ± 0.31 | 100 | 77.56 ± 0.61 | |
Publisher’s Note: MDPI stays neutral with regard to jurisdictional claims in published maps and institutional affiliations. |
© 2022 by the author. Licensee MDPI, Basel, Switzerland. This article is an open access article distributed under the terms and conditions of the Creative Commons Attribution (CC BY) license (https://creativecommons.org/licenses/by/4.0/).
Share and Cite
Oraby, H.F. Maize Silk Biogenic Nanoceria (CeO2NPs) Enhanced Sequential Injection-Chemiluminescence Detection of Ferulic, Sinapic and p-Coumaric in Yellow Maize Kernels. Plants 2022, 11, 885. https://doi.org/10.3390/plants11070885
Oraby HF. Maize Silk Biogenic Nanoceria (CeO2NPs) Enhanced Sequential Injection-Chemiluminescence Detection of Ferulic, Sinapic and p-Coumaric in Yellow Maize Kernels. Plants. 2022; 11(7):885. https://doi.org/10.3390/plants11070885
Chicago/Turabian StyleOraby, Hesham Farouk. 2022. "Maize Silk Biogenic Nanoceria (CeO2NPs) Enhanced Sequential Injection-Chemiluminescence Detection of Ferulic, Sinapic and p-Coumaric in Yellow Maize Kernels" Plants 11, no. 7: 885. https://doi.org/10.3390/plants11070885
APA StyleOraby, H. F. (2022). Maize Silk Biogenic Nanoceria (CeO2NPs) Enhanced Sequential Injection-Chemiluminescence Detection of Ferulic, Sinapic and p-Coumaric in Yellow Maize Kernels. Plants, 11(7), 885. https://doi.org/10.3390/plants11070885