Article

Genetic Diversity, Population Structure and Linkage Disequilibrium Analyses in Tropical Maize Using Genotyping by Sequencing

1
ICAR-Indian Institute of Maize Research, Ludhiana 141004, India
2
Centre for Plant Breeding and Genetics, Tamil Nadu Agricultural University, Coimbatore 641003, India
3
ICAR-Directorate of Poultry Research, Hyderabad 500030, India
4
Department of Crop Imrovement, ICAR-Vivekananda Parvatiya Krishi Anusandhan Sansthan, Almora 263601, India
5
Department of Plant Breeding, CCS-Haryana Agricultural University, Regional Research Station, Uchani 132001, India
6
Department of Crop Improvement, ICAR-Indian Institute of Rice Research, Hyderabad 500030, India
7
Division of Genetics, ICAR-Indian Agricultural Research Institute, New Delhi 110012, India
*
Author to whom correspondence should be addressed.
Plants 2022, 11(6), 799; https://doi.org/10.3390/plants11060799
Submission received: 28 January 2022 / Revised: 9 March 2022 / Accepted: 10 March 2022 / Published: 17 March 2022
(This article belongs to the Special Issue Cereals Genetic Resources and Improvement)

Abstract

:
Several maize breeding programs in India have developed numerous inbred lines but the lines have not been characterized using high-density molecular markers. Here, we studied the molecular diversity, population structure, and linkage disequilibrium (LD) patterns in a panel of 314 tropical normal corn, two sweet corn, and six popcorn inbred lines developed by 17 research centers in India, and 62 normal corn from the International Maize and Wheat Improvement Center (CIMMYT). The 384 inbred lines were genotyped with 60,227 polymorphic single nucleotide polymorphisms (SNPs). Most of the pair-wise relative kinship coefficients (58.5%) were equal or close to 0, which suggests the lack of redundancy in the genomic composition in the majority of inbred lines. Genetic distance among most pairs of lines (98.3%) varied from 0.20 to 0.34 as compared with just 1.7% of the pairs of lines that differed by <0.20, which suggests greater genetic variation even among sister lines. The overall average of 17% heterogeneity was observed in the panel indicated the need for further inbreeding in the high heterogeneous genotypes. The mean nucleotide diversity and frequency of polymorphic sites observed in the panel were 0.28 and 0.02, respectively. The model-based population structure, principal component analysis, and phylogenetic analysis revealed three to six groups with no clear patterns of clustering by centers-wise breeding lines, types of corn, kernel characteristics, maturity, plant height, and ear placement. However, genotypes were grouped partially based on their source germplasm from where they derived.

1. Introduction

Maize (Zea mays L.) is one of the most valuable crops cultivated in the world for its diverse uses in food, feed, starch, textile, pharmaceutical, cosmetic industries, oil, protein, alcoholic, and bio-ethanol production [1,2,3,4]. In India, maize is the thirdmostmajor crop after rice and wheat and contributes 2–3% of the total maize produced globally [5]. It is one of the highest-yielding crops, which is primarily due to heterosis. The use of heterosis in crop improvement has been the major significant scientific achievement in the history of plant breeding, which has contributed a lot to an increase in yield and productivity [6,7].Heterosis can be exploited better in hybrids when well-characterized inbred lines from different heterotic groups are used in the crossing program [8,9]. Thus, knowledge on the molecular diversity, genetic purity, heterotic grouping, and genetic relationships among inbred lines developed by different research institutions are important for identifying the right parental combinations for initiating new crosses either for inbred line development or hybrid development. In crosses with known heterotic groups, inbred lines are derived by crossing two genetically distant lines with acceptable phenotypic traits from within the same heterotic group. For hybrid development, on the other hand, parental lines should be genetically distant and from different heterotic groups.
Maize breeders develop numerous inbred lines based on phenotypic selection and assign them into different heterotic groups based on combining ability tests, such as diallel and line-by-tester analyses. Numerous molecular characterization studies have been conducted on maize using diverse types of molecular markers, sample size, and marker density. In recent years, single nucleotide polymorphism (SNPs) based on genotyping by sequencing (GBS) technology [10] has become very popular for multiple reasons, which have been reviewed in other studies [11,12]. This includes the use of GBS to study maize germplasm from international research centers [13,14,15,16], Europe [17], and China [8], but the method has not yet been used to investigate maize germplasm developed or adapted in India. Previous molecular characterization studies in maize grown in India primarily used simple sequence repeat (SSR) markers [18,19,20,21,22]. Although SSRs are highly polymorphic, multi-allelic, and codominant, they are not suitable for large-scale germplasm characterization due to high genotyping cost per sample, low throughput, a limited number of markers, high genotyping errors, and uneven distribution in the genome [23,24].
High-density SNPs via GBS are providing good opportunities to the researchers for low-cost and rapid turnaround time to quickly genotype their germplasm for different purposes, including genetic diversity assessment, mapping genes and quantitative trait loci (QTL) using bi-parental populations and genome-wide association mapping (GWAS) panels, and developing improved varieties using marker-assisted and genomic selection [25,26,27]. Linkage disequilibrium (LD) is a non-random association between alleles at various loci [28]. It is very useful in GWAS to determine the suitability of molecular marker density to identify genes and QTLs associated with traits of economic importance. The objectives of the present study were, therefore, to understand the molecular diversity, genetic purity, relatedness, population structure, and LD in maize inbred lines developed by different research centers in India and compare them with representative inbred lines from international research centers using high-density SNPs.

2. Results

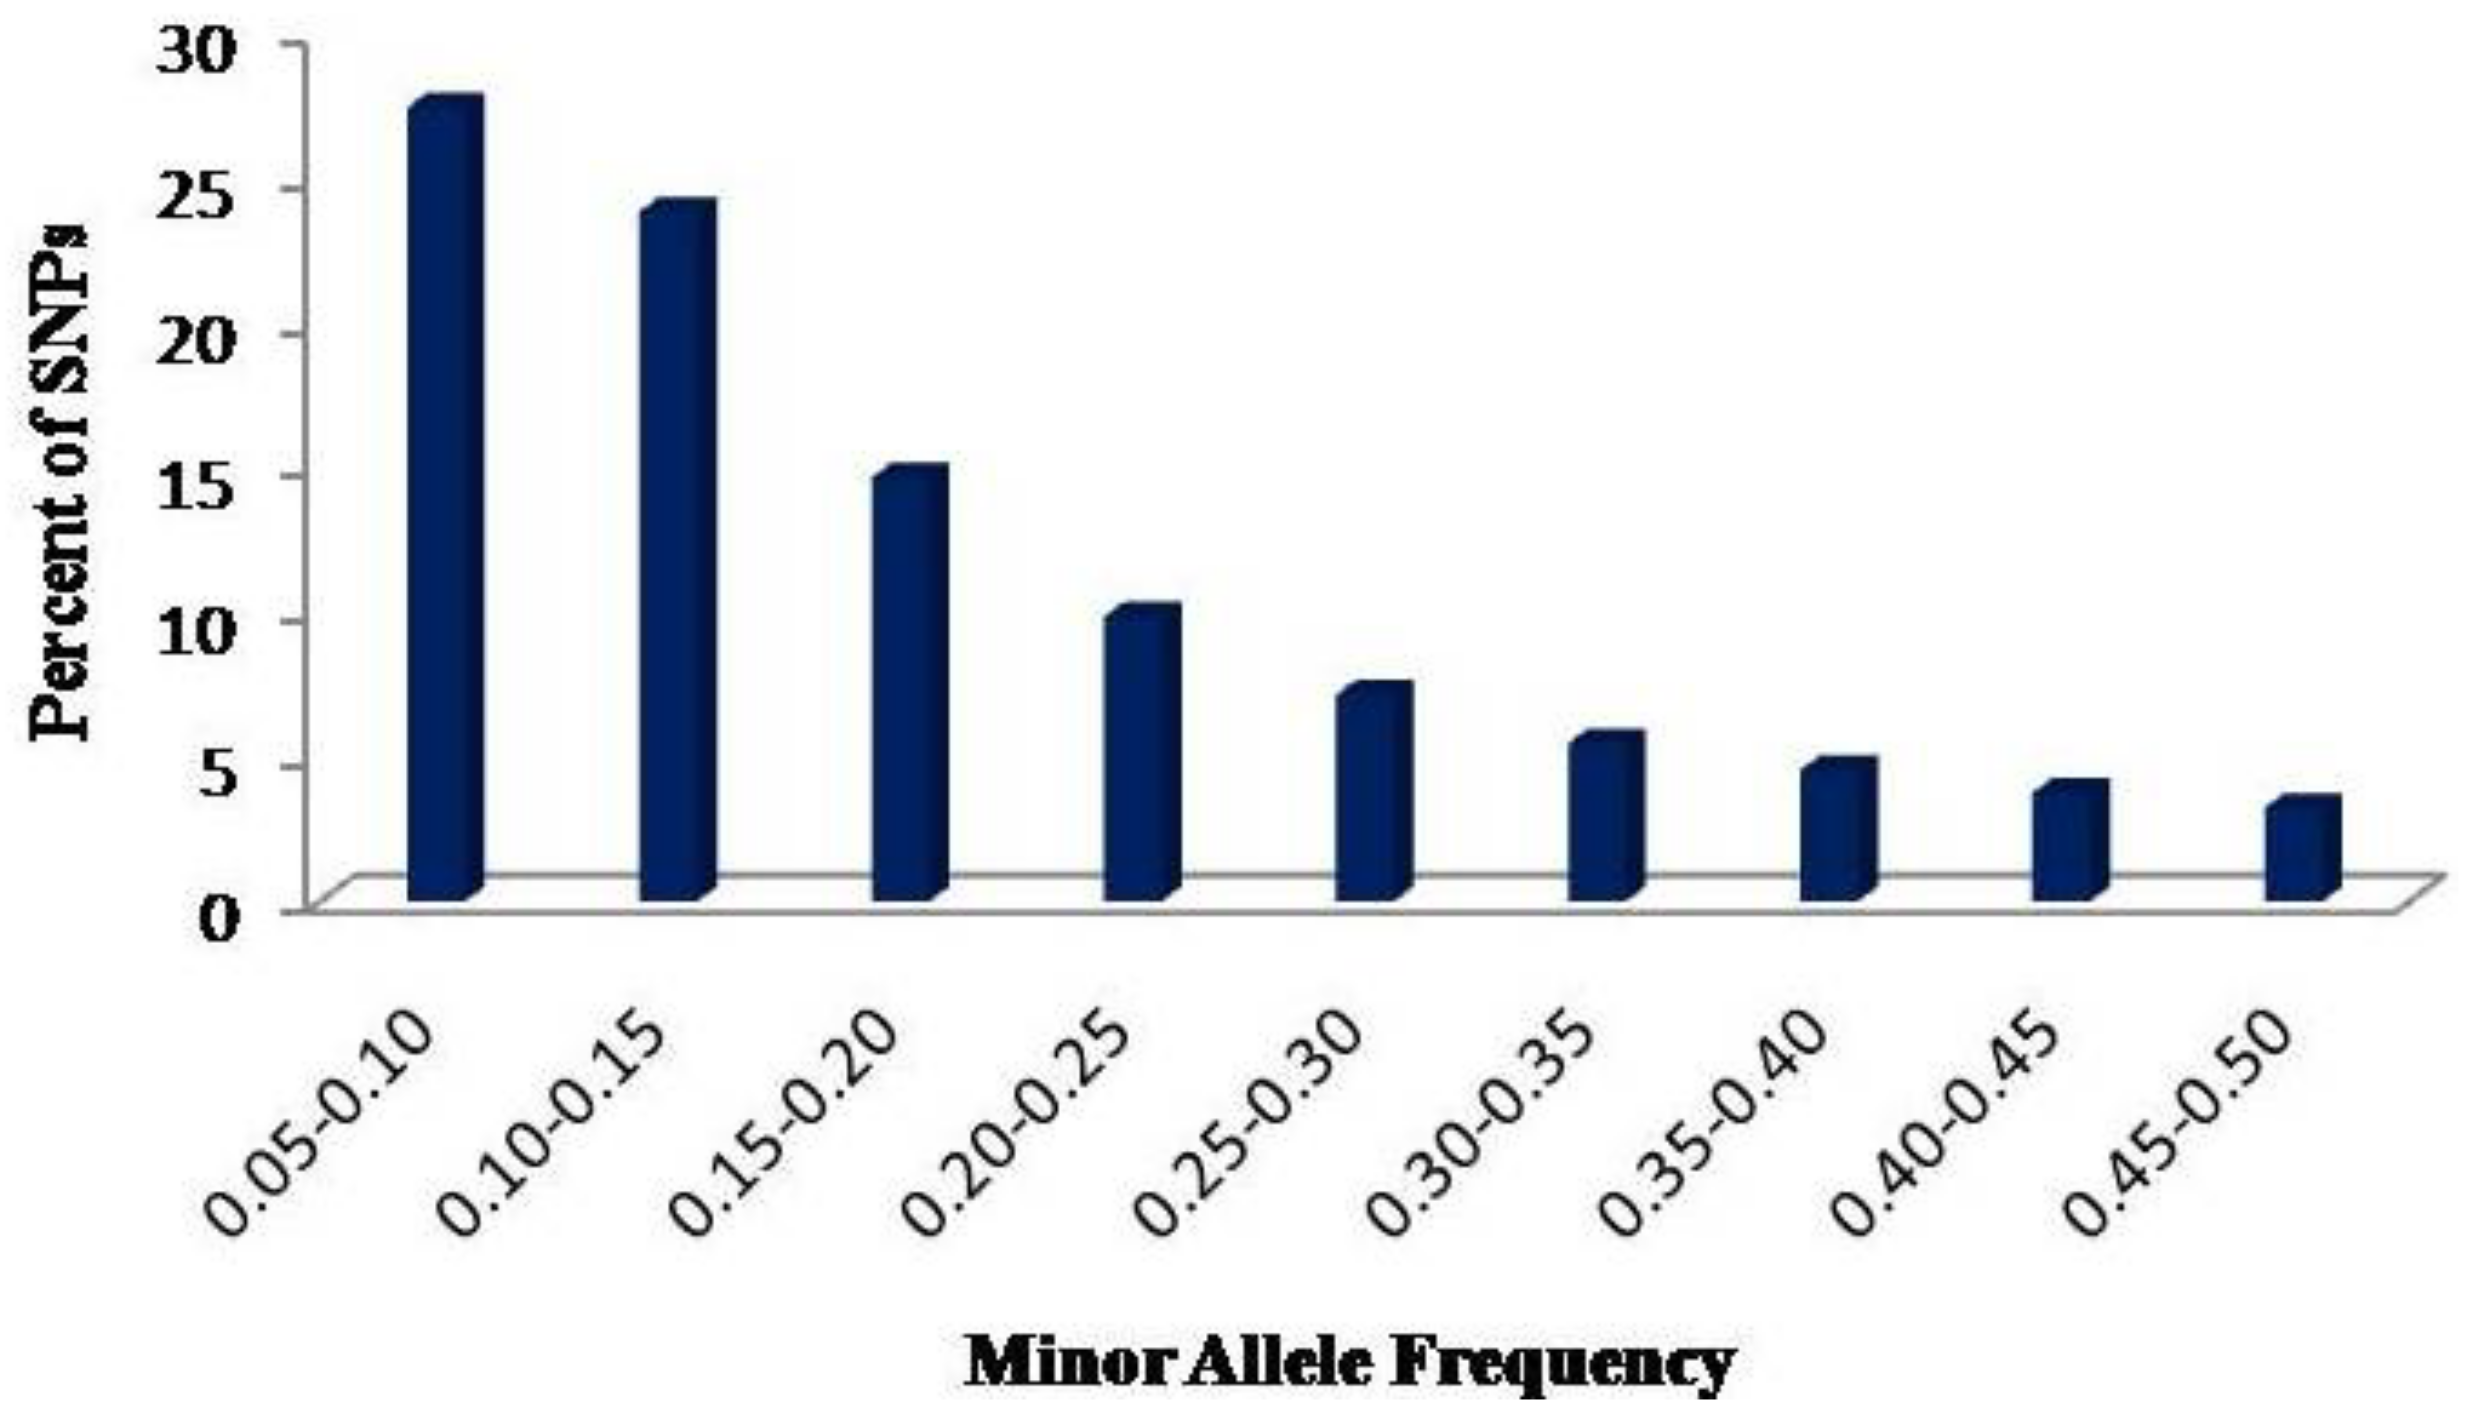
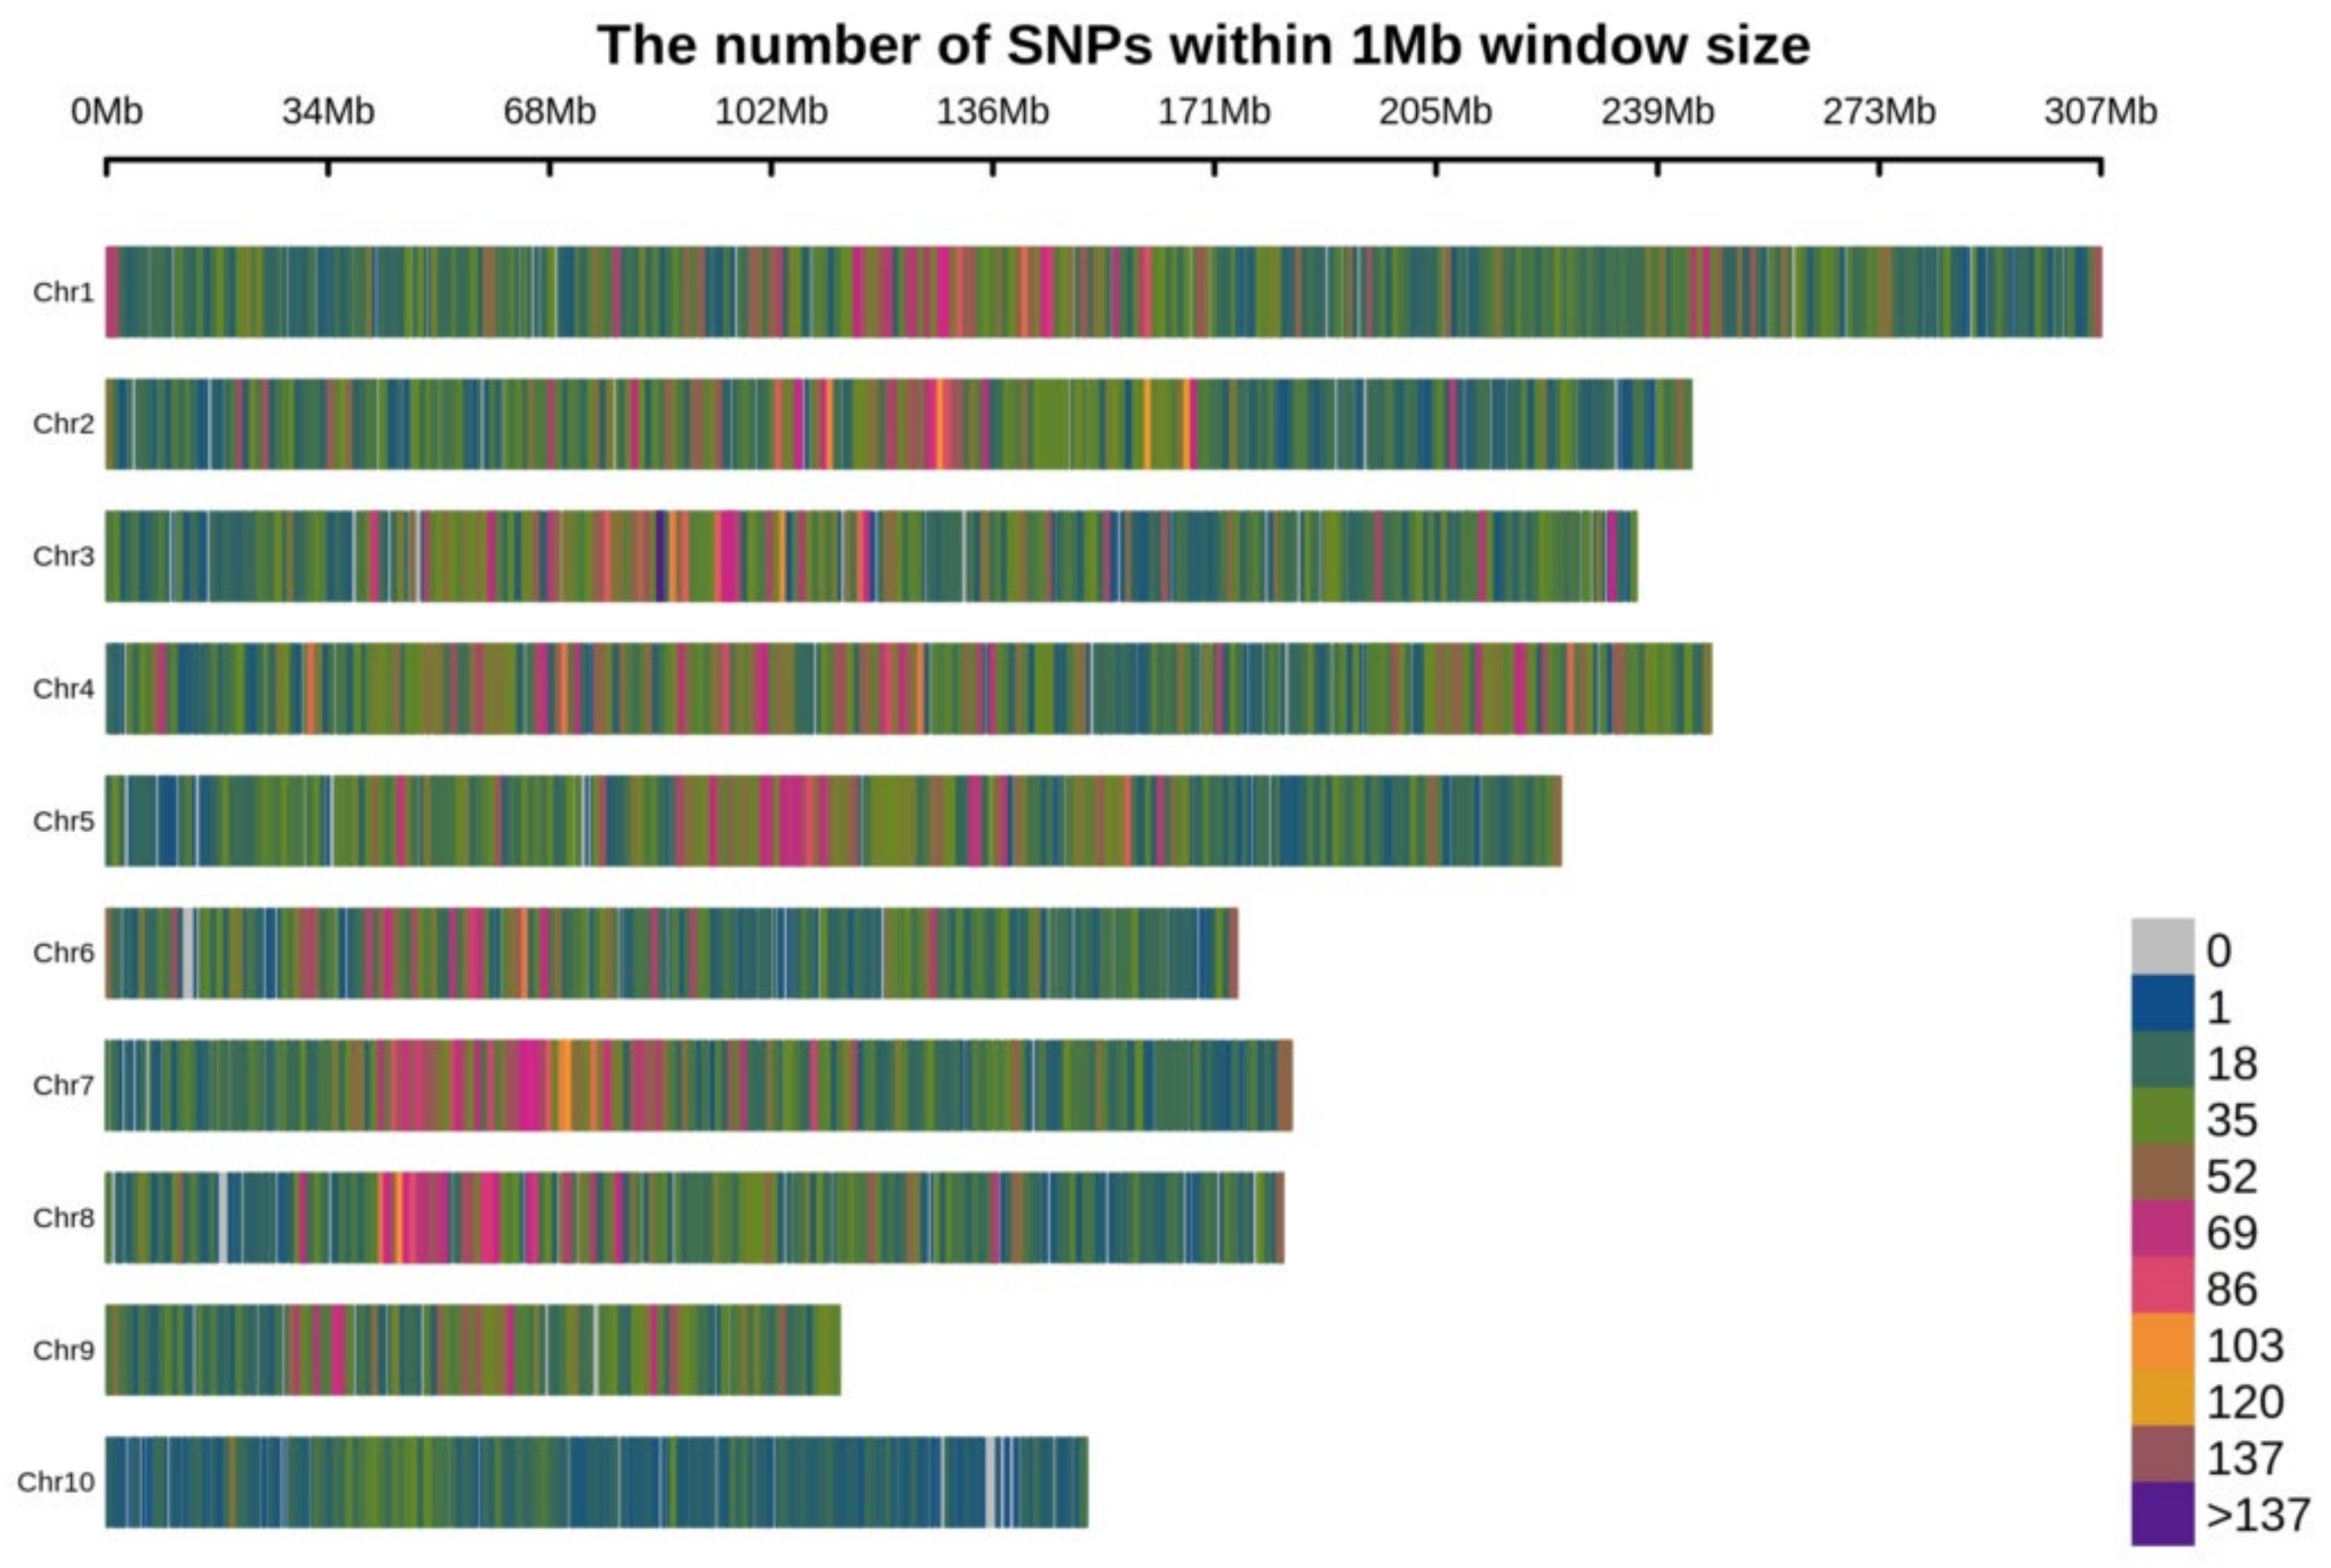
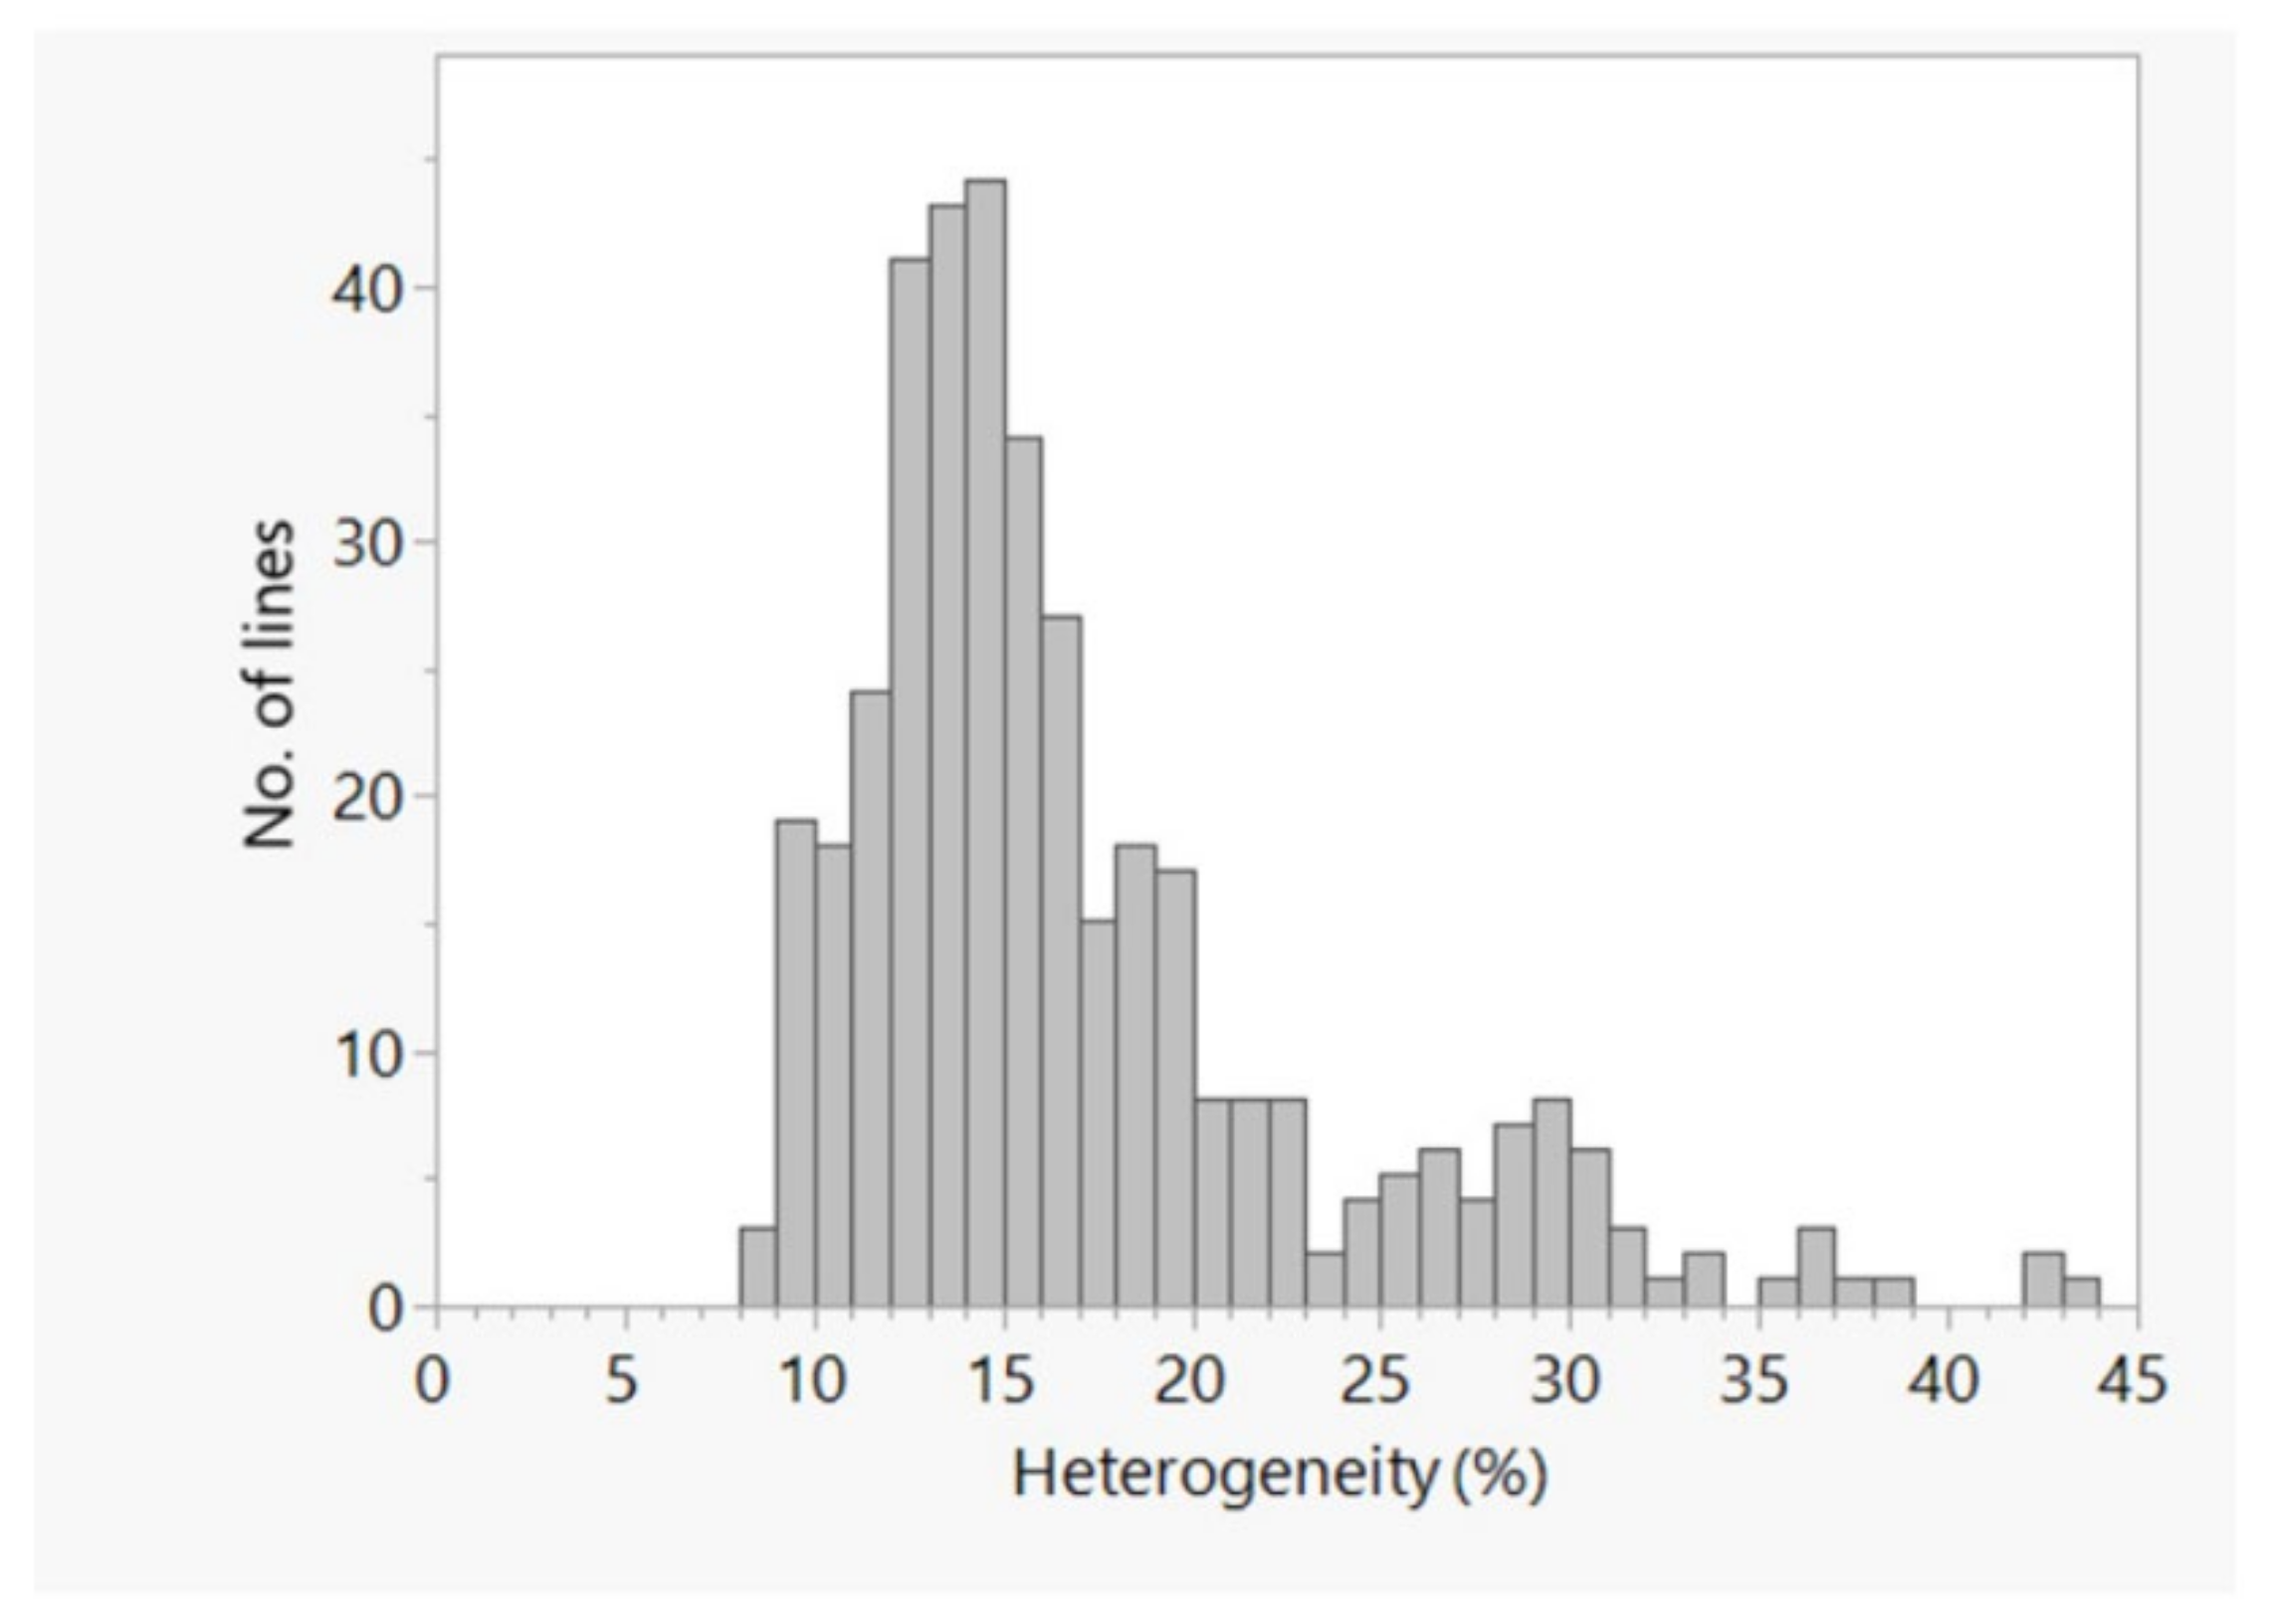
2.1. SNP Discovery and Their Distribution

We used a total of 60,227 polymorphic SNPs, each with a minimum allele frequency of 0.05 and a maximum missing data of 20%, to understand the genetic diversity, population structure, and LD across 384 inbred lines originated from CIMMYT (62) and 17 research institutions/centers in India (322) (Table S1). The polymorphic SNPs were distributed across all ten maize chromosomes with per chromosome number ranging from 2167 on Chr-10 to 8976 on Chr-1 (Table 1). The number of polymorphic SNPs decreased to 45,548 when they were filtered using a MAF of 0.10. The 60,227 polymorphic SNPs represented 20,085 loci, which is equivalent to three SNPs per locus. The number of loci varied from 1080 on Chr-9 to 2906 on Chr-1 (Table 1) with an average of 2009 loci per chromosome. The minor allele frequency (MAF) (Figure 1) shows a skew distribution with 51% of SNPs having MAF between 0.05 and 0.15 and only 17.0% between 0.30 and 0.50.
The 60,227 polymorphic SNPs cover 2057.3 Mb of the maize genome with each chromosome ranging in length from 110.77 Mb (Chr-9) to 307.0 Mb (Chr-1) with an average of 205.73 Mb per chromosome (Figure 2). The total physical distance covered during sequencing accounted for 89.4% of the total B73 genome (2300 Mb) [29]. The polymorphic SNPs provided the whole genome-wide coverage with a SNP at a mean distance of 34.20 kb (Figure 2). The average physical distance of SNPs on each chromosome ranged from 29.78 kb on Chr-4 to 69.67 kb on Chr-10.
As shown in Table 2, the mean nucleotide diversity, frequency of polymorphic sites per bp, and proportion of heterozygous loci observed in the data set were 0.28, 0.02, and 0.17, respectively. The average polymorphic information content (PIC) for 60,277 SNPs was 0.23. DQL 574-2, DQL 609-5, DQL 790-2-4 Analysis of various mutational changes in the sequenced data revealed that the percentage of transition mutations was much higher (72.56%) than that of the transversion (27.44%). The frequency of SNP mutation C/T was highest (0.36), whereas C/G was lowest (0.05). The genome-wide mean transition to transversions ratio was 2.64. Overall, the frequency of C/T and A/G transitions was almost similar (~0.36) in the genome, whereas among transversions, the frequency of G/T was highest (0.076), while C/G was the lowest (0.05). In the case of transversion mutations, the frequencies of A/T, A/C, G/T were near similar (0.073 to 0.076), except the C/G (0.05) (Table 2).

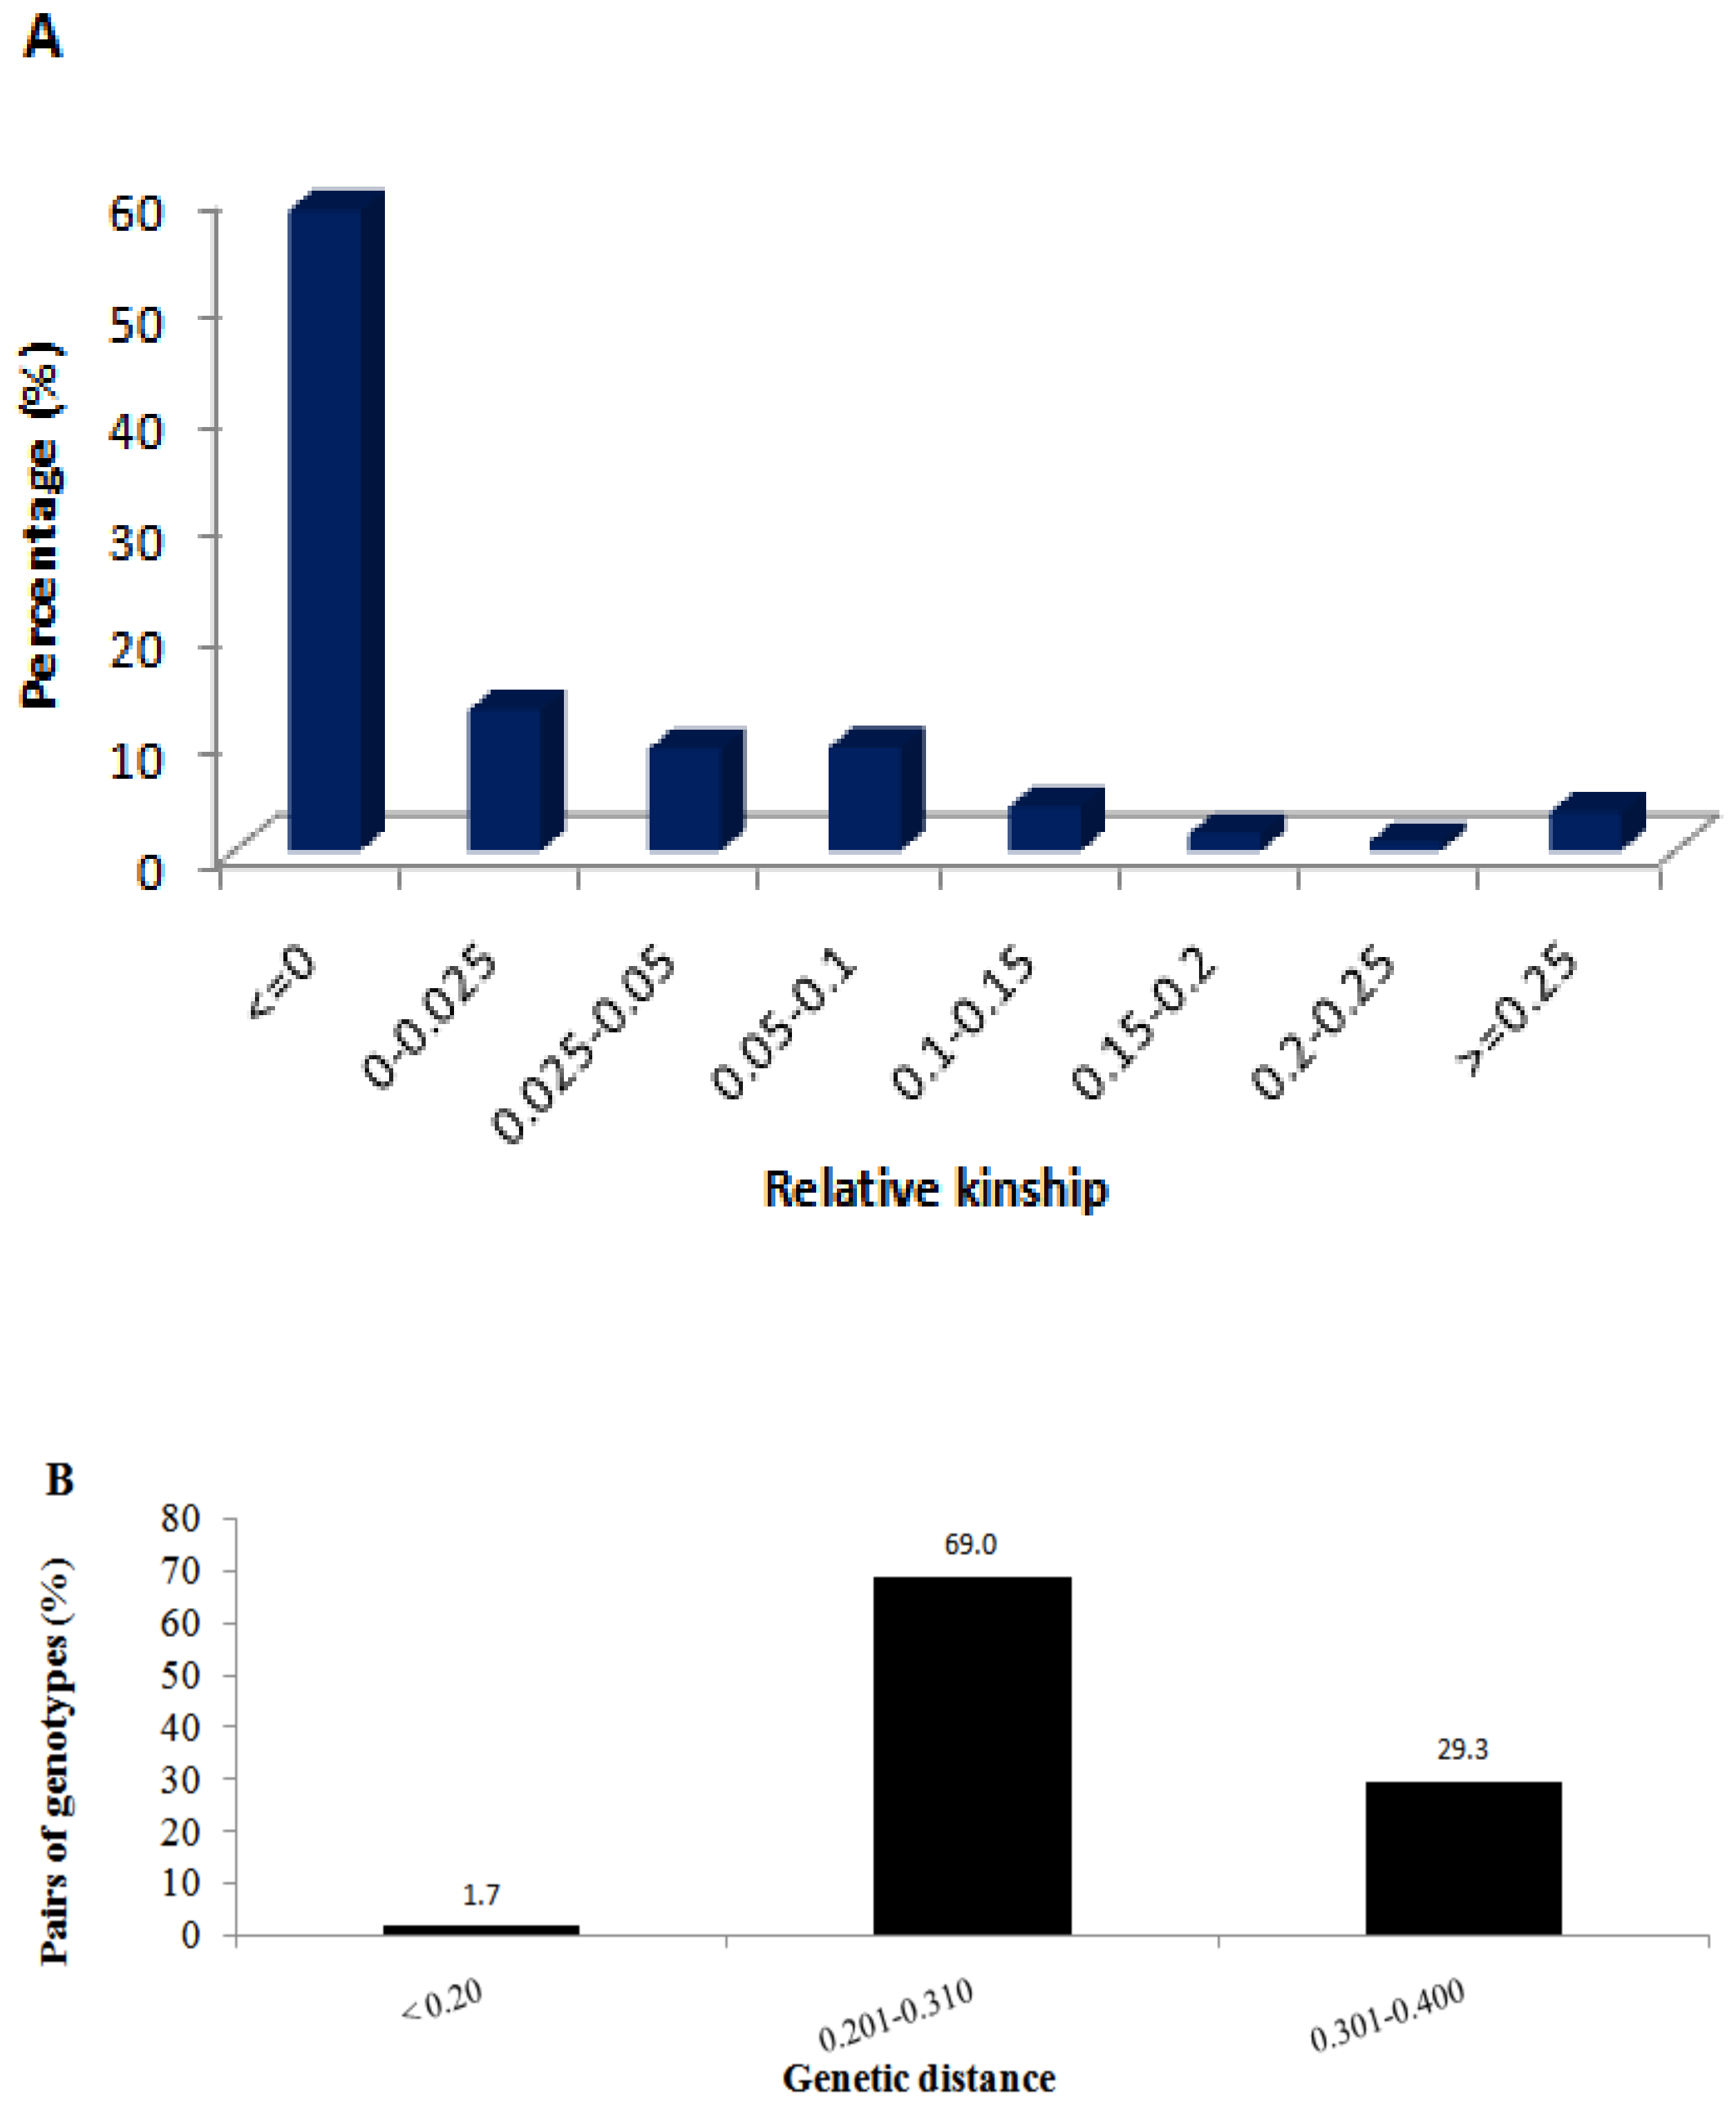
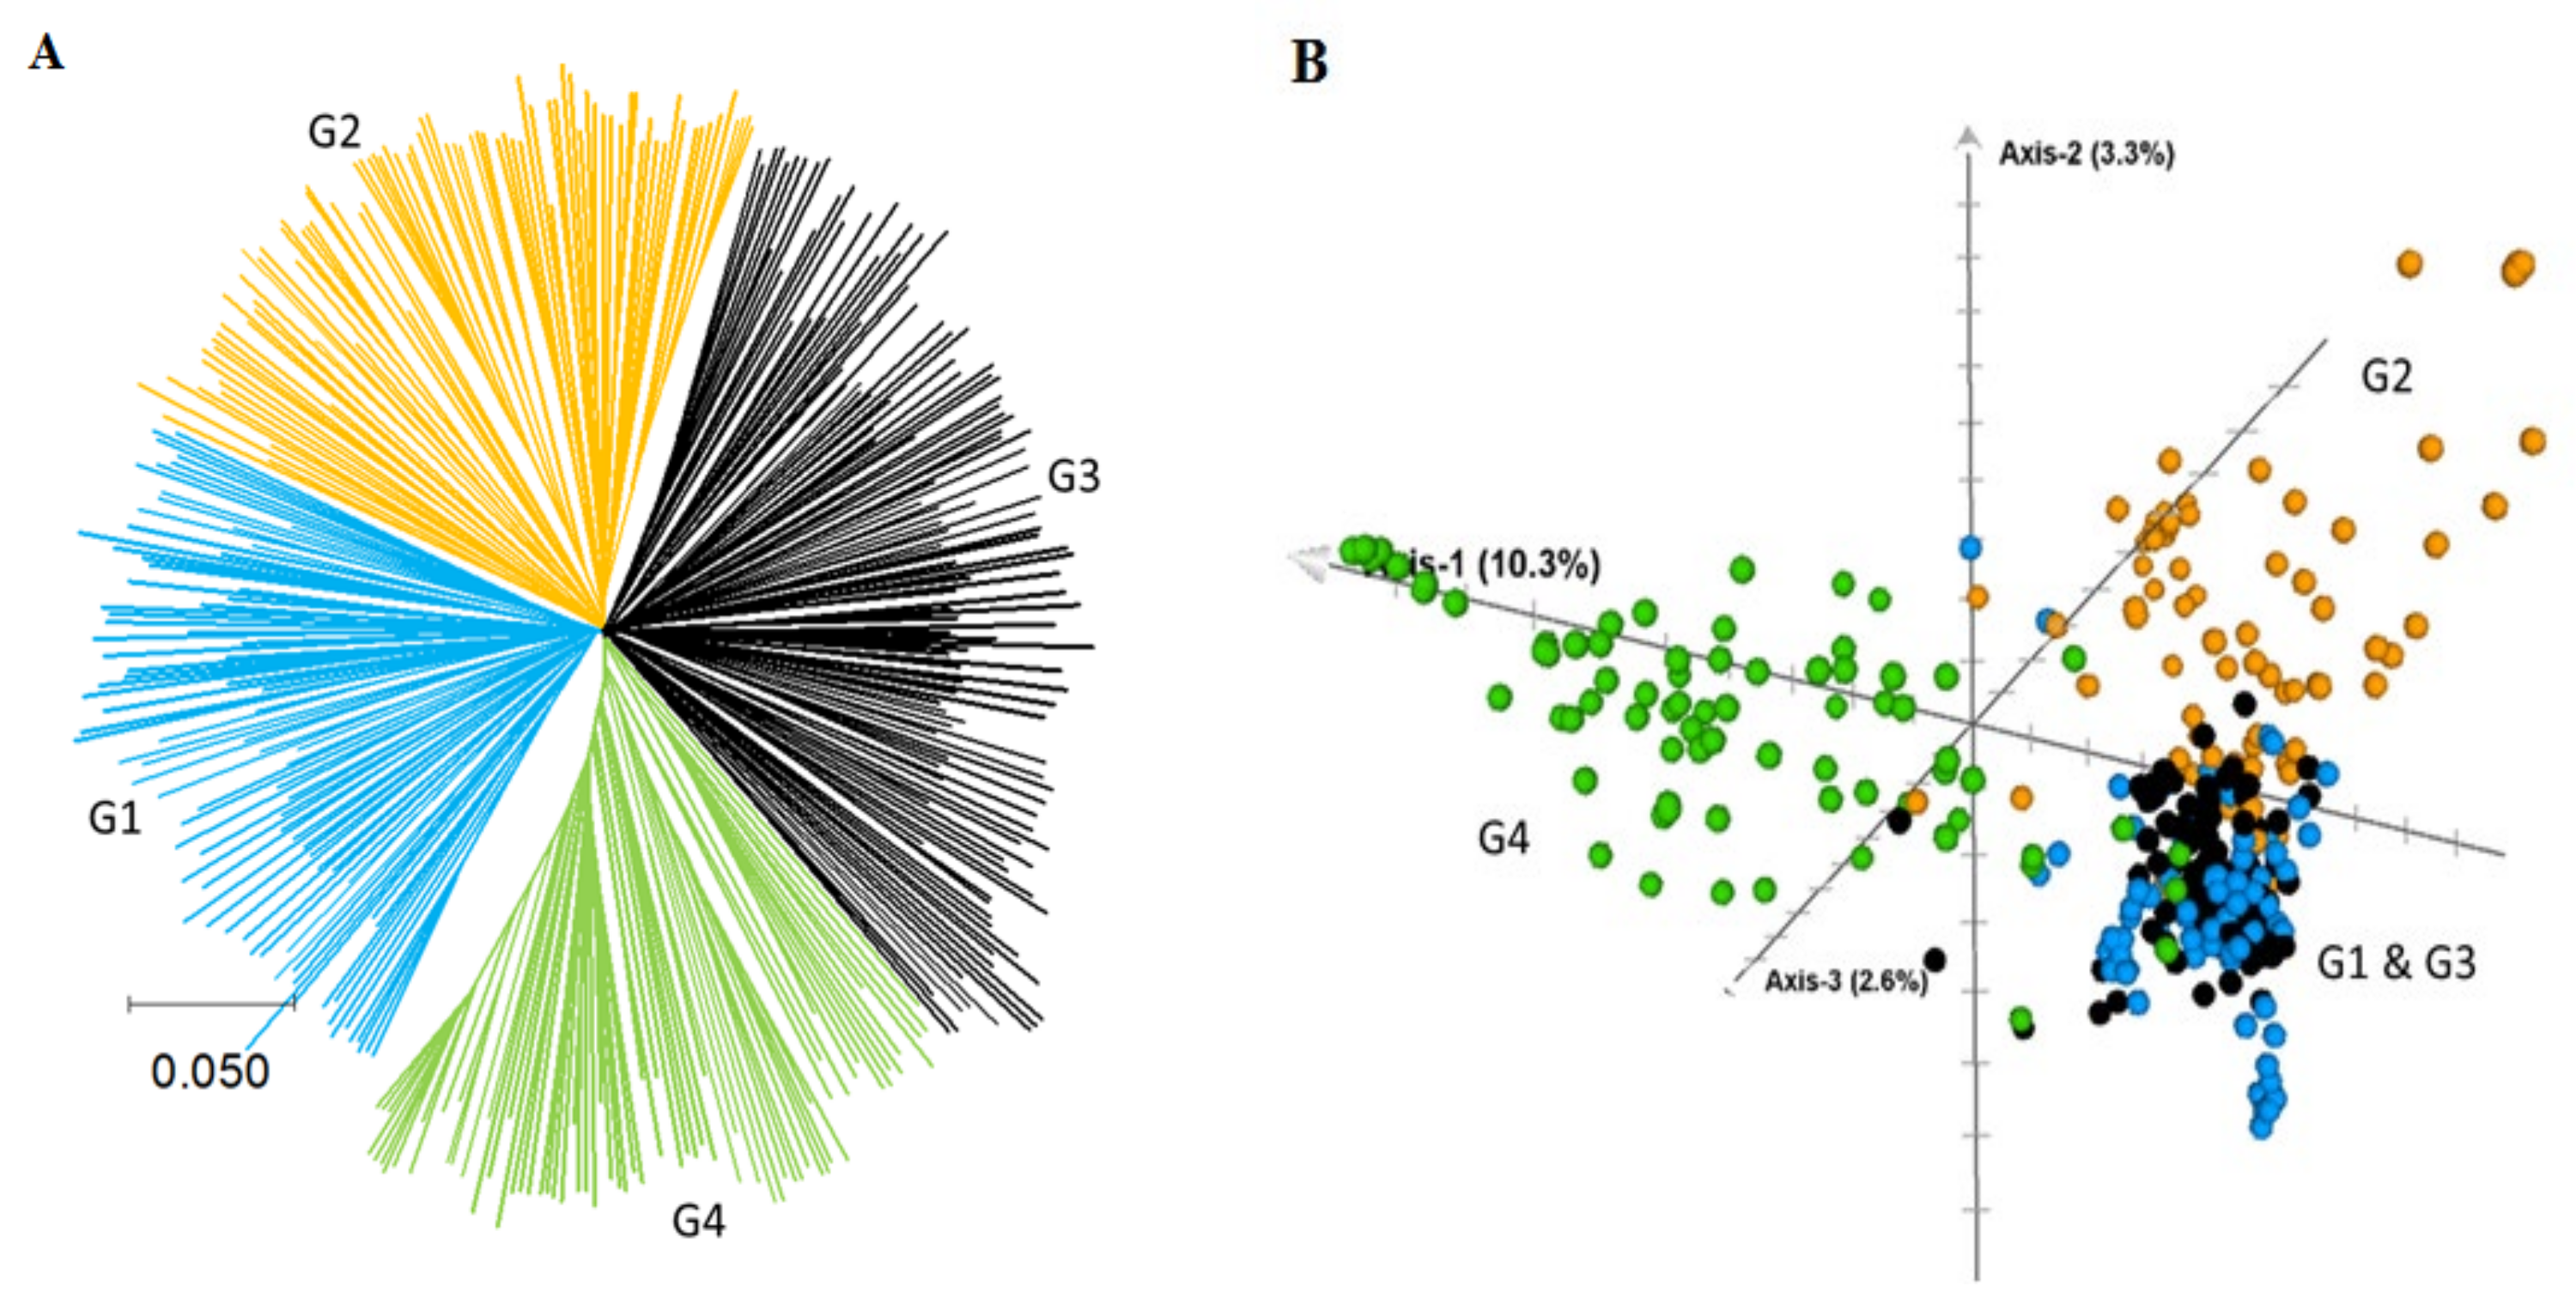
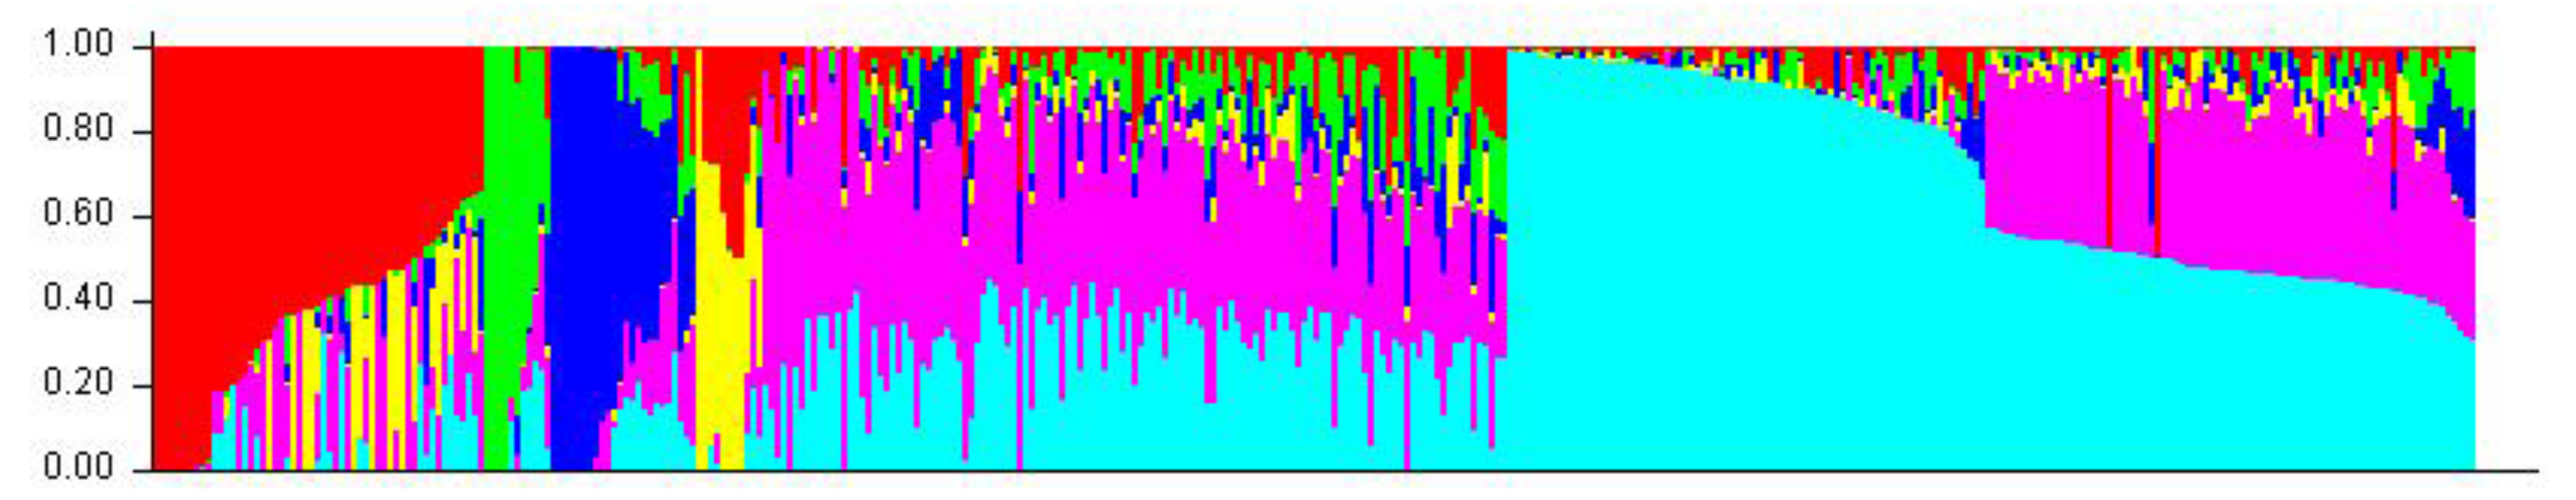
2.2. Genetic Relationship and Population Structure

Most of the pair-wise relative kinship values (58.5%) were equal or close to 0 and only 19.3% of the pairs were above 0.05 (Figure 3A), indicating a distant relationship and little redundancy on allele compositions among most of the inbred lines. Identity-by-state (IBS)-based genetic distance between pair of inbred lines varied from 0.07 to 0.36 with an overall average of 0.28 (Table S2). Most pairs of lines (69.0%) differed by 20–30% (Figure 3B), followed by 30–40% of the scored alleles (29.3% of the pairs). Only 1.7% of the pairs of lines differed by <20% of the scored alleles, which suggests greater genetic variation even among sister lines that shared common parentage. However, some of the inbred lines such as DQL 609-5, CM 133, and CML 220-1 were found highly heterogenous (up to 43.8%),with an overall average of 17% for all 384 lines (Table S1, Figure 4).
The neighbor-joining phylogenetic trees revealed four major clusters that consisted of 90, 89, 129, and 76 lines (Figure 5A, Table S1). The 62 CIMMYT lines were assigned into the first group (8 lines), second group (4 lines), third group (45), and fourth group (5 lines). A plot of the first three axes from principal component analysis (PCA) revealed three major groups corresponding to the second group, fourth group, and a mix of both the first and third groups (Figure 5B).To understand the patterns of relationship among inbred lines in the phylogenetic trees and PCA, we constructed multiple plots using seven categorical variables (group membership from STRUCTURE, germplasm origin, types of corn, kernel color, maturity group, plant height group, and ear height placement). We did not find clear patterns by any of the categorical variables (Figure S1). However, the grouping was observed partially based on the source germplasm from where the lines were derived.
The model-based population structure analysis conducted using 60,227 SNPs showed the highest ΔK peak at K = 6 (Figure S2), which suggests the presence of six sub-populations (Figure 6, Table S4). Inbred lines with a membership probability of ≥0.50 were assigned into the same group, while those with <0.50 were designated as a mixed group. Of the 384 inbred lines, 227 of them (59.1%) were assigned into one of the six groups and the remaining 155 lines (40.36%) were assigned into a mixed group. Each group consisted of between 8 and 128 inbred lines. The first group (G1) consisted of 9 lines that originated from ICAR-IIMR Ludhiana of which eight were sister lines derived from a cross DML 51 × DML 4-2-2 (Table S1). Similarly, G3 and G5 consisted of 8 and 17 lines originating from ICAR-IIMR Ludhiana, which were derived primarily from Brasil 117 × ESM 113 and AMH 3436 respectively. G2 consisted of22 lines originating from six centers, while G4 had 45 lines from seven centers, including lines derived from Brasil 117 × ESM 113 (8 lines) and CML 269 × HKI 4 C 4B-1 (7 lines). G6 consisted of 128 lines originating from 18 centers of which 64 were developed by the ICAR-IIMR Ludhiana center. Half of the CIMMYT lines were assigned into a mixed group and the remaining were assigned into G2 (4 lines), G4 (3 lines), and G6 (24 lines).

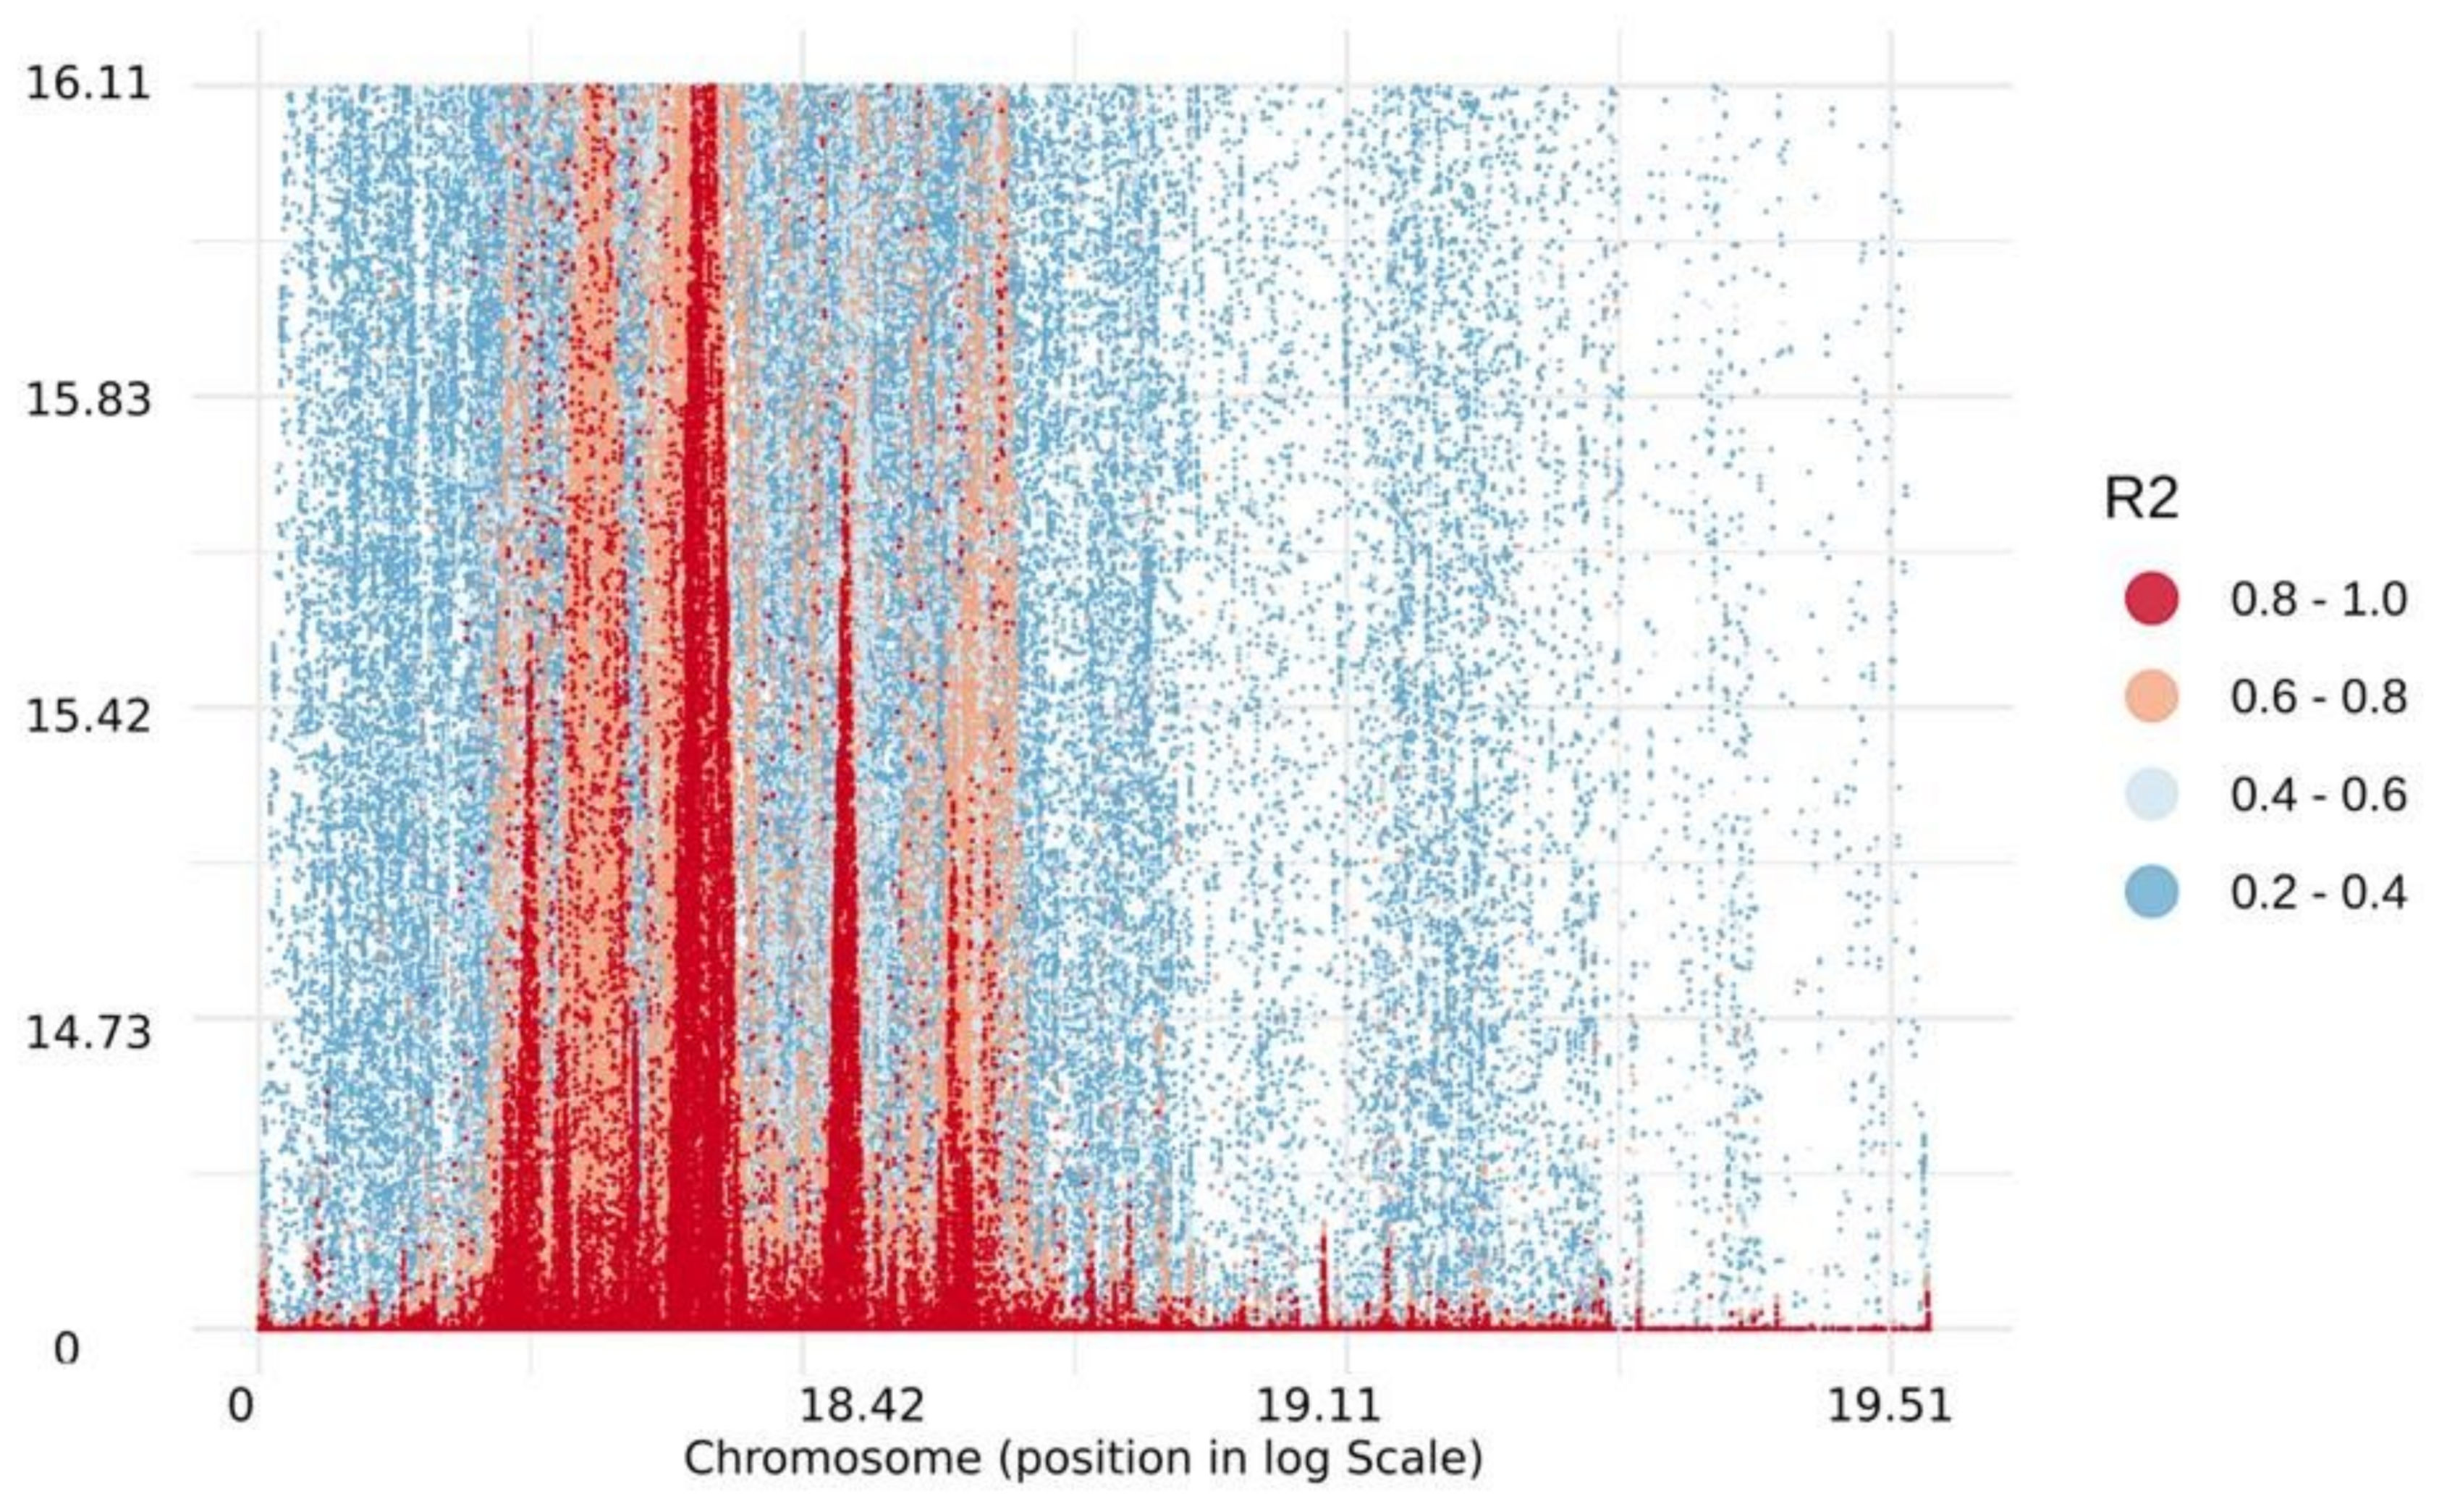
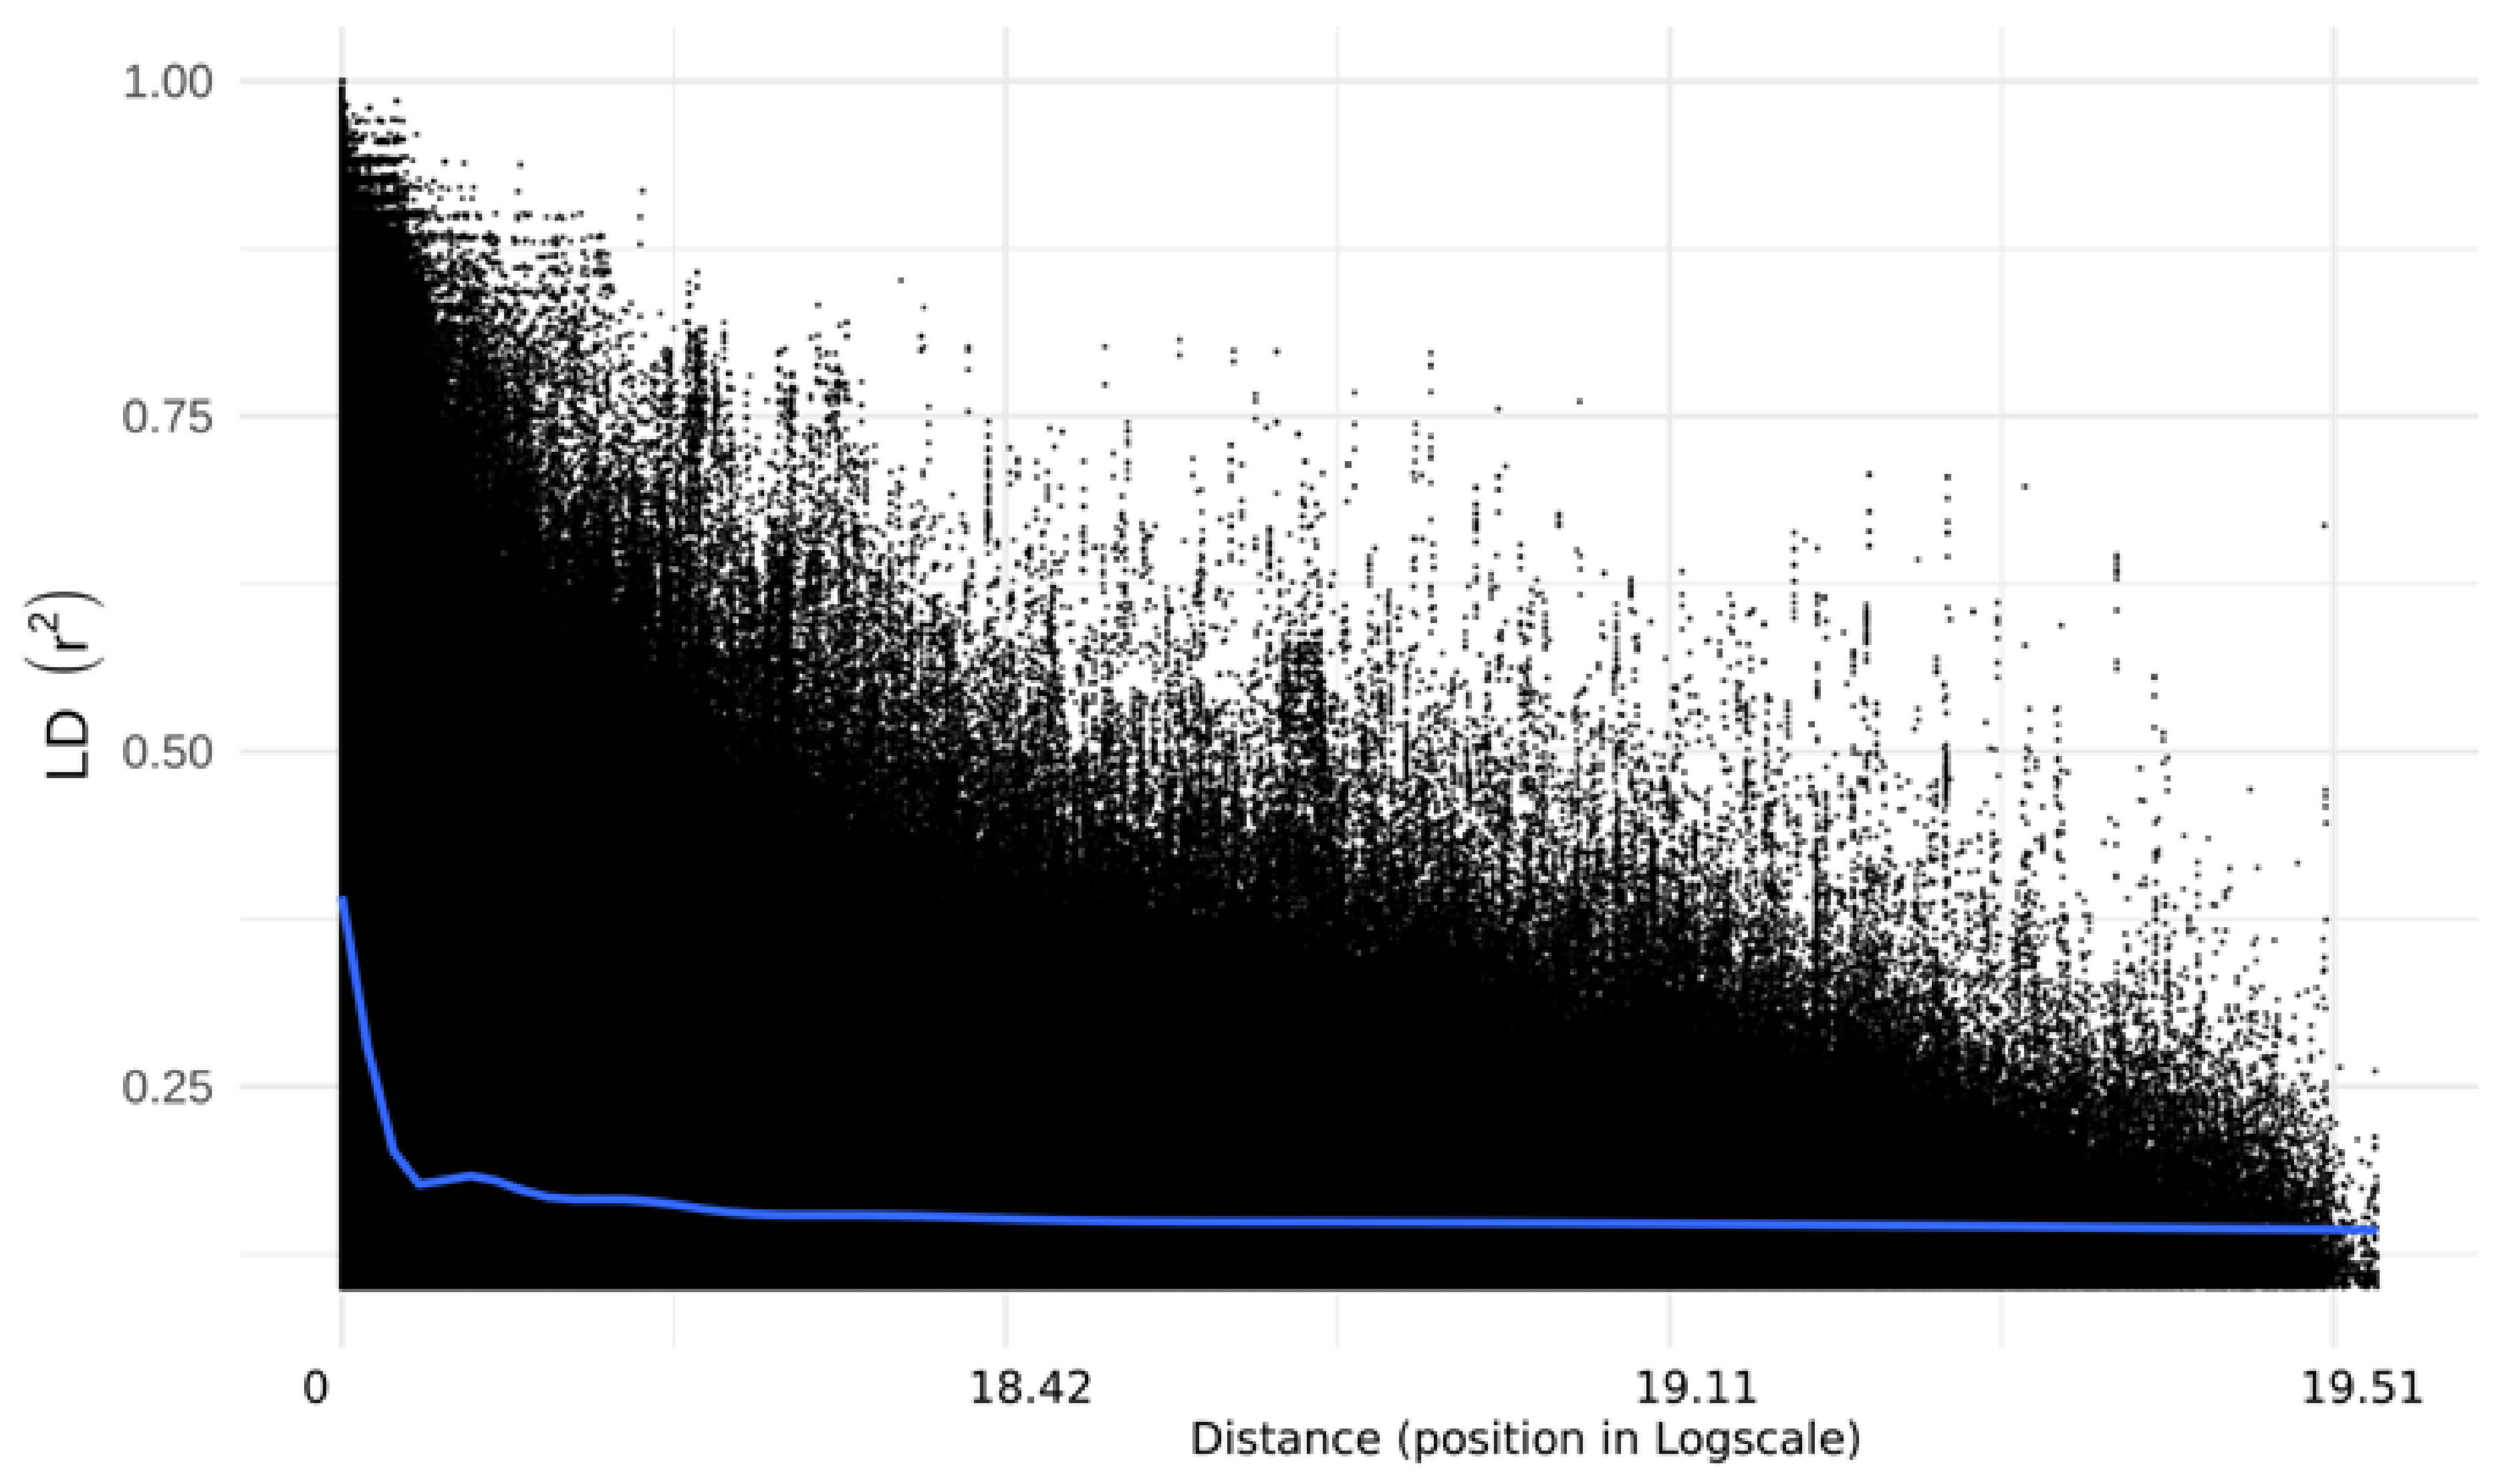
2.3. Linkage Disequilibrium and Haplotype Blocks Distribution

LD (r2) values computed from 60,277 polymorphic SNPs ranged from 0 to 1. The distribution pattern of LD values between pairs of SNPs ranging from 0.2 to 1.0 is given in Figure 7. The pairwise mean values of r2 decreased rapidly with increasing physical distance (Figure 8). The decline in mean LD values was observed at a physical distance of ≥10.0 kb. The chromosome-wise mean r2 values computed across the genome at various physical distance intervals have been given in Table S5. The overall mean value of LD at <0.1 kb was 0.69, which declined to 0.49 at 10.0–100.0 kb interval. It further declined to 0.40, 0.32 and 0.14 at 100–1000 kb, 1000–5000 kb and >100,000 kb, respectively. The chromosome wise mean LD values at various distance intervals ranged from r2 = 0.14 (at distance >100,000 kb on Chr-9) to 0.75 (0.2–0.3 kb on Chr-10). The highest mean LD was observed on Chr-3 (0.52) and minimum on Chr-2 (0.42). The overall mean LD value across the genome was 0.46.
Haplotype block distribution analyses based on LD estimated across the 384 maize lines genotyped with 60,227 SNP detected a total of 10,200 conserved haplotype blocks spanning 2057.32 Mb across all chromosomes. Among total haplotype blocks, 79.4% were of size ranges from 0 to 1 kb, 2.70% were of >100 kb and the remaining were 1 kb and 100 kb. Chromosome-wise haplotype blocks ranged from 285 on Chr-10 to 1556 on Chr-1, with an average of 1020 blocks per chromosome (Table 3). The total length of all haplotype blocks per chromosome varied from 880 (Chr-10) to 11,470 kb (Chr-3), with an average of 6898 kb. The 2.7% of the total haplotypes blocks across the chromosomes were extending from more than 100 kb size with a range of three haplotypes on Chr-10 to 45 on Chr-3. The total length of haplotypes with more than 100 kb size in different chromosomes varied from 473.3 kb on Chr-10 to 6800.9 on Chr-3 with an average of 4016.4 kb across the chromosomes. The maximum haplotype block length was observed on Chr-8 (199.99 kb) and the minimum on Chr-10 (180.03 kb).

3. Discussion

3.1. Genetic Diversity and Population Structure

Overall, the polymorphic SNPs used in the present study were uniformly distributed across the maize genome, which provides a better estimate of diversity in the panel. The average physical distance between pairs of SNPs across the genome was 34.2 kb, which indicates good coverage of the whole genome. The high polymorphic information content, frequency of polymorphic site per base pair, and mean nucleotide diversity all suggest the presence of high genetic variation in the panel [30,31,32]. The minor allele frequency (MAF) (Figure 1) showed a skew distribution with 51% of loci displaying a MAF between 0.05 and 0.15, which is expected in germplasm that have gone through intensive artificial selection. Selection introduces new sources of genetic variation that increase fitness under stress conditions, but the selected individuals or loci have very low to low initial frequencies [10].
Relative kinship is important to understand the extent of relatedness between pairs of lines with kinship values close to 0 among pairs of unrelated lines, <0.25 for half-sib, 0.5–1.0 for full-sib, and >1.0 highly similar lines [33]. In the present study, the pairwise relative kinship values for 58.5% of the inbred lines were either equal or close to 0, which suggests a lower level of relatedness and lack of redundancy in the genomic compositions of most inbred lines (Figure 3A). Our results are similar to Shu et al. [8] who also reported >66% of pairs of maize inbred lines that showed a kinship coefficient near zero. The lack of redundancy in the genomic composition among inbred lines is also evident from the high genetic distance observed among pairs of most inbred lines (Figure 3B, Table S2).
Genetic purity (homogeneity) in inbred lines is very important in maize breeding because it directly affects the ability of the line to be used as a parent in new line development and hybrid formation. In the current study, overall average of 17% heterogeneity was observed in the panel which is relatively high. It emphasizes the purification of heterogeneous lines either by ear to row selection or re-selection from the original seeds lots of the line. Relatively normal field corn genotypes of ICAR-IIMR Ludhiana and CIMMYT were showing low heterogeneity as compared to the lines from the centers and quality protein maize lines of the IIMR.Most of the IIMR quality protein lines are still in the advanced stage of development (S4–S6 generations). However, the percent heterogeneity of CIMMYT lines was higher than reported before [34]. We suspected either pollen contamination or seed admixture during seed maintenance breeding.Our results on the high proportion of heterogeneity agree with a previous study by Ertiro [15], who studied 265 maize inbred lines from CIMMYT, the Ethiopian Institute of Agricultural Research (EIAR), and the International Institute of Tropical Agriculture (IITA) using 220,878 polymorphic SNPs. The authors considered about 22% of the 265 inbred lines as genetically pure (homogenous); the remaining 27% and 51% of the lines had a heterogeneity ranging from 5.1 to 12.4% and from 12.5 to 31.5%, respectively.
Our analysis using phylogenetic analysis (Figure 5A), PCA (Figure 5B), and the model-based population structure (Figure 6) suggest the presence of three to six possible groups. However, we did not find clear clustering patterns by the centers that developed the lines, type of corn, grain characteristics, and agronomic traits (maturity groups, plant height groups, etc.). Earlier Boakyewaa et al. [30] and Xie et al. [35] reported three groups each, and Vigouroux et al. [36] reported four in a set of 94, 90, and 350 maize genotypes, respectively. Most CIMMYT lines tend to cluster together, but there was no obvious differentiation between lines developed by CIMMYT and those by the National programs in India, which is expected due to the continual exchange of germplasm among breeders. As expected, however, inbred lines derived from the same cross or related source germplasm (pedigree) tend to cluster together.

3.2. Linkage Disequilibrium and Distribution of Haplotype Blocks

Population size and the number of markers play a significant role in LD values: the lesser the numbers of markers the larger would be the LD values [37]. Our interest here is to understand whether the 60,227 SNPs and the 384 inbred lines are optimal for GWAS. We observed a good range of LD (0 to 1) across the entire maize genome. The overall mean values of LD (r2) reported in the literature at different physical intervals varied from 0.14 to 0.75, which may be due to differences in population size and the number of markers [37,38,39]. In the present study, we observed a rapidly declining trend in mean LD with an increase in the physical distance at 10 kb or greater in the genome, which agrees with various previous studies in maize [37,38,39]. Since maize is a highly cross-pollinated and diverse species, a rapid decay in LD is expected. In the self-pollinated crops, however, it can prolong to a longer distance due to their minimum outcrossing rate [33,40].
The identification of haplotype blocks in the genome can further improve the power of QTL detection in an association mapping panel. Haplotype blocks of long-length sequences that possess more polymorphic SNPs tend to harvest large diversity among the genotypes. In this study, we observed different sizes and numbers of haplotype blocks across the chromosomes that consisted of variable numbers of SNPs. On Chr-3, for example, we observed the highest total blocks length and relatively more numbers of blocks and SNPs. Simultaneously, the overall mean LD value across the physical distances was also highest on this chromosome. LD, haplotype blocks, SNPs numbers, and diversity in the genome are interrelated and are important for GWAS study. Rather than studying the whole genome, it is advisable to first examine for a preliminary association using a panel carrying more haplotype blocks. Once a specific region gets detected, then small haplotype blocks in the same regions can be explored further for fine mapping. These findings on LD and haplotype blocks suggest that the current panel of 384 inbred lines has sufficient genetic variability for all parameters and therefore can be considered for GWAS.

4. Materials and Methods

4.1. Plant Material and DNA Isolation

The present study used an association mapping panel of 384 diverse tropical maize inbred lines from CIMMYT (62), and seventeen maize research institutes/centers in India (322). The panel consisted of different types of corns, viz., normal field corn (281), quality protein maize (95), popcorn (6), and sweet corn (2) with different kernel colors (yellow, white, orange, and dark orange), maturity groups (early, medium and late), plant height (short, medium and long), and ear placement (low, medium and high) (Table S1). The highest number of samples was 260 lines (183 field corn, 74 QPM, and 3 popcorn lines) from ICAR-IIMR, Ludhiana. Genomic DNA was extracted from 2–3 gm fresh leaf tissues using Gen Elute Plant Genomic DNA Miniprep Kit (Sigma Aldrich, St. Louis, MO, USA). Each inbred line was represented by a bulk of five randomly selected individuals. The DNA was quantified with Qubit (Thermo fFsher Inc., Waltham, MA, USA) and was normalized to 100 ng/uL for GBS library preparation, Illumina genome sequencing, and SNPs discovery.

4.2. Library Preparation and Genotyping

GBS Libraries were prepared by digesting 0.5 μg genomic DNA of each of the lines with ApeKI (New England Biolabs, Ipswitch, MA, USA) restriction endonuclease enzyme as described in previous studies [8,10]. Briefly, each sample was digested for 4 h at 75 °C followed by ligation with barcoded adapters having the complementarily sticky ends to the digested DNA. The Qubit® 2.0 fluorometer was used to determine the concentration of the library, which was then diluted to a concentration of 1 ng/uL. Libraries with an appropriate insert of 328 bases and an effective concentration of more than 2 nM were used for sequencing. The sequencing was done using Illumina TrueSeq v3.0 pair-end sequencing with read lengths of 151 bp on HiSeq×10 Platform. Ninety-five samples (plus a blank negative control) were sequenced in one lane. The reversible terminator-based method was followed that enables the detection of a single base when they were incorporated in growing DNA strands.
The sequencing generated a total of ~17.58 million raw reads, which were saved into FASTQ files.Quality control steps were followed to filter the raw data set by removing reads with a quality score of <20reads, by checking for the perfectly matched barcode with the expected four base remnants of the enzyme cut site, minor allele frequencies. Reads with minimum quality control (Q) score of 20 were considered for further analysis. These reads were sorted and de-multiplexed according to their barcode. The filtered sequences from each genotype were aligned to the maize reference genome using the Burrows-Wheeler alignment tool (BWA) [41] for SNPs identification. Subsequent processing, such as duplicate removal was performed using PICARD, (https://sourceforge.net/projects/picard/files/picard-tools/1.48/, accessed on 8 March 2022), [42]. FreeBayes [43] was used to identify genetic variants. The raw SNPs were then filtered using VCFtools using a maximum number of alleles of 2 and minimum coverage of 3. The SNPs were finally filtered using a minor allele frequency of 0.05 and missing data of ≤20% missing data were retained for further analysis, which resulted in a total of 60,227 polymorphic SNPs for all subsequent data analyses.

4.3. Data Analysis

The population structure was determined using the model-based STRUCTURE v.2.3.4 software (https://web.stanford.edu/group/pritchardlab/structure_software/release_versions/v2.3.4/html/structure.html, accessed on 8 March 2022) using K values ranging from 2 to 9, three independent runs at 150,000 Markov Chain Monte Carlo (MCMC) iterations, and 100,000 burn-in periods. Genotypes with membership probability values of ≥0.50 were assigned to the same group, while those with ≤0.50 probability were treated as mixed [44,45]. The optimal number of sub-populations in the panel was decided using the ΔK curve with maximum likelihood value (ln Pr (X|K)) for the run. Relative kinship and identity by state-based genetic distance between a pair of inbred lines, and principal component analysis (PCA) were done using TASSEL v5.2.80 (https://www.maizegenetics.net/tassel, accessed on 8 March 2022). The genetic distance matrix was used to construct a neighbor-joining phylogenetic tree in TASSEL. The Newick file from TASSEL was visualized using interactive Tree Of Life (iTOL) [46] (https://itol.embl.de/, accessed on 8 March 2022). The first three principal components from PCA were plotted using R platform. We used seven categorical variables in the PCA and phylogenetic trees, which included the research centers that developed the inbred lines, group membership from population structure analysis, type of corn, kernel color, maturity group, plant height, and ear height placement.
The linkage disequilibrium (LD) analysis was carried out using three data sets in Tomahawk software (https://mklarqvist.github.io/tomahawk/, accessed on 8 March 2022). The first data set consisted of all the 60,227 polymorphic SNPs, each with a minor allele frequency of 0.05. We then created two additional data sets by further filtering the SNPs using a minor allele frequency of 0.10 and 0.20. The LD values were computed by calculating pairwise squared allele-frequency correlations (r2) between the SNPs in the genome [47]. The LD values were estimated for different intervals ranging from 0.0–0.0001 Mb to 10–100 Mb on the various chromosomes. The SNPs positions in the genome were then used to study the LD decay for each chromosome and across the entire genome [48,49]. The distribution of haplotype blocks on various chromosomes was studied using the TASSEL v. 5.2 package (https://www.maizegenetics.net/tassel, accessed on 8 March 2022).

5. Conclusions

This study investigated the genetic diversity, relationship, population structure, and LD in a panel of 384 maize inbred lines using 60,277 polymorphic SNPs. Our study revealed the presence of large genetic variation among the inbred lines and no clear grouping among categorical variables. The inbred lines grouped partially on the basis of their pedigree. The presence of relatively high heterogeneous lines in the panel required special attention of the breeder for their purification depending on the purpose of the breeding program and the intended use of the inbred lines.The germplasm characterized in the current study is an important resource for breeding and genomics studies in India. The high-density genotype data and results presented in this study would be very useful for different purposes, including parental selection for new breeding programs, heterotic grouping, and genome-wide association studies.

Supplementary Materials

The following supporting information can be downloaded at: https://www.mdpi.com/article/10.3390/plants11060799/s1, Table S1: Details on pedigree, population structure, clustering behavior, percent heterogeneity, and important morphological features of 384 inbred lines of association mapping panel genotyped using 60,227 polymorphic SNPs. Table S2: Pair-wise distance matrix used for construction of phylogenetic trees. Table S3: Pair-wise relative kinship matrix of 384 inbred lines derived from genotypic data of 60,277 polymorphic SNPs. Table S4: Membership probability at K = 6 of 384 inbred lines based on 60,227 polymorphic SNPs. The details on the genotype code are given in Table S2. Table S5: Mean LD (r2) values across the ten maize chromosomes at different physical distances. Figure S1: Different phylogenetic trees (a) and PCA plots (b) for 384 lines genotyped using 60,277 SNPs and represented based on seven variables such as center, population structure, types of corn, kernel colour, maturity group, plant height and ear height placement. Figure S2: A lot of ad hoc statistics ΔK computed from changes of LnP(D) between K = 2 to K = 9. The highest peak at K = 6 suggests six sub-populations (groups) in the panel.

Author Contributions

Conceptualization, B.K., S.R., F.H. and N.N.C.; data processing and formal analyses, B.K., K.K., P.K., M.C., S.K., B.K.S., C.L. and A.K.J.; writing—original draft, B.K. and S.R.; review & editing, S.R., F.H., K.K., M.C., P.K., S.B.S., J.J.A., B.P., R.K. and M.C.K.; funding acquisition, B.K. and S.R.; overall investigation, S.R., B.K. and S.B.S. All authors have read and agreed to the published version of the manuscript.

Funding

This research was funded by [DST & ICAR] grant number [ECR/2017/002638 & 1007436] and The APC was funded by [CRP Biofortification project code: 1007436].

Institutional Review Board Statement

Not applicable.

Informed Consent Statement

Not applicable.

Data Availability Statement

The raw data is available with the first author for any further information/queries. Besides, part of it has been submitted with the manuscript as Tables S1–S5.

Acknowledgments

The authors are most grateful to ICAR and DST-SERB for financial support under CRP and ECR award projects schemes, respectively. The role and contribution of partners of the All India Coordinated Research Project on Maize and CIMMYT for sharing the lines to constitute a diverse association panel in tropical maize are sincerely acknowledged.

Conflicts of Interest

The authors declare no conflict of interest.

References

  1. Harvey, M.; Pilgrim, S. The new competition for land: Food, energy, and climate change. Food Policy 2011, 36, 40–51. [Google Scholar] [CrossRef]
  2. Dass, S.; Kumar, A.; Jat, S.L.; Parihar, C.M.; Singh, A.K.; Chikkappa, G.K.; Jat, M.L. Maize holds potential for diversification and livelihood security. Indian J. Agron. 2012, 57, 32–37. [Google Scholar]
  3. Ranum, P.; Peña-Rosas, J.P.; Garcia-Casal, M.N. Global maize production, utilization, and consumption. Ann. N. Y. Acad. Sci. 2014, 1312, 105–112. [Google Scholar] [CrossRef] [PubMed]
  4. Duo, H.; Hossain, F.; Muthusamy, V.; Zunjare, R.U.; Goswami, R.; Chand, G. Development of sub-tropically adapted diverse provitamin-A rich maize inbreds through marker assisted pedigree selection, their characterization and utilization in hybrid breeding. PLoS ONE 2021, 16, e0245497. [Google Scholar] [CrossRef]
  5. Murdia, L.K.; Wadhwani, R.; Wadhawan, N.; Bajpai, P.; Shekhawat, S. Maize utilization in India: An overview. Am. J. Food Nutr. 2016, 4, 169–176. [Google Scholar]
  6. Tewodros, M.; Mohammed, A. Heterotic response in major cereals and vegetable crops. Int. J. Plant Breed. Genet. 2016, 10, 69–78. [Google Scholar]
  7. Srivastava, K.R.; Bollam, S.; Pujarula, V.; Pusuluri, M.; Singh, R.B.; Potupureddi, G.; Gupta, R. Exploitation of heterosis in pearl millet: A review. Plants 2020, 9, 807. [Google Scholar] [CrossRef]
  8. Shu, G.; Cao, G.; Li, N.; Wang, A.; Wei, F.; Li, T.; Yi, L.; Xu, Y.; Wang, Y. Genetic variation and population structure in China summer maize germplasm. Sci. Rep. 2021, 11, 8012. [Google Scholar] [CrossRef]
  9. Ahmar, S.; Gill, R.A.; Jung, K.H.; Faheem, A.; Qasim, M.U.; Mubeen, M.; Zhou, W. Conventional and Molecular Techniques from Simple Breeding to Speed Breeding in Crop Plants: Recent Advances and Future Outlook. Int. J. Mol. Sci. 2020, 21, 2590. [Google Scholar] [CrossRef] [Green Version]
  10. Elshire, R.J.; Glaubitz, J.C.; Sun, Q.; Poland, J.A.; Kawamoto, K.; Buckler, E.S.; Mitchell, S.E. A robust, simple genotyping-by-sequencing (GBS) approach for high diversity species. PLoS ONE 2011, 6, e19379. [Google Scholar] [CrossRef] [PubMed] [Green Version]
  11. He, J.; Zhao, X.; Laroche, A.; Lu, Z.X.; Liu, H.; Li, Z. Genotyping-by-sequencing (GBS), An ultimate marker-assisted selection (MAS) tool to accelerate plant breeding. Front. Plant Sci. 2014, 5, 484. [Google Scholar] [CrossRef] [PubMed] [Green Version]
  12. Chung, Y.S.; Choi, S.C.; Jun, T.H.; Kim, C. Genotyping-by-sequencing: A promising tool for plant genetics research and breeding. Hortic. Environ. Biotechnol. 2017, 58, 425–431. [Google Scholar] [CrossRef]
  13. Ertiro, B.T.; Ogugo, V.; Worku, M.; Das, B.; Olsen, M.; Labuschagne, M.; Semagn, K. Comparison of Kompetitive Allele Specific PCR (KASP) and genotyping by sequencing (GBS) for quality control analysis in maize. BMC Genom. 2015, 16, 908. [Google Scholar] [CrossRef] [PubMed] [Green Version]
  14. Wu, Y.; San Vicente, F.; Huang, K.; Dhliwayo, T.; Costich, D.E.; Semagn, K.; Sudha, N.; Olsen, M.; Prasanna, B.M.; Zhang, X.; et al. Molecular characterization of CIMMYT maize inbred lines with genotyping-by-sequencing SNPs. Theor. Appl. Genet. 2016, 129, 753–765. [Google Scholar] [CrossRef] [PubMed] [Green Version]
  15. Ertiro, B.T.; Semagn, K.; Das, B.; Olsen, M.; Labuschagne, M.; Worku, M.; Wegary, D.; Azmach, G.; Ogugo, V.; Keno, T.; et al. Genetic variation and population structure of maize inbred lines adapted to the mid-altitude sub-humid maize agro-ecology of Ethiopia using single nucleotide polymorphic (SNP) markers. BMC Genom. 2017, 18, 777. [Google Scholar] [CrossRef] [PubMed] [Green Version]
  16. Wegary, D.; Teklewold, A.; Prasanna, B.M.; Ertiro, B.T.; Alachiotis, N.; Negera, D.; Awas, G.; Abakemal, D.; Ogugo, V.; Gowda, M.; et al. Molecular diversity and selective sweeps in maize inbred lines adapted to African highlands. Sci. Rep. 2019, 9, 13490. [Google Scholar] [CrossRef] [PubMed] [Green Version]
  17. Gouesnard, B.; Negro, S.; Laffray, A.; Glaubitz, J.; Melchinger, A.; Revilla, P.; Moreno-Gonzalez, J.; Madur, D.; Combes, V.; Tollon-Cordet, C.; et al. Genotyping-by-sequencing highlights original diversity patterns within a European collection of 1191 maize flint lines, as compared to the maize USDA genebank. Theor. Appl. Genet. 2017, 130, 2165–2189. [Google Scholar] [CrossRef] [PubMed]
  18. Wasala, S.K.; Prasanna, B.M. Microsatellite marker-based diversity and population genetic analysis of selected lowland and mid-altitude maize landrace accessions of India. J. Plant Biochem. Biotechnol. 2013, 22, 392–400. [Google Scholar] [CrossRef]
  19. Sharma, L.; Prasanna, B.M.; Ramesh, B. Analysis of phenotypic and microsatellite-based diversity of maize landraces in India, especially from the North East Himalayan region. Genetica 2010, 138, 619–631. [Google Scholar] [CrossRef] [PubMed]
  20. Mahar, K.S.; Agrawal, P.K.; Babu, B.K.; Gupta, H.S. Assessment of genetic diversity among the elite maize (Zea mays L.) genotypes adapted to North-Western Himalayan region of India using microsatellite markers. J. Plant Biochem. Biotechnol. 2009, 18, 217–220. [Google Scholar] [CrossRef]
  21. Sathua, S.K.; Shahi, J.P.; Mahato, A.; Gayatonde, V.; Kumar, P. Molecular diversity analysis of maize (Zea mays L.) inbreds using SSR markers. Electron. J. Plant Breed. 2018, 9, 1122–1129. [Google Scholar] [CrossRef]
  22. Singode, A.; Prasanna, B.M. Analysis of genetic diversity in the North Eastern Himalayan Maize landraces using microsatellite markers. J. Plant Biochem. Biotechnol. 2010, 19, 33–41. [Google Scholar] [CrossRef]
  23. Mammadov, J.; Aggarwal, R.; Buyyarapu, R.; Kumpatla, S. SNP markers and their impact on plant breeding. Int. J. Plant Genom. 2012, 2012, 728398. [Google Scholar] [CrossRef]
  24. Prasanna, B.M. Diversity in global maize germplasm: Characterization and utilization. J. Biosci. 2012, 37, 843–855. [Google Scholar] [CrossRef]
  25. Hall, D.; Zhao, W.; Wennström, U.; Andersson Gull, B.; Wang, X.-R. Parentage and relatedness reconstruction in Pinus sylvestris using genotyping-by-sequencing. Heredity 2020, 124, 633–646. [Google Scholar] [CrossRef] [PubMed]
  26. Su, C.; Wang, W.; Gong, S.; Zuo, J.; Li, S.; Xu, S. High density linkage map construction and mapping of yield trait QTLs in maize (Zea mays) using the genotyping-by-sequencing (GBS) technology. Front. Plant Sci. 2017, 8, 706. [Google Scholar] [CrossRef] [PubMed] [Green Version]
  27. Rafalski, J.A. Association genetics in crop improvement. Curr. Opin. Plant Biol. 2010, 13, 174–180. [Google Scholar] [CrossRef] [PubMed]
  28. Slatkin, M. Linkage disequilibrium-understanding the evolutionary past and mapping the medical future. Nat. Rev. Genet. 2008, 9, 477–485. [Google Scholar] [CrossRef] [PubMed] [Green Version]
  29. Schnable, P.S.; Ware, D.; Fulton, R.S. The B73 Maize Genome: Complexity, Diversity, and Dynamics. Science 2012, 326, 1112–1115. [Google Scholar] [CrossRef] [Green Version]
  30. Boakyewaa Adu, G.; Badu-Apraku, B.; Akromah, R.; Garcia-Oliveira, A.L.; Awuku, F.J.; Gedil, M. Genetic diversity and population structure of early-maturing tropical maize inbred lines using SNP markers. PLoS ONE 2019, 14, e0214810. [Google Scholar] [CrossRef] [Green Version]
  31. Dao, A.; Sanou, J.; Mitchell, S.E.; Gracen, V.; Danquah, E.Y. Genetic diversity among INERA maize inbred lines with single nucleotide polymorphism (SNP) markers and their relationship with CIMMYT, IITA, and temperate lines. BMC Genet. 2014, 15, 127. [Google Scholar] [CrossRef] [PubMed] [Green Version]
  32. Senior, M.L.; Murphy, J.P.; Goodman, M.M.; Stuber, C.W. Utility of SSRs for determining genetic similarities an relationships in maize using an agarose gel system. Crop Sci. 1998, 38, 1088–1098. [Google Scholar] [CrossRef]
  33. Cui, C.; Mei, H.; Liu, Y.; Zhang, H.; Zheng, Y. Genetic diversity, population structure, and linkage disequilibrium of an association-mapping panel revealed by genome-wide SNP markers in sesame. Front. Plant Sci. 2017, 8, 1189. [Google Scholar] [CrossRef] [PubMed] [Green Version]
  34. Semagn, K.; Beyene, Y.; Makumbi, D.; Mugo, S.; Prasanna, B.M.; Magorokosho, C.; Atlin, G. Quality control genotyping for assessment of genetic identity and purity in diverse tropical maize inbred lines. Theor. Appl. Genet. 2012, 125, 1487–1501. [Google Scholar] [CrossRef]
  35. Xie, C.; Warburton, M.; Li, M.; Li, X.; Xiao, M.; Hao, Z.; Zhao, Q.; Zhang, S. Retracted Article: An analysis of population structure and linkage disequilibrium using multilocus data in 187 maize inbred lines. Mol. Breed. 2008, 21, 407–418. [Google Scholar] [CrossRef]
  36. Vigouroux, Y.; Glaubitz, J.C.; Matsuoka, Y.; Goodman, M.M.; Sánchez, G.J.; Doebley, J. Population structure and genetic diversity of New World maize races assessed by DNA microsatellites. Am. J. Bot. 2008, 95, 1240–1253. [Google Scholar] [CrossRef] [PubMed]
  37. Yan, J.; Shah, T.; Warburton, M.L.; Buckler, E.S.; McMullen, M.D.; Crouch, J. Genetic characterization and linkage disequilibrium estimation of a global maize collection using SNP markers. PLoS ONE 2009, 4, e8451. [Google Scholar] [CrossRef] [Green Version]
  38. Remington, D.L.; Thornsberry, J.M.; Matsuoka, Y.; Wilson, L.M.; Whitt, S.R.; Doebley, J.; Kresovich, S.; Goodman, M.M.; Buckler, E.S. Structure of linkage disequilibrium and phenotypic associations in the maize genome. Proc. Natl. Acad. Sci. USA 2001, 98, 11479–11484. [Google Scholar] [CrossRef] [Green Version]
  39. Shi, L.; Lv, X.; Weng, J.; Zhu, H.; Liu, C.; Hao, Z.; Zhou, Y.; Zhang, D.; Li, M.; Ci, X. Genetic characterization and linkage disequilibrium mapping of resistance to gray leaf spot in maize (Zea mays L.). Crop J. 2014, 2, 132–143. [Google Scholar] [CrossRef] [Green Version]
  40. Rakshit, S.; Rakshit, A.; Matsumura, H.; Takahashi, Y.; Hasegawa, Y.; Ito, A.; Ishii, T.; Miyashita, N.T.; Terauchi, R. Large-scale DNA polymorphism study of Oryza sativa and O. rufipogon reveals the origin and divergence of Asian rice. Theor. Appl. Genet. 2007, 114, 731–743. [Google Scholar] [CrossRef] [PubMed]
  41. Li, H.; Durbin, R. Fast and accurate short read alignment with Burrows–Wheeler transform. Bioinformatics 2009, 25, 1754–1760. [Google Scholar] [CrossRef] [PubMed] [Green Version]
  42. Ebbert, M.T.W.; Wadsworth, M.E.; Staley, L.A. Evaluating the necessity of PCR duplicate removal from next-generation sequencing data and a comparison of approaches. BMC Bioinform. 2016, 17, 239. [Google Scholar] [CrossRef] [PubMed] [Green Version]
  43. Garrison, E.; Marth, G. Haplotype-based variant detection from short-read sequencing. arXiv 2012, arXiv:1207.3907. [Google Scholar]
  44. Wu, X.; Li, Y.; Shi, Y.; Song, Y.; Wang, T.; Huang, Y.; Li, Y. Fine genetic characterization of elite maize germplasm using high-throughput SNP genotyping. Theor. Appl. Genet. 2014, 127, 621–631. [Google Scholar] [CrossRef] [PubMed]
  45. Leng, Y.; Lv, C.; Li, L.; Xiang, Y.; Xia, C.; Wei, R.; Rong, T.; Lan, H. Heterotic grouping based on genetic variation and population structure of maize inbred lines from current breeding program in Sichuan province, Southwest China using genotyping by sequencing (GBS). Mol. Breed. 2019, 39, 38. [Google Scholar] [CrossRef]
  46. Letunic, I.; Bork, P. Interactive tree of life (iTOL) v3: An online tool for the display and annotation of phylogenetic and other trees. Nucleic Acids Res. 2016, 44, W242–W245. [Google Scholar] [CrossRef]
  47. Weir, B.S. Genetic Data Analysis II; Sinauer Associates, Inc. Publishers: Sunderland, MA, USA, 1996. [Google Scholar]
  48. Otyama, P.I. Evaluation of linkage disequilibrium, population structure, and genetic diversity in the US peanut mini core collection. BMC Genom. 2019, 20, 481. [Google Scholar] [CrossRef]
  49. Bradbury, P.J.; Zhang, Z.; Kroon, D.E.; Casstevens, T.M.; Ramdoss, Y.; Buckler, E.S. TASSEL: Software for association mapping of complex traits in diverse samples. Bioinformatics 2007, 23, 633–2635. [Google Scholar] [CrossRef] [PubMed]
Figure 1. Frequency distribution of the 60,227 polymorphic SNPs by minor allele frequency.
Plants 11 00799 g001
Figure 2. Distribution of SNPs used in the study on ten maize chromosomes. The horizontal axis shows the physical distance with the different colors reflecting the SNP density distribution.
Plants 11 00799 g002
Figure 3. Summary of relative kinship and identity-by-state based genetic distance between pairs of the 384 inbred lines computed from 60,227 polymorphic SNPs. See Table S2 for genetic distance values and Table S3 for the pair-wise kinship between inbred lines.
Plants 11 00799 g003
Figure 4. Frequency distribution plot of the percentage of heterogeneity within each of the 384 inbred lines based on 60,227 polymorphic SNPs.
Plants 11 00799 g004
Figure 5. Neighbour-joining tree and multidimensional scaling (MDS) analysis of 384 maize inbred lines based on genetic distance matrix computed from 60,227 polymorphic SNP markers in TASSEL v 5.2. NJ tree (A) and MDS (B) were constructed using MEGA v11 and CurlyWhirly v1.21.08.16, respectively.
Plants 11 00799 g005
Figure 6. Population structure of 384 maize inbred lines based on 60,227 polymorphic SNPs at K = 6. Each inbred line is represented by a vertical line that is partitioned into K-colored segments, with lengths proportional to the estimated probability membership value (y-axis). The six groups are shown in different colors: G1 (Green), G2 (Pink), G3 (Yellow), G4 (Red), G5 (Blue), and G6 (Cyan). See Table S4 for details on group membership.
Plants 11 00799 g006
Figure 7. Distribution of linkage disequilibrium between individual SNPs pairs across the genome of 384 inbred lines genotyped with 60,277 SNPs. The horizontal and vertical axis representing the SNPs pairs and legend insert inside depicts the various classes of LD values ranging from 0.2 to 1.0.
Plants 11 00799 g007
Figure 8. Linkage disequilibrium decay curve based on 60,227 polymorphic SNPs in 384 maize inbred lines. The blue line indicates the general trend in LD decay.
Plants 11 00799 g008
Table 1. Chromosome-wise distribution of the polymorphic SNPs at different minor allele frequencies (MAF), physicalmapping length, and different loci based on 384 diverse maize inbred lines.
Chromosome (Chr.)Physical Map Length (Mb)Number of SNPs at MAF 0.05Number of LociSNPs at MAF (≥0.1)
Chr-1307.04897629066946
Chr-2244.44717322995377
Chr-3235.67740523535757
Chr-4246.99829326766270
Chr-5223.9682322705142
Chr-6174.03462415113523
Chr-7182.38605319834456
Chr-8181.12534517334134
Chr-9110.77336810802618
Chr-10150.98216712741325
Total2057.3260,22720,08545,548
Table 2. Summary of transition and transversion mutations detected among 384 maize genotypes.
ParameterValueType of MutationSNP MutationNumber of SNPsTotal SNPs per Type of Mutation
Number of SNPs60,227TransitionsA/G21,77543,701
Ts/Tv ratio2.64C/T21,926
Mean Nucleotide Diversity0.28TransversionsA/T443516,526
A/C4505
Frequency of polymorphic sites per bp0.02C/G2996
G/T4590
Proportion of heterogenous SNPs0.17Total60,22760,227
Table 3. The summary and distribution of haplotypes blocks on maize chromosomes.
Chr.Chr.
Length (Mb)
Hap.
Freq (%)
a NohbTotal Block Length
(kb)
b Nohbc Sum
(>100 kb)
d TSNPe Max (kb)f Max SNPsg Min SNPs
Chr1307.0430.8615569220334894.755614 (334)198.16282
Chr2244.4430.0111828740375385.364378 (342)199.69272
Chr3235.6730.40128211,470456800.934784 (384)199.28262
Chr4246.9930.8714329040334843.495184 (272)193.46192
Chr5223.9031.0811377160293978.954198 (276)196.90222
Chr6174.0330.977993410111577.282767 (133)193.12252
Chr7182.3830.0810659620436333.563888 (387)197.22302
Chr8181.1230.898766990304317.023420 (346)199.99232
Chr9110.7730.355863450101559.552122 (96)198.88182
Chr10150.9836.352858803473.303744 (13)180.0382
Mean205.7331.1910206998274016.423710195.67232
a The total number of haplotype blocks; b The number of haplotype blocks longer than 100 kb on each chromosome; c The total length of haplotype blocks longer than 100 kb for each chromosome; d The total number of SNPs in haplotype blocks and in longer than 100 kb blocks (in parenthesis); e Maximum size (in kb) of the haplotype block; f Max (SNPs) correspond to the maximum number of SNPs forming blocks; g Min (SNPs) correspond to the minimum number of SNPs forming blocks.
Publisher’s Note: MDPI stays neutral with regard to jurisdictional claims in published maps and institutional affiliations.

