
Epidemiological Estimate of Growth Reduction by Ozone in Fagus sylvatica L. and Picea abies Karst.: Sensitivity Analysis and Comparison with Experimental Results


Abstract
:1. Introduction
- To present a sensitivity analysis on the covariates for the epidemiological analysis of ozone effects on beech and Norway spruce.
- To compare observational data on adult trees with the experimental dose–response functions, using volume increment as the dependent variable. Volume increment allows a direct comparison to be made with the experiments, which are based on biomass.
2. Materials and Methods
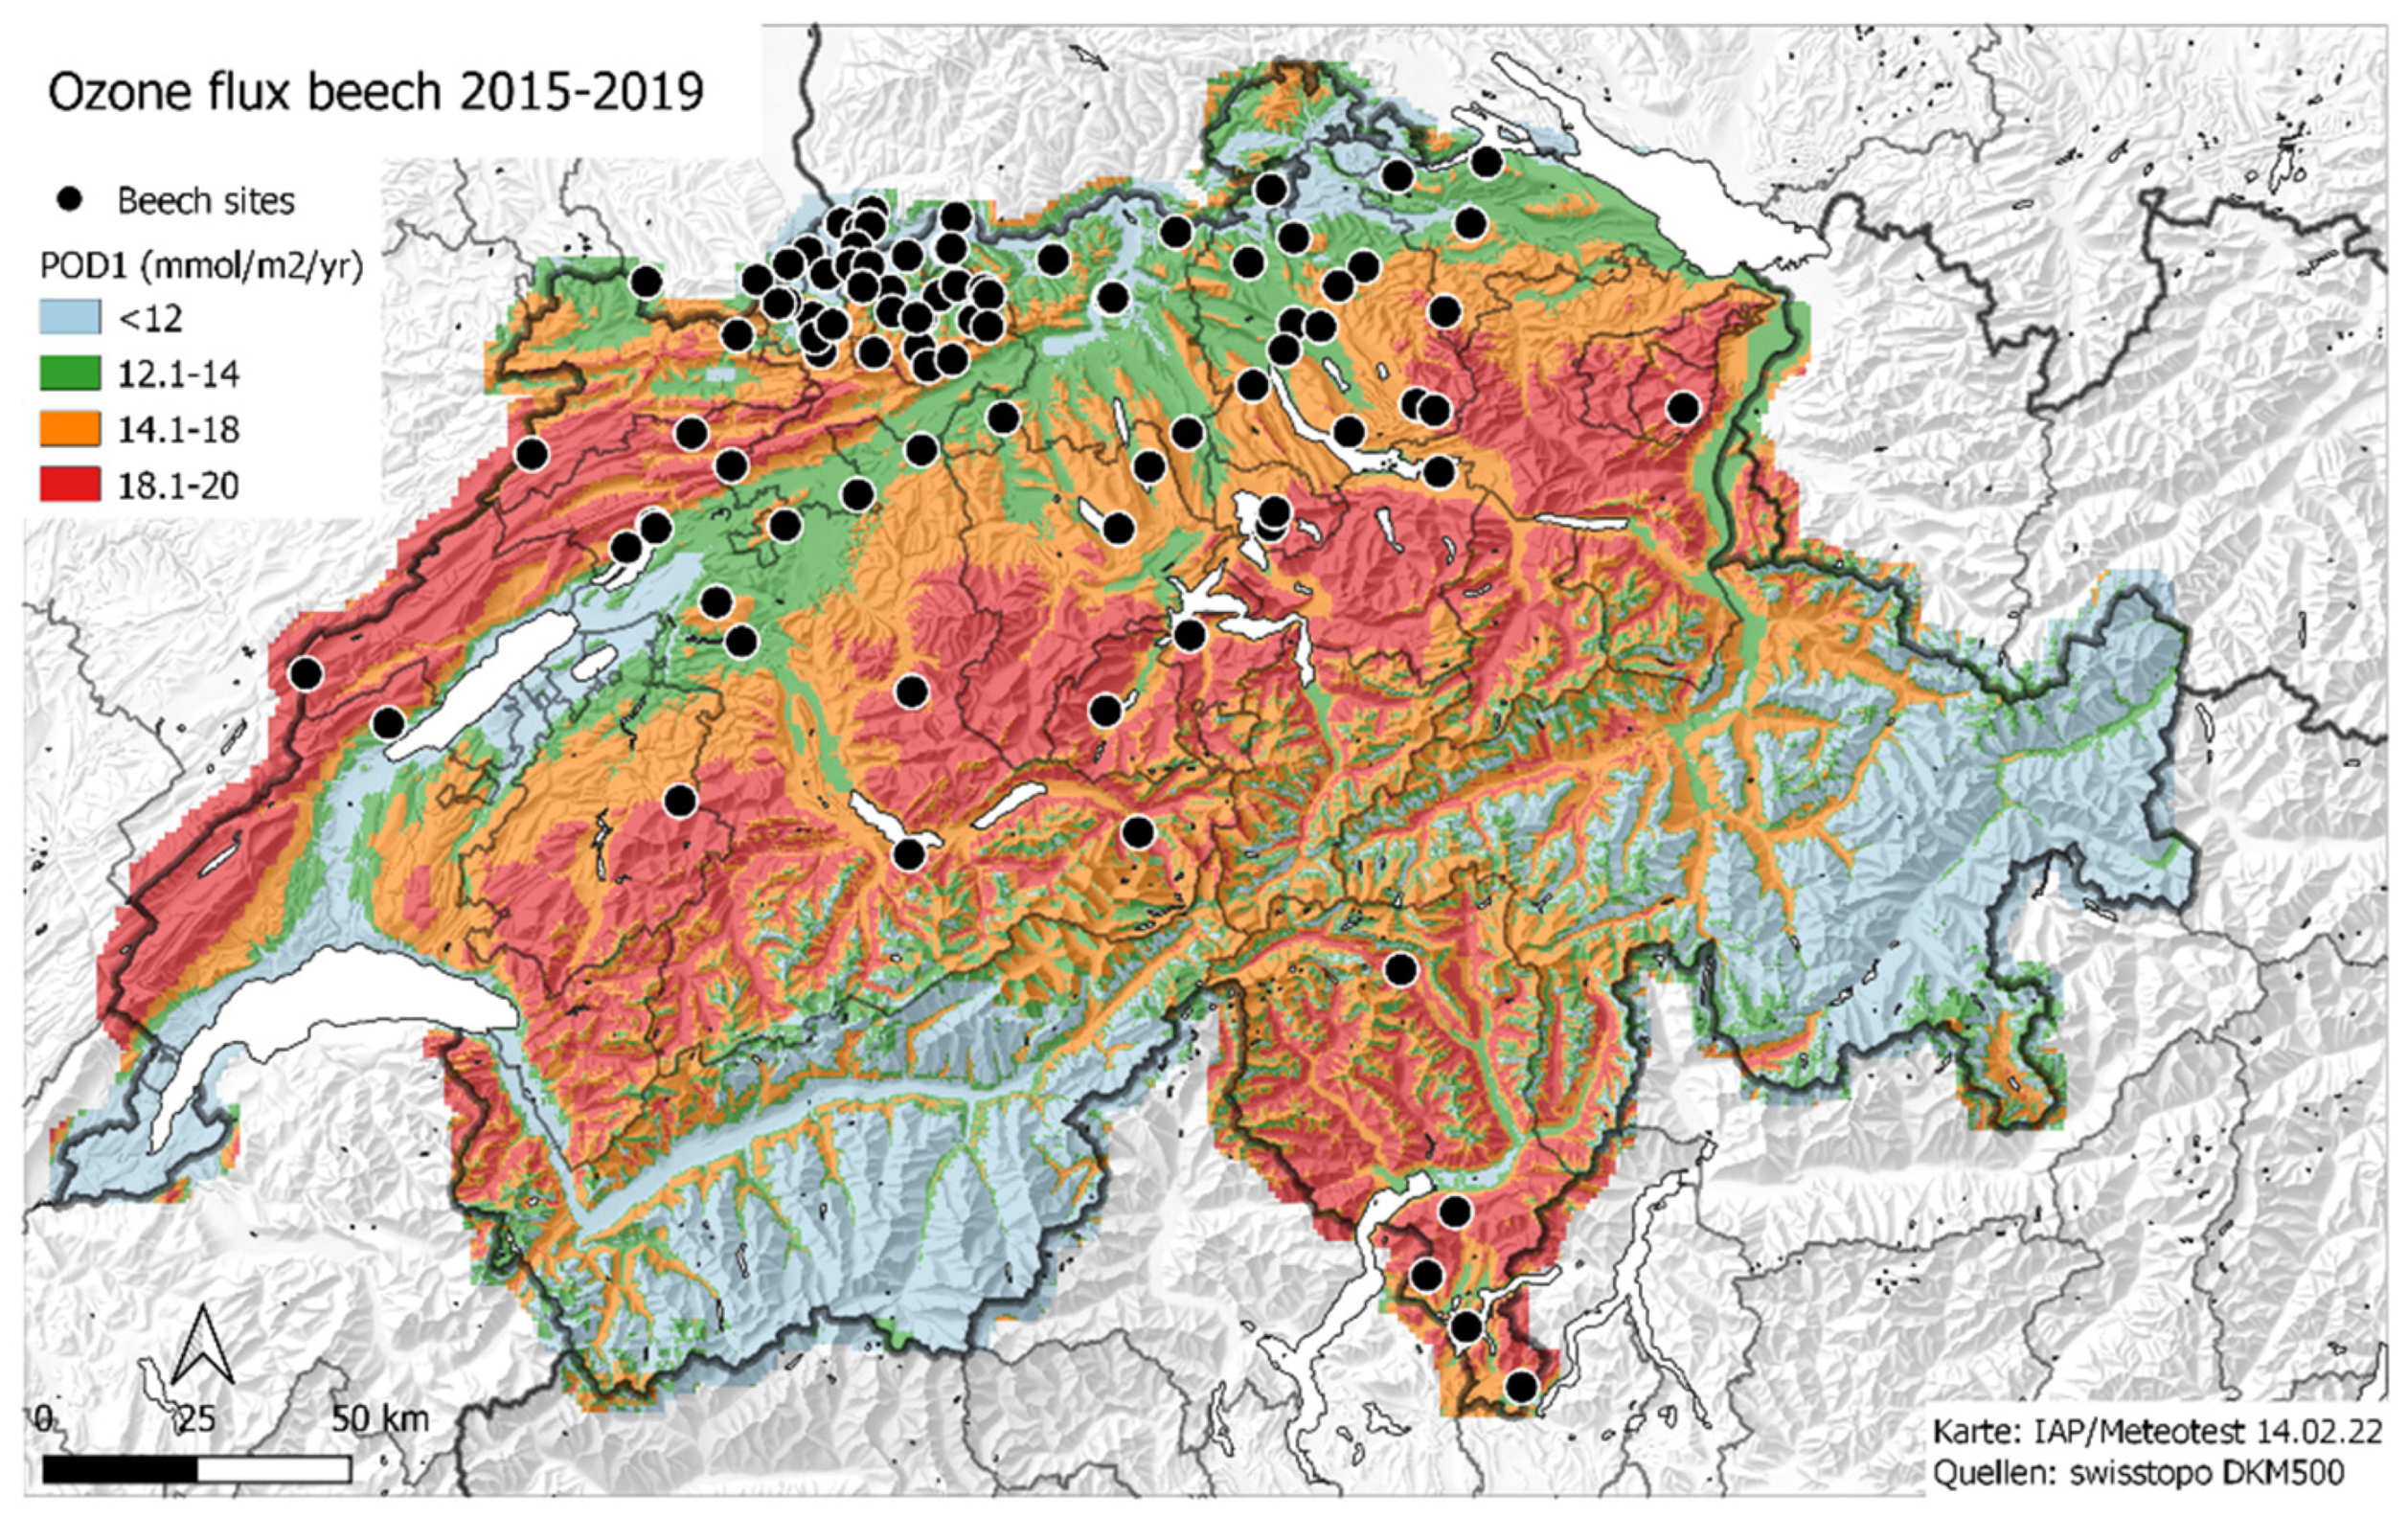
2.1. Plots
2.2. Tree Increment
2.3. Ozone Flux
2.4. Data Analysis
- Annual ozone flux (POD1); see Section 2.3.
- Nitrogen deposition: mapped total deposition in 1 ha spatial resolution, see [22].
- Drought: Various drought indicators were tested [23]. The best drought indicator for beech was the ratio between actual and potential evapotranspiration, averaged between 5 days before and 80 days after budbreak. For Norway spruce, it was the minimum site water balance per year.
- Age: Stand age in years (baseline at the start of the time series). This was kept constant during the time series, as recommended for cohort studies [24].
- Stand density index according to [25].
- Tree diameter at the beginning of the increment period.
- Crown size (crown projection area).
- Social position (dominant, codominant or suppressed) and position within the stand (stand and edge/gap).
- Fructification: number of fruits per short shoot (beech), analysed retrospectively from shoots collected for foliar analysis.
- Proportion of deciduous trees in the stand.
- Foliar concentrations of Ca, P and K [26].
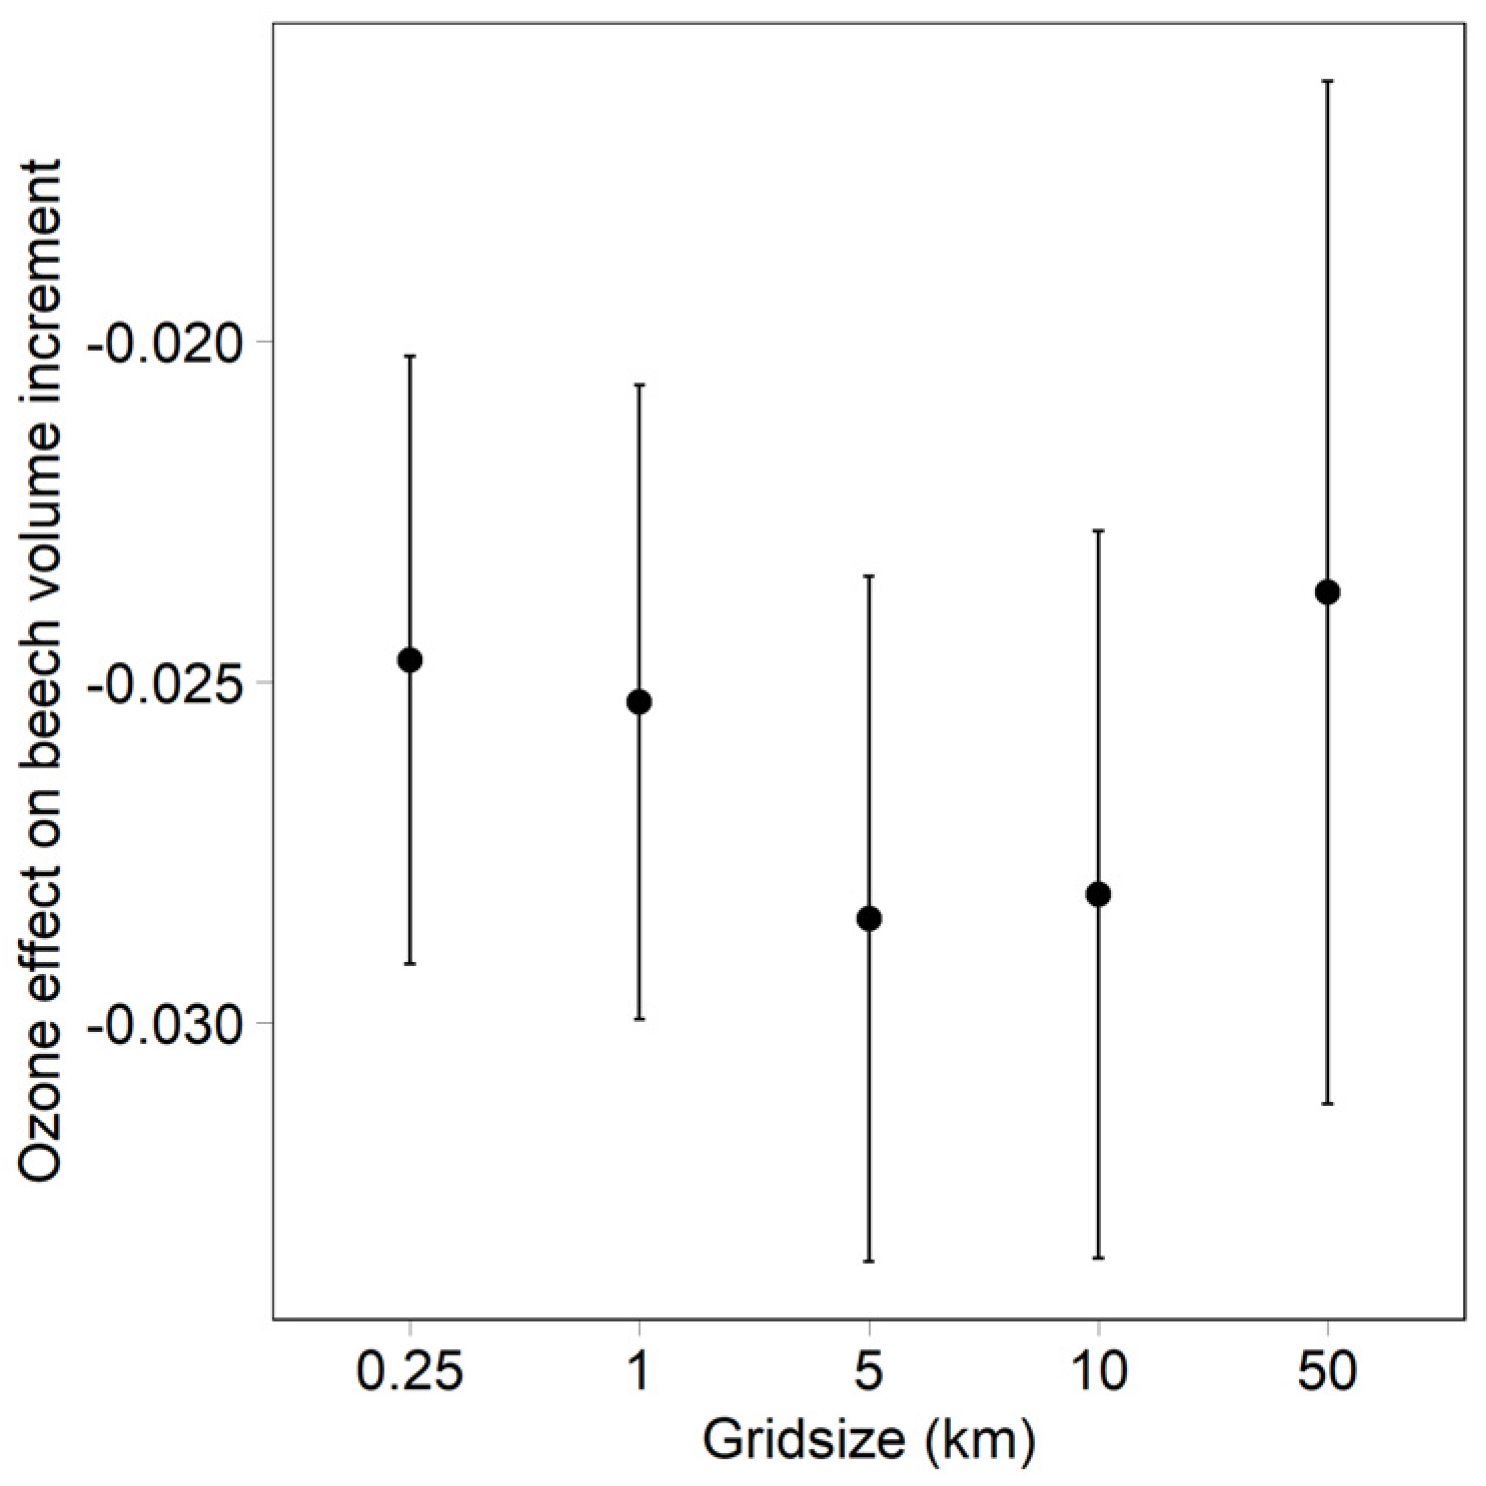
- Dependency of the ozone effect on the ozone model grid size (beech data set). Ozone was calculated as modelled (grid size 0.25 km), and averaged over grid sizes of 1, 5, 10 and 50 km.
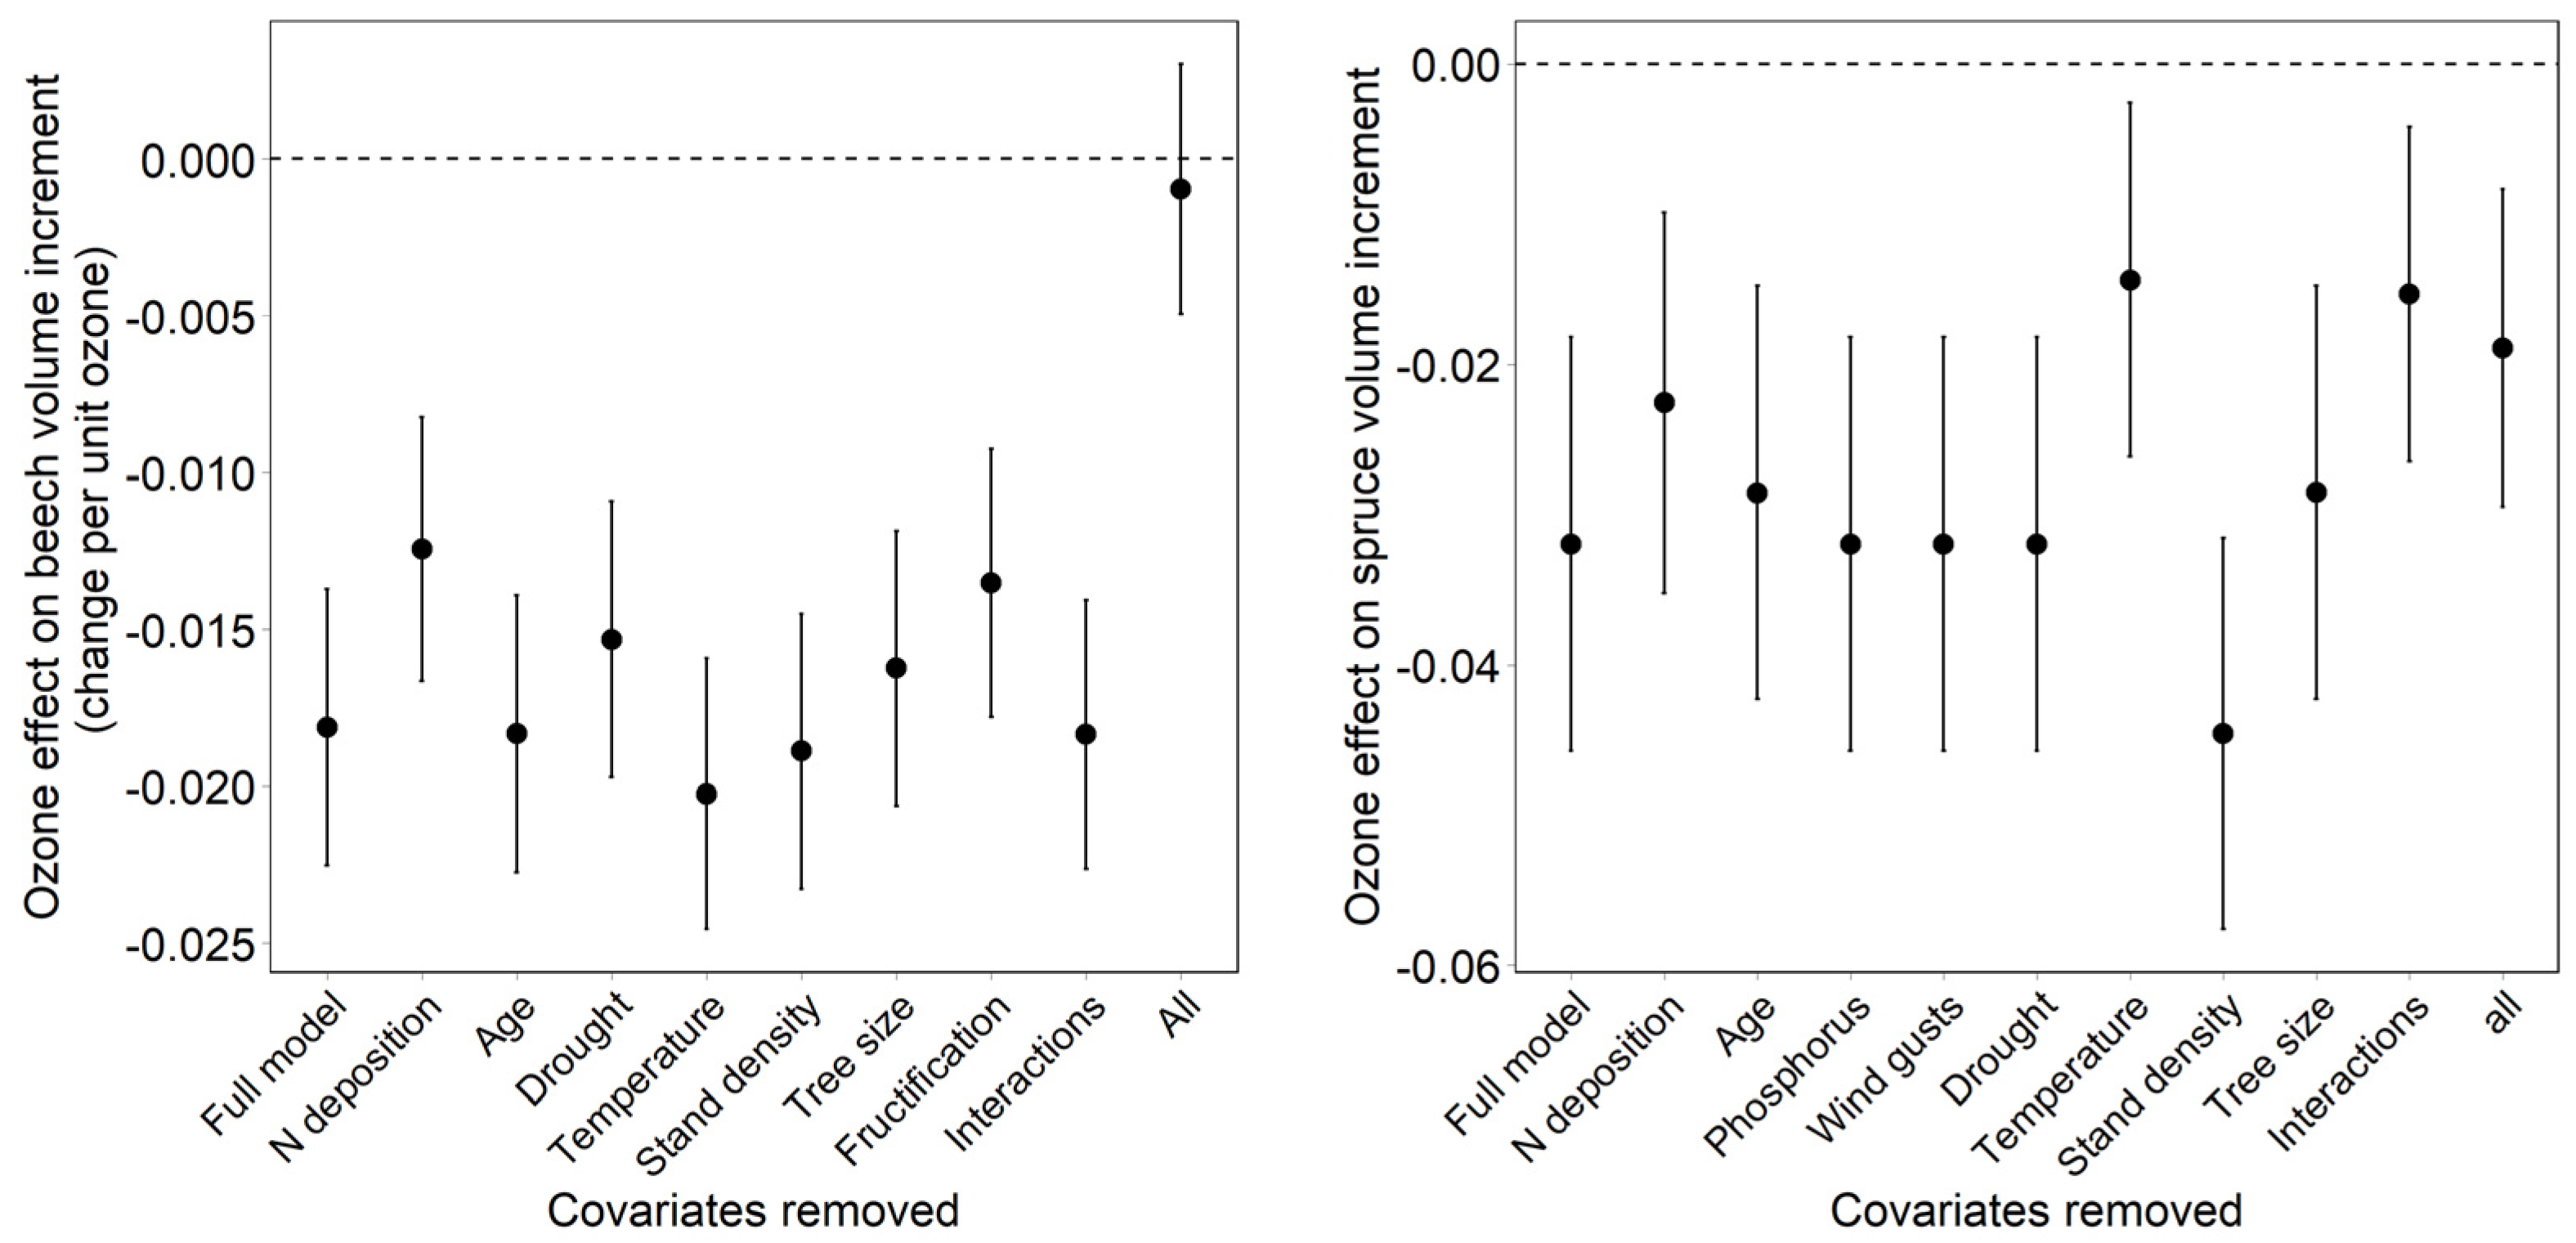
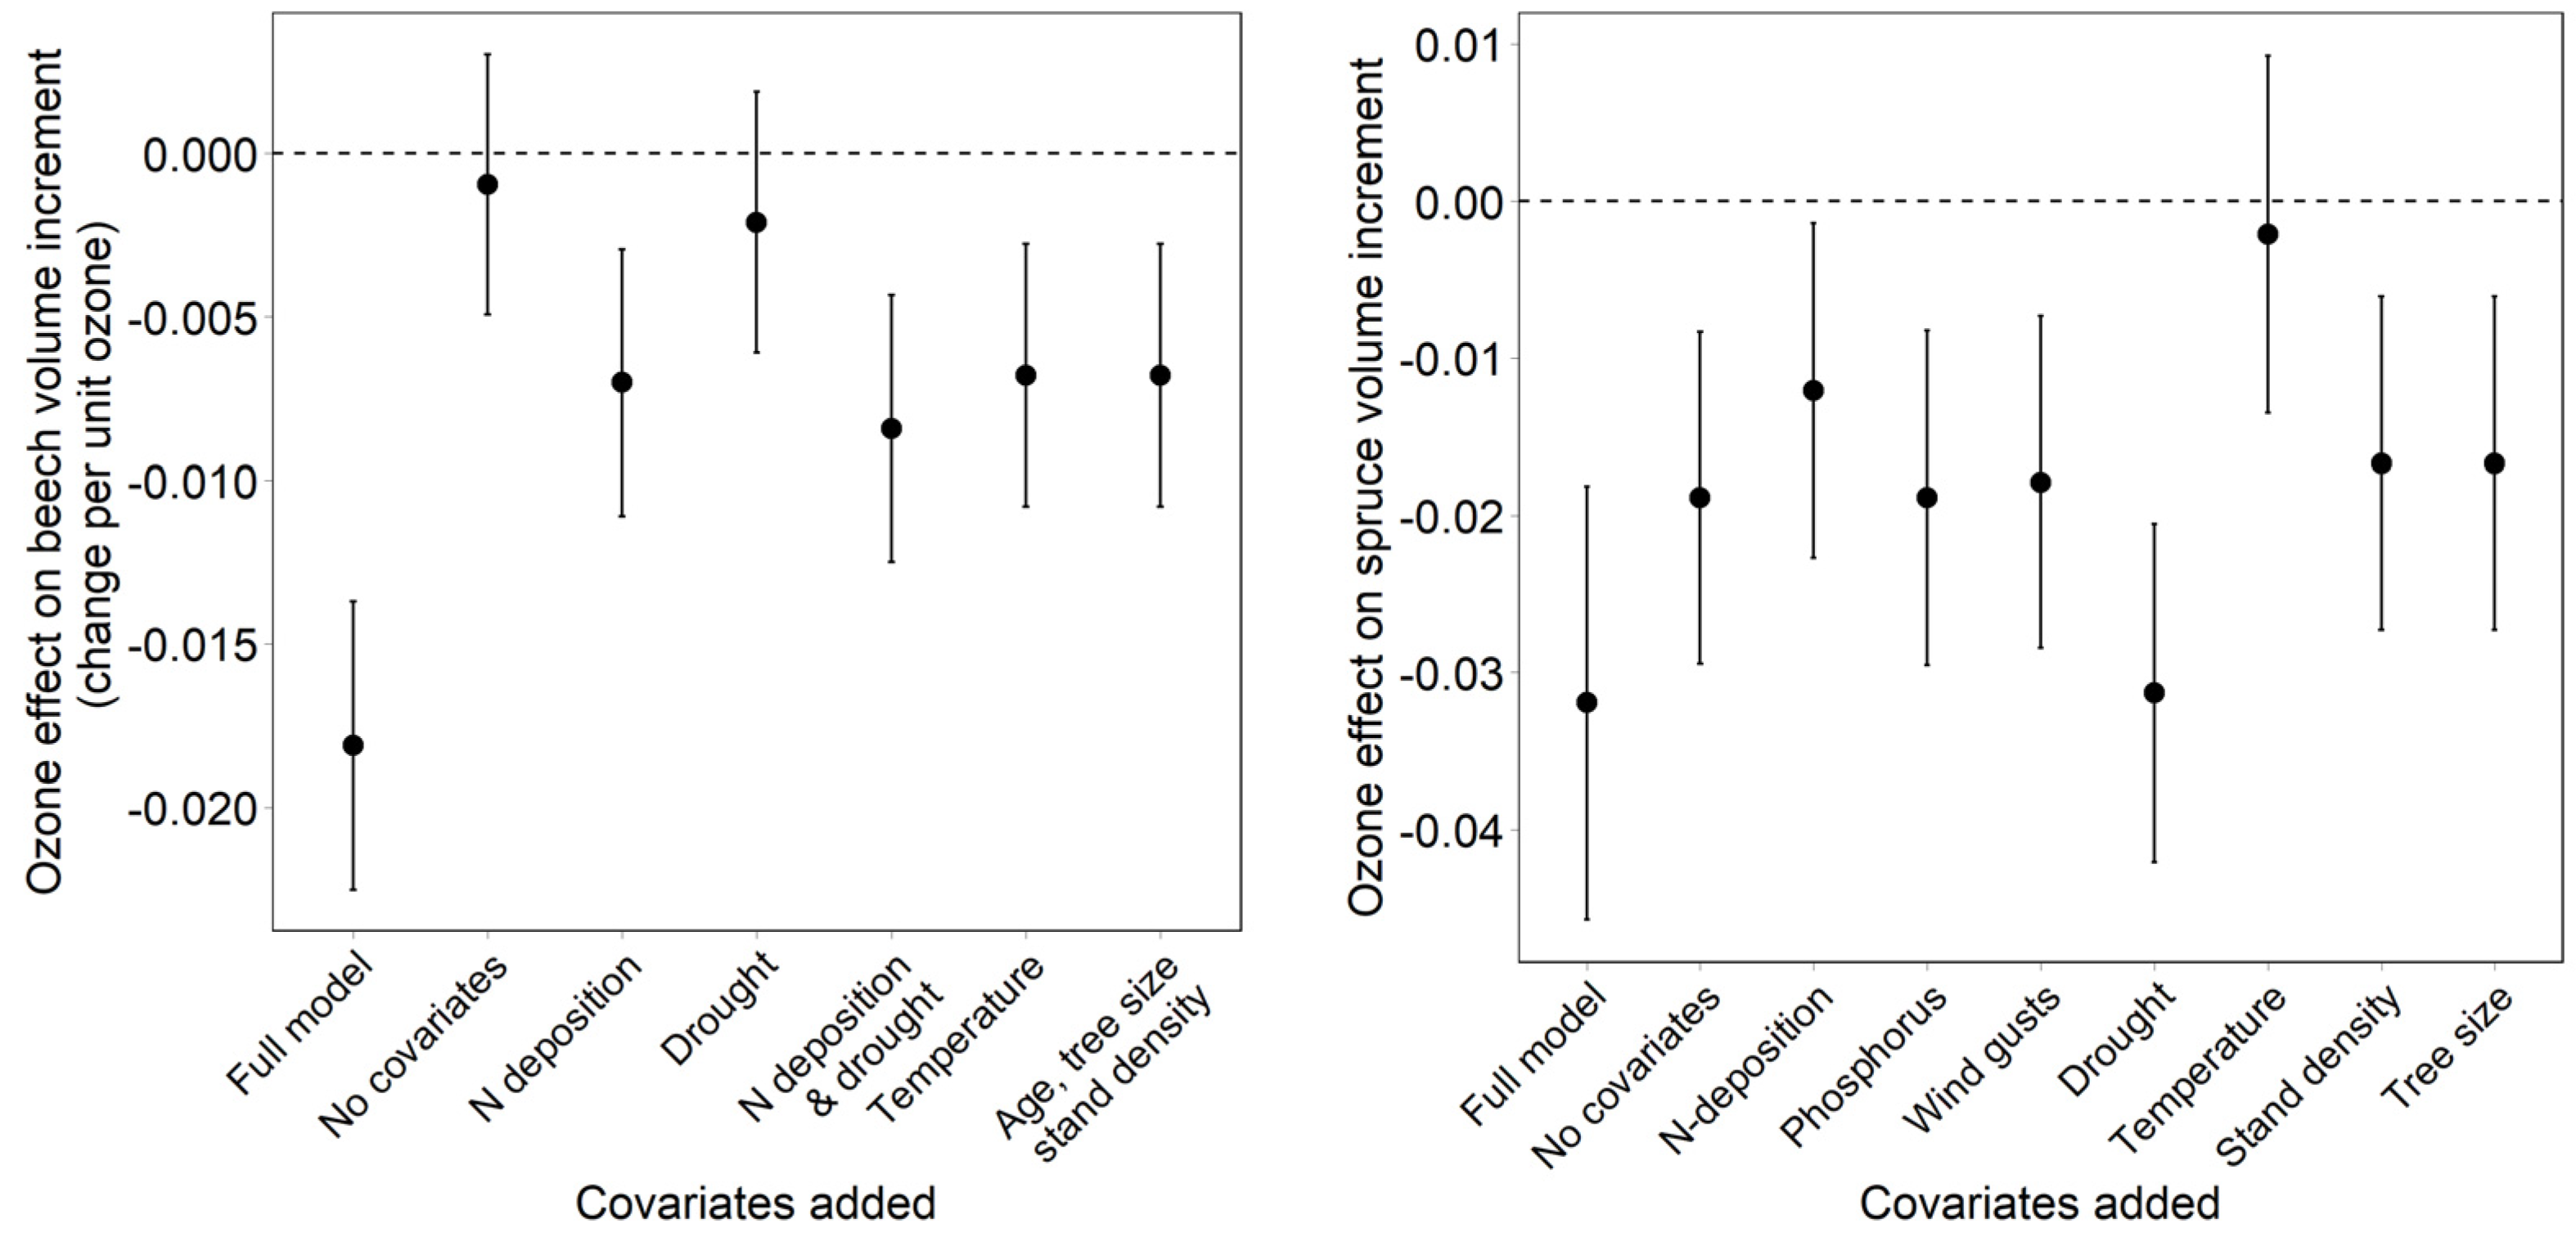
- Dependency of the ozone effect on the inclusion and on the removal of covariates. The effect of covariates on the ozone effect was tested both backwards (removal of covariates from the full model) and forwards (addition of covariates to a model with ozone only).
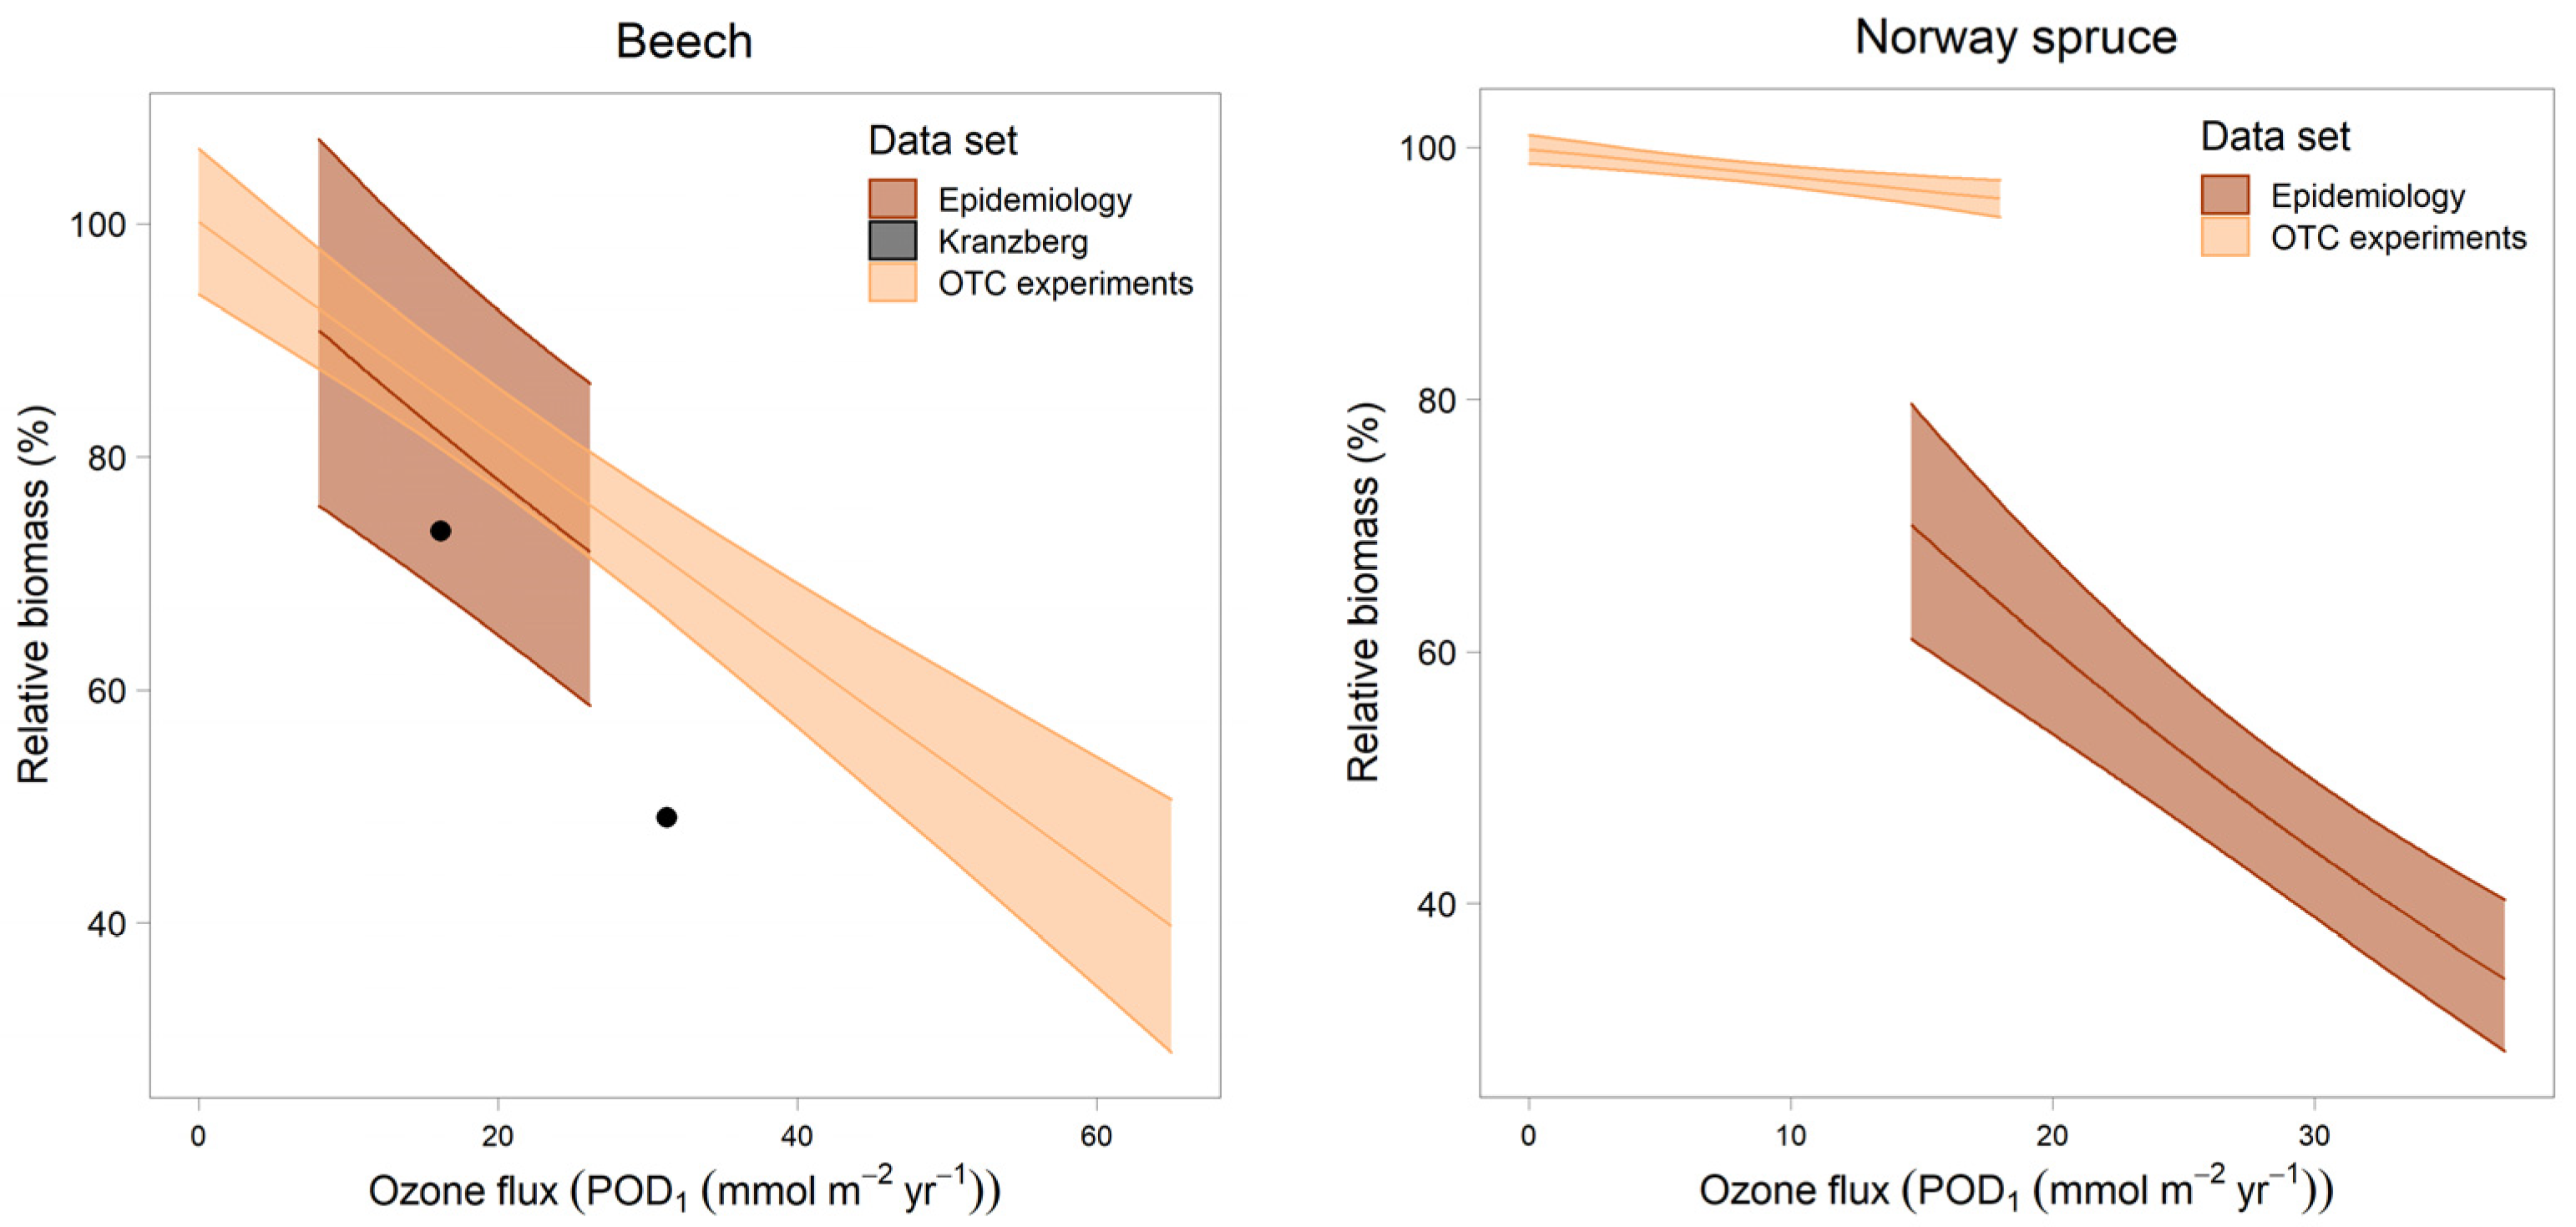
- Comparison of the slopes with dose–response relationships from OTC experiments [27] and from the free-air fumigation in Kranzberg [28]. To enable a direct comparison of the experimental results with the results from epidemiology, curves were aligned on a scale of relative biomass with 100% corresponding to PODi = 0. The two points from the Kranzberg experiment also relate to a relative biomass of 100% at POD1 = 0. This has been the standard procedure for establishing the dose–response curve from the experiments [29].
3. Results
3.1. Model Results for Beech and Norway Spruce
3.2. Effect of Grid Size on the Ozone Model for Beech
3.3. Effect of Covariates on the Regression Result
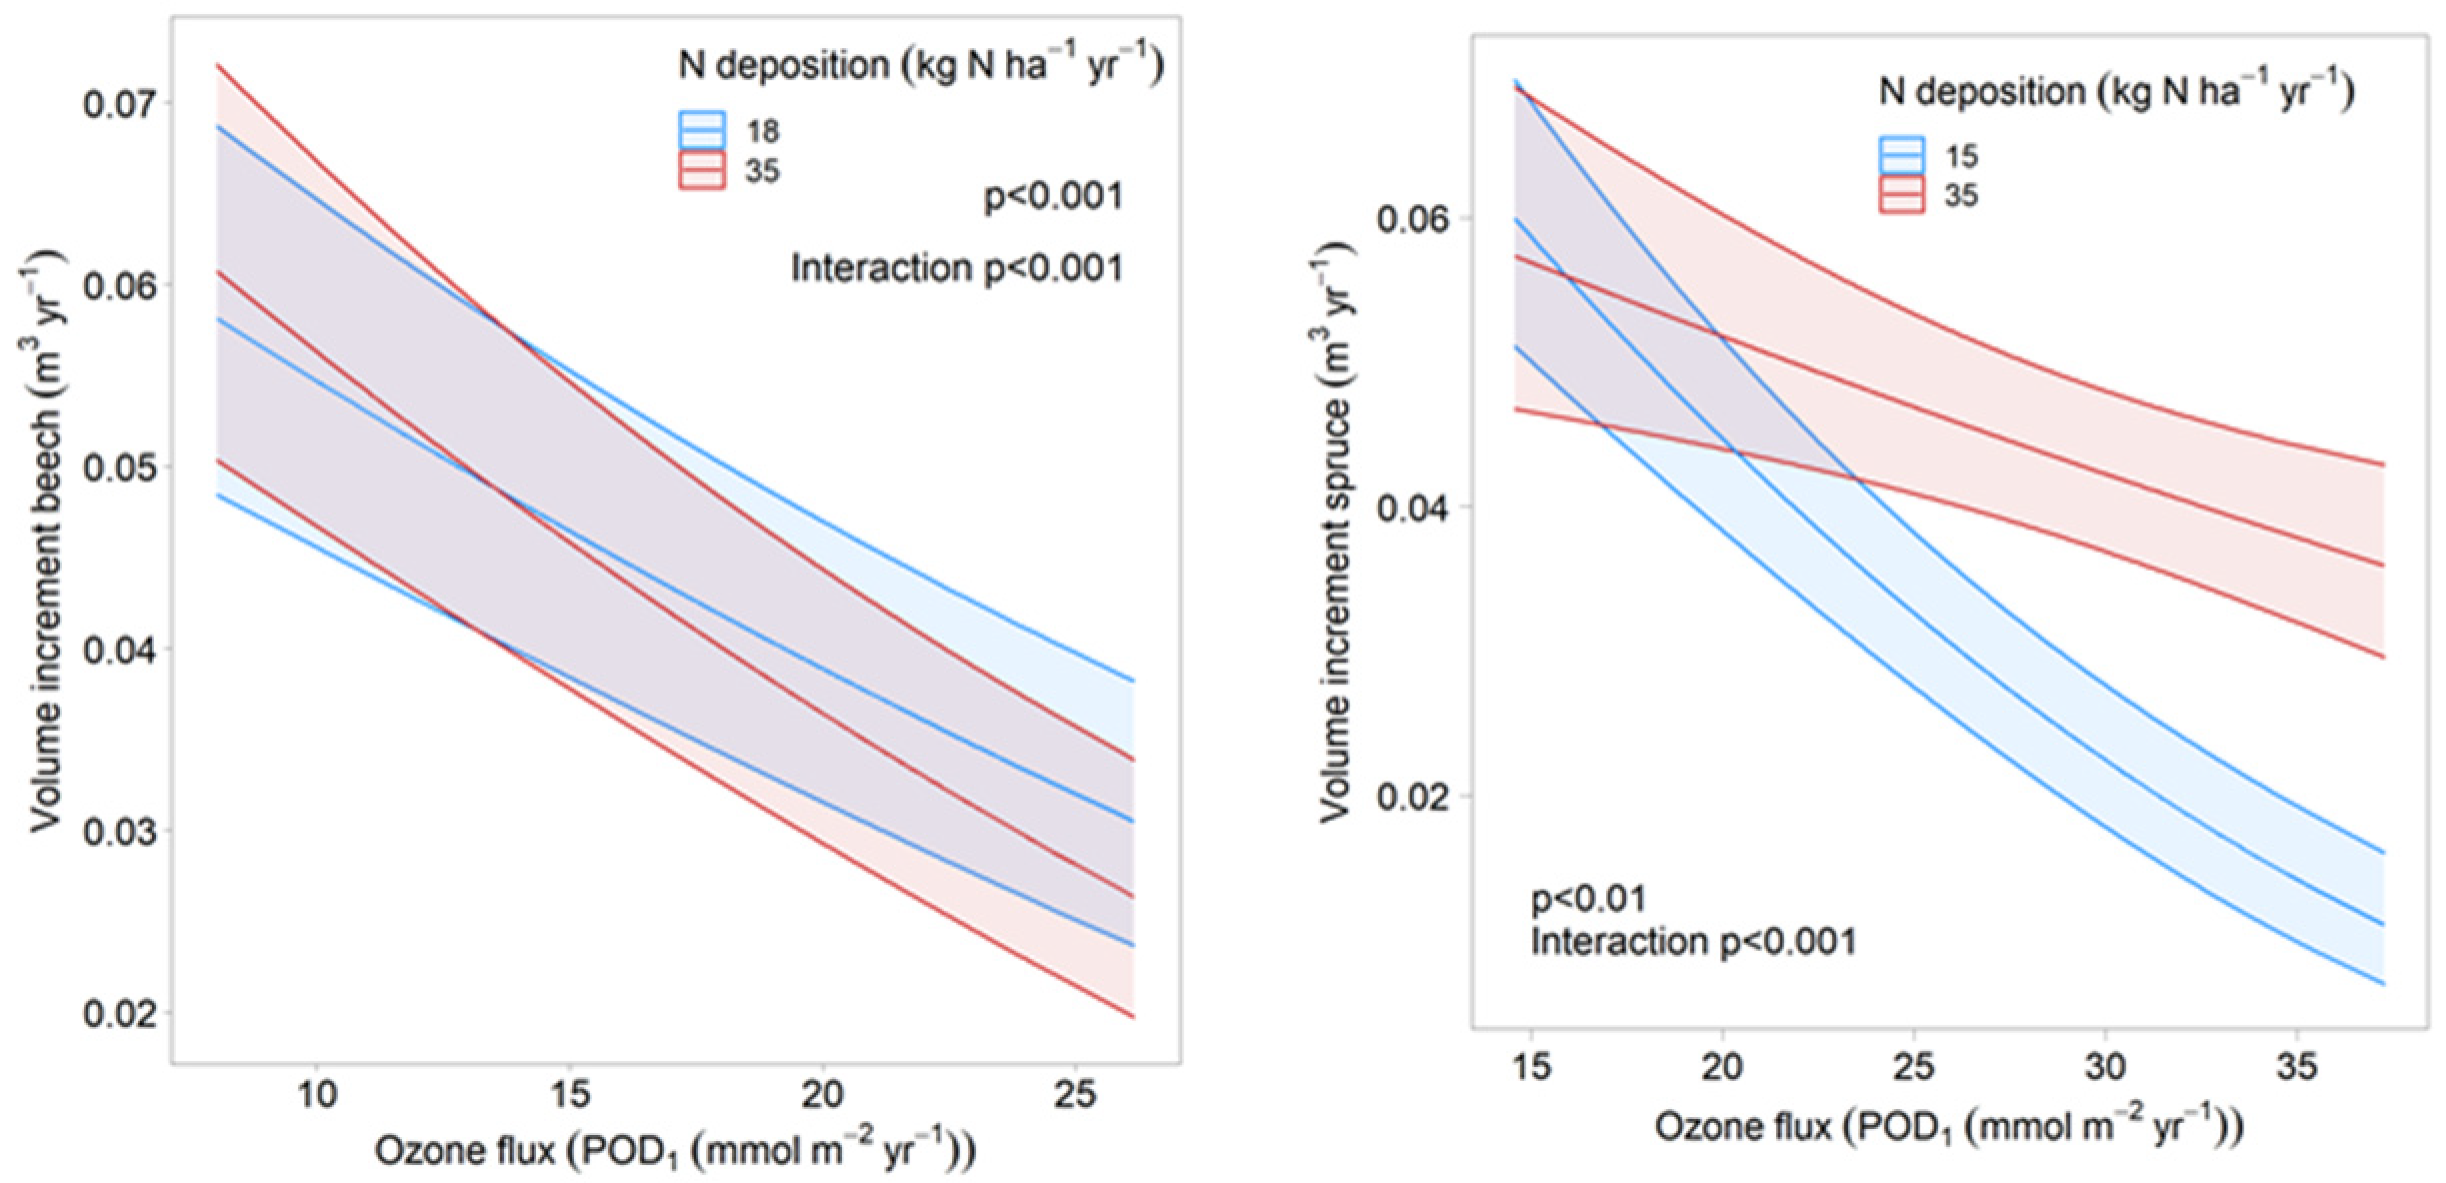
3.4. Comparison with Dose–Response Relationships
4. Discussion
5. Conclusions
Author Contributions
Funding
Institutional Review Board Statement
Informed Consent Statement
Data Availability Statement
Acknowledgments
Conflicts of Interest
References
- ICP Vegetation. Mapping Critical Levels for Vegetation; UNECE: Geneva, Switzerland, 2017. [Google Scholar]
- Karlsson, P.; Braun, S.; Broadmeadow, M.; Elvira, S.; Emberson, L.; Gimeno, B.; Le Thiec, D.; Novak, K.; Oksanen, E.; Schaub, M.; et al. Risk assessments for forest trees: The performance of the ozone flux versus the AOT concepts. Environ. Pollut. 2007, 146, 608–616. [Google Scholar] [CrossRef] [PubMed]
- Mills, G.; Pleijel, H.; Braun, S.; Bueker, P.; Bermejo, V.; Calvo, E.; Danielsson, H.; Emberson, L.; Fernández, I.G.; Grünhage, L.; et al. New stomatal flux-based critical levels for ozone effects on vegetation. Atmos. Environ. 2011, 45, 5064–5068. [Google Scholar] [CrossRef]
- UNECE. Mapping Critical Levels for Vegetation. Revised Chapter 3 of the UNECE Manual on Methodologies and Criteria for Modelling and Mapping Critical Loads & Levels and Air Pollution Effects, Risks and Trends. Prepared under the Convention on Long-Range Transbou; UNECE: Geneva, Switzerland, 2017. [Google Scholar]
- Karnosky, D.F.; Gielen, B.; Ceulemans, R.; Schlesinger, W.H.; Norby, R.J.; Oksanen, E.; Matyssek, R.; Hendrey, G.R. FACE systems for studying the impacts of greenhouse gases on forest ecosystems. IUFRO Res. Ser. 2009, 297, 297–324. [Google Scholar] [CrossRef]
- Karnosky, D.F.; Skelly, J.M.; Percy, K.E.; Chappelka, A.H. Perspectives regarding 50 years of research on effects of tropospheric ozone air pollution on US forests. Environ. Pollut. 2007, 147, 489–506. [Google Scholar] [CrossRef] [PubMed]
- Nunn, A.J.; Reiter, I.M.; Häberle, K.H.; Werner, H.; Langebartels, C.; Sandermann, H.; Heerdt, C.; Fabian, P.; Matyssek, R. ‘Free-air’ ozone canopy fumigation in an old-growth mixed forest: Concept and observations in beech. Phyton 2002, 42, 105–119. [Google Scholar]
- Braun, S.; Achermann, B.; De Marco, A.; Pleijel, H.; Karlsson, P.E.; Rihm, B.; Schindler, C.; Paoletti, E. Epidemiological analysis of ozone and nitrogen impacts on vegetation—Critical evaluation and recommendations. Sci. Total Environ. 2017, 603–604, 785–792. [Google Scholar] [CrossRef] [PubMed]
- Karlsson, P.E.; Örlander, G.; Langvall, O.; Uddling, J.; Hjorth, U.; Wiklander, K.; Areskoug, B.; Grennfelt, P. Negative impact of ozone on the stem basal area increment of mature Norway spruce in south Sweden. For. Ecol. Manag. 2006, 232, 146–151. [Google Scholar] [CrossRef]
- Sicard, P.; De Marco, A.; Carrari, E.; Dalstein-Richier, L.; Hoshika, Y.; Badea, O.; Pitar, D.; Fares, S.; Conte, A.; Popa, I.; et al. Epidemiological derivation of flux-based critical levels for visible ozone injury in European forests. J. For. Res. 2020, 31, 1509–1519. [Google Scholar] [CrossRef]
- Paoletti, E.; De Marco, A.; Anav, A.; Gasparini, P.; Pompei, E. Five-year volume growth of European beech does not respond to ozone pollution in Italy. Environ. Sci. Pollut. Res. 2017, 25, 8233–8239. [Google Scholar] [CrossRef] [PubMed]
- Verryckt, L.T.; de Beeck, M.O.; Neirynck, J.; Gielen, B.; Roland, M.; Janssens, I.A. No impact of tropospheric ozone on the gross primary productivity of a Belgian pine forest. Biogeosciences 2017, 14, 1839–1855. [Google Scholar] [CrossRef] [Green Version]
- Cailleret, M.; Ferretti, M.; Gessler, A.; Rigling, A.; Schaub, M. Ozone effects on European forest growth-Towards an integrative approach. J. Ecol. 2018, 106, 1377–1389. [Google Scholar] [CrossRef]
- Braun, S.; Schindler, C.; Rihm, B. Growth trends of beech and Norway spruce in Switzerland: The role of nitrogen deposition, ozone, mineral nutrition and climate. Sci. Total Environ. 2017, 599–600, 637–646. [Google Scholar] [CrossRef] [PubMed]
- LFI/WSL. Schweizerisches Landesforstinventar (LFI); Berichte Eidg; Anstalt für das forstliche Versuchswesen Birmensdorf: Birmensdorf, Switzerland, 1992. [Google Scholar]
- Büker, P.; Morissey, T.; Briolat, A.; Falk, R.; Simpson, D.; Tuovinen, J.-P.; Alonso, R.; Barth, S.; Baumgarten, M.; Grulke, N.E.; et al. DO3SE modelling of soil moisture to determine ozone flux to European forest trees. Atmos. Chem. Phys. 2012, 12, 5537–5562. [Google Scholar] [CrossRef] [Green Version]
- Braun, S.; Schindler, C.; Rihm, B. Growth losses in Swiss forests caused by ozone: Epidemiological data analysis of stem increment of Fagus sylvatica L. and Picea abies Karst. Environ. Pollut. 2014, 192, 129–138. [Google Scholar] [CrossRef] [PubMed]
- Bates, D.; Maechler, M.; Bolker, B.; Walker, S. Fitting Linear Mixed-Effects Models Using lme4. J. Stat. Softw. 2015, 67, 1–48. [Google Scholar] [CrossRef]
- Zuur, A.F.; Ieno, E.N.; Walker, N.J.; Saveliev, A.A.; Smith, G.M. Mixed Effects Models and Extensions in Ecology with R; Springer: Berlin/Heidelberg, Germany, 2009. [Google Scholar]
- Fox, J.; Weisberg, S. An R Compation to Applied Regression, 3rd ed.; Sage: Newcastle upon Tyne, UK, 2019. [Google Scholar]
- Lüdecke, D. Ggeffects: Tidy Data Frames of Marginal Effects from Regression Models. J. Open Source Softw. 2018, 3, 772. [Google Scholar] [CrossRef] [Green Version]
- Rihm, B.; Künzle, T. Mapping Nitrogen Deposition 2015 for Switzerland; Technical Report on the Update of Critical Loads and Exceedance, Including the Years 1990, 2000, 2005 and 2010; Federal Office for the Environment FOEN, Air Pollution Control and Chemicals Division: Bern, Switzerland, 2019.
- Braun, S.; Remund, J.; Rihm, B. Indikatoren zur Schätzung des Trockenheitsrisikos in Buchen- und Fichtenwäldern. Schweiz. Z. Forstwes. 2015, 166, 361–371. [Google Scholar] [CrossRef]
- Glenn, N.D. Age, Period and Cohort Effects; Blackwell Publishing: Hoboken, NJ, USA, 2007. [Google Scholar]
- Le Goff, N.; Ottorini, J.-M. Effets des éclaircies sur la croissance du hêtre. Interaction avec les facteurs climatiques. Rev. For. Française 1999, 50, 355–364. [Google Scholar] [CrossRef] [Green Version]
- Braun, S.; Schindler, C.; Rihm, B. Foliar Nutrient Concentrations of European Beech in Switzerland: Relations With Nitrogen Deposition, Ozone, Climate and Soil Chemistry. Front. For. Glob. Change 2020, 3, 33. [Google Scholar] [CrossRef]
- Büker, P.; Feng, Z.; Uddling, J.; Briolat, A.; Alonso, R.; Braun, S.; Elvira, S.; Gerosa, G.; Karlsson, P.E.; LeThiec, D.; et al. New flux-based dose-response relationships for ozone for European forest tree species. Environ. Pollut. 2015, 206, 163–174. [Google Scholar] [CrossRef]
- Pretzsch, H.; Dieler, J.; Matyssek, R.; Wipfler, P. Tree and stand growth of mature Norway spruce and European beech under long-term ozone fumigation. Environ. Pollut. 2010, 158, 1061–1070. [Google Scholar] [CrossRef] [PubMed]
- Fuhrer, J.; Skärby, L.; Ashmore, M. Critical levels for ozone effects on vegetation in Europe. Environ. Pollut. 1997, 97, 91–106. [Google Scholar] [CrossRef]
- Körner, C. Paradigm shift in plant growth control. Curr. Opin. Plant Biol. 2015, 25, 107–114. [Google Scholar] [CrossRef]
- Dai, L.; Hayes, F.; Sharps, K.; Harmens, H.; Mills, G. Nitrogen availability does not affect ozone flux-effect relationships for biomass in birch (Betula pendula) saplings. Sci. Total Environ. 2019, 660, 1038–1046. [Google Scholar] [CrossRef]
- Yamaguchi, M.; Watanabe, M.; Iwasaki, M.; Tabe, C.; Matsumura, H.; Kohno, Y.; Izuta, T. Growth and photosynthetic responses of Fagus crenata seedlings to O3 under different nitrogen loads. Trees 2007, 21, 707–718. [Google Scholar] [CrossRef]
- Harmens, H.; Hayes, F.; Sharps, K.; Mills, G.; Calatayud, V. Leaf traits and photosynthetic responses of Betula pendula saplings to a range of ground-level ozone concentrations at a range of nitrogen loads. J. Plant Physiol. 2017, 211, 42–52. [Google Scholar] [CrossRef] [Green Version]
- Mills, G.; Harmens, H.; Wagg, S.; Sharps, K.; Hayes, F.; Fowler, D.; Sutton, M.; Davies, B. Ozone impacts on vegetation in a nitrogen enriched and changing climate. Environ. Pollut. 2016, 208, 898–908. [Google Scholar] [CrossRef] [Green Version]


| Fagus sylvatica | Picea abies | |
|---|---|---|
| term | coefficient | coefficient |
| b0 | 24.732 | 5.8202 |
| H | −1.8734 | |
| H × d | 0.18617 | |
| D × H × d | 0.037304 | |
| D × d2 | 0.0078491 | −0.0077515 |
| D2 × H × d | −0.00021339 | |
| D × d | 0.16032 | |
| D2 | 0.26975 | |
| d2 | −0.2776 | |
| D2 × H | −0.0054489 | |
| H × d2 | 0.052114 | |
| D2 × d | 0.0046137 |
| Response: Volume Increment | Level | Fagus sylvatica | Picea abies | ||
|---|---|---|---|---|---|
| Chisq | Poly. | Chisq | Poly. | ||
| Number of trees | 7427 | 6538 | |||
| Number of plots | 91 | 72 | |||
| Number of observations | 32,907 | 23,669 | |||
| R2 marginal | 0.360 | 0.523 | |||
| Age | stand | 20 | 1 | 19 | 1 |
| Social position | tree | 36 | 1 | 73 | 1 |
| Position within stand | tree | 220 | 1 | 38 | 1 |
| Diameter at start | tree×year | 1906 | 2 | 1040 | 1 |
| Crown projection | tree | 133 | 2 | 194 | 2 |
| Relative stand density | Stand × year | 14 | 1 | 4 | 2 |
| Proportion deciduous | stand | 34 | 1 | ||
| Fructification | Stand × year | 34 | 1 | ||
| Foliar Ca | Stand × year | 1 | 1 | 33 | 1 |
| Foliar N:K | stand × year | 36 | 1 | ||
| Foliar P | stand × year | 75 | 2 | ||
| Drought | stand × year | 170 | 1 | 130 | 2 |
| Temperature | stand × year | 57 | 2 | 44 | 2 |
| Wind gusts | stand × year | 46 | 1 | ||
| N deposition | stand × year | 117 | 2 | 128 | 2 |
| Ozone | stand × year | 49 | 1 | 12 | 1 |
| N deposition × drought | stand × year | 68 | 2 × 2 | ||
| Ozone × N deposition | stand × year | 57 | 1 × 2 | 52 | 1 × 2 |
| N deposition × fructification | stand × year | 56 | 2 × 1 | ||
| N deposition × Tmean May | stand × year | 41 | 2 × 2 | 54 | 2 × 2 |
| N deposition × stand density | stand × year | 112 | 2 × 1 | ||
| N deposiiton × diameter at start | stand × year | 72 | 2 × 1 | ||
| Ozone × stand density | stand × year | 58 | 1 × 1 | 44 | 1 × 2 |
| Ozone social position | stand × year | 43 | 1 × 1 | ||
| Ozone × fructification | stand × year | 39 | 1 × 1 | ||
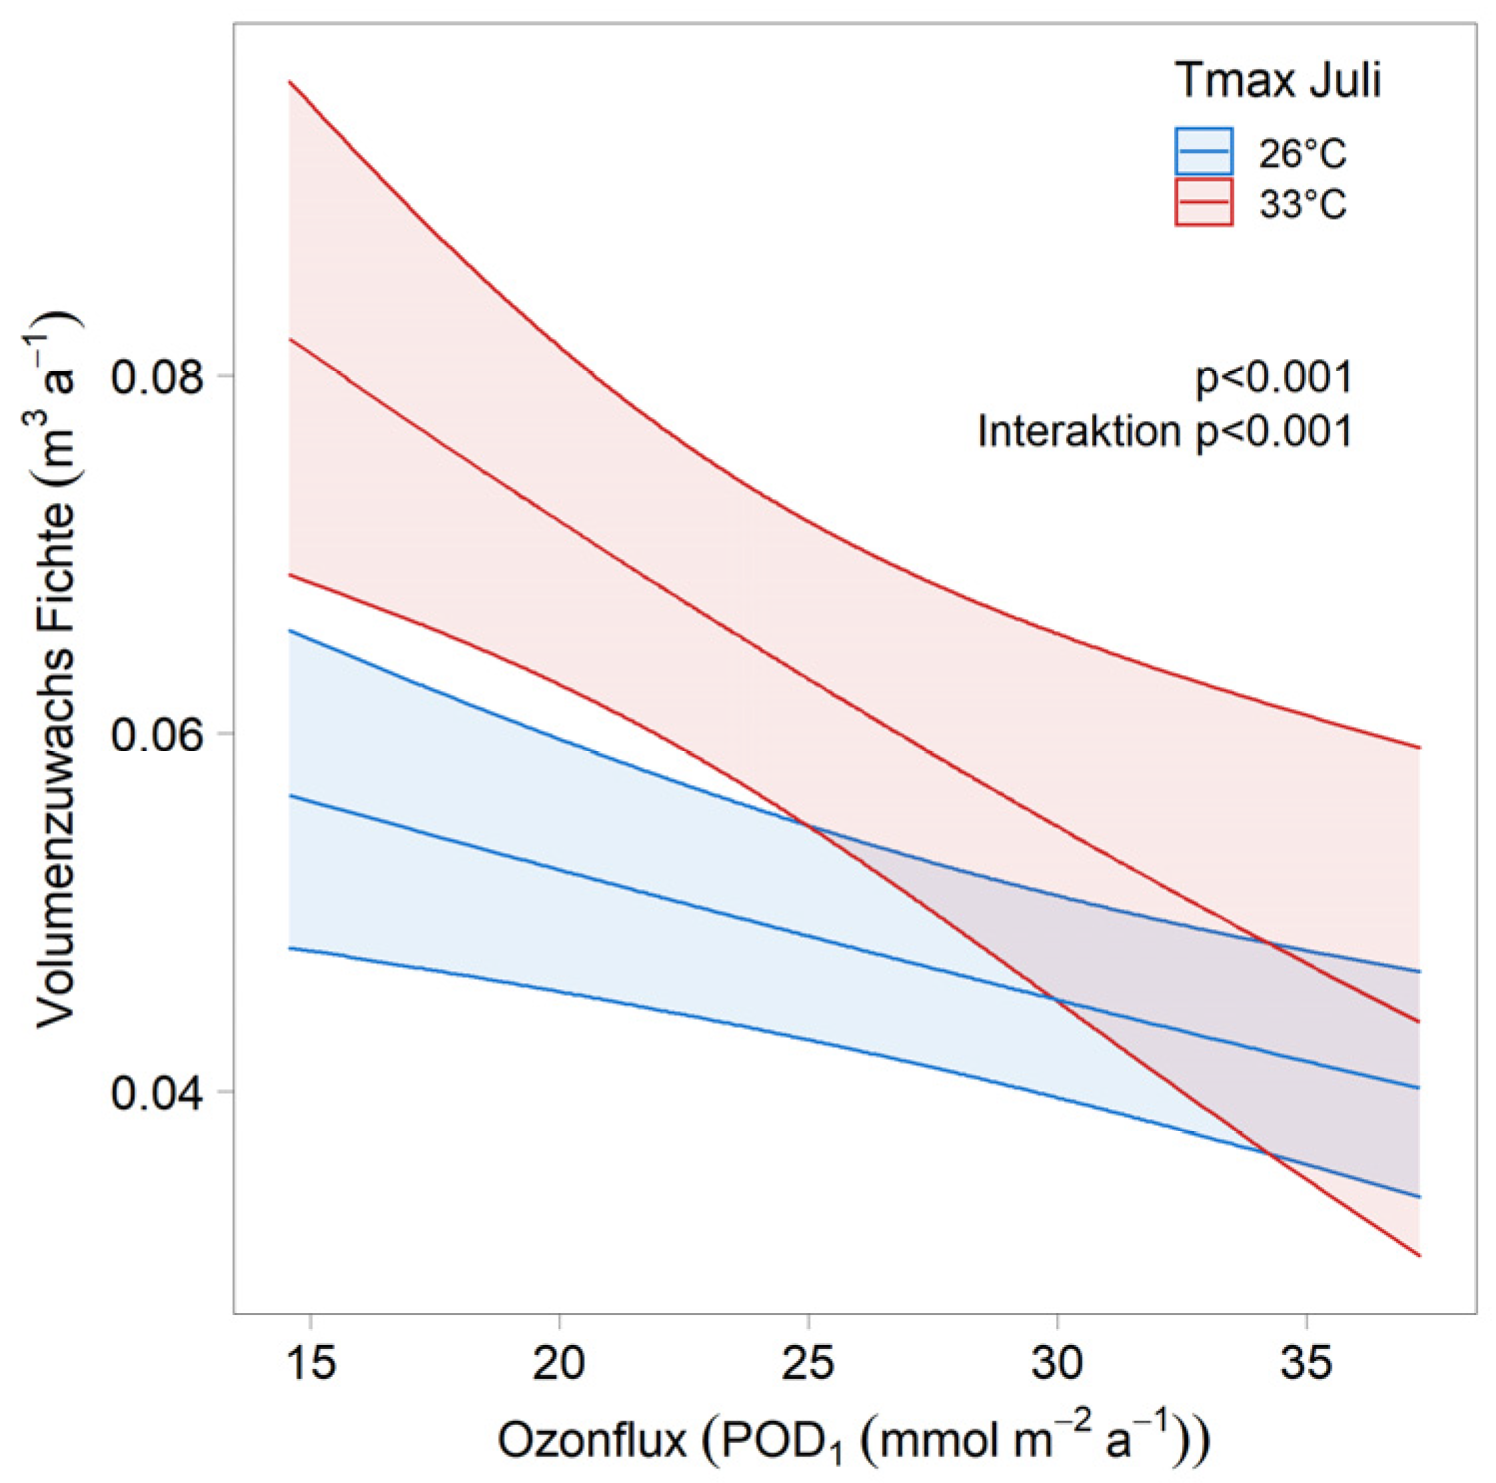
| Ozone × Tmax July | stand × year | 116 | 1 × 2 | ||
| Drought × foliar N:K | stand × year | 110 | 1 × 1 | ||
| Fagus sylvatica | Picea abies | |||
|---|---|---|---|---|
| n | without | with | without | with |
| par | 50 | 56 | 59 | 66 |
| AIC | −103,509 | −103,718 | −66,761 | −66,922 |
| BIC | −103,089 | −103,247 | −66,285 | −66,389 |
| logLik | 51,805 | 51,915 | 33,439 | 33,527 |
| deviance | −103,609 | −103,830 | −66,879 | −67,054 |
| Chisq | 220.57 | 175.19 | ||
| Df | 6 | 7 | ||
| Pr (>Chisq) | <2.2 × 10¹⁶ *** | <2.2 × 10¹⁶ *** | ||
Publisher’s Note: MDPI stays neutral with regard to jurisdictional claims in published maps and institutional affiliations. |
© 2022 by the authors. Licensee MDPI, Basel, Switzerland. This article is an open access article distributed under the terms and conditions of the Creative Commons Attribution (CC BY) license (https://creativecommons.org/licenses/by/4.0/).
Share and Cite
Braun, S.; Rihm, B.; Schindler, C. Epidemiological Estimate of Growth Reduction by Ozone in Fagus sylvatica L. and Picea abies Karst.: Sensitivity Analysis and Comparison with Experimental Results. Plants 2022, 11, 777. https://doi.org/10.3390/plants11060777
Braun S, Rihm B, Schindler C. Epidemiological Estimate of Growth Reduction by Ozone in Fagus sylvatica L. and Picea abies Karst.: Sensitivity Analysis and Comparison with Experimental Results. Plants. 2022; 11(6):777. https://doi.org/10.3390/plants11060777
Chicago/Turabian StyleBraun, Sabine, Beat Rihm, and Christian Schindler. 2022. "Epidemiological Estimate of Growth Reduction by Ozone in Fagus sylvatica L. and Picea abies Karst.: Sensitivity Analysis and Comparison with Experimental Results" Plants 11, no. 6: 777. https://doi.org/10.3390/plants11060777
APA StyleBraun, S., Rihm, B., & Schindler, C. (2022). Epidemiological Estimate of Growth Reduction by Ozone in Fagus sylvatica L. and Picea abies Karst.: Sensitivity Analysis and Comparison with Experimental Results. Plants, 11(6), 777. https://doi.org/10.3390/plants11060777