Article

Impact of Silica Ions and Nano Silica on Growth and Productivity of Pea Plants under Salinity Stress

by
Lamiaa M. Ismail
1,
Magda I. Soliman
1,
Mohammed H. Abd El-Aziz
2 and
Heba M. M. Abdel-Aziz
1,*
1
Botany Department, Faculty of Science, Mansoura University, Mansoura 35516, Egypt
2
Department of Genetics, Faculty of Agriculture, Mansoura University, Mansoura 35516, Egypt
*
Author to whom correspondence should be addressed.
Plants 2022, 11(4), 494; https://doi.org/10.3390/plants11040494
Submission received: 23 January 2022 / Revised: 4 February 2022 / Accepted: 6 February 2022 / Published: 11 February 2022
(This article belongs to the Special Issue Applied Nano-Particles under Combined Stress on Plants)

Abstract

:
The present study was conducted to evaluate the effects of silicon (Si) and nano-silicon (NSi) on growth, yield, ions content, and antioxidant defense systems, including transcript levels of enzyme-encoding genes in Pisum sativum plants grown under salinity stress. Both Si and NSi were applied at the 3 mM level and NaCl was applied at 4 concentrations (100, 150, 200 and 250 mM). Vegetative growth, including plant height, leaf area, fresh and dry weights, and yield attributes were determined. Gene expression of antioxidant enzymes was analyzed, and their activities were determined. The results showed that salinity had deleterious effects on plant growth and yield. Salt-stressed plant leaves exhibited a greater activity of superoxide dismutase (SOD), peroxidase (POD), but a lower activity of catalase (CAT) when compared to the control. Na+ ions accumulated in roots and shoots of salinized plants. The application of Si and NSi significantly enhanced vegetative growth and relative water content (RWC), and caused significant increases in plant height, fresh and dry weight, total yield, and antioxidant defense systems. Si and NSi enhanced K+ content in roots and shoots under salinity treatment and decreased Na+ content in the studied tissues. It was concluded that the application of NSi was beneficial in improving the salt tolerance of Pisum sativum plants more than Si alone.

1. Introduction

Crop production losses are being caused by increased soil salinization, which is a major global problem [1]. Over 20% of the world’s arable land is affected, which reduces agricultural production [2]. Egypt has a persistent salinity issue as a result of its semi-arid zone weather, sea water, freshwater constraint, and climate change [3]. A plant’s production decreases dramatically when exposed to high levels of salinity, which affects nearly every aspect of its physiology and biochemistry. In Egypt and many other nations across the world, pea (Pisum sativum L.) is a significant and popular legume crop. With seeds containing 20–25% protein, 40–50% starch, and 10–20% fiber, it is high in protein, low in starch, and high in fiber [4,5]. It is consumed as immature seeds in Europe, Australia, America, and the Mediterranean, but as entire pods in Asia [6]. This plant is utilized in rotations with cereals for the supply of soil nitrogen, and is also used as a fodder crop for animals [7,8].
Even though salt stress reduces the yield of pea plants by 50% when NaCl is present at a concentration of 100 mM, pea yields were still lowered when the salinity was raised [9]. It is among the most oppressive constraints on agricultural yield due to soil and irrigation water containing excessive amounts of salt [10]. Osmotic stress, specific ion toxicity, imbalanced nutrition (in particular to accelerated uptake of Na+ over K +), and oxidative stress are all believed to be factors contributing to saline-induced plant growth and productivity loss [11].
Stress due to salinity can have an impact on all stages of plant development, including seed germination and growth. Stress-induced adverse plant responses appear to be dependent on the medium’s osmotic and toxic effects as well as the stress’s intensity and duration [12]. In the case of salt stress, other mechanisms are known, such as the expulsion of excess salt as well as the translocation of salt and the production of osmoprotectants, whose purpose is to retain water inside the cells and protect proteins. There is evidence that nitrogen-containing compounds and osmoprotectants accumulate in stressed plants. The amount of nitrogen-containing compound accumulation varies by plant type and species [13]. Due to the impacts of salt stress on plants, along with the formation of reactive oxygen species (ROS), such as free radicals, hydroxyl radicals (.OH) and singlet oxygen (1O2), plants produce ROS such as superoxide anions (O2•−), hydroxyl radicals (.OH), and non-radical molecules like hydrogen peroxide (H2O2) [14]. Salt concentration and oxidative stress cause damage to a wide range of cellular components, including proteins, lipids, and DNA, thus the plant’s critical activities are disrupted [15].
Plants enhance their tolerance to unfavorable circumstances by simultaneously activating several defensive systems. Stress activates a huge number of genes, and many proteins are generated that further boost stress resistance [16]. Plants may combat oxidative damage by employing an effective antioxidant defense system that will sweep up ROS and safeguard the plants [14]. The fundamental phase of cellular defense is the antioxidant enzyme system, which comprises SOD as the leading component. It forms H2O2 and O2 from the extremely harmful superoxide ions (O2•−) by dismutating the O2•− to H2O2. The first phase of ROS detoxification, which consists of using components of the ascorbate–glutathione cycle, is subsequently followed by a second step that uses the CAT, POD, and ascorbate peroxidase (APX) pathway, which includes the removal of H2O2 to form water and oxygen [13]. Glycine betaine, Mannitol, proline, and SOD, APX, CAT, and glutathione reductase (GR) have all been found to be overproduced in response to salinity stress [13].
One of the most important nutritional components for plant growth is silicon (Si) [17]. The potential of Si to improve plant development under salt stress is widely known [18]. Salinity resistance in many plant species, including wheat [19], barley [20,21,22], rice [23], cucumber [24], tomato [25], spinach [26], canola [27], maize [28], and Cucurbita pepo [29] has been reportedly mitigated by silicon. Several mechanisms of Si amelioration of salt stress have been proposed: (1) the accumulation of Na in the shoots of rice [23] and barley [20,21,22] after Si addition under salinity stress. (2) Reduction of Na uptake by the roots [30,31].
Because nanoparticles (NPs) have distinct physical–chemical characteristics in comparison to bulk particles, researchers are drawn to it [32]. As a result, nanomaterials demonstrate unique properties because of their minuscule size. Because of their increased surface area, the solubility and surface reactivity of their particles tend to be higher [33]. One of the practical nanomaterials shown to have a favorable influence in current agriculture is Nano-silicon (NSi) [34]. In contemporary agriculture, NSi has been found to be advantageous [34,35,36]. However, there is still a lack of understanding of how NPs affect plant growth and development [35]. With the use of NSi, Larix seedlings developed and increased in quality [37] while drought-stressed strawberry plants increased in productivity [36]. Salinity and silicon in higher plants have been studied extensively, but little is known about the potential advantages of NSi to reduce and alleviate salt stress damage in plants [38].
Therefore, the current study aimed to elucidate the potential effect of the application of Si (3mM) and NSi (3mM) on growth, development, productivity, ion selectivity, and the expression of antioxidant genes and antioxidant enzymes activities of pea (Pisum Sativum L.) under salinity stress conditions compared to untreated plants. The hypothesis was to try to confirm whether Si or NSi is more effective in alleviating salinity stress in pea plant.

2. Results

2.1. Plant Vegetative Growth

In comparison to the control, treatment of pea seedlings with Si induced slight increase in shoot and root length, shoot and root fresh weight, shoot and root dry weight, number of leaves, and leaf area at the vegetative stage whereas more beneficial effect was recorded after NSi application. Under salt stress, shoot length, shoot and root fresh weight, shoot and root dry weight, and leaf area were gradually decreased by increasing salt concentration when compared with control, while root length was increased compared to that of the control. The lowest values of growth parameters were recorded at the highest level of salt concentration (150, 200 and 250 mM). At low salt stress (100 mM), no significant effect on fresh and dry weights was observed. However, the application of Si and NSi alleviated salinity –inducing a reduction in growth and significantly increasing shoot and root length, shoot and root fresh weight, shoot and root dry weight, the number of leaves, and leaf area when compared with the corresponding level of salinity (Table 1).

2.2. Yield Components

Data registered in Table 2 revealed that increasing salinity level resulted in a gradual decrease in pod length, pod weight, number of pods, and crop yield per plant. Similarly, salinity stress significantly reduced number of seeds per pod, seed weight per pod, total seed yield, and straw yield; the reduction was much greater at salinity levels of 200 and 250 mM than at 100 or 150 mM. In this respect, 250 mM NaCl treatment caused a reduction of about 24.51%, 68.84%, 66.67% and 64.48% in pod length, pod weight, number of pods, and crop yield, as compared with the control, respectively. Reductions in the number of seeds per pod, seeds weight per pod, total seed yield and straw yield at 250 mM were severe and reached about 28.57%,86.12%, 85.46% and 60.65% as compared to the control, respectively.
On the other hand, Si and NSi applications significantly overcame the adverse effects of salt stress and increased all yield components in saline treated or untreated plants (Table 3). In this regard, Si treatment caused an increase in pod weight, crop yield per plant, and straw yield by about 31.97%, 13.60% and 2.50%, respectively, as compared to the control (Table 3). The corresponding increases with NSi treatment were about 61.66%, 44.46% and 26.58%, respectively. Concerning seeds weight per pod and total seed yield per plant, the Si treatment caused an increase of about 12.46% in seeds weight per pod and about 21.66% in total seed yield per plant, while NSi treatment caused an increase of about 11.05% and 17.21% in seeds weight per pod, and total seed yield per plant, respectively.
The harvest index (HI) and crop index (CI) were affected significantly by salinity stress (Table 3). In this regard HI and CI values were decreased with increasing salinity levels. At 250 mM of NaCl, the harvest and crop indices of silicon untreated plants were decreased by about 58.33% and 50.00%, respectively, as compared to 0 mM NaCl treatment. It is clear from the data in the same table that Si and NSi treatments had a significant enhancing effect on seed yield of pea; therefore, the harvest index values were increased with Si and NSi treatments under different salt treatments.

2.3. Ion Selectivity

Examination of Table 4 revealed that Na+ content increased significantly in both roots and shoots of plants under salinity treatments while it decreased significantly under Si and NSi treatments. The magnitude of response was more pronounced with the NSi treatment. On the other hand, K+ content decreased significantly under salinity conditions in both roots and shoots but Si and NSi alleviated this effect under salinity conditions with NSi being superior over Si. In a similar manner Na+/K+ ratio showed increased values under salinity treatments alone, and relatively lower values with Si and NSi treatments (Table 4).

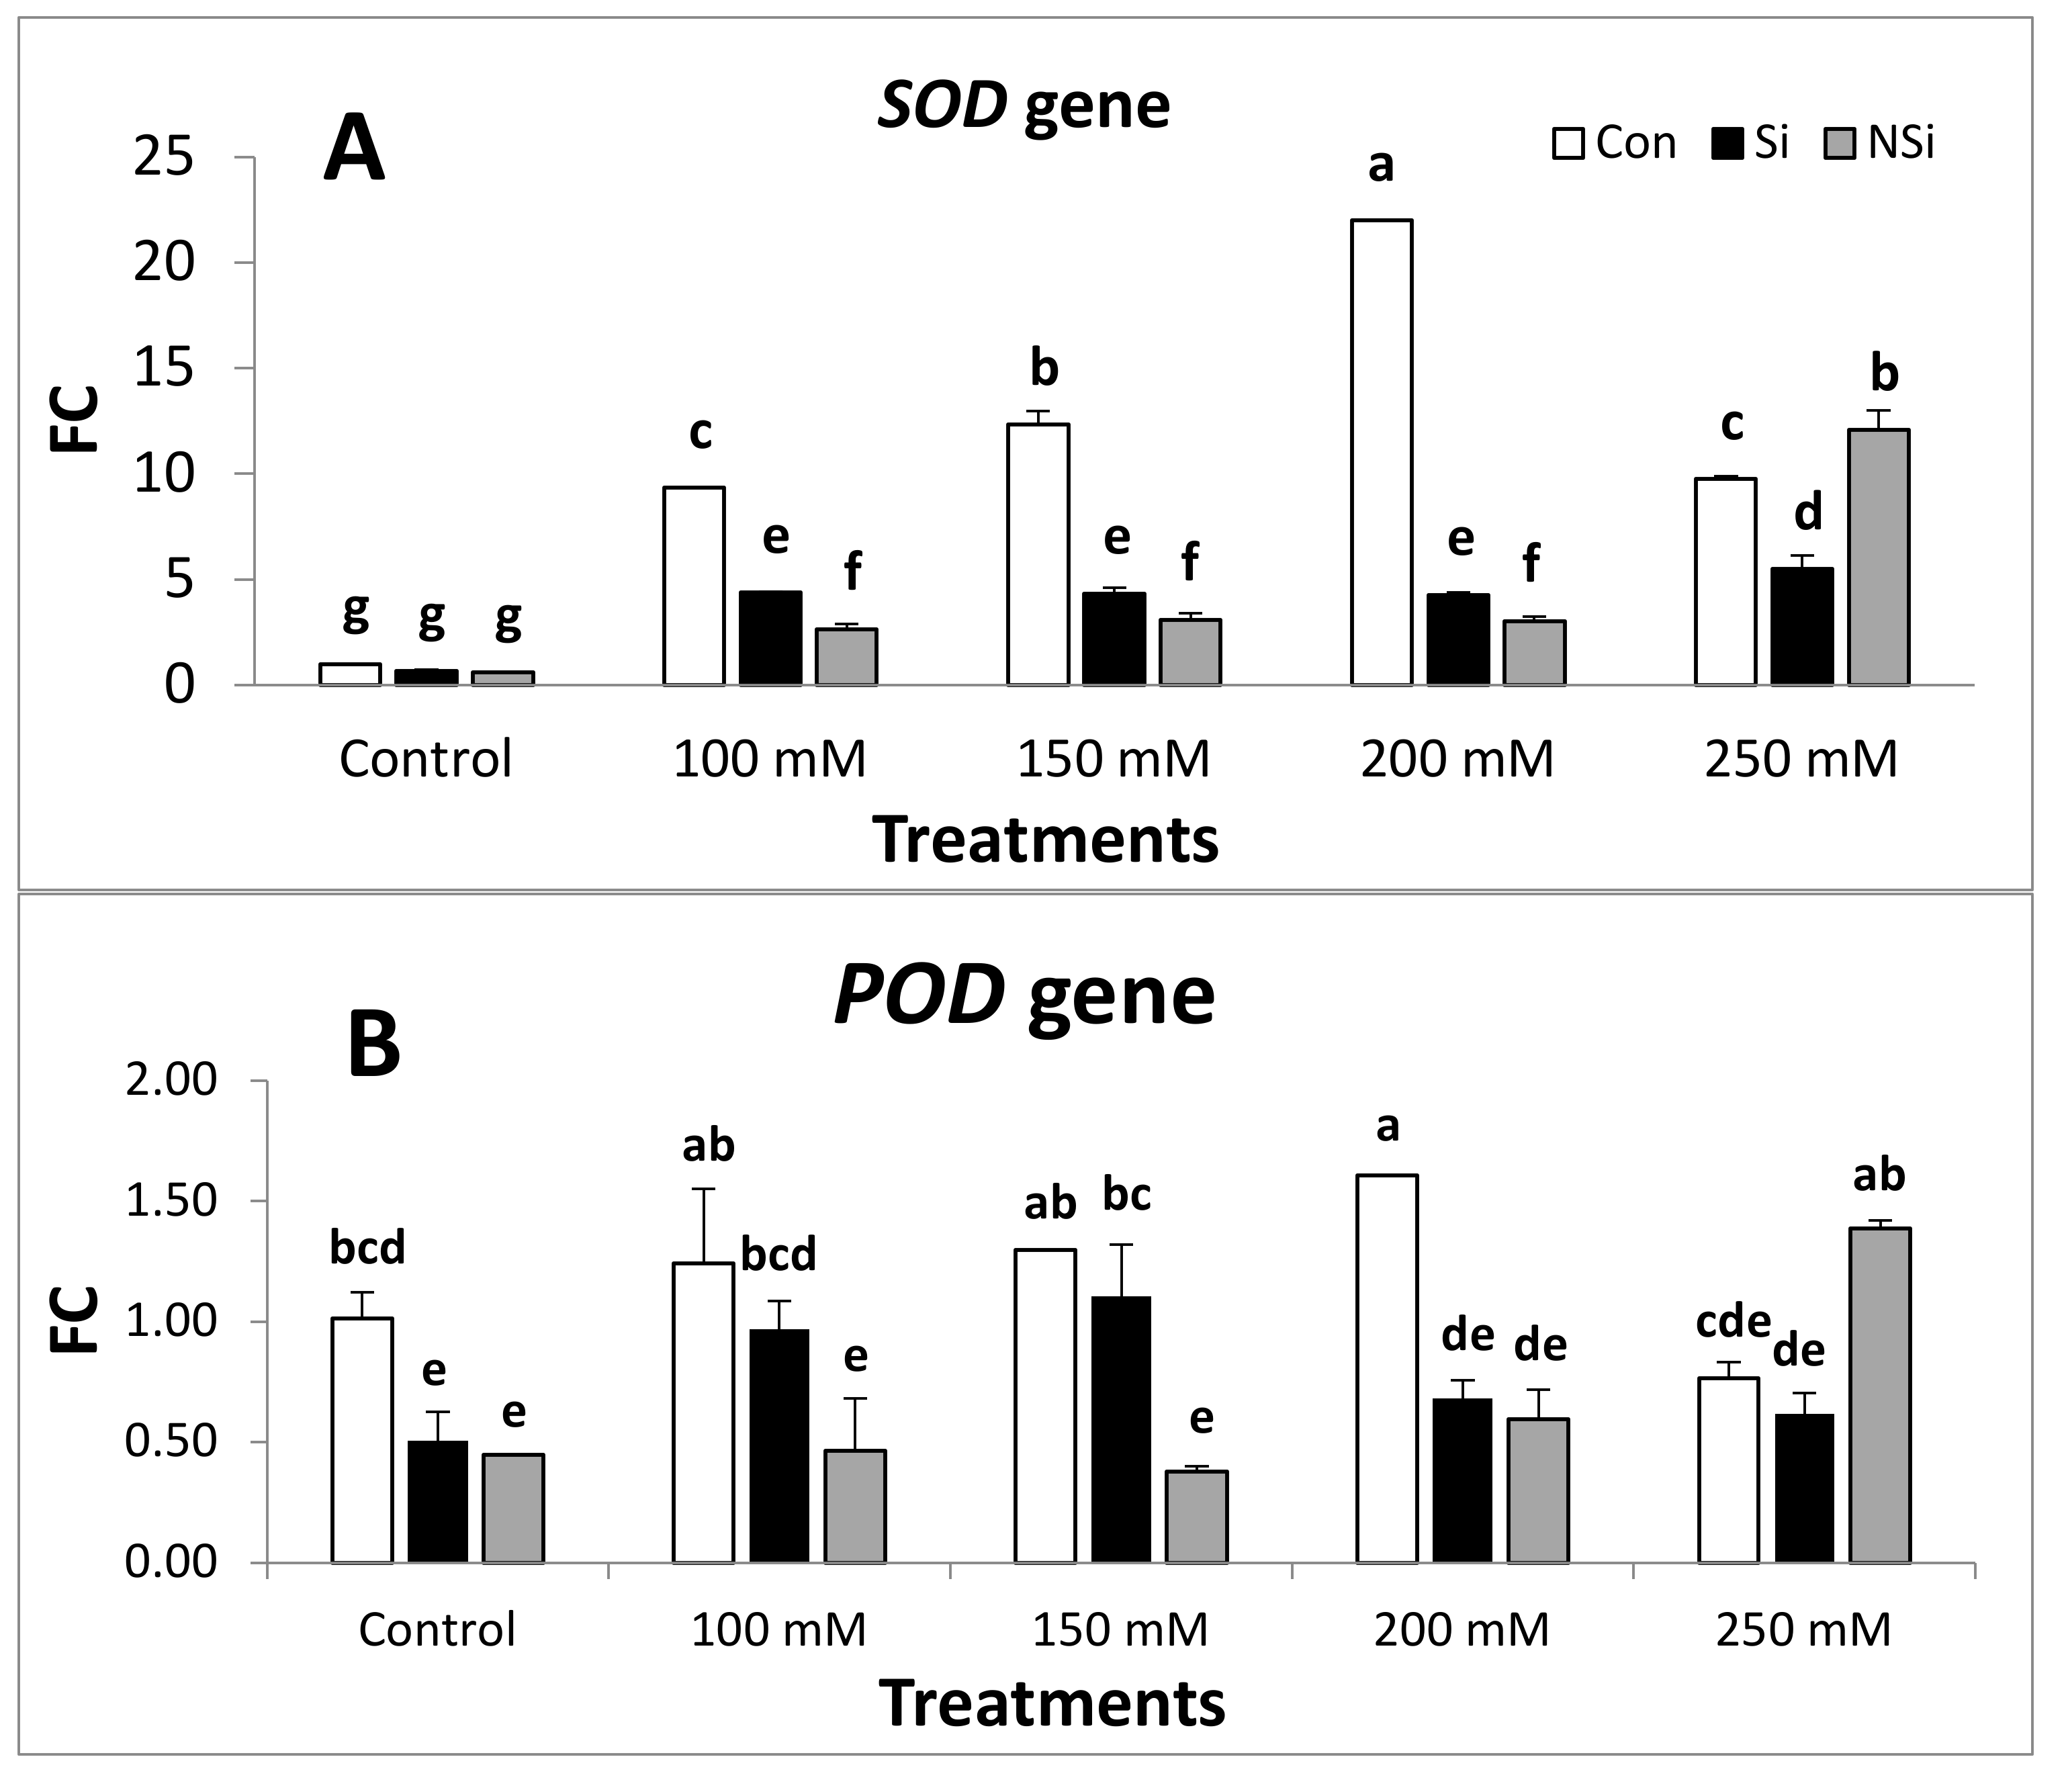
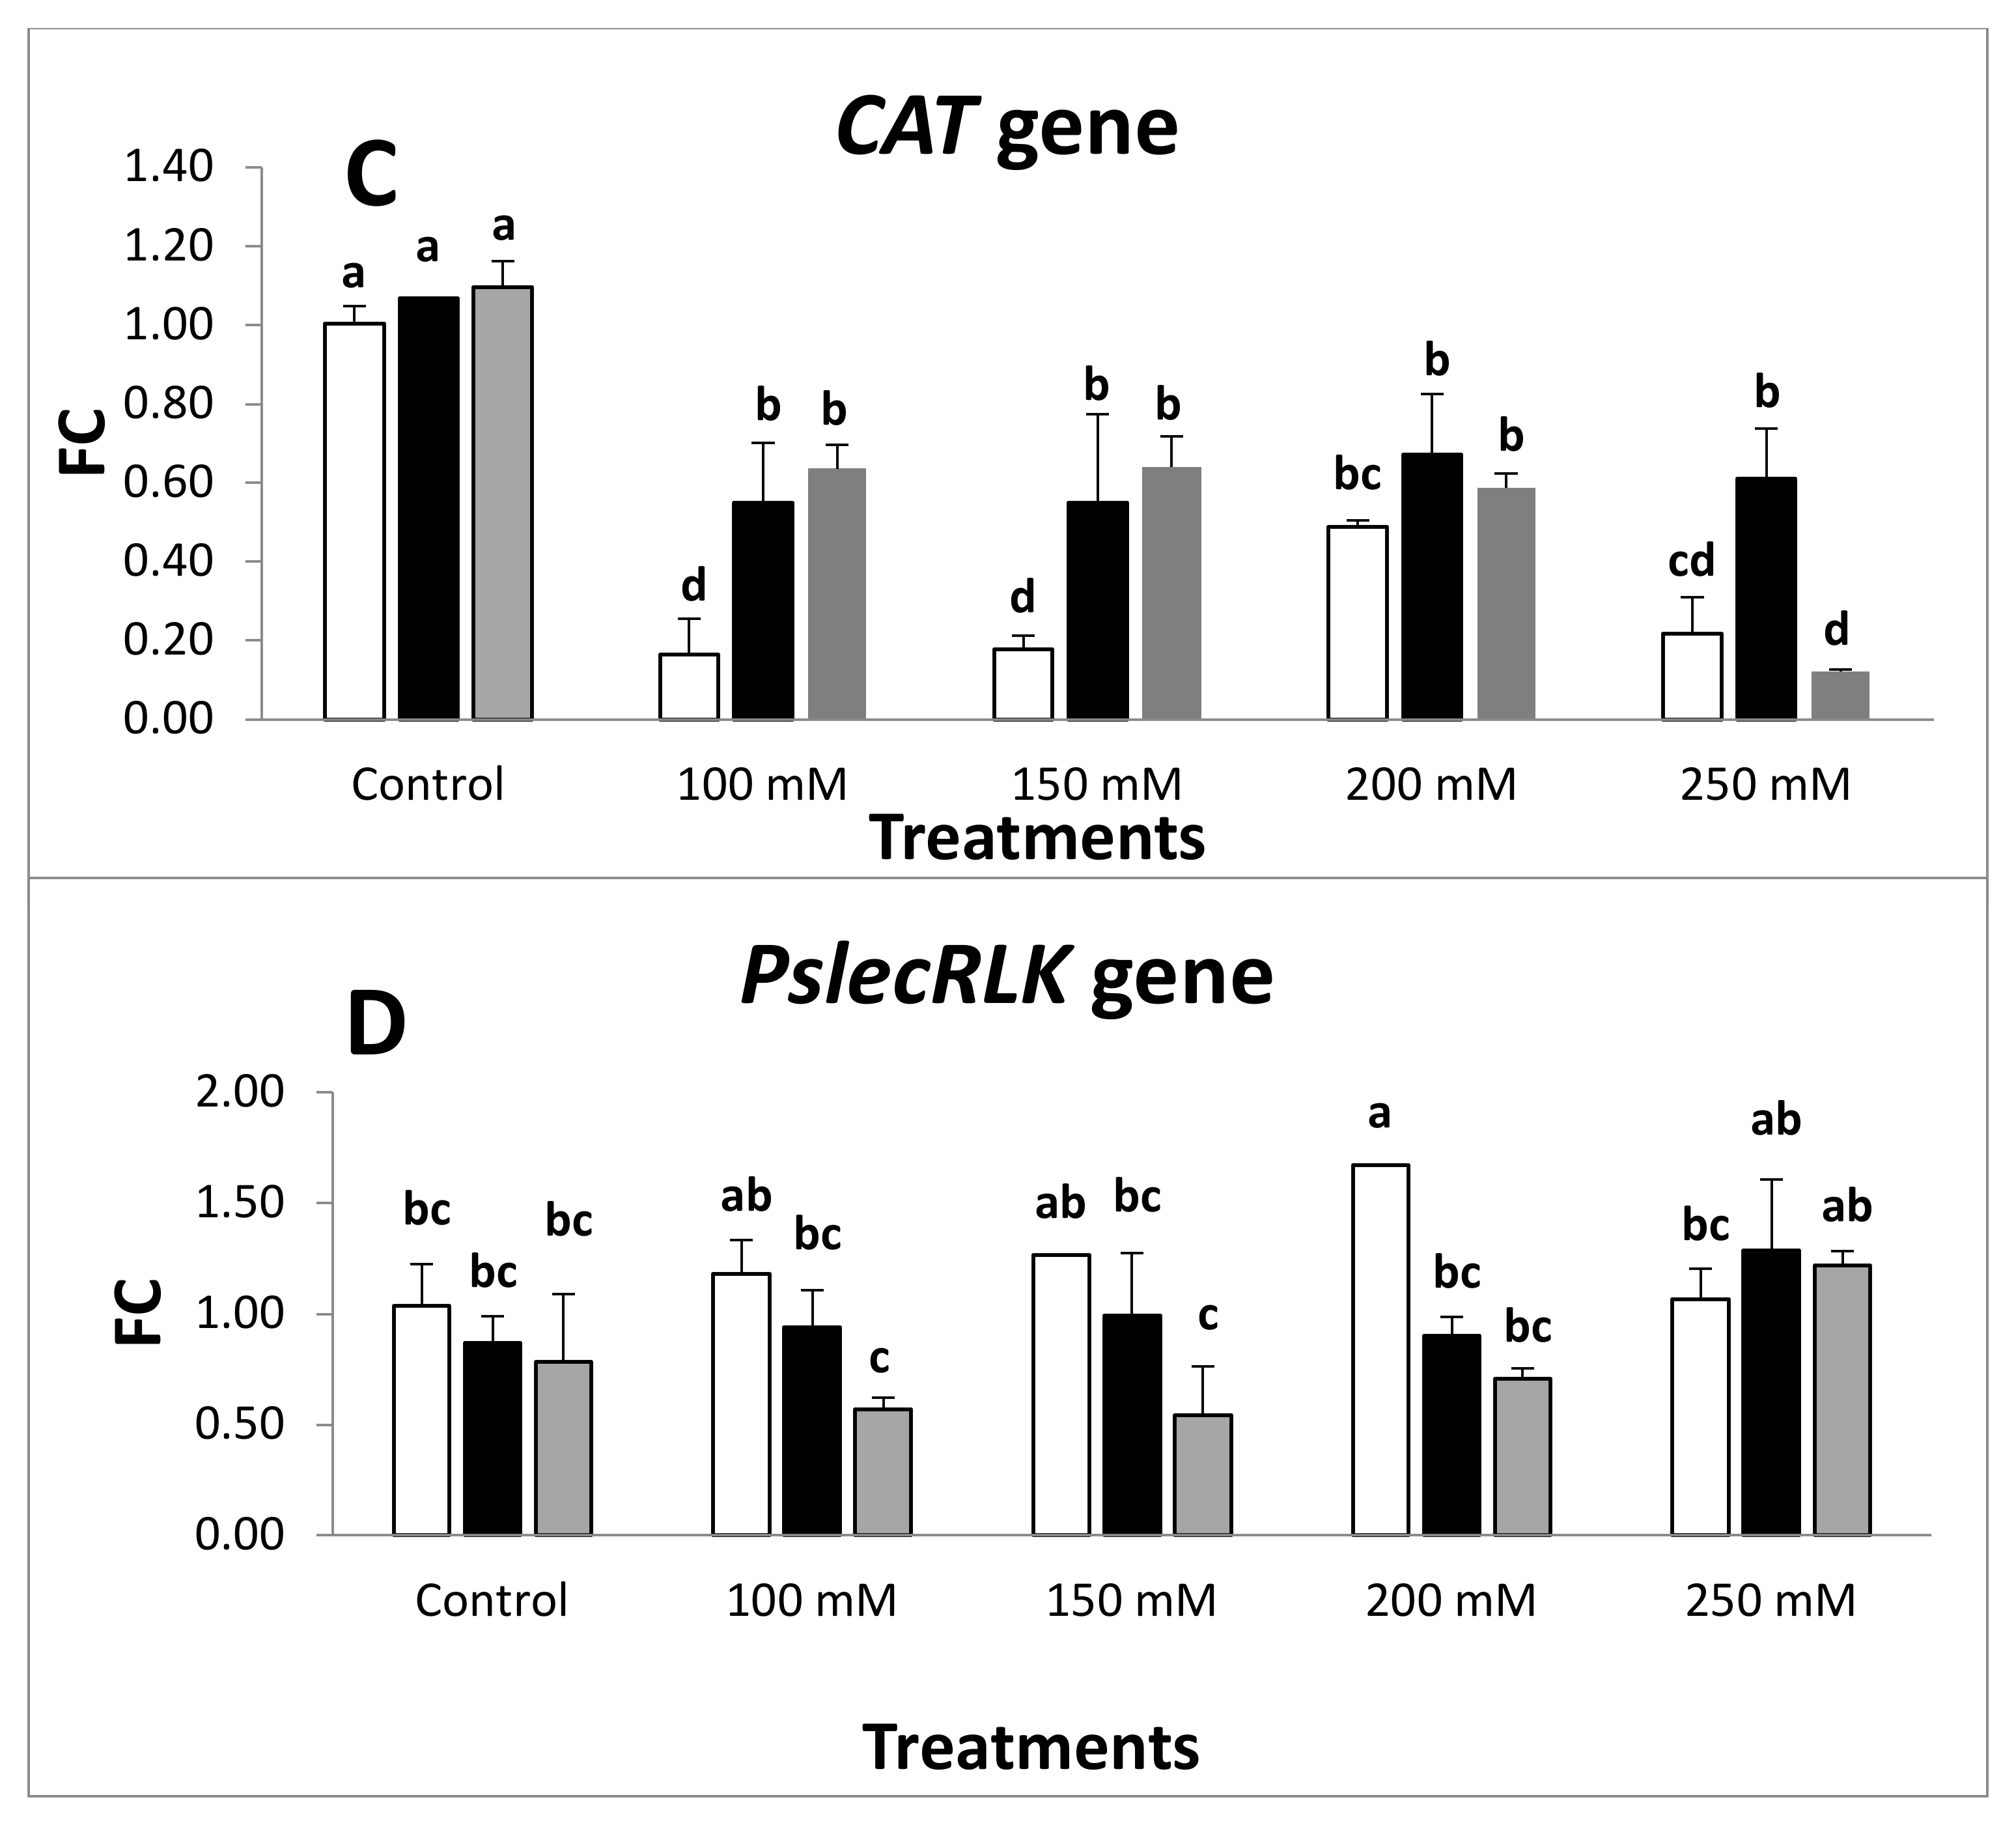
2.4. Expression of Antioxidant Defense Genes

The expression patterns of four genes: SOD, POD, CAT and PslecRLK in the leaf tissue were analyzed using qRT-PCR and the results are represented in Figure 1. Two reference genes (RGs), Act and Tub, were included to significantly stabilize gene expression level calculations from the qRT-PCR data, and the Pearson correlation analysis was made by SPSS software. The relationship between the CT-values of these two RGs was a linear and highly significant positive correlation (r = 0.836 **). Therefore, to further enhance validity and reproducibility of relative expression quantifications, the CT of a single RG in DCT was replaced with an averaged CT value from the two RG. The transcript level of the target genes was normalized by the average CT value of the two reference genes. Antioxidant defense genes showed differential expression patterns in mRNA expression under salt stress either in the presence or absence of Si and NSi.
Analysis of the SOD gene indicated that the relative transcript levels of this gene (Figure 1) was significantly upregulated in salt-stressed seedlings at all concentrations when compared with the non-stressed control seedlings. However, the application of either Si or NSi to pea seedlings under salt stress induced a significant downregulation in the expression of SOD gene when compared with the corresponding level of salinity except at 250 mM level of salinity, the application of NSi showed a significant upregulation in the expression of SOD gene when compared with 250 mM salinity treatment. Pea seedlings treated with either Si or NSi alone showed a non-significant difference in the transcript level of SOD gene when compared with control.
The analysis of POD (Figure 1) gene exhibited the same expression pattern of SOD gene and showed that the relative transcript levels of this gene was significantly upregulated in salt-stressed seedlings at all concentrations except for 250 mM was non-significantly decreased when compared with the non-stressed control seedlings. However, the application of either Si or NSi to pea seedlings under salt stress induced a significant downregulation in the expression of the POD gene when compared with the corresponding level of salinity except at 250 mM level of salinity, The application of NSi showed a significant upregulation in the expression of the POD gene when compared with the 250 mM salinity treatment. Pea seedlings treated with either Si or NSi alone showed a significant decline in the transcript level of the POD gene when compared with the control.
In contrast, an examination of the CAT gene revealed a different expression pattern (Figure 1) and showed that the expression level of this gene was significantly downregulated in salt-stressed seedlings at all concentrations when compared with the non-stressed control seedlings. However, the application of either Si or NSi to pea seedlings under salt stress induced a significant upregulation in the expression of CAT gene when compared with the corresponding level of salinity except at 250 mM level of salinity; the application of NSi showed a non-significant downregulation in the expression of CAT gene when compared with 250 mM salinity treatment. Pea seedlings treated with either Si or NSi alone showed a non-significant rise in the transcript level of the CAT gene when compared with the control.
The analysis of PslecRLK gene (Figure 1) indicated the same pattern of expression of the SOD and POD genes and indicated that the relative transcript levels of this gene was significantly upregulated in salt-stressed seedlings at all concentrations when compared with the non-treated control seedlings. However, the application of either Si or NSi to pea seedlings under salt stress induced a significant downregulation in the expression of PslecRLK gene when compared with the corresponding level of salinity except at 250 mM level of salinity; the application of Si and NSi showed a non-significant upregulation in the expression of PslecRLK gene when compared with 250 mM salinity treatment. Pea seedlings treated with either Si or NSi alone showed a non-significant decrease in the transcript level of PslecRLK gene when compared with the control.

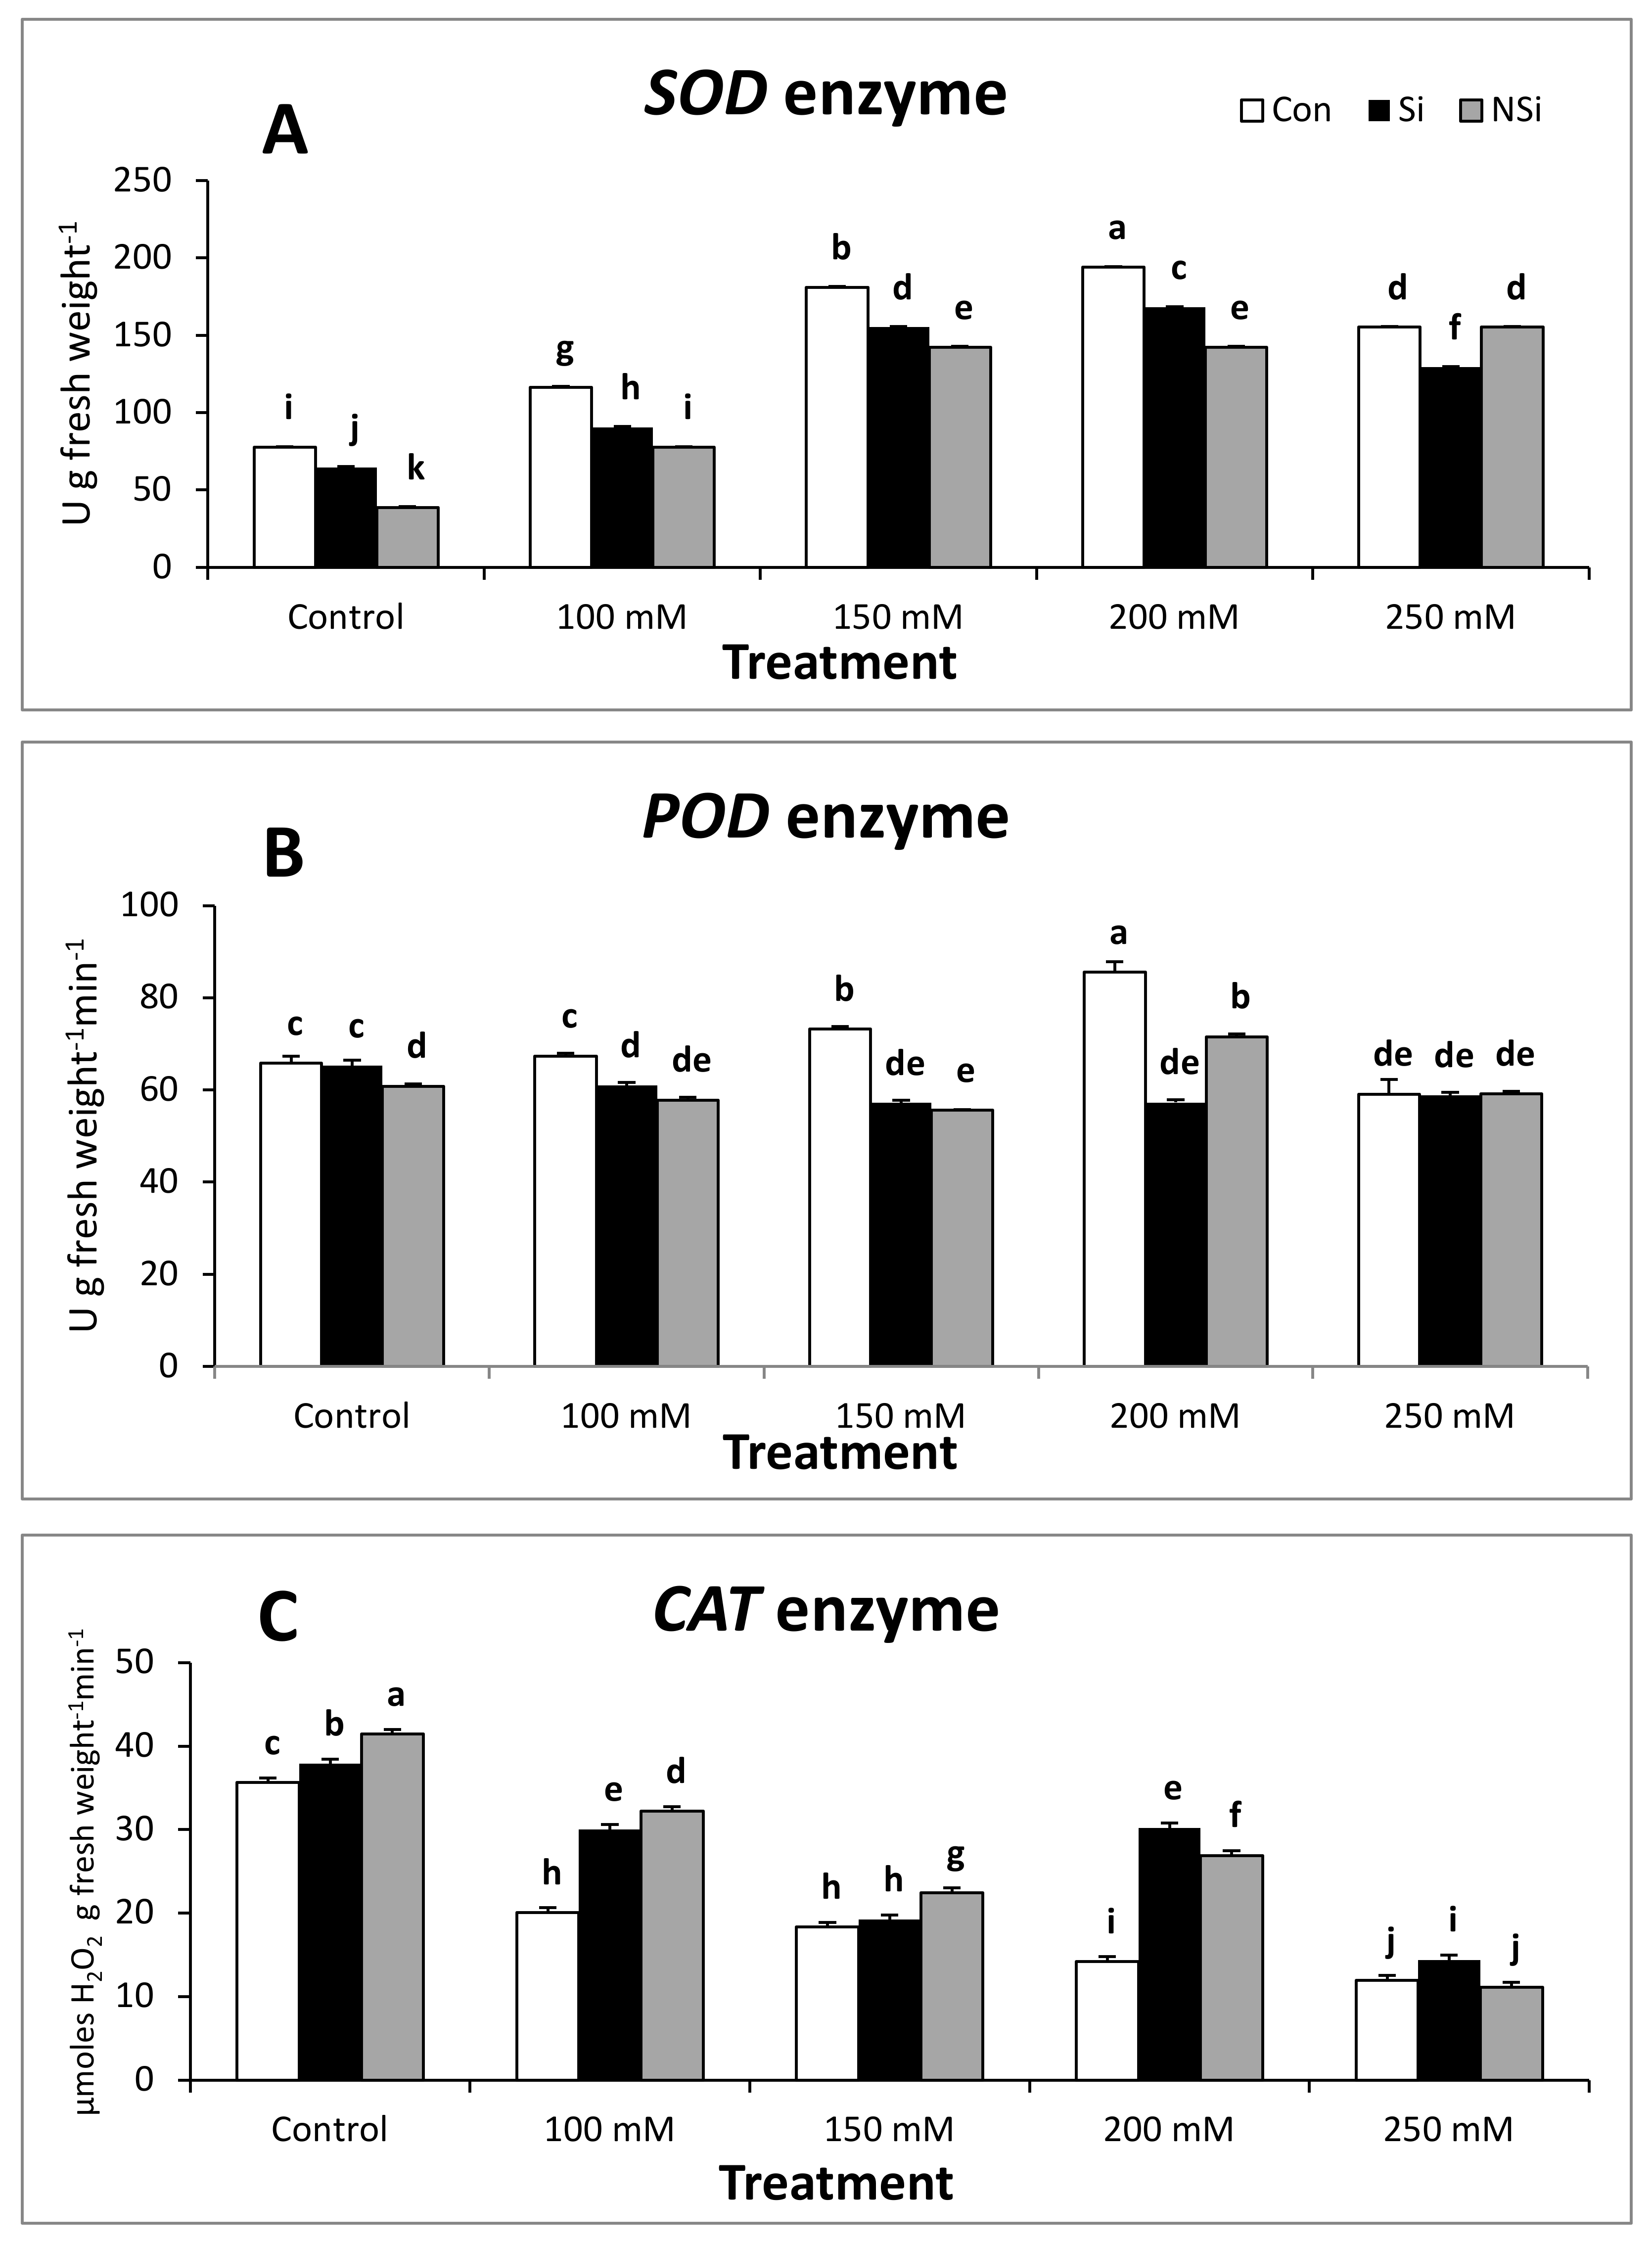
2.5. Antioxidant Enzyme Activities

The activity of SOD and POD enzymes was significantly enhanced in salt-stressed seedlings at all concentrations relative to control seedlings. However, the application of either Si or NSi to pea seedlings under salt stress induced a significant decline in the activity of SOD and POD enzymes when compared with the corresponding level of salinity. Pea seedlings treated with either Si or NSi alone showed a significant decrease in the activity of SOD and POD enzymes when compared with the control (Figure 2).
In contrast, CAT activity was significantly decreased in salt-stressed seedlings at all concentrations relative to control seedlings. However, the application of either Si or NSi to pea seedlings under salt stress ameliorated the inhibitory effect of NaCl by enhancing the activity of CAT enzyme compared with the corresponding level of salinity. Pea seedlings treated with either Si or NSi alone showed a significant increase in the activity of the CAT enzyme when compared with the control (Figure 2).

3. Discussion

Salinity stress is one of the most important environmental variables restricting the productivity of agricultural crops [39]. The results of the present study revealed that salinity had a negative effect on growth parameters measured in terms of shoot length, shoot and root fresh weight, shoot and root dry weight, and leaf area. It is also clear that relative water content (RWC) was decreased significantly with NaCl treatments. These results agree with those reported by [40,41].
The recorded suppression of plant growth under saline conditions was attributed to limited availability of water and/or to toxicity of sodium chloride [39]. Reduced dry weight under salinity stress was ascribed to inhibition of food formation and translocation, inhibition of certain metabolic processes, inhibition of chloroplast formation, production of ethylene and abscisic acid, and decreasing nutrient absorption [42]. Growth reduction due to salt-induced osmotic effect has been reported in a number of plants, such as soybean [43], pepper [44], wheat [45], and pea [46].
Although silicon (Si) is regarded as a non-essential element [47], results from some earlier studies show that the exogenous application of Si can stimulate growth of most plant species [48]. This increase in plant growth as a result of Si application not only takes place under normal growth conditions [49,50], but also under stressful conditions [51,52,53]. This effect of Si on plant growth is dose and crop specific [54]. Silicon affects plant growth under stressed conditions by affecting a number of processes, including an improvement in plant water status [55], changes in the ultra-structure of leaf organelles [56], upregulation of plant defense systems [26], and mitigation of the specific ion effect of salt [57].
In the present study, application of Si significantly increased the growth and morphological attributes of pea seedlings under salt treatments. This silicon-induced improvement in plant growth under salt stress may be due to the significant role of Si in the improvement of plant water status [55]. Such beneficial effects of Si on plant biomass production under salt stress as well as non-saline conditions were also detailed in some other plant species such as wheat (Triticum aestivum) [57], mesquite (Prosopis juliflora) [58], and zinnia (Zinnia elegans) [59], indicating the beneficial effects of Si application in alleviating salt-induced inhibitory consequences on plant growth.
It is important to consider the role of Si in plant water status when analyzing the beneficial effect of Si under saline growth conditions, because the initial decline in plant growth after salt imposition is due to the osmotic effect of salts [60]. The ability of a plant to retain water under saline growth conditions can improve tissue tolerance mitigating an excessive ion concentration by a dilution effect [61]. It was obvious that water content of NaCl treated plants was increased with Si and NSi treatments, but the increase in shoot and root water content under NSi treatments was more observed than that recorded with Si treatments. In this regard, it was reported [62] that the application of Si improved water economy and dry matter yield of wheat plants. Some evidence shows that silicon may be involved in the osmotic adjustment of numerous plant species [63]. In this regard, it was demonstrated that in Vicia faba the treatment of 75 and 100 mM NaCl plus 1 mM silicon increased biomass to 14% and 18% compared with the salt treatment without silicon [64].
Among others, one important factor inducing the deleterious effects of salt is the physiological drought generated by the high NaCl concentration in the apoplast [65,66]. It is known that silicon is actively absorbed through the roots in the form of uncharged monosilicic acid, and is then passively transported by the transpiration stream, and irreversibly precipitated as SiO2-nH2O in cells walls and cell lumens of all plant tissues [67,68]. Thus, the ameliorative effect of silicon could be related to the hydrophilic nature of silicone. SiO2-nH2O deposition could help to keep water, to dilute salts and to protect tissues from physiological drought. Thus, most likely, silicate crystal deposition beneath the epidermal cells of leaves and stems could have reduced water loss in pea as has been shown in other crops such as rice, sugarcane, turfgrass, or tomato. The higher plant water content of salinized plants treated with Si could have contributed to salt dilution and consequently to reduce deleterious effects of saline ions thus explains the increase in plant growth [68].
In the present study, the vegetative growth and morphological attributes of salt-treated pea plants were increased with Si and NSi treatments but the increase under NSi treatments was more observed than that recorded with Si treatments. Particle size is of great importance in particle adhesion and interaction with biological cells [69] as well as in the pathway of cellular uptake [70]. Furthermore, a strong relationship was found between the extent of particle uptake and particle size. However, the role of nanoparticles and their modes of action in plant growth and development are not yet well known. Their high surface to volume ratio increases their reactivity, and it is possible that the biochemical activity of nanoparticles might play a role in their action [71]. Nano silica is more easily absorbed by plants than inorganic silica, thus justifying the greater protective effect of SiNp than Si under salt stress in pea seedlings [72].
Yield components of pea such as pod length, pod weight, number of pods per plant, number of seeds per pod, and total seed yield per plant all play an important role in determining the final crop yield. The reduction in yield attributes noted in the current study under NaCl stress may be attributed to the inhibitory effects of salinity on some metabolic processes in plant tissues [42]. It was shown that at the high salinity level, salts may build up in the apoplast and dehydrate the cell and suppress enzymes involved in carbohydrate metabolism in cytoplasm or may exert a direct toxic effect in chloroplast and photosynthetic processes [39]. It has already been reported that salt stress causes a reduction in the yield of various crops [73,74]. The reduction in total seed weight under saline stress may be ascribed to the inhibition in uptake and transfer of nutrition materials during the growth of grains and their filling periods. Moreover, salinity may cause severe damage to the ovary, resulting in fruit drop and a reduction in yield [39].
On the other hand, Si and NSi applications significantly overcame the adverse effects of salinity stress and increased all yield components in both saline treated or untreated plants (Table 3). In this respect, silicon was reported to enhance growth and yield of many of higher plants particularly under biotic and abiotic stresses [57,75]. A number of possible mechanisms are proposed by which Si can enhance the resistance of plants against salt stress, which is the major yield limiting factor in arid and semiarid areas [75]. The increase in seed yield after silicon amendment in mild saline conditions may indicate an improvement in the translocation of minerals and metabolites necessary for seed setting. The role of silicon as a beneficial mineral nutrient for reproductive growth of plant is well documented [76]. Generally, Increased K+ uptake and decreased Na+ uptake by Si treatments was reported to be the major mechanisms responsible for better growth and yield of plants under salinity [27].
The harvest index (HI) and crop index (CI) were decreased with increasing salinity levels. However, the harvest index values were increased with Si and NSi treatments under different salt treatments. In this regard, it was stated that abiotic stress decreased the harvest index [77]. Silicon treatment, on the other hand, improved the harvest index of different crops under salinity stress [78]. Furtheremore, it was found that under salt stress conditions, Si treatments increased yield, yield components, and the harvest index of pea crops [75,79]. The present study displayed that NSi treatments were the most effective in reducing the negative effect of salinity on the harvest index. In another study [80], researchers found that water deficit stresses decreased the harvest index while titanium dioxide nanoparticles caused the maximum harvest index, whereas titanium oxide (bulk) and control treatments were similar.
The generation of reactive oxygen species (ROS) by plants is a common phenomenon under stress conditions. These stress-generated ROS damage macromolecules, such as DNA, proteins, and lipid structures [81]. To scavenge ROS, plants have an internal protective enzyme catalyzed clean-up system, thus ensuring normal cellular function [16]. Thus, the observed increase in SOD and POD activities in pea plants under salinity stress may be due to the endogenous defense mechanisms activated by plants to mitigate oxidative stress-associated damage [82]. The results of the present study are in accordance with the findings of [83] who found that SOD and POD enzyme activities were increased in Pisum sativum seedlings grown from NaCl-treated (1 or 10 mM) seeds. Similarly, it was found that the activities of antioxidant enzymes superoxide dismutase (SOD), ascorbate peroxidase (APX), and catalase (CAT) were up-regulated in pea plants under salinity stress [16]. Likewise, [84] analyzed the antioxidant enzyme activity in pea and found a prominent increase in SOD, POD and CAT under saline mediums.
However, the application of either Si or NSi to pea seedlings under salt stress induced a significant decline in either the relative transcript level or the activity of SOD and POD enzymes when compared with the corresponding level of salinity. Si application in crops during abiotic stress conditions can regulate ROS generation [85]. It was shown that silicon (Si) application to rice root zones influenced the hormonal and antioxidant responses under salinity stress. The results showed that Si treatments significantly increased rice plant growth compared to controls under salinity stress. Si treatments reduced the sodium accumulation resulting in low electrolytic leakage and lipid peroxidation compared to control plants under salinity stress [86]. Enzymatic antioxidant (catalase, peroxidase, and polyphenol oxidase) responses were more pronounced in control plants than in Si-treated plants under salinity stress [86]. It was observed that the application of Si in rice plants under salinity stress significantly decreased the activities of non-enzymatic MDA and enzymatic antioxidants POD, PPO, and CAT [87]. On the other hand, it was observed that when they applied Si to borage plants, SOD activity was significantly increased but activity of CAT and APX was slightly decreased [88].
In soil, Silicon (Si) is the second most abundant element. Even though Si is present in soil in different forms, plants can easily absorb silicic acid Si(OH)4 from soil. After being absorbed from the soil into the root, it gets translocated to the shoot area via the xylem, where it can stimulate various physiological responses, such as plant growth and development [48,89], enzymatic activity [48,90], and gene expression [91]. After uptake, Si accumulates on the epidermis of many tissues primarily as a polymer of hydrated amorphous silica [53]. In leaves, silicic acid is converted into insoluble silica which accumulates just beneath the cuticle [92], forming a Si-cuticle double layer. It has been suggested that Si deposition in the exodermis and endodermis may reduce sodium uptake under salinity by reducing apoplastic transport across the root [25,93]. Silica deposition in the leaf reduces transpiration and any decreases in transpiration could reduce sodium uptake [25].
Most of the beneficial effects of Si in mitigating abiotic stresses, such as salt stress, are attributed to Si deposition in the cell walls of roots, leaves, stems and hulls [94]. For example, deposition of Si in the roots reduces apoplastic bypass flow and provides binding sites for metals, resulting in decreased uptake and translocation of toxic metals and salts from the roots to the shoots [94]. Saline ions are continuously transported to the aboveground plant by transpirational flow, inducing deleterious effects in the tissues when the saline ion content reaches a toxic threshold. Any factor that can delay attainment of the toxic threshold is important for increasing tolerance to salinity [94]. It was reported that silica deposition in the leaf limits transpiration in Prosopis juliflora and wheat, and thus, salt accumulation [21,58]. It was suggested that silicate crystals deposited in epidermal cells form a barrier that reduces water loss through the cuticles [95]. The ability of a plant to retain water under saline growth conditions can improve tissue tolerance, alleviating an excessive ion concentration by a dilution effect [61]. The higher plant water content of salinized plants treated with Si could have contributed to salt dilution, and consequently reduced the deleterious effects of saline ions.
Thus, the decrease in in the activity of SOD and POD enzymes observed in the present study following Si application could be related to salt dilution as a consequence of the higher water content we found in salinized pea plants treated with Si, which may result from Si deposition in the cell walls and endodermis, thereby reducing Na+ uptake through a reduction in apoplastic transport across the root and its translocation to the shoots [93].
In contrast, the relative transcript level and the activity of CAT were significantly decreased in salt-stressed seedlings relative to the control. Similar results were reported in soybeans [96]. The decline in CAT activity under salinity has been reported by several researchers [97], which ultimately leads to oxidative stress [98,99]. The decline of CAT activity under stressful condition may be due to a reduced rate of protein turnover [97]. It could also be attributed to enhancement of H2O2 levels [100]. Reduced growth of the salt-treated pea plants might have resulted from alterations to the activity of this ROS-scavenging enzyme. However, the application of either Si or NSi to pea seedlings under salt stress induced a significant rise in the activity of CAT enzyme. Higher catalase activity under salinity following Si application has already been observed in tomato, barley, and canola plants [27,29,90,101]. One of the adaptive traits under salinity stress is an increase in catalase (CAT) activity which reduces the toxic levels of H2O2 and protects the cell from oxidative damage [102]. It was concluded that Si supplemented plants showed resistance to abiotic stress through lowering ROS production by enhancing CAT and APX activities, as both are involved in the conversion of H2O2 into H2O [103].

4. Materials and Methods

4.1. Plant Material and Growth Conditions

Seeds of pure strain of pea (Pisum sativum L. cv. Intisar 1) were kindly provided by the Central Administration for Seed Production, Horticulture Research Institute, Agriculture Research Center, Ministry of Agriculture, Giza, Egypt. Silicon used was in the form of sodium silicate (commercially available). Powdered SiO2 nanoparticles were purchased from NanoTech Egypt for Photo-Electronics (size 5–9 nm). A pot experiment was conducted in three seasons in the Botanic Garden of the Faculty of Agriculture, Mansoura University in the periods from November 2018 to February 2019, November 2019 to February 2020 and November 2020 to February 2021 under natural environmental conditions (mean temperature 24 ± 2 °C and relative humidity 60%).
Healthy and proximate equal-sized seeds of pea (Pisum sativum L. cv. Intisar 1) were selected, pretreated with 0.001M mercuric chloride (HgCl2) solution for 1 min for seed surface sterilization, and then washed thoroughly with tap water and soaked for 3 h in tap water. Seeds were sown in clean plastic pots (22 cm in diameter) containing clay-sandy soil (2:1 v/v). All pots contained equal amounts (7 kg) of homogenous soil in which 10 seeds were planted. Pots were divided into three groups. The first group was left as control. The second group was for Si treatment. The third group was for NSi treatment. Silicon and Silica (Silicon Dioxide) Nanoparticles were soil applied both at a concentration of 3 mM (This concentration was determined to be optimum for growth of pea plants in preliminary expermints). After two weeks from sowing and when the seedlings reached the second leaf stage of growth, the soil in the first group was irrigated to field capacity (500 mL) with water while the soil in the second group was supplied with 500 mL of sodium silicate solution whereas in the third group, the soil was added with 500 mL nano silica suspension. The treatments were applied for 2 weeks (every 5 day). After 5 days from the last treatment and at the fifth leaf stage, each group was divided into five subgroups according to salt irrigation as follows: 0, 100, 150, 200, and 250 mM NaCl solution. Thus, a total of fifteen treatments represented all planned possible applications of penta-replicated in a completely randomized design. Each treatment was represented by five replicates (each replicate was one pot containing six plants). Salt treatments were imposed to 30-day-old seedlings by adding 250 mL NaCl solution to the soil. The salt irrigation persisted for 2 weeks (5 day interval). The harvest of the vegetative stage was performed after 15 days of the salt treatment; plant samples were collected for estimation of growth parameters, estimation of ions, estimation of antioxidant activity and biochemical and gene expression analyses.
The remaining seedlings were allowed to reach to flowering stage and yield stage. All pots were irrigated with tap water according to the usual practice and maintained at room temperature.
It should be mentioned that the results for growth and yield components and analysis of the wide array of metabolites either at vegetative stage, flowering stage or yield obtained in the three large-scale experiments were remarkably close, thus only the mean values obtained from the three large-scale experiments will be presented in the corresponding tables and figures given in this study.

4.2. Estimation of Growth and Yield Parameters

Growth was assessed in terms of shoot and root length, shoot and root fresh weight, shoot and root dry weight, number of leaves/plant, and leaf area/plant. Seedlings were selected randomly from control and treated samples, divided into root and shoot and their lengths were measured using a meter scale. After recording the root and shoot fresh weights with the help of an electronic balance, the samples were oven-dried at 80 °C for 48 h to determine the dry weight. Leaf area was measured using image j.
Yield was measured in terms of shoot length, plant height, pod length, pod weight, crop yield/plant, number of pods/plant, number of seeds/pod, seeds weight/pod, total seed yield/plant, straw yield, harvest index, crop index and mobilization index:
Harvest index = economic yield (seed yield)/straw yield [104];
Crop index = seed yield/biological yield (seed yield+ straw yield) [104];
Mobilization index = crop index/straw yield [105].

4.3. Estimation of Ions

Ions contents were measured according to the method described in [106]. Oven-dried roots and shoots of pea plants (vegetative stage) were ground into a fine powder. For the wet digestion, 10 cm3 of conc. HNO3 were added to a known weight of each dry ground sample and the mixture was heated at 80–90 °C on a hotplate in a fuming hood. Heating was continued until the production of red NO2 fumes ceased. The contents were further heated until the volume was reduced to 3–4 cm3 and became colourless, but it should not be dried. After cooling the contents, the volume was made up with distilled water and filtered through Whatman No. 1 filter paper. This solution was used for nutrient estimation. Na and K contents were analyzed by a flame photometer (Jenway-PFP7, Essex, UK).

4.4. Gene Expression Analysis

At the end of the vegetative stage, fresh leaf samples were collected, covered with aluminum foil, frozen immediately in liquid nitrogen, and stored at −80 °C until used for gene expression analysis using Quantitative Real-Time PCR (qRT-PCR). Total RNA was isolated from leaf samples using RNeasy Plant Mini Kit (Qiagen GmbH, Hilden, Germany). The concentration and purity of the RNA were assayed spectrophotometrically at 260 and 280 nm (Nanodrop Technologies, Wilmington, DE, USA). The total RNA was then evaluated for quality on an agarose gel. For RT-PCR, first-strand cDNA was reverse transcribed from 1 μg RNA with oligo (dT) primers, using a RevertAid First Strand cDNA Synthesis Kit (Fermentas GmbH, St. Leon-Rot, Germany) according to the manufacturer’s instructions. Based on previous studies, gene-specific primers were synthesized and used to amplify cDNA of target and reference genes of interest in RT-PCR reaction. Primer sequences of the salt stress-related genes (target genes) and two housekeeping genes (Actin and tubulin) as reference genes in pea plants are presented in Table 5. RT–PCR was carried out in triplicates on the iCycler Thermal Cycler (Bio-Rad Laboratories, Hercules, CA, USA) using the Maxima SYBR Green/ROX qPCR Master Mix (2X) manufacturer’s instructions. The conditions for PCR amplification were 95 °C for 10 min; 40 cycles of 95 °C for 15 s and 60 °C for 60 s. Melting curve analysis was applied to test the amplification specificity, this curve was conducted from 55 °C to 95 °C to confirm the amplification of a single amplicon. Cycle threshold (CT) values from housekeeping (Act and tub) pea genes were used for qRT-PCR data normalization and the relative expression levels were determined using 2−∆∆Ct method [107].

4.5. Estimation of Antioxidant Enzyme Activities

4.5.1. Enzyme Extraction

Crude enzyme extracts were prepared by grinding 0.2 g of 45-day-old fresh pea leaves from control and treated seedlings in 2 mL of chilled 0.02 M phosphate buffer (pH 7) using a pre-chilled mortar and pestle. The homogenate was transferred to falcon tubes and the volume was adjusted to 11 mL. The tubes were then centrifuged at 5000 rpm for 10 min at 4 °C. The resulting supernatant served as the enzyme extract for the determination of SOD, CAT, POD activities [108].

4.5.2. Estimation of Superoxide Dismutase Activity (SOD, EC1.11.1.7)

In the present study, SOD activity was estimated according to the method of [109]. As applied by [78], one SOD activity enzyme unit is classified as the level of enzyme needed to inhibit nitro-blue-tetrazolium (NBT) reduction at 560 nm by 50%. To start the reaction, the reaction mixture comprised of: 1 cm3 of working buffer (50 mM phosphate buffer; pH 8.5), 1 cm3 of 1 mM NBT and 1 cm3 of 1 mM NADH, 0.1 cm3 of enzyme extract, blended well, and 0.1 cm3 of 0.1 mM of phenazine methosulphate. SOD activity was measured by considering the ability of the enzyme extract to inhibit NBT photochemical reduction.

4.5.3. Estimation of Peroxidase Activity (POD, EC1.11.1.7)

Peroxidase catalyzes the oxidation of various hydrogen donors in the presences of H2O2, Peroxidase activity was assayed by the method of [110].1 mL of enzyme extract was added to 3 mL of pyrogallol in 0.1 M phosphate buffer and 0.5 mL of 1% H2O2. The mixture was shaken well and incubated for 1 min. the reaction was terminated by the addition of 1 mL of 2.5M H2SO4. The absorbance was read at 420 nm against the blank to determine the amount of formed purpurogallin. The enzyme activity was expressed in units. One unit was defined as unit per g fresh weight per min.

4.5.4. Estimation of Catalase Activity (CAT, EC1.11.1.6)

Catalase (CAT) activity was assayed by the method of [111]. The enzyme extract (0.5 mL) was added to the reaction mixture containing 1 mL of 0.01 M phosphate buffer (pH 7.0), 0.5 mL of 0.2 M H2O2, 0.4 mL H2O and incubated for one minute. The reaction was terminated by the addition of 2 mL of acid reagent (5% potassium dichromate/glacial acetic acid mixture, 1:3 by volume). To the control, the enzyme was added after the addition of acid reagent. All the tubes were heated for 10 min and the absorbance was read at 610 nm. Catalase activity was expressed in μmoles of H2O2 consumed/min/g fresh tissue.

4.6. Statistical Analysis

It should be mentioned that all the results obtained in the three experiments were remarkably close, thus only the mean values obtained from the three large-scale experiments will be presented in the corresponding tables and figures given in this study. All experimental data were subjected to analysis of variance (ANOVA) using CoStat software. ANOVA was conducted using one-way ANOVA in a fixed factor with full factorial analysis. For comparison between groups, Duncan’s test was applied at a 0.05 probability level.

5. Conclusions

It is evident that the use of nano-silicon enhanced pea crop productivity under salinity stress, with the magnitude of response being evident with 100 and 150 mM NaCl. Thus, we recommend the use of NSi to improve salinity tolerance of pea plants in moderately saline soils. Si appeared to nullify the harmful effects of salinity stress on pea plants at higher concentrations (200 and 250 mM NaCl). So, it is recommended to use Si in extreme saline soils to grow pea plants. Further studies are needed at the field level, and to investigate the toxicity of the used nano-silicon to animals and humans.

Author Contributions

Conceptualization, M.I.S., M.H.A.E.-A., L.M.I. and H.M.M.A.-A.; methodology, M.H.A.E.-A., L.M.I. and H.M.M.A.-A.; software, M.H.A.E.-A., L.M.I. and H.M.M.A.-A.; validation, M.I.S., M.H.A.E.-A., L.M.I. and H.M.M.A.-A.; formal analysis, M.I.S., M.H.A.E.-A., L.M.I. and H.M.M.A.-A.; investigation, L.M.I.; resources, M.I.S., M.H.A.E.-A. and H.M.M.A.-A.; data curation, M.I.S., M.H.A.E.-A., L.M.I. and H.M.M.A.-A.; writing—original draft preparation, M.I.S., M.H.A.E.-A., L.M.I. and H.M.M.A.-A.; writing—review and editing, M.I.S., M.H.A.E.-A. and H.M.M.A.-A.; visualization, M.I.S., M.H.A.E.-A. and H.M.M.A.-A.; supervision, M.I.S., M.H.A.E.-A. and H.M.M.A.-A.; project administration, M.I.S., M.H.A.E.-A. and H.M.M.A.-A. All authors have read and agreed to the published version of the manuscript.

Funding

This research received no external funding.

Institutional Review Board Statement

Not applicable.

Informed Consent Statement

Not applicable.

Data Availability Statement

The data presented in this study are available in this article.

Conflicts of Interest

The authors declare no conflict of interest.

References

  1. Taha, R.S.; Seleiman, M.F.; Alhammad, B.A.; Alkahtani, J.; Alwahibi, M.S.; Mahdi, A.H.A. Activated Yeast Extract Enhances Growth, Anatomical Structure, and Productivity of Lupinus termis L. Plants under Actual Salinity Conditions. Agronomy 2021, 11, 74. [Google Scholar]
  2. Zheng, L.; Shannon, M.C.; Lesch, S.M. Timing of salinity stress affecting rice growth and yield components. Agric. Water Manag. 2001, 48, 191–206. [Google Scholar] [CrossRef]
  3. Zayed, B.A.; Okasha, A.M.; Rashwan, E. Impact of different rates of phosphoric acid foliar applicationing on rice growth and yield traits under normal and saline soils conditions. J. Agric. Life Sci. 2019, 2, 56–66. [Google Scholar]
  4. Dahl, W.J.; Foster, L.M.; Tyler, R.T. Review of the health benefits of peas (Pisum sativum L.). Br. J. Nutr. 2012, 108 (Suppl. 1), S3–S10. [Google Scholar] [CrossRef] [Green Version]
  5. Tulbek, M.C.; Lam, R.S.H.; Wang, Y.C.; Asavajaru, P.; Lam, A. Pea: A sustainable vegetable protein crop. In Sustainable Protein Sources; Nadathur, S.R., Wanasundara, J.P.D., Scanlin, L., Eds.; Academic Press: San Diego, CA, USA, 2016; pp. 145–164. [Google Scholar]
  6. Kosev, V.; Pachev, I. Genetic improvement of field pea (Pisum sativum L.) in Bulgaria. Ratar. Povrt. Field Veg. Crop Res. 2010, 47, 403–408. [Google Scholar]
  7. Omokanye, A.T.; Kelleher, F.M.; McInnes, A. Low-Input cropping systems and nitrogen fertilizer effects on crop production: Soil nitrogen dynamics and efficiency of nitrogen use in maize crop. Am.-Eur. J. Agric. Environ. Sci. 2011, 11, 282–295. [Google Scholar]
  8. Kocer, A.; Albayrak, S. Determination of forage yield and quality of pea (Pisum sativum L.) mixtures with oat and barley. Turk. J. Field Crops 2012, 17, 96–99. [Google Scholar]
  9. Najafi, F.; Khavari-Nejad, R.A.; Rastgar-jazii, F.; Sticklen, M. Growth and some physiological attributes of pea (Pisum sativum L.) as affected by salinity. Pak. J. Biol. Sci. 2007, 10, 2752–2755. [Google Scholar]
  10. Agami, R.A. Alleviating the adverse effects of NaCl stress in maize seedlings by pretreating seeds with salicylic acid and 24-epibrassinolide. South Afr. J. Bot. 2013, 88, 171–177. [Google Scholar] [CrossRef] [Green Version]
  11. Hussain, M.; Jang, K.H.; Farooq, M.; Lee, D.J. Morphological and physiological evaluation of Korean rice genotypes for salt resistance. Int. J. Agric. Biol. 2012, 14, 970–974. [Google Scholar]
  12. Lüchli, A.; Grattan, S.R. Plant growth and development under salinity stress. In Advances in Molecular Breeding Toward Drought and Salt Tolerant Crops; Jenks, M.A., Hasegawa, P.M., Jain, S.M., Eds.; Springer Nature: Cham, Switzerland, 2007; pp. 1–32. [Google Scholar]
  13. Gupta, B.; Huang, B. Mechanism of salinity tolerance in plants: Physiological, biochemical, and molecular characterization. Int. J. Genomics 2014, 2014, 701596. [Google Scholar] [CrossRef]
  14. Shalata, A.; Neumann, P.M. Exogenous ascorbic acid (vitamin C) increase resistance to salt stress and reduces lipid peroxidation. J. Exp. Bot. 2001, 52, 2207–2211. [Google Scholar] [CrossRef] [PubMed]
  15. Younis, M.E.; Hasaneen, M.N.A.; Kazamel, A.M.S. Plant growth, metabolism and adaptation in relation to stress conditions. XXVII. Can ascorbic acid modify the adverse effects of NaCl and mannitol on amino acids, nucleic acids and protein patterns in Vicia faba seedlings? Protoplasma 2009, 235, 37–47. [Google Scholar] [CrossRef] [PubMed]
  16. Singh, R.; Hemantaranjan, A.; Patel, P.K. Salicylic acid improves salinity tolerance in field pea (Pisum sativum L.) by intensifying antioxidant defense system and preventing salt-induced nitrate reductase (NR) activity loss. Legume Res. 2015, 38, 202–208. [Google Scholar] [CrossRef]
  17. Wang, W.; Vinocur, B.; Altman, A. Plant responses to drought salinity and extreme temperatures: Towards genetic engineering for stress tolerance. Planta 2003, 218, 1–14. [Google Scholar] [CrossRef] [PubMed]
  18. Sarkar, R.K.; Mahata, K.R.; Singh, D.P. Differential responses of antioxidant system and photosynthetic characteristics in four rice cultivars differing in sensitivity to NaCl stress. Acta Physiol. Plant. 2013, 35, 2915–2926. [Google Scholar] [CrossRef]
  19. Meena, V.D.; Dotaniya, M.L.; Coumar, V.; Rajendiran, S.; Kundu, S.; Subba Rao, A. A Case for silicon fertilization to improve crop yields in tropical soils. Biol. Sci. 2014, 84, 505–518. [Google Scholar] [CrossRef] [Green Version]
  20. Kafi, M.; Rahimi, Z. Effect of salinity and silicon on root characteristics, growth, water status, proline content and ion accumulation of purslane (Portulaca oleracea L.). Soil Sci. Plant Nutr. 2011, 57, 341–347. [Google Scholar] [CrossRef]
  21. Ahmad, R.; Zaheer, S.H.; Ismail, S. Role of silicon in salt tolerance of wheat (Tritium aestivum L.). Plant Sci. 1992, 85, 43–50. [Google Scholar] [CrossRef]
  22. Liang, Y.C.; Shen, Q.R.; Shen, Z.G.; Ma, T.S. Effects of silicon on salinity tolerance of two barley cultivars. J. Plant Nutr. 1996, 19, 173–183. [Google Scholar] [CrossRef]
  23. Liang, Y.C. Effects of Si on leaf ultrastructure, chlorophyll content and photosynthetic activity in barley under salt stress. Pedosphere 1998, 8, 289–296. [Google Scholar]
  24. Liang, Y.C.; Zhang, W.H.; Chen, Q.; Ding, R.X. Effects of silicon on tonoplast Hþ –ATPase and Hþ-PPase activity, fatty acid composition and fluidity in roots of salt stressed barley (Hordeum vulgare L.). Environ. Exp. Bot. 2005, 53, 29–37. [Google Scholar] [CrossRef]
  25. Yeo, A.R.; Flowers, S.A.; Rao, G.; Welfare, K.; Senanayake, N.; Flowers, T.J. Silicon reduces sodium uptake in rice (Oryza sativa L.) in saline conditions and this is accounted for by a reduction in the transpirational bypass flow. Plant Cell Environ. 1999, 22, 559–565. [Google Scholar] [CrossRef]
  26. Zhu, Z.J.; Wei, G.Q.; Li, J.; Qian, Q.Q.; Yu, J.Q. Silicon alleviates salt stress and increases antioxidant enzymes activity in leaves of salt-stressed cucumber (Cucumis sativus L.). Plant Sci. 2004, 167, 527–533. [Google Scholar] [CrossRef]
  27. Al-Aghabary, K.; Zhu, Z.; Shi, Q.H. Influence of silicon supply on chlorophyll content, chlorophyll fluorescence, and antioxidative enzyme activities in tomato plants under salt stress. J. Plant Nutr. 2004, 27, 2101–2115. [Google Scholar] [CrossRef]
  28. Gunes, A.; Inal, A.; Bagci, E.G.; Pilbeam, D.J. Silicon-mediated changes of some physiological and enzymatic parameters symptomatic for oxidative stress in spinach and tomato grown in sodic-B toxic soil. Plant Soil 2007, 290, 103–114. [Google Scholar] [CrossRef]
  29. Hashemi, A.; Abdolzadeh, A.; Sadeghipour, H.R. Beneficial effects of silicon nutrition in alleviating salinity stress in hydroponically grown canola, Brassica napus L., plants. Soil Sci. Plant Nutr. 2010, 56, 244–253. [Google Scholar] [CrossRef] [Green Version]
  30. Rizwan, M.; Ali, S.; Ibrahim, M.; Farid, M.; Adrees, M.; Bharwana, S.A.; Zia-ur-Rehman, M.; Qayyum, M.F.; Abbas, F. Mechanisms of silicon-mediated alleviation of drought and salt stress in plants: A review. Environ. Sci. Pollut. Res. 2015, 22, 15416–15431. [Google Scholar] [CrossRef]
  31. Dhiman, P.; Rajora, N.; Bhardwaj, S.; Sudhakaran, S.S.; Kumar, A.; Raturi, G.; Chakraborty, K.; Gupta, O.P.; Devanna, B.N.; Tripathi, D.K.; et al. Fascinating role of silicon to combat salinity stress in plants: An updated overview. Plant Physiol. Biochem. 2021, 162, 110–123. [Google Scholar] [CrossRef]
  32. Monica, R.C.; Cremonini, R. Nanoparticles and higher plants. Caryology 2009, 62, 61–165. [Google Scholar] [CrossRef] [Green Version]
  33. Cheng, G.; Chang, T.; Qin, Q.; Huang, H.; Zhu, Y. Mechanical properties of silicon carbide nanowires: Effect of size-dependent defect density. Nano Lett. 2014, 14, 754–758. [Google Scholar] [CrossRef] [PubMed]
  34. Torney, F.; Trewyn, B.G.; Lin, V.S.Y.; Wang, K. Mesoporous silica nanoparticles deliver DNA and chemicals into plants. Nat. Nanotechnol. 2007, 2, 295–300. [Google Scholar] [CrossRef] [PubMed]
  35. Seleiman, M.F.; Almutairi, K.F.; Alotaibi, M.; Shami, A.; Alhammad, B.A.; Battaglia, M.L. Nano-fertilization as an emerging fertilization technique: Why can modern agriculture benefit from its use? Plants 2021, 10, 2. [Google Scholar] [CrossRef] [PubMed]
  36. Zahedi, S.M.; Moharrami, F.; Sarikhani, S.; Padervand, M. Selenium and silica nanostructure-based recovery of strawberry plants subjected to drought stress. Sci. Rep. 2020, 10, 1–18. [Google Scholar] [CrossRef] [PubMed]
  37. Bao-Shan, L.; Chun-hui, L.; Li-jun, F.; Shu-chun, Q.; Min, Y. Effects of TMS (nanostructured silicon dioxide) on growth of Changbai larch seedlings. J. For. Res. 2004, 15, 138–140. [Google Scholar] [CrossRef]
  38. Badawy, S.A.; Zayed, B.A.; Bassiouni, S.M.A.; Mahdi, A.H.A.; Majrashi, A.; Ali, E.F.; Seleiman, M.F. Influence of nano silicon and nano selenium on root characters, growth, ion selectivity, yield, and yield components of rice (Oryza sativa L.) under salinity conditions. Plants 2021, 10, 1657. [Google Scholar] [CrossRef]
  39. Munns, R.; Tester, M. Mechanisms of salinity tolerance. Annu. Rev. Plant Biol. 2008, 59, 651–668. [Google Scholar] [CrossRef] [Green Version]
  40. Hanafy, A.A.H.; Harb, E.M.; Higazy, M.A.; Morgan, S.H. Effect of silicon and boron foliar applications on wheat plants grown under saline soil conditions. Inter. J. Agric. Res. 2008, 3, 1–26. [Google Scholar]
  41. Abdul Qados, A.M.S.; Moftah, A.E. Influence of Silicon and Nano-Silicon on Germination, Growth and Yield of Faba Bean (Vicia faba L.) Under Salt Stress Conditions. Am. J. Exp. Agric. 2015, 5, 509–524. [Google Scholar]
  42. Ghassemi-Golezani, K.; Nikpour-Rashidabad, N.; Zehtab-Salmasi, S. Physiological performance of pinto bean cultivars under salinity. Inter. J. Plant Anim. Environ. Sci. 2012, 2, 223–228. [Google Scholar]
  43. Farhoudi, R.; Tafti, M.M. Effect of salt stress on seedlings growth and ions homeostasis of soybean (Glycine max) cultivars. Adv. Environ. Biol. 2011, 5, 2522–2526. [Google Scholar]
  44. Zhani, K.; Elouer, M.A.; Aloui, H.; Hannachi, C. Selection of a salt tolerant Tunisian cultivar of chili pepper (Capsicum frutescens). EurAsian J. BioSci. 2012, 6, 47–59. [Google Scholar] [CrossRef]
  45. Kanwal, H.; Ashraf, M.; Hameed, M. Water relations and ionic composition in the seedlings of some newly developed and candidate cultivars of wheat (Triticum aestivum L.) under saline conditions. Pak. J. Bot. 2013, 45, 1221–1227. [Google Scholar]
  46. Ghezal, N.; Rinez, I.; Sbai, H.; Saad, I.; Farooqd, M.; Rinez, A.; Zribi, I.; Haouala, R. Improvement of Pisum sativum salt stress tolerance by bio-priming their seeds using Typha angustifolia leaves aqueous extract. S. Afr. J. Bot. 2016, 105, 240–250. [Google Scholar] [CrossRef]
  47. Taize, L.; Zeiger, E. Plant Physiology, 4th ed.; Sinauer Associates, Inc.: Sunderland, MA, USA, 2006. [Google Scholar]
  48. Epstein, E. Silicon. Ann. Rev. Plant Physiol. Plant Mol. Biol. 1999, 50, 641–664. [Google Scholar] [CrossRef] [PubMed]
  49. Agurie, S.; Agata, W.; Kubota, F.; Kaufman, P.B. Physiological role of silicon in photosynthesis and dry matter production in rice plants. Crop Sci. 1992, 61, 200–206. [Google Scholar]
  50. Hossain, M.T.; Ryuji, M.; Soga, K.; Wakabayashi, K.; Kamisaka, S.; Fuji, S.; Yamamoto, R.; Hoson, T. Growth promotion and increase in cell wall extensibility by silicon in rice and some Poaceae seedlings. J. Plant Res. 2002, 115, 23–27. [Google Scholar] [CrossRef]
  51. Matichenkov, V.V.; Bocharnikova, E.A.; Ammosova, J.M. The influence of silicon fertilizers on the plants and soils. Agrochemica 2001, 12, 30–37. [Google Scholar]
  52. Rodrigues, F.A.; Vale, F.X.R.; Korndorfer, G.H.; Prabhu, A.S.; Datnoff, L.E.; Oliveira, A.M.A.; Zambolim, L. Influence of silicon on sheath blight of rice in Brazil. Crop Prot. 2003, 22, 23–29. [Google Scholar] [CrossRef]
  53. Ma, J.F. Role of silicon in enhancing the resistance of plants to biotic and abiotic stresses. Soil Sci. Plant Nutr. 2004, 50, 11–18. [Google Scholar] [CrossRef]
  54. Ali, A.; Basra, S.M.A.; Ahmad, R.; Wahid, A. Optimizing silicon application to improve salinity tolerance in wheat. Soil Environ. 2009, 28, 136–144. [Google Scholar]
  55. Romero-Aranda, M.R.; Jurado, O.; Cuartero, J. Silicon alleviates the deleterious salt effect on tomato plant growth by improving plant water status. J. Plant Physiol. 2006, 163, 847–855. [Google Scholar] [CrossRef] [PubMed]
  56. Shu, L.Z.; Liu, Y.H. Effects of silicon on growth of maize seedlings under salt stress. Agro-Environ. Prot. 2001, 20, 38–40. [Google Scholar]
  57. Tahir, M.A.; Rammatullah, A.; Ashraf, T.M.; Kanwal, S.; Maqsood, M.A. Beneficial effects of silicon in wheat (Triticum aestivum) under salinity stress. Pak. J. Bot. 2006, 38, 1715–1722. [Google Scholar]
  58. Bradbury, M.; Ahmad, R. The effect of silicon on the growth of Prosopis juliflora growing in saline soil. Plant Soil. 1990, 125, 71–74. [Google Scholar] [CrossRef]
  59. Kamenidou, S.; Cavins, T.J.; Marek, S. Evaluation of silicon as a nutritional supplement for greenhouse zinnia production. Sci. Hort. 2009, 119, 297–301. [Google Scholar] [CrossRef]
  60. Zhu, J.K. Salt and drought stress signal transduction in plants. Annu. Rev. Plant Biol. 2002, 53, 247–273. [Google Scholar] [CrossRef] [Green Version]
  61. Cuartero, J.; Yeo, A.R.; Flowers, T.J. Selection of donors for salt-tolerance in tomato using physiological traits. New Phytol. 1992, 121, 63–69. [Google Scholar] [CrossRef]
  62. Gong, H.; Chen, K.; Chen, G.; Wang, S.; Zhang, C. Effects of silicon on growth of wheat under drought. J. Plant Nutr. 2003, 26, 1055–1063. [Google Scholar] [CrossRef]
  63. Kaya, C.; Tuna, L.; Higgs, D. Effect of silicon on plant growth and mineral nutrition of maize grown under water-stress conditions. J. Plant Nutr. 2006, 29, 1469–1480. [Google Scholar] [CrossRef]
  64. Shahzade, M. Growth-Related Changes in Subcellularion and Protein Patterns in Maize and Field Bean Leaves under Salt Stress. Master’s Thesis, Institute of Plant Nutrition and Soil Science, University of Kiel, Kiel, Germany, 2012. [Google Scholar]
  65. Oertli, J.J. Extracellular salt accumulation, a possible mechanism of salt injury in plants. Soil Sci. 1968, 12, 461–469. [Google Scholar]
  66. Flowers, T.J.; Flowers, S.A.; Hajibagheri, M.A.; Yeo, A. Ion accumulation in the cells walls of rice plants growing under saline conditions: Evidence for Oertli hypothesis. Plant Cell Environ. 1991, 14, 319–325. [Google Scholar] [CrossRef]
  67. Barros, L.U.; da Cunha, C.F.; Miguens, F.C. Structure, morphology, and composition of silicon biocomposites in the palm tree Syagrus coronata (Mart.). Becc Protoplasma 2002, 220, 89–96. [Google Scholar]
  68. Richmond, K.E.; Sussman, M. Got silicon? The non-essential benefical plant nutrient. Curr. Opin. Plant Biol. 2003, 6, 268–272. [Google Scholar] [CrossRef]
  69. Smith, A.M.; Duan, H.W.; Mohs, A.M.; Nie, S.M. Bioconjugated quantum dots for in vivo molecular and cellular imaging. Adv. Drug Deliv. Rev. 2008, 60, 1226–1240. [Google Scholar] [CrossRef] [Green Version]
  70. Wang, C.Q.; Song, H. Calcium protects Trifolium repens L. plants against cadmium stress. Plant Cell Rep. 2009, 28, 1341–1349. [Google Scholar] [CrossRef]
  71. Adrees, M.; Ali, S.; Rizwan, M.; Zia-ur-Rehman, M.; Ibrahim, M.; Abbas, F.; Farid, M.; Qayyum, M.F.; Irshad, M.K. Mechanisms of silicon-mediated alleviation of heavy metal toxicity in plants: Areview. Ecotoxicol. Environ. Saf. 2015, 119, 186–197. [Google Scholar] [CrossRef]
  72. Suriyaprabha, R.; Karunakaran, G.; Yuvakkumar, R.; Rajendran, V.; Kannan, N. Silica nano particles for increased silica availability in maize (Zea mays L.) seeds under hydroponic conditions. Curr. Nanosci. 2012, 8, 902–908. [Google Scholar] [CrossRef]
  73. Abbas, W.; Ashraf, M.; Akram, N.A. Alleviation of salt induced adverse effects in eggplant (Solanum melongena L.) by glycine betaine and sugar beet extracts. Sci. Hortic. 2010, 125, 188–195. [Google Scholar] [CrossRef]
  74. Gay, F.; Maraval, I.; Roques, S.; Gunata, Z.; Boulanger, R.; Audebert, A.; Mestres, C. Effect of salinity on yield and 2-acetyl-1-pyrroline content in the grains of three fragrant rice cultivars (Oryza sativa L.) in Camargue (France). Field Crops Res. 2010, 117, 154–160. [Google Scholar] [CrossRef]
  75. Kardoni, F.; Mosavi, S.J.S.; Parande, S.; Torbaghan, M.E. Effect of salinity stress and silicon application on yield and component yield of Faba bean (Vicia faba). Inter. J. Agric. Crop Sci. 2013, 6, 814–818. [Google Scholar]
  76. Miyake, Y.; Takahashi, E. Effect of silicon on the growth and fruit production of strawberry plants in a solution culture. Soil Sci. Plant Nutr. 1986, 32, 321–326. [Google Scholar] [CrossRef] [Green Version]
  77. Kobraee, S.; Shamsi, K.; Rasekhi, B. Soybean production under water deficit conditions. Ann. Biol. Res. 2011, 2, 423–434. [Google Scholar]
  78. Ahmad, A.; Afzal, M.; Ahmad, A.U.H.; Tahir, M. Effect of foliar application of silicon on yield and quality of rice (Oryza sativa L). Cercetări. Agron. Moldova. 2013, 3, 21–28. [Google Scholar] [CrossRef] [Green Version]
  79. Parande, S.; Zamani, G.R.; Zahan, M.H.S.; Ghaderi, M.G. Effects of silicon application on the yield and component of yield in the common bean (Phaseolus vulgaris) under salinity stress. Inter. J. Agron. Plant Prod. 2013, 4, 1574–1579. [Google Scholar]
  80. Jaberzadeh, A.; Moaveni, P.; Moghadam, H.R.; Zahedi, H. Influence of Bulk and Nanoparticles Titanium Foliar Application on some Agronomic Traits, Seed Gluten and Starch Contents of Wheat Subjected to Water Deficit Stress. Not Bot. Horti. Agrobio. 2013, 41, 201–207. [Google Scholar] [CrossRef] [Green Version]
  81. Ashraf, M. Biotechnological approach of improving plant salt tolerance using antioxidants as markers. Biotechnol. Adv. 2009, 27, 84–93. [Google Scholar] [CrossRef]
  82. Anjum, S.A.; Wang, L.; Farooq, M.; Khan, I.; Xue, L. Methyl jasmonate-induced alteration in lipid peroxidation, antioxidative defence system and yield in soybean under drought. J. Agron. Crop Sci. 2011, 197, 296–301. [Google Scholar] [CrossRef]
  83. Shahid, M.A.; Pervez, M.A.; Balal, R.M.; Mattson, N.S.; Rashid, A.; Ahmad, R.; Ayyub, C.M.; Abbas, T. Brassinosteroid (24-epibrassinolide) enhances growth and alleviates the deleterious effects induced by salt stress in pea (Pisum sativum L.). Aust. J. Crop Sci. 2011, 5, 500–510. [Google Scholar]
  84. Noreen, Z.; Ashraf, M. Assessment of variation in antioxidative defense system in salt- treated pea (Pisum sativum) cultivars and its putative use as salinity tolerance markers. J. Plant Physiol. 2009, 166, 1764–1774. [Google Scholar] [CrossRef]
  85. Rouhier, N.; Jacquot, J.P. Getting sick may help plants overcome abiotic stress. New Phytol. 2008, 180, 738–741. [Google Scholar] [CrossRef] [PubMed]
  86. Kim, Y.H.; Khan, A.L.; Waqas, M.; Shim, J.K.; Kim, D.H.; Lee, K.Y.; Lee, I.J. Silicon application to rice root zone influenced the phytohormonal and antioxidant responses under salinity stress. J. Plant Growth Regul. 2014, 33, 137–149. [Google Scholar] [CrossRef]
  87. Kim, Y.H.; Khan, A.L.; Waqas, M.; Shahzad, R.; Lee, I.J. Silicon-mediated mitigation of wounding stress acts by up-regulating the rice antioxidant system. Cereal Res. Commun. 2016, 44, 111–121. [Google Scholar] [CrossRef] [Green Version]
  88. Torabi, F.; Majd, A.; Enteshari, S. The effect of silicon on alleviation of salt stress in borage (Borago officinalis L.). Soil Sci. Plant Nut. 2015, 61, 788–798. [Google Scholar] [CrossRef] [Green Version]
  89. Mateos-Naranjo, E.; Gallé, A.; Florez-Sarasa, I.; Perdomo, J.A.; Galmés, J.; Ribas-Carbó, M.; Flexas, J. Assessment of the role of silicon in the Cu tolerance of the C 4 grass Spartina densiflora. J. Plant Physiol. 2015, 178, 74–83. [Google Scholar] [CrossRef] [PubMed]
  90. Abdel-Haliem, M.E.; Hegazy, H.S.; Hassan, N.S.; Naguib, D.M. Effect of silica ions and nano silica on rice plants under salinity stress. Ecol. Eng. 2017, 99, 282–289. [Google Scholar] [CrossRef]
  91. Vatansever, R.; Ozyigit, I.I.; Filiz, E.; Gozukara, N. Genome wide exploration of silicon (Si) transporter genes, Lsi1 and Lsi2 in plants; insights into Si-accumulation status/capacity of plants. BioMetals 2017, 30, 185–200. [Google Scholar] [CrossRef]
  92. Yamanaka, S.; Takeda, H.; Komatsubara, S.; Ito, F.; Usami, H.; Togawa, E.; Yoshino, K. Structures and physiological functions of silica bodies in the epidermis of rice plants. Appl. Phys. Lett. 2009, 95, 123–703. [Google Scholar] [CrossRef] [Green Version]
  93. Gong, H.J.; Randall, D.P.; Flowers, T.J. Silicon deposition in the root reduces sodium uptake in rice (Oryza sativa L.) seedlings by reducing bypass flow. Plant Cell Environ. 2006, 29, 1970–1979. [Google Scholar] [CrossRef]
  94. Ma, J.F.; Yamaji, N. Silicon uptake and accumulation in higher plants. Trends Plant Sci. 2006, 11, 392–397. [Google Scholar] [CrossRef]
  95. Trenholm, L.E.; Datnoff, L.E.; Nagara, R.T. Influence of silicon on drought and shade tolerance of St. Augustine grass. Hort. Technol. 2004, 14, 487–490. [Google Scholar] [CrossRef] [Green Version]
  96. Arshi, A.; Ahmad, A.; Aref, I.M.; Iqbal, M. Comparative studies on antioxidant enzyme action and ion accumulation in soybean cultivars under salinity stress. J. Environ. Biol. 2012, 33, 9–20. [Google Scholar] [PubMed]
  97. Hertwig, B.; Streb, P.; Feierabend, J. Light dependence of catalase synthesis and degradation in leaves and the influence of interfering stress conditions. Plant Physiol. 1992, 100, 1547–1553. [Google Scholar] [CrossRef] [PubMed]
  98. Alscher, R.G.; Donahue, J.L.; Cramer, C.L. Reactive oxygen species and antioxidants: Relationship in green cells. Physiol. Plant. 1997, 100, 224–233. [Google Scholar] [CrossRef]
  99. Mittler, R. Oxidative stress, antioxidants and stress tolerance. Trends Plant Sci. 2002, 7, 405–410. [Google Scholar] [CrossRef]
  100. Qureshi, M.I.; Abdin, M.Z.; Qadir, S.; Iqbal, M. Lead-induced oxidative stress and metabolic alterations in Cassia angustifolia Vahl. Biol. Plant. 2007, 51, 121–128. [Google Scholar] [CrossRef]
  101. Liang, Y.C.; Chen, Q.; Liu, Q.; Zhang, W.H.; Ding, R.X. Exogenous silicon (Si) increases antioxidant enzyme activity and reduces lipid peroxidation in roots of salt-stressed barley (Hordeum vulgare L.). J. Plant Physiol. 2003, 160, 1157–1164. [Google Scholar] [CrossRef]
  102. Noreen, Z.; Ashraf, M.; Akram, N.A. Salt-induced regulation of some key antioxidant enzymes and physiobiochemical phenomena in five diverse cultivars of turnip (Brassica rapa L.). J. Agron. Crop Sci. 2010, 196, 273–285. [Google Scholar]
  103. Kim, Y.H.; Khan, A.L.; Waqas, M.; Lee, I.J. Silicon regulates antioxidant activities of crop plants under abiotic-induced oxidative stress: A review. Front. Plant Sci. 2017, 8, 510. [Google Scholar] [CrossRef] [Green Version]
  104. Beadle, C.L. Growth analysis. In Photosynthesis and Production in a Changing Environment, A Field and Laboratory Manual; Hall, D.C., Scurlock, J.M.O., Bolhar-Nordenkampf, H.R., Leegod, R.C., Long, S.P., Eds.; Chapman & Hall: London, UK, 1993; pp. 36–46. [Google Scholar]
  105. Ray, S.; Choudhuri, M.A. Regulation of flag leaf senescence in rice by nutrients and its impacts on yield. RISO 1980, 29, 9–14. [Google Scholar]
  106. Motsara, M.R.; Roy, R.N. Guide to Laboratory Establishment for Plant Nutrient Analysis; Food and Agriculture Organization of the United Nations: Rome, Italy, 2008; pp. 80–90. [Google Scholar]
  107. Livak, K.J.; Schmittgen, T.D. Analysis of relative gene expression data using real-time quantitative PCR and the 2(-Delta DeltaC (T)) method. Methods 2001, 25, 402–408. [Google Scholar] [CrossRef] [PubMed]
  108. Agarwal, S.; Shaheen, R. Stimulation of antioxidant system and lipid peroxidation by abiotic stresses in leaves of Momordica charantia. Braz. J. Plant Physiol. 2007, 19, 149–161. [Google Scholar] [CrossRef] [Green Version]
  109. Nishikimi, M.; Roa, N.A.; Yogi, K. Measurement of superoxide dismutase. Biochem. Biophys. Res. Comm. 1972, 46, 849–854. [Google Scholar] [CrossRef]
  110. Devi, P. Principles and Methods in Plant Molecular Biology, Biochemistry and Genetics, 1st ed.; Agrobios: Jodhpur, India, 2002. [Google Scholar]
  111. Sinha, A.K. Colorimetric assay of catalase. Anal. Biochem. 1972, 47, 389–394. [Google Scholar] [CrossRef]
Figure 1. Relative expression pattern of (A) SOD gene, (B) POD gene, (C) CAT gene and (D) PslecRLK gene in salt-stressed pea seedlings in the presence or absence of Si or NSi. Vertical bars represent the standard error (±S.E.). Means denoted by similar letters are not significantly different at the 5% probability level-using Post Hoc Duncan test.
Plants 11 00494 g001aPlants 11 00494 g001b
Figure 2. The activity of (A) SOD, (B) POD and (C) CAT enzymes in salt-stressed pea seedlings in the presence or absence of Si or NSi. Vertical bars represent standard error (±S.E.). Means denoted by similar letters are not significantly different at the 5% probability level-using Post Hoc. Duncan test.
Plants 11 00494 g002
Table 1. Effect of silicon and nano-silicon on growth of Pisum sativum plants (vegetative stage) exposed to salinity stress. Means (of three replicates), in each column, followed by similar letter are not significantly different at the 5% probability level-using Post Hoc. Duncan test.
TreatmentShoot
Length
(cm plant−1)
Shoot
Fresh Weight
(g plant−1)
Shoot
Dry Weight
(g plant−1)
Shoot
Water Content
(g plant−1)
Root
Length
(cm plant−1)
Root
Fresh Weight
(g plant−1)
Root
Dry Weight
(g plant−1)
Root
Water Content
(g plant−1)
No of Leaves/PlantLeaf Area
(cm2 plant−1)
Control26.60 bcd4.76 bcd0.89 cdefg3.87 abcdef3.45 ab0.20 abcd0.03 bc0.17 ab6.00 b57.0 l
Si28.53 ab6.28 ab1.07 bc5.21 ab4.67 ab0.25 ab0.03 bc0.21 a7.00 ab70.62 e
NSi30.40 a7.01 a1.68 a5.33 a4.83 ab0.26 a0.05 a0.21 a8.00 a68.98 f
100 mM22.25 fghi4.37 cde0.88 cdefg3.49 bcdef3.80 ab0.14 cdef0.03 cde0.11 bcd7.00 ab55.04 m
100 mM + Si26.20 bcde5.78 abc1.02 bcd4.76 abc3.50 ab0.18 bcde0.03 bc0.14 abc8.00 a60.09 i
100 mM + NSi27.30 bc6.39 ab1.30 b5.09 abc3.15 b0.21 abc0.04 ab0.17 ab8.00 a61.12 h
150 mM22.00 fghi4.22 cde0.68 defgh3.54 bcdef4.80 ab0.12 def0.03 cde0.09 cd7.00 ab49.94 n
150 mM + Si26.00 bcde5.57 abc0.91 cdef4.66 abcd4.00 ab0.16 cdef0.03 bc0.12 bcd8.00 a88.65 a
150 mM + NSi24.50 cdef4.01 cde0.62 efgh3.39 cdef3.97 ab0.19 bcde0.03 bcd0.15 abc8.00 a78.89 b
200 mM21.00 ghi2.95 e0.51 h2.44 ef5.00 ab0.09 f0.02 de0.07 d7.00 ab36.95 o
200 mM + Si23.27 efgh3.55 de0.57 fgh2.98 def4.25 ab0.14 cdef0.03 cde0.11 bcd8.00 a73.88 d
200 mM + NSi23.30 efgh5.68 abc0.95 cde4.73 abc4.53 ab0.14 cdef0.02 cde0.11 bcd7.00 ab76.49 c
250 mM19.50 i2.74 e0.53 gh2.21 f5.63 a0.11 ef0.02 e0.09 cd7.00 ab59.18 k
250 mM + Si20.50 hi3.29 de0.57 fgh2.72 ef4.90 ab0.13 def0.03 cde0.10 bcd8.00 a61.37 g
250 mM + NSi24.00 defg4.88 bcd0.83 cdefgh4.05 abcde4.90 ab0.13 def0.02 cde0.10 bcd7.00 ab59.23 j
Table 2. Effect of silicon and nano-silicon on growth and development of Pisum sativum plants (flowering stage) exposed to salinity stress. Means (of three replicates), in each column, followed by similar letter are not significantly different at the 5% probability level using the Post Hoc. Duncan test.
TreatmentShoot Length
(cm plant−1)
Shoot Fresh Weight
(g plant−1)
Shoot Dry Weight
(g plant−1)
Shoot Water Content
(g plant−1)
Root Length
(cm plant−1)
Root Fresh Weight
(g plant−1)
Root Dry Weight
(g plant−1)
Root Water Content
(g plant−1)
No of Leaves/PlantLeaf Area
(cm2 plant−1)
No of Flowers/Plant
Control32.60 ab5.50 ef0.93 efg4.57 fg4.75 ab0.22 a0.04 e0.18 a10.00 ab109.06 b1.00 a
Si34.00 ab7.69 c1.51 bc6.18 cde6.25 a0.26 a0.06 b0.20 a10.00 ab88.34 f2.00 a
NSi34.10 ab13.38 a2.23 a11.14 a6.37 a0.27 a0.08 a0.19 a11.00 a87.65 g2.00 a
100 mM31.13 abcd6.98 cde1.39 bc5.59 cdef4.90 ab0.19 a0.04 e0.15 a10.00 ab104.01 c1.00 a
100 mM + Si31.85 abc7.97 c1.34 bc6.63 c3.60 b0.22 a0.05 cd0.17 a10.00 ab62.00 n2.00 a
100 mM + NSi36.20 a11.28 b1.63 b9.65 b4.20 ab0.25 a0.05 bc0.20 a10.00 ab68.38 j2.00 a
150 mM31.00 abcd7.25 cd1.19 cdef6.06 cde5.25 ab0.23 a0.04 de0.19 a10.00 ab89.51 d1.00 a
150 mM + Si31.33 abcd7.66 c1.27 cd6.40 cd4.40 ab0.25 a0.05 cde0.20 a10.00 ab68.14 k2.00 a
150 mM + NSi33.00 ab10.73 b1.63 b9.10 b4.50 ab0.20 a0.05 cd0.15 a10.00 ab89.13 e2.00 a
200 mM25.40 def4.98 f0.87 fg4.10 g5.30 ab0.15 a0.04 e0.11 a9.00 b76.71 h1.00 a
200 mM + Si25.60 def4.65 f0.89 fg3.75 g4.90 ab0.14 a0.04 de0.10 a9.00 b67.06 l2.00 a
200 mM + NSi28.87 bcde8.04 c1.25 cde6.80 c5.35 ab0.17 a0.05 cde0.12 a10.00 ab135.04 a2.00 a
250 mM21.40 f4.70 f0.85 g3.85 g6.20 a0.14 a0.04 e0.11 a9.00 b66.33 m2.00 a
250 mM + Si23.00 ef5.89 def0.85 g5.05 defg5.30 ab0.37 a0.04 e0.33 a10.00 ab72.85 i2.00 a
250 mM + NSi26.25 cdef5.82 def0.99 defg4.83 efg5.55 ab0.13 a0.04 e0.09 a10.00 ab56.54 o2.00 a
Table 3. Effect of silicon and nano-silicon on growth and development of Pisum sativum plants (yield stage) exposed to salinity stress. Means (of three replicates), in each column, followed by similar letter are not significantly different at the 5% probability level-using Post Hoc Duncan test.
TreatmentShoot Length
(cm plant−1)
Plant Height
(cm plant−1)
Pod Length
(cm plant−1)
Pod Weight
(g plant−1)
Crop Yield
(g plant−1)
No of Pods
/Plant
No of Seeds
/Pod
Seed Weight
(g pod−1)
Total Seed Yield
(g plant−1)
Straw Yield
(g plant−1)
Harvest IndexCrop IndexMobilization Index
Control36.00 abc42.35 ab10.20 ab6.13 c7.94 abcd3.00 bc7.00 ab3.53 abc3.37 abcd6.81 abc0.48 ab0.32 ab0.05 a
Si34.00 abcd37.90 abcd10.10 abc8.09 b9.02 abc3.00 bc7.00 ab3.97 a4.10 a6.98 abc0.59 a0.37 a0.05 a
NSi39.55 a45.10 a10.35 a9.91 a11.47 a5.00 a8.00 a3.92 ab3.95 ab8.62 a0.46 abc0.31 ab0.04 a
100 mM33.60 abcd37.70 abcd9.03 bcd4.35 de7.89 abcd3.00 bc6.00 ab2.02 def2.54 abcde6.33 abcd0.40 abc0.29 abc0.05 a
100 mM + Si34.83 abc38.17 abcd10.10 abc7.82 b8.44 abcd3.00 bc7.00 ab2.75 bcd3.59 abc6.93 abc0.46 abc0.30 ab0.04 a
100 mM + NSi37.00 ab41.75 ab9.80 abc7.97 b10.17 ab4.00 ab7.00 ab3.74 ab2.95 abcde8.18 a0.37 abc0.27 abc0.03 a
150 mM32.95 abcd36.70 bcd8.50 de3.46 e5.70 cde1.00 d6.00 ab1.51 defg1.55 def4.91 cde0.31 abc0.23 bc0.05 a
150 mM + Si34.13 abcd37.97 abcd9.85 abc6.14 c6.55 bcde3.00 bc7.00 ab2.39 cde2.42 abcde6.14 abcd0.47 abc0.30 ab0.06 a
150 mM + NSi35.00 abc41.4 abc9.05 bcd5.65 cd7.18 bcd3.00 bc7.00 ab2.48 cde2.38 abcde8.10 ab0.29 bc0.23 bc0.03 a
200 mM29.50 cd35.65 bcd8.30 de3.42 e4.88 de1.00 d6.00 ab1.02 fg1.44 ef4.02 de0.36 abc0.26 abc0.06 a
200 mM + Si33.25 abcd37.00 bcd9.05 bcd4.84 cde5.64 cde3.00 bc7.00 ab2.05 def2.05 cdef5.59 bcd0.37 abc0.27 abc0.05 a
200 mM + NSi32.10 abcd35.80 bcd8.90 cde4.74 cde5.72 cde3.00 bc6.00 ab2.04 def2.18 bcdef6.06 abcd0.45 abc0.29 abc0.07 a
250 mM26.93 d33.50 d7.70 e1.91 f2.82 e1.00 d5.00 b0.49 g0.49 f2.68 e0.20 c0.16 c0.07 a
250 mM + Si29.00 cd36.50 bcd9.00 bcd3.88 e4.99 de2.00 cd6.00 ab1.61 defg1.83 cdef3.93 de0.47 abc0.32 ab0.08 a
250 mM + NSi29.67 bcd34.00 cd8.47 de3.51 e5.35 cde3.00 bc6.00 ab1.31 efg1.73 def4.43 cde0.39 abc0.28 abc0.06 a
Table 4. Effect of silicon and nano-silicon on Na+ and K+ contents (mg/g dry weight) and Na + /K+ ratio of Pisum sativum plants (vegetative stage) exposed to salinity stress. Means (of three replicates), in each column, followed by similar letter are not significantly different at the 5% probability level-using Post Hoc Duncan test.
TreatmentNa+K+Na+/K+ Ratio
RootShootRootShootRootShoot
Control9.80 k7.97 l12.96 f21.84 c0.76 j0.36 l
Si10.20 j8.90 k11.06 h24.89 a0.92 h0.36 l
NSi9.80 k7.97 l16.16 d19.78 e0.61 m0.40 k
100 mM12.19 h17.21 f6.80 l10.50 k1.79 d1.64 d
100 mM + Si10.20 j13.20 i10.50 i12.90 j0.97 g1.02 g
100 mM + NSi9.80 k11.20 j13.20 e15.87 h0.74 jk0.71 j
150 mM20.24 c18.21 e9.80 j8.32 l2.07 c2.19 c
150 mM + Si12.19 h15.22 g10.50 i13.22 i1.16 e1.15 f
150 mM + NSi11.19 i14.23 h16.20 c19.40 f0.69 l0.73 j
200 mM26.23 b19.21 d11.80 g3.80 m2.22 b5.06 b
200 mM + Si13.24 f23.23 b16.20 c19.33 g0.82 i1.20 e
200 mM + NSi12.80 g19.22 d17.88 b23.41 b0.72 kl0.82 h
250 mM32.24 a21.22 c9.06 k2.90 n3.56 a7.32 a
250 mM + Si19.22 d26.23 a17.88 b21.54 d1.07 f1.22 e
250 mM + NSi16.20 e19.22 d22.25 a24.90 a0.73 jk0.77 i
Table 5. Sequences of primers used in qPCR.
Target GeneForward Primer 5′–3′Reverse Primer 5′–3′
SODGCGACATTCTTCCGGCTTTCGCCCAGCCTGAACCAAATTG
PODCTAGTTGCTCTTTCCGGTGCGGTTTGTTCCACTTCCACCC
CATTCACAGGGATGAGGAGGTCATGGATCGGTGTCGGATAAAGC
PsLecRLKTGAAGGATGGGAAGTGGAAGCTCGACCGGTTTTGATCACT
ActinGCTGTCCTCTCCCTCTATGCAGCCGAGGTGGTGAACATATACC
TubulinGTACACTGGTGAAGGCATGGAACTGCTGAACACACTTACACG
Publisher’s Note: MDPI stays neutral with regard to jurisdictional claims in published maps and institutional affiliations.

