Article

Identification of Novel Candidate Genes Involved in Apple Cuticle Integrity and Russeting-Associated Triterpene Synthesis Using Metabolomic, Proteomic, and Transcriptomic Data

1
Environmental Research and Innovation (ERIN) Department, Luxembourg Institute of Science and Technology (LIST), 5 Rue Bommel, Hautcharage, L-4940 Luxembourg, Luxembourg
2
The New Zealand Institute for Plant and Food Research Limited (PFR), Private Bag 92169, Auckland 1142, New Zealand
3
Walloon Agricultural Research Centre, Rue de Liroux, B-5030 Gembloux, Belgium
*
Author to whom correspondence should be addressed.
Plants 2022, 11(3), 289; https://doi.org/10.3390/plants11030289
Submission received: 23 November 2021 / Revised: 13 January 2022 / Accepted: 18 January 2022 / Published: 21 January 2022

Abstract

:
Apple russeting develops on the fruit surface when skin integrity has been lost. It induces a modification of fruit wax composition, including its triterpene profile. In the present work, we studied two closely related apple varieties, ‘Reinette grise du Canada’ and ‘Reinette blanche du Canada’, which display russeted and non-russeted skin phenotypes, respectively, during fruit development. To better understand the molecular events associated with russeting and the differential triterpene composition, metabolomics data were generated using liquid chromatography coupled to high-resolution mass spectrometry (LC-HRMS) and combined with proteomic and transcriptomic data. Our results indicated lower expression of genes linked to cuticle biosynthesis (cutin and wax) in russet apple throughout fruit development, along with an alteration of the specialized metabolism pathways, including triterpene and phenylpropanoid. We identified a lipid transfer protein (LTP3) as a novel player in cuticle formation, possibly involved in the transport of both cutin and wax components in apple skin. Metabolomic data highlighted for the first time a large diversity of triterpene-hydroxycinnamates in russeted tissues, accumulation of which was highly correlated with suberin-related genes, including some enzymes belonging to the BAHD (HXXXD-motif) acyltransferase family. Overall, this study increases our understanding about the crosstalk between triterpene and suberin pathways.

1. Introduction

Apple production is a major horticultural sector with 87 million tons produced in 2019 (FAOSTAT, https://www.fao.org/home (accessed on 23 November 2021)). Russeting detracts from fruit appearance, manifesting brownish rough corky texture on the fruit surface [1], leading to reduced market value and profitability on fruit production. Environmental stresses were one of the first characterized causes associated with russeting in apples [2,3]. Russeting seems to be initiated at the early stages of fruit development: the extreme mechanical tension on the fruit surface during this time of rapid growth seems to predispose apple fruit skin to cuticle microcracking [4]. Histological studies performed on apples revealed that cuticle thickness seemed to be inversely correlated with the appearance of russeting [5]. Additionally, russeted apple skin displayed a lower expression of genes linked to cuticle biosynthesis, and regulation was associated with a decreased content of cuticle monomers [5,6,7].
Russeting occurs as a result of the deposition of suberin in the primary cell wall of epidermal cells. A bulk transcriptomic analysis performed between russeted and non-russeted (waxy) apple varieties collected at commercial harvest enabled the identification of a number of genes involved in the suberin, cutin, and triterpene synthesis pathways and revealed a strong alteration in processes related to cell wall modification [6].
In apple, pentacyclic triterpenes, in the form of triterpenic acids, are major components of the skin waxes accounting for up to 60% of its total mass and belong to three distinctive series, namely the oleane, ursane, and lupane series [8,9]. Interestingly, a differential accumulation of these three series was observed when comparing russeted to non-russeted varieties [7,9]. This crucial difference was also supported by gene expression profiling and functional studies, which highlighted differentially expressed genes, such as oxidosqualene cyclases (OSC), involved in the synthesis of the different triterpene series [8,10]. As an example, MdOSC1 is more expressed in the non-russeted tissue and produces predominantly α-amyrin and β-amyrin, the precursors of the ursolic and oleanolic acid, respectively, whereas MdOSC5 is more expressed in russeted skin and mainly produces lupeol, which is then converted to betulinic acid. Furthermore, triterpene conjugated with hydroxycinnamoyl moieties was previously observed in apples [11,12]. As an example, our previous work showed that betulinic acid-3-trans-caffeate specifically accumulated in the russeted skin [9]. This ester has already been described in the bark of other tree species, but its production pathway remains unclear [13,14]. Recently, the transcription factor MYB66 was identified as a regulator of lupane-type triterpene (betulinic acid derivatives) [15]. Pentacyclic triterpenes are crucial components of apple skin structure (cuticle and suberized tissues), indicating that metabolic and regulatory components might interact transversally between these different pathways.
Recently, a number of transcriptional regulators were shown to be implicated directly and indirectly in the suberization process. In apple, MdSHN3 positively and negatively regulates the cuticle and the suberin deposition, respectively [5]. The suggestion that a thicker cuticle deposition is associated with the deposition of less suberin is consistent with the current understanding, although Lashbrooke et al. (2015) did not show whether MdSHN3 was a direct negative regulator of suberin biosynthesis. In Arabidopsis thaliana, the overexpression of AtMYB41 results in increased expression of the key suberin synthesis genes and a massive accumulation of suberin [16]. Interestingly, this transcriptional regulator seemed to be only expressed under stress conditions. This finding was confirmed by our gene expression profiling study performed in apples, where the orthologous gene of AtMYB41 was expressed at a low level in both russeted and non-russeted varieties [6]. A transversal multi-species expression profiling analysis revealed MYB107 and MYB9 as crucial regulators of suberin deposition in angiosperms [17]. Finally, MdMYB93 has been described as a master regulator of suberin biosynthesis in russeted apple skins [18]. Other transcription factors belonging to the NAC and MYB-domain family also displayed a differential expression between russeted and non-russeted varieties [6,15], but their role is not yet fully understood.
In order to further investigate the molecular players involved in apple russeting, the occurrence of triterpene-caffeates in particular, we performed an integrative analysis comparing two closely related varieties, i.e., ‘Reinette blanche du Canada’ (also known as Canada Blanc, CB) and ‘Reinette grise du Canada’ (also known as Canada Gris, CG) during fruit growth. CB is a non-russeted or slightly russeted apple variety, whereas CG is a fully russeted apple. While previous studies focused on the analysis of RNA-sequencing data, herein, we studied the two contrasting varieties using a combination of metabolomics, proteomics, and transcriptomics data. Thorough statistical analysis was performed at each biological level. Metabolomic data highlighted for the first time the presence of a large diversity of triterpene-hydroxycinnamates in russeted tissues. Their accumulation of which was highly correlated with suberin-related genes, including some enzymes belonging to the BAHD (HXXXD-motif) acyltransferase family. We additionally highlighted the key role played by transporters, notably by a lipid transfer protein (LTP3), in the assembly of the cuticle during apple fruit development.

2. Results

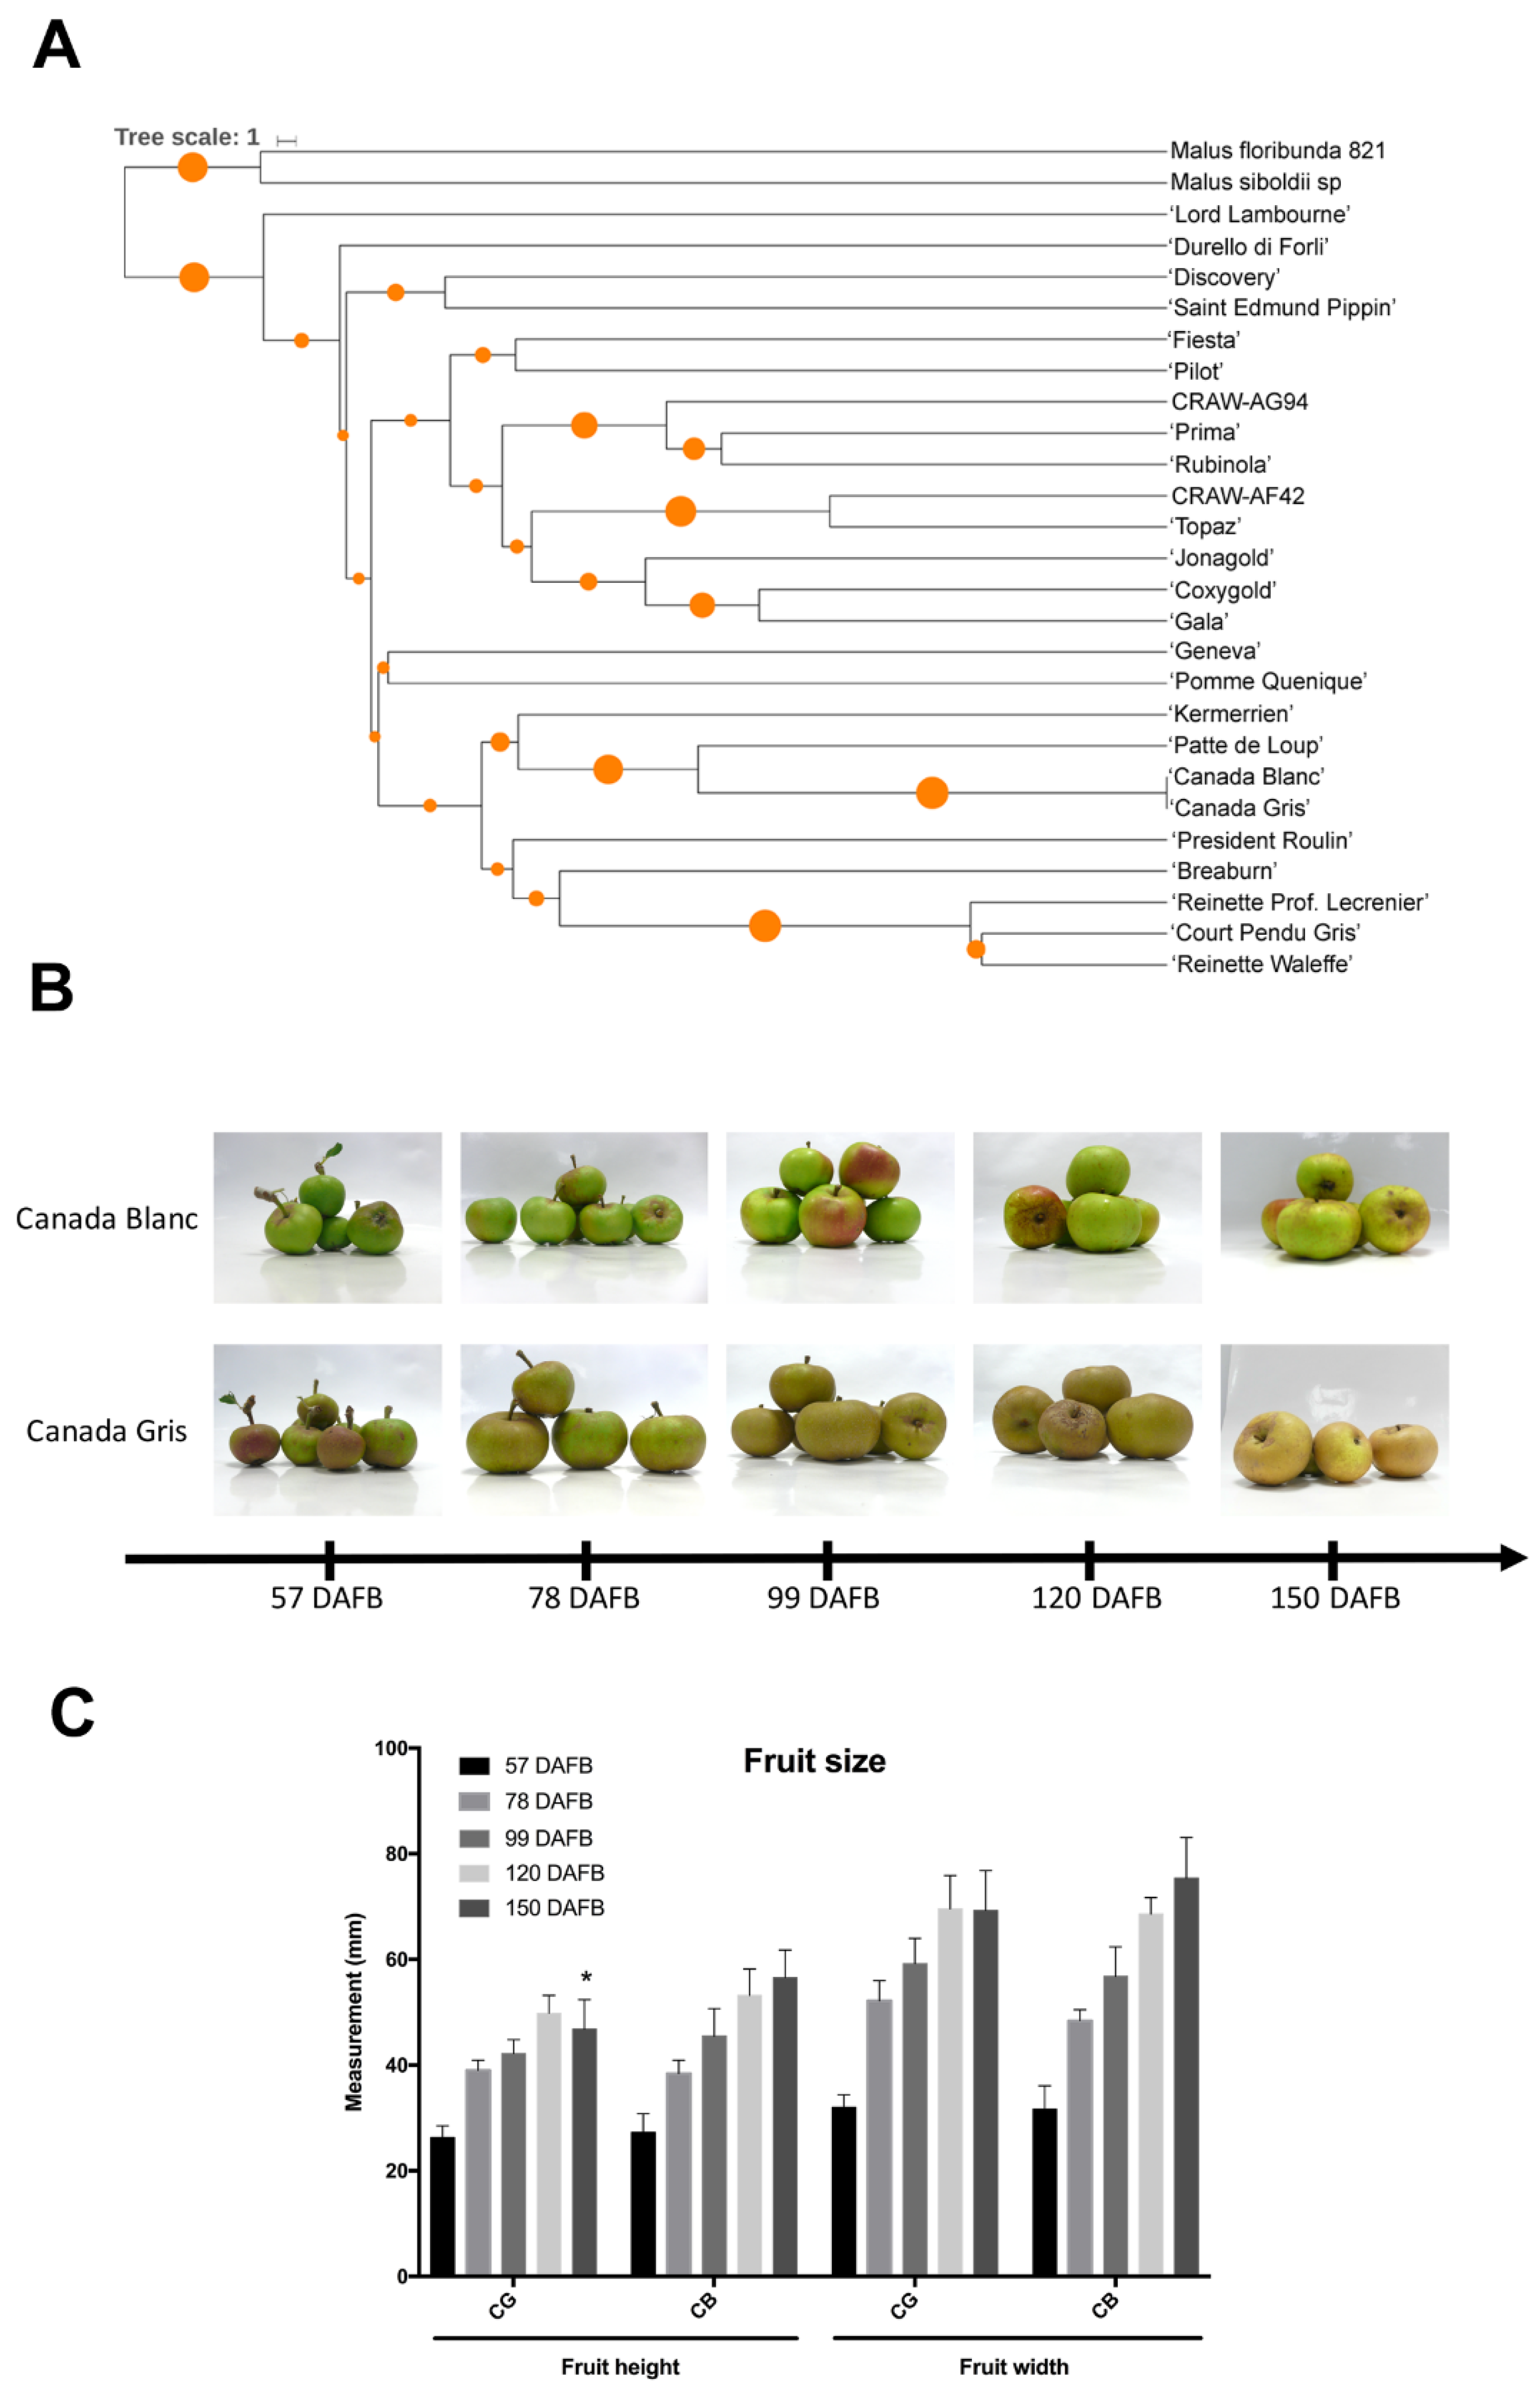
2.1. Phenotypic and Genetic Characterization

A genetic diversity study was performed using 16 SSR markers on 27 heritage and commercial M. × domestica varieties (Figure 1A). Allele numbers per marker ranged from 8 to 14 and allele frequency between 0.20 and 0.43, indicating a good level of polymorphism (Table S1). Varieties including ‘Jonagold,’ ‘Gala,’ ‘Fiesta,’ CRAW-AG94, were clustered together, while a second group included CB and CG varieties together with other russeted varieties such as ‘Patte de Loup’ and ‘Court Pendu Gris’. CG and CB exhibited a perfect identity in alleles (Figure 1A). However, they displayed a strong difference in respective skin phenotypes during the early stage of fruit development (57 DAFB, Figure 1B). CG exhibited russeting at 57 DAFB, which gradually increased during the course of the experiment. The CB variety showed a waxy skin with the occurrence of russeting spots and patches only at later sampling dates. A strong increase in fruit width and height was measured between 57 and 78 DAFB in both varieties, indicating extreme tensions on the skin surface during these stages (Figure 1C).

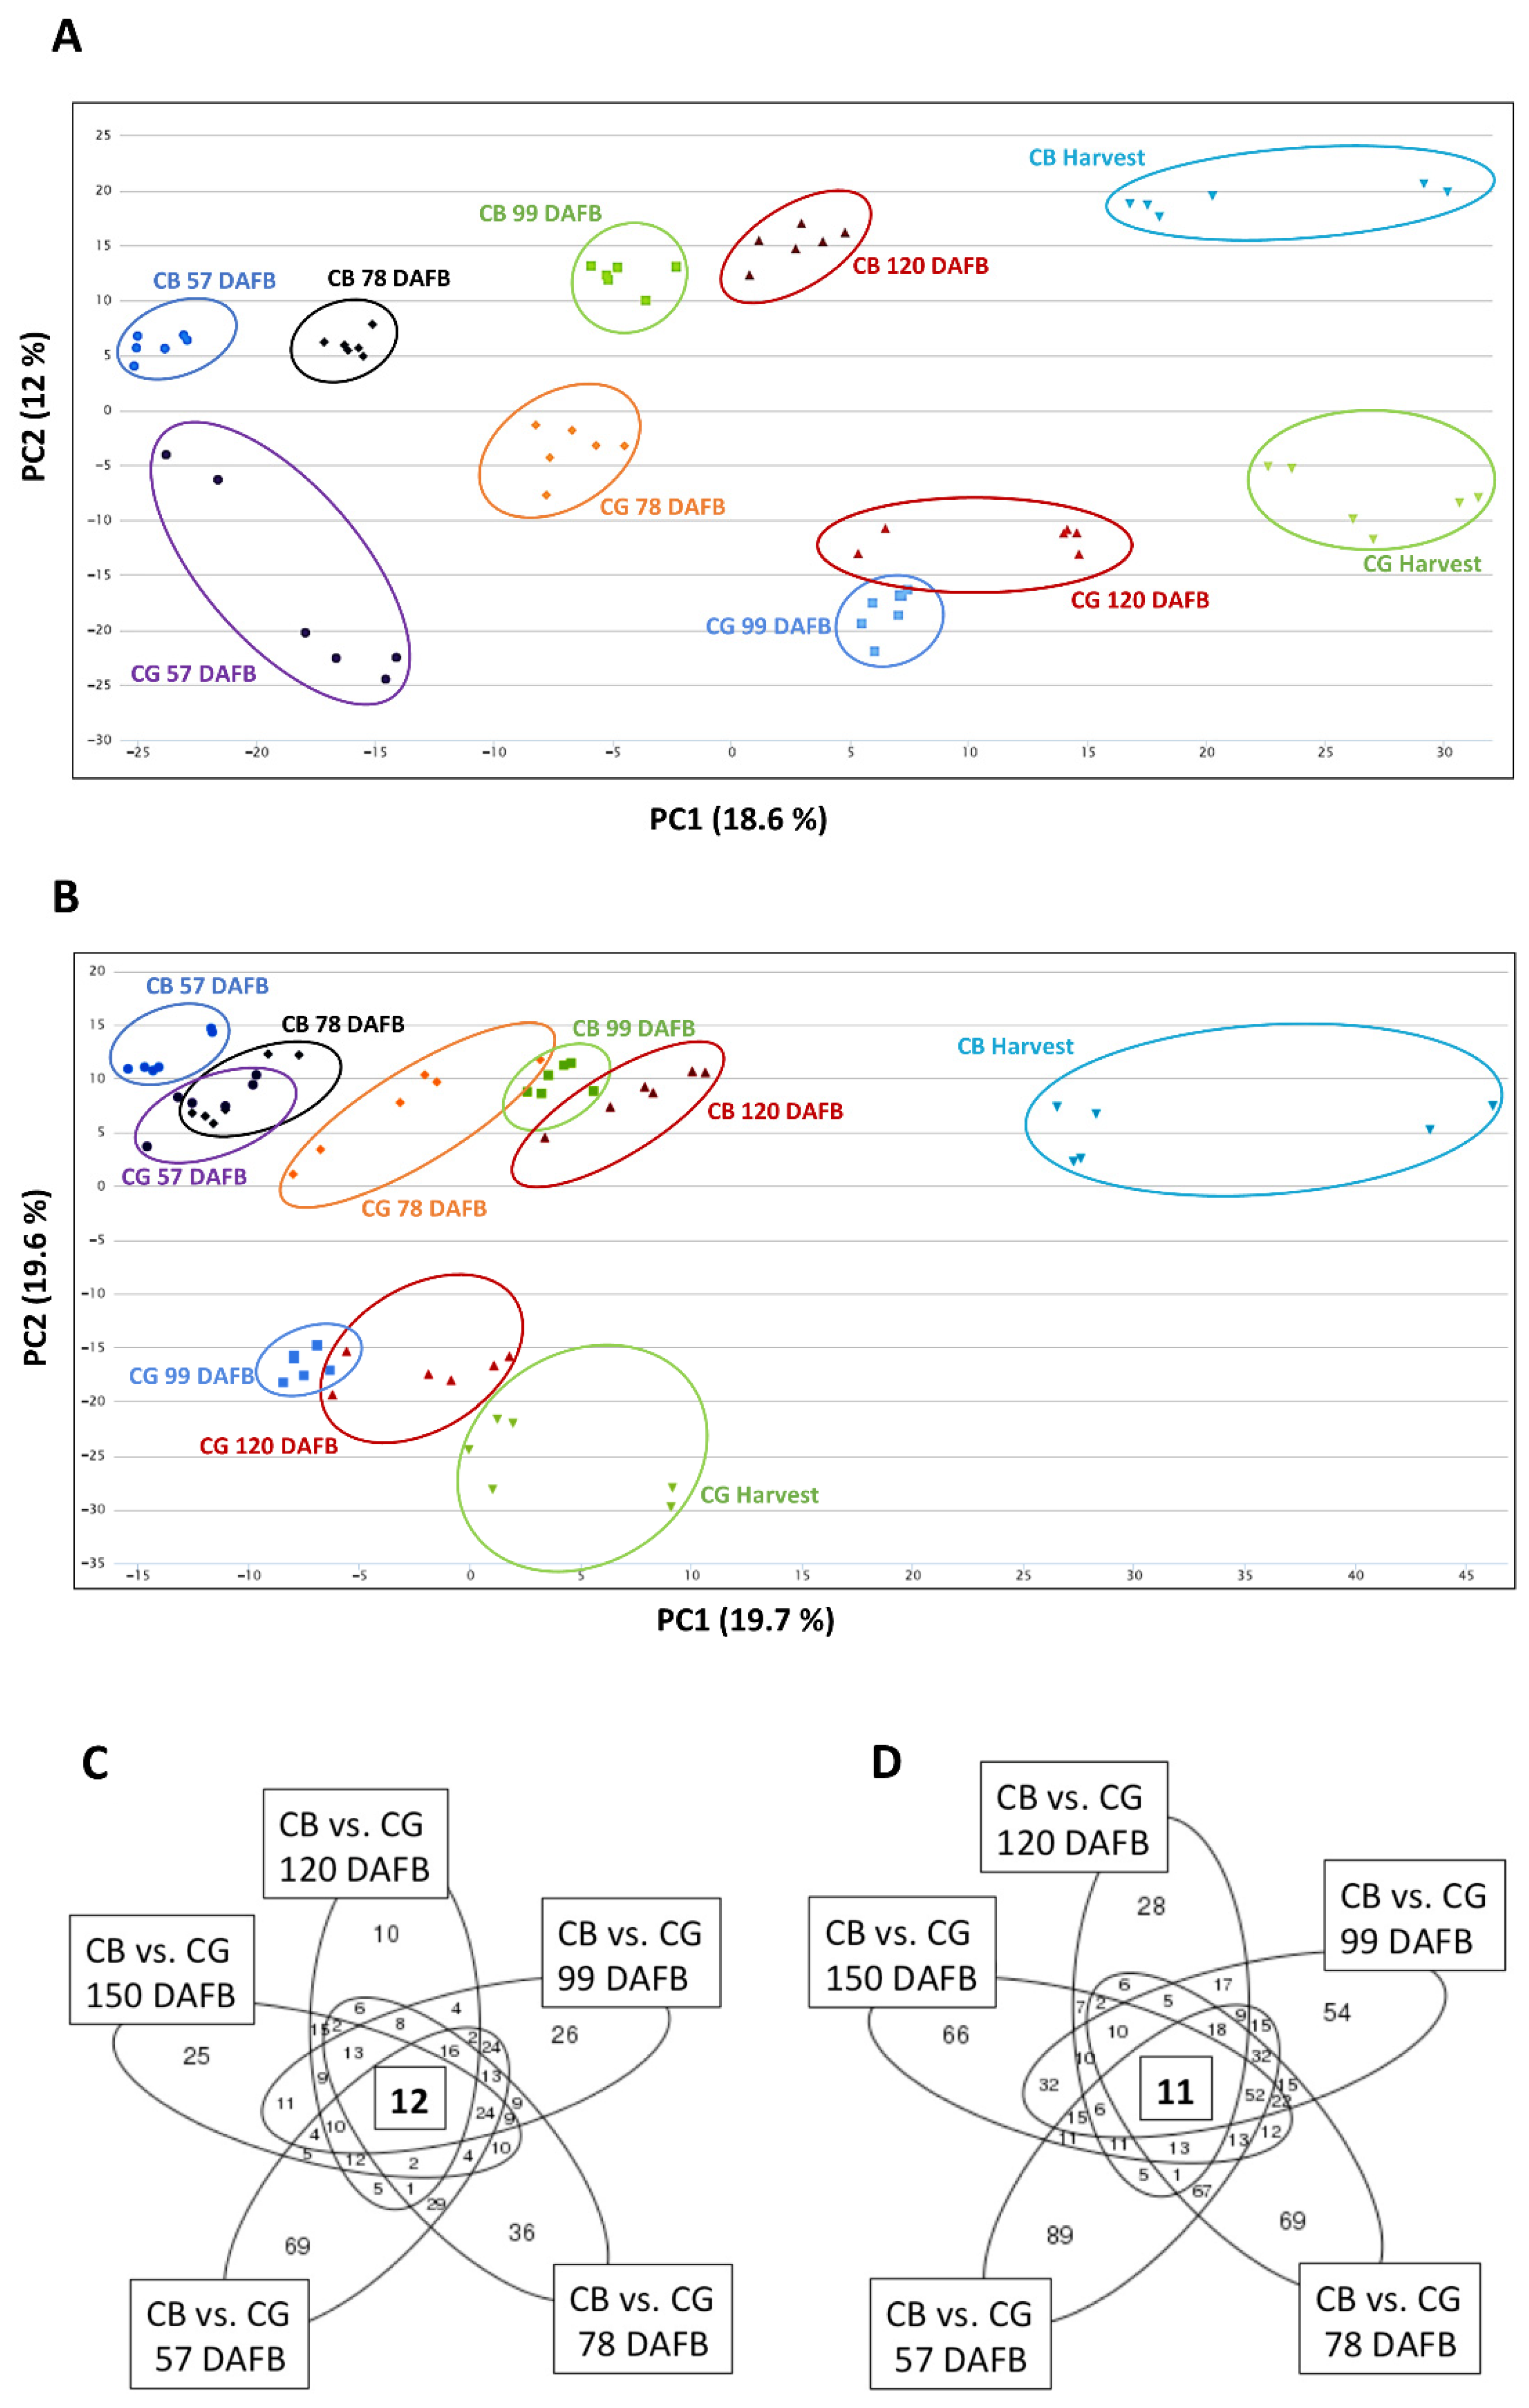
2.2. Untargeted Metabolomic Analysis between Russet CG and Non-Russet CB Skin during Fruit Development

In order to better understand the metabolic changes associated with fruit growth of CG and CB, metabolic profiling was performed using UPLC-TripleTOF in both negative and positive mode, generating 941 and 1477 features, respectively. Both multigroup comparisons and meta-analysis of independent two-group comparisons were performed in order to identify the key metabolites involved in russeting and fruit development. To our knowledge, this is the first time that such a metabolomic analysis has been performed. The non-supervised multigroup comparison included 10 independent groups (five time points and two varieties; stringent fold change cut-offs (−1 < log2 (Abundance ratio (CG/CB)) < 1 for each time point and/or abundance difference >2 through development within each genotype) were applied in order to highlight all metabolites that were associated with one of these two patterns. In negative and positive mode, 601 and 523 differentially abundant metabolite features were measured, respectively. A principal component (PC) analysis of the LC-MS metabolic profiles showed clear discrimination between the samples according to their degree of maturity (time points 1 to 5, from 57 DAFB to 150 DAFB or harvest) and their genotype (CB versus CG) (Figure 2A,B).
For both modes, PC1 was directly correlated with the fruit development, whereas PC2 mainly discriminated the two varieties and could thereby be associated with russeting markers. For each PC, the 40 most discriminating metabolite features (20 positively and 20 negatively correlated) were selected. After removal of fragment ions, adduct ions, and unclear mass spectra, 16 and 12 metabolites associated with PC1 and PC2, respectively, were putatively identified in negative mode. In positive mode, the putative identification of 9 and 11 metabolites for PC1 and PC2 were, respectively, undertaken (Table 1). Mass and fragmentation data are presented in Table S2 and include both negative and positive MS2 data when available. The metabolite changes associated with fruit development are described in Supplementary materials Section A. Most discriminant metabolites associated with russeting included hydroxycinnamic acids (compounds 9, 11, and 38, i.e., neochlorogenic acid, p-coumaroyl quinic acid, and an unknown coumaroyl derivative, respectively) as well as dihydrochalcones (compounds 17, 21, 22, 25). The abundance of these compounds was higher in CG than in CB from 57 DAFB.
In contrast, the levels of three flavonols (compounds 15, 18, 37), seven triterpenes (compounds 26, 27, 28, 40–43), and a C18:3 fatty acid (39) were drastically lower in CG as compared with CB skin (Table 1).
The meta-analysis highlighted the metabolites that were consistently differentially accumulated through the developmental series (Table 2). Shared differences are represented by the region at the center of the Venn diagram (Figure 2C,D). Whereas the phenolic acids (compounds 24, 33, 34, and 46) as well as the dihydrochalcone phloretin (25), were more abundant in CG than in CB, the level of quercetin-hexoside was lower in CG throughout the whole fruit development. The triterpenes identified with this analysis (compounds 27, 28, 44, 45, 47, 48) had a specific evolution pattern: while the levels were higher for CG than CB at 57 and 78 DAFB, the trend totally reversed after 99 DAFB, with CB accumulating more triterpenes.
Compounds 44 and 45 were of particular interest as they appeared to be conjugated triterpenes. Compound 44 presented a protonated molecular ion [M+H] at m/z 619.3993 corresponding to C39H5406, as well as fragments ions at m/z 437.3427 (consistent with the formula C30H45O2 and [M + H − C9H7O3 − H2O]) indicating the presence of a triterpene and the loss of a p-coumaroyloxy group and water, and at m/z 147.0425 confirming the loss of a hydroxy-triterpenic acid and the presence of a coumaroyl moiety. Furthermore, its UV spectrum showed an absorption λ max at 310 nm, supporting the presence of a hydroxycinnamoyl functionality. This hydroxy-triterpenic acid could be from the ursane (corosolic acid), oleanane (maslinic acid) or lupane (hydroxy-betulinic acid) series of triterpene. Further isolation and NMR investigation would be needed to determine the exact structure of this compound. In negative mode, an isomer of this compound was also identified (45). Considering the predominant amount of triterpenes from the ursane and oleanane family in waxy skin in general (Figure S1) [11], we could hypothesize that these two triterpene compounds were either 3β-trans-p-coumaroyloxy-2α-hydroxy-urs-12-en-28-oic acid or 3β-trans-p-coumaroyloxy-2α-hydroxy-olean-12-en-28-oic acid.

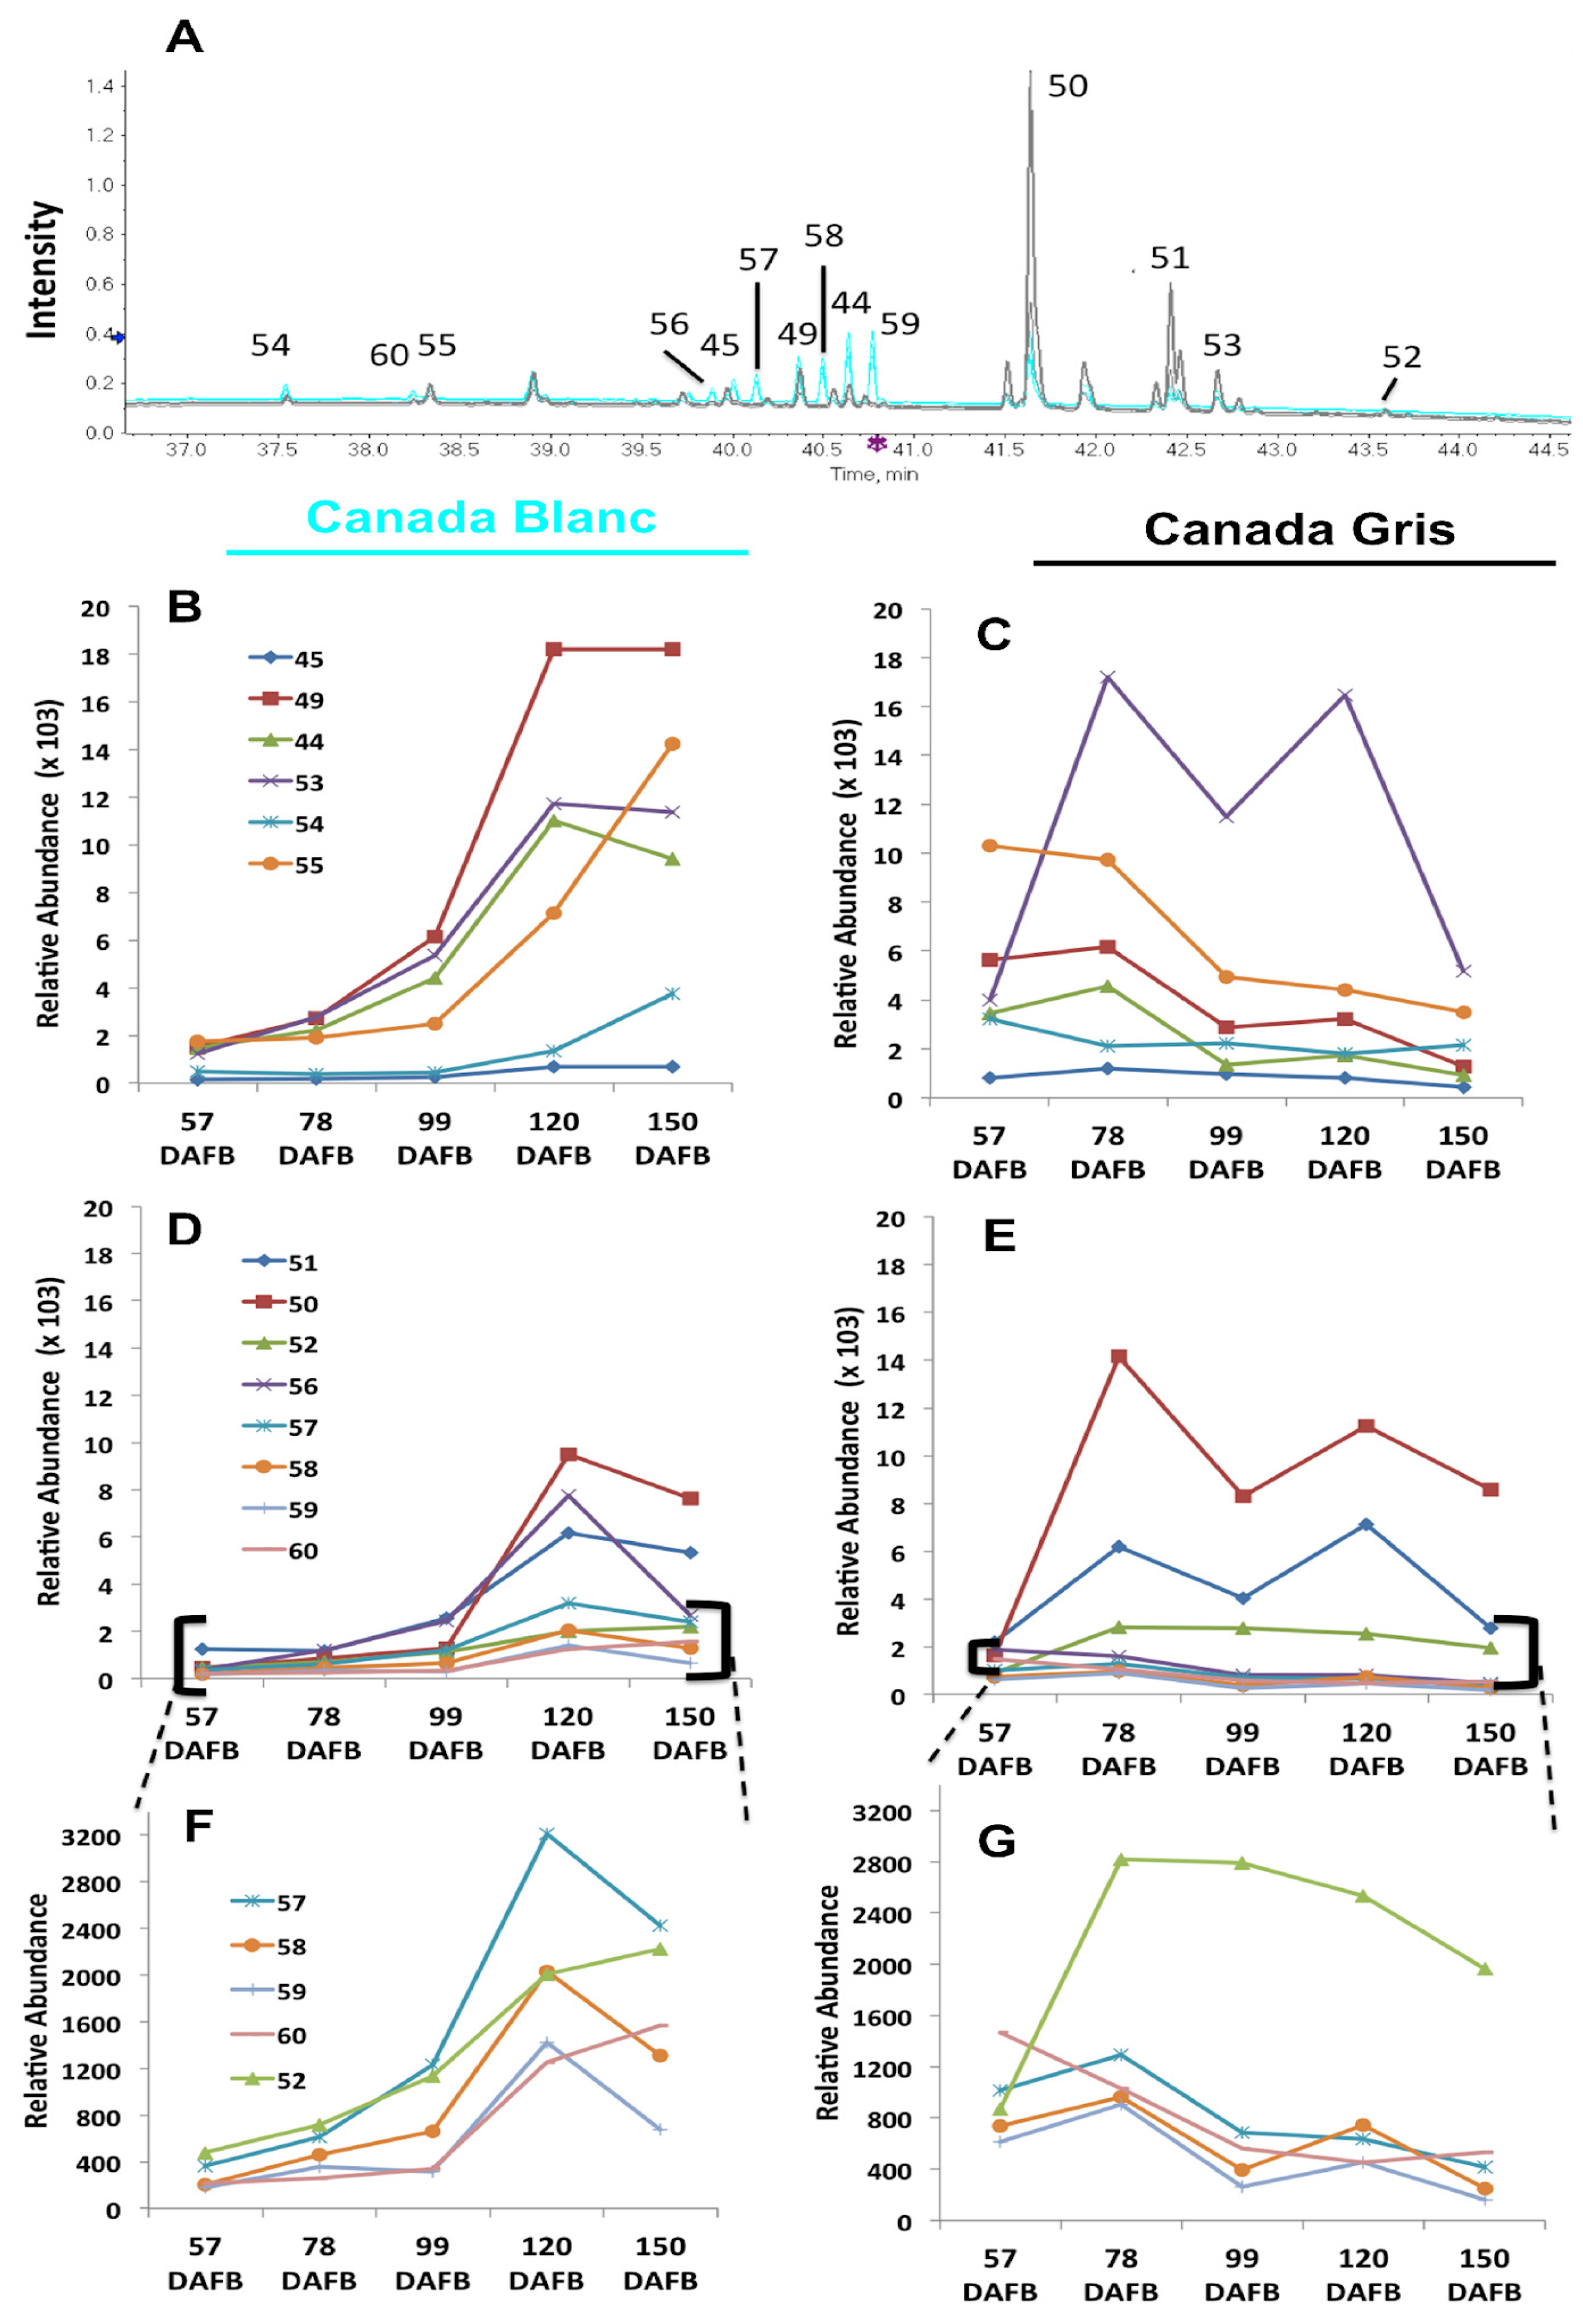
2.3. Targeted Triterpene-Hydroxycinnamate Analysis

Given the importance of triterpene-hydroxycinnamates in the incidence of russeting, identified through statistical analyses (Figure 2) and in its human health potential [19], a more specific analysis of the triterpenes esterified with p-coumaroyl or caffeoyl moieties was carried out using the differentially accumulated list of compounds (p-value < 0.01, FC > 2). The different triterpene-hydroxycinnamates were first highlighted using the diode array detection (DAD) at wavelengths between 300 nm and 320 nm (Figure 3A) and then identified in negative mode, as they were better ionized in that mode. Their mass spectra were recorded, and ions at m/z 601, 617, 633, and 649 were detected (see Table S2 for exact mass and fragmentation data). According to their fragmentation pattern, we could infer a coumaroyl or caffeoyl conjugation with the triterpenes. For CB, both triterpene-coumarates and triterpene-caffeates tended to increase during fruit development, particularly at 120 DAFB (Figure 3B–G.) At the first two time points, the levels of both triterpene-coumarates and triterpene-caffeates were higher in CG than in CB. However, in CG, they typically decreased 99 DAFB and remained low until harvest time, except for 4 compounds (50, 51, 52, 53). The amounts of these four compounds appeared to increase from 78 DAFB. The identity of compound 50 was confirmed to be 3-O-caffeoyl-betulinic acid as described in our previous study [9,15], and its absolute quantity was further estimated (Figure S1). Compounds 51 and 52 were also caffeoyl-triterpene derivatives. Compound 53 behaved differently as compared to the other triterpene-coumarates, following the same trend as the caffeoyl derivatives. Considering the high amount of triterpenes of the lupane series in russeted tissues, the presence of a deprotonated molecular ion [M-H] at m/z 601.3911 corresponding to C39H5405, a fragments ion at m/z 145.0301 confirming the loss of a triterpenic acid (C30H4603) and the presence of a coumaroyl moiety, 53 was putatively assigned as 3-O-coumaroyl-betulinic acid.

2.4. Proteome Analysis Overview

The proteome analysis of fruit growth development of CG and CB identified 522 proteins in at least one of the five time points (Table S3). A fold change cut-off value was set in order to retain proteins presenting at least a 50% increase or decrease between NSAF values (−0.58 < log2 ratio (NSAF CG/NSAF CB) > 0.58). The MapMan tool was used to highlight proteins and pathways, which are the most affected by the phenotype difference of CG and CB [20] (Figure S2). Among these, protein metabolism and RNA processing were among the most affected functional categories. A large number of proteins involved in photosynthesis, e.g., RuBisCO subunits, varied inconsistently between CB and CG, suggesting that they were not correlated with the studied trait. A limited number of proteins involved in carbohydrate, cell wall, lipid, and secondary metabolism were differentially regulated, in contrast with the gene expression profiling results. We can speculate that these differences might be due to the relatively lower abundance of the proteins participating in these pathways, particularly in the secondary metabolism.
The signaling and hormone metabolism pathways, including ethylene metabolism and calcium-dependent signaling cascade members, were also well represented in this dataset, indicating a possible role in the regulation of russeting within these two different phenotypes. Further investigation on the hormonal pool might also be very informative to elucidate the role of each of phytohormone in the onset suberin deposition.
Finally, the miscellaneous bin group of features with no clear or multiple associations in these different pathways was one of the most represented groups in these data and included some relevant proteins such as lipases and peroxidases.

2.5. Differentially Expressed Genes between CB and CG

Filtered reads were mapped to the M. × domestica predicted transcriptome v1.0 [21] (See Table S4 for all sequencing, mapping, and filtering statistics). Overall, a large majority of genes were up-regulated in CG, suggesting the presence of additional metabolic pathways in russeted tissues (Table S5), as observed in previous transcriptomic data sets [6,15]. Complete linkage hierarchical clustering analysis based on a Pearson correlation identified nine clusters of genes with similar expression patterns (Figure S3). The clusters C1 (16 genes), C2 (272 genes), and C3 (45 genes) encompassed genes showing a strong and increasing expression in CB throughout fruit development. In CG, at the early time points of the kinetics (57 and 78 DAFB), these genes were slightly less expressed compared to with CB variety, and their expression further decreased in the latest time-points (99, 120, 150 DAFB). A GO analysis of clusters 2 and 3 defined five groups, which can be summarized as lipid metabolism (orange), lipid transport (pink), response to stress (light blue), plant epidermis morphogenesis (purple), and hormone biosynthesis (dark blue), with the fatty acid, cutin, and waxes biosynthesis being the most represented biological processes (Figure 4A).
Clusters C4 (275 genes), C5 (13 genes), C6 (42 genes), and C7 (356 genes) included genes with an enhanced expression pattern in CG at 78, 99, and 120 DAFB. A GO enrichment analysis performed on these clusters highlighted genes involved in fatty acid and secondary metabolism (purple), in cell wall biosynthesis and regulation (dark blue and light blue, respectively), and finally organ morphogenesis (orange) with the phenylpropanoid, lignin, flavonoid, suberin, and the secondary cell wall biogenesis being the most represented biological processes (Figure 4B). Finally, the C8 (16 genes) and C9 (35 genes) clusters include only moderately correlated genes with higher expression in CG at later sampling dates. These seemed to be associated with aging and senescence (Table S5).

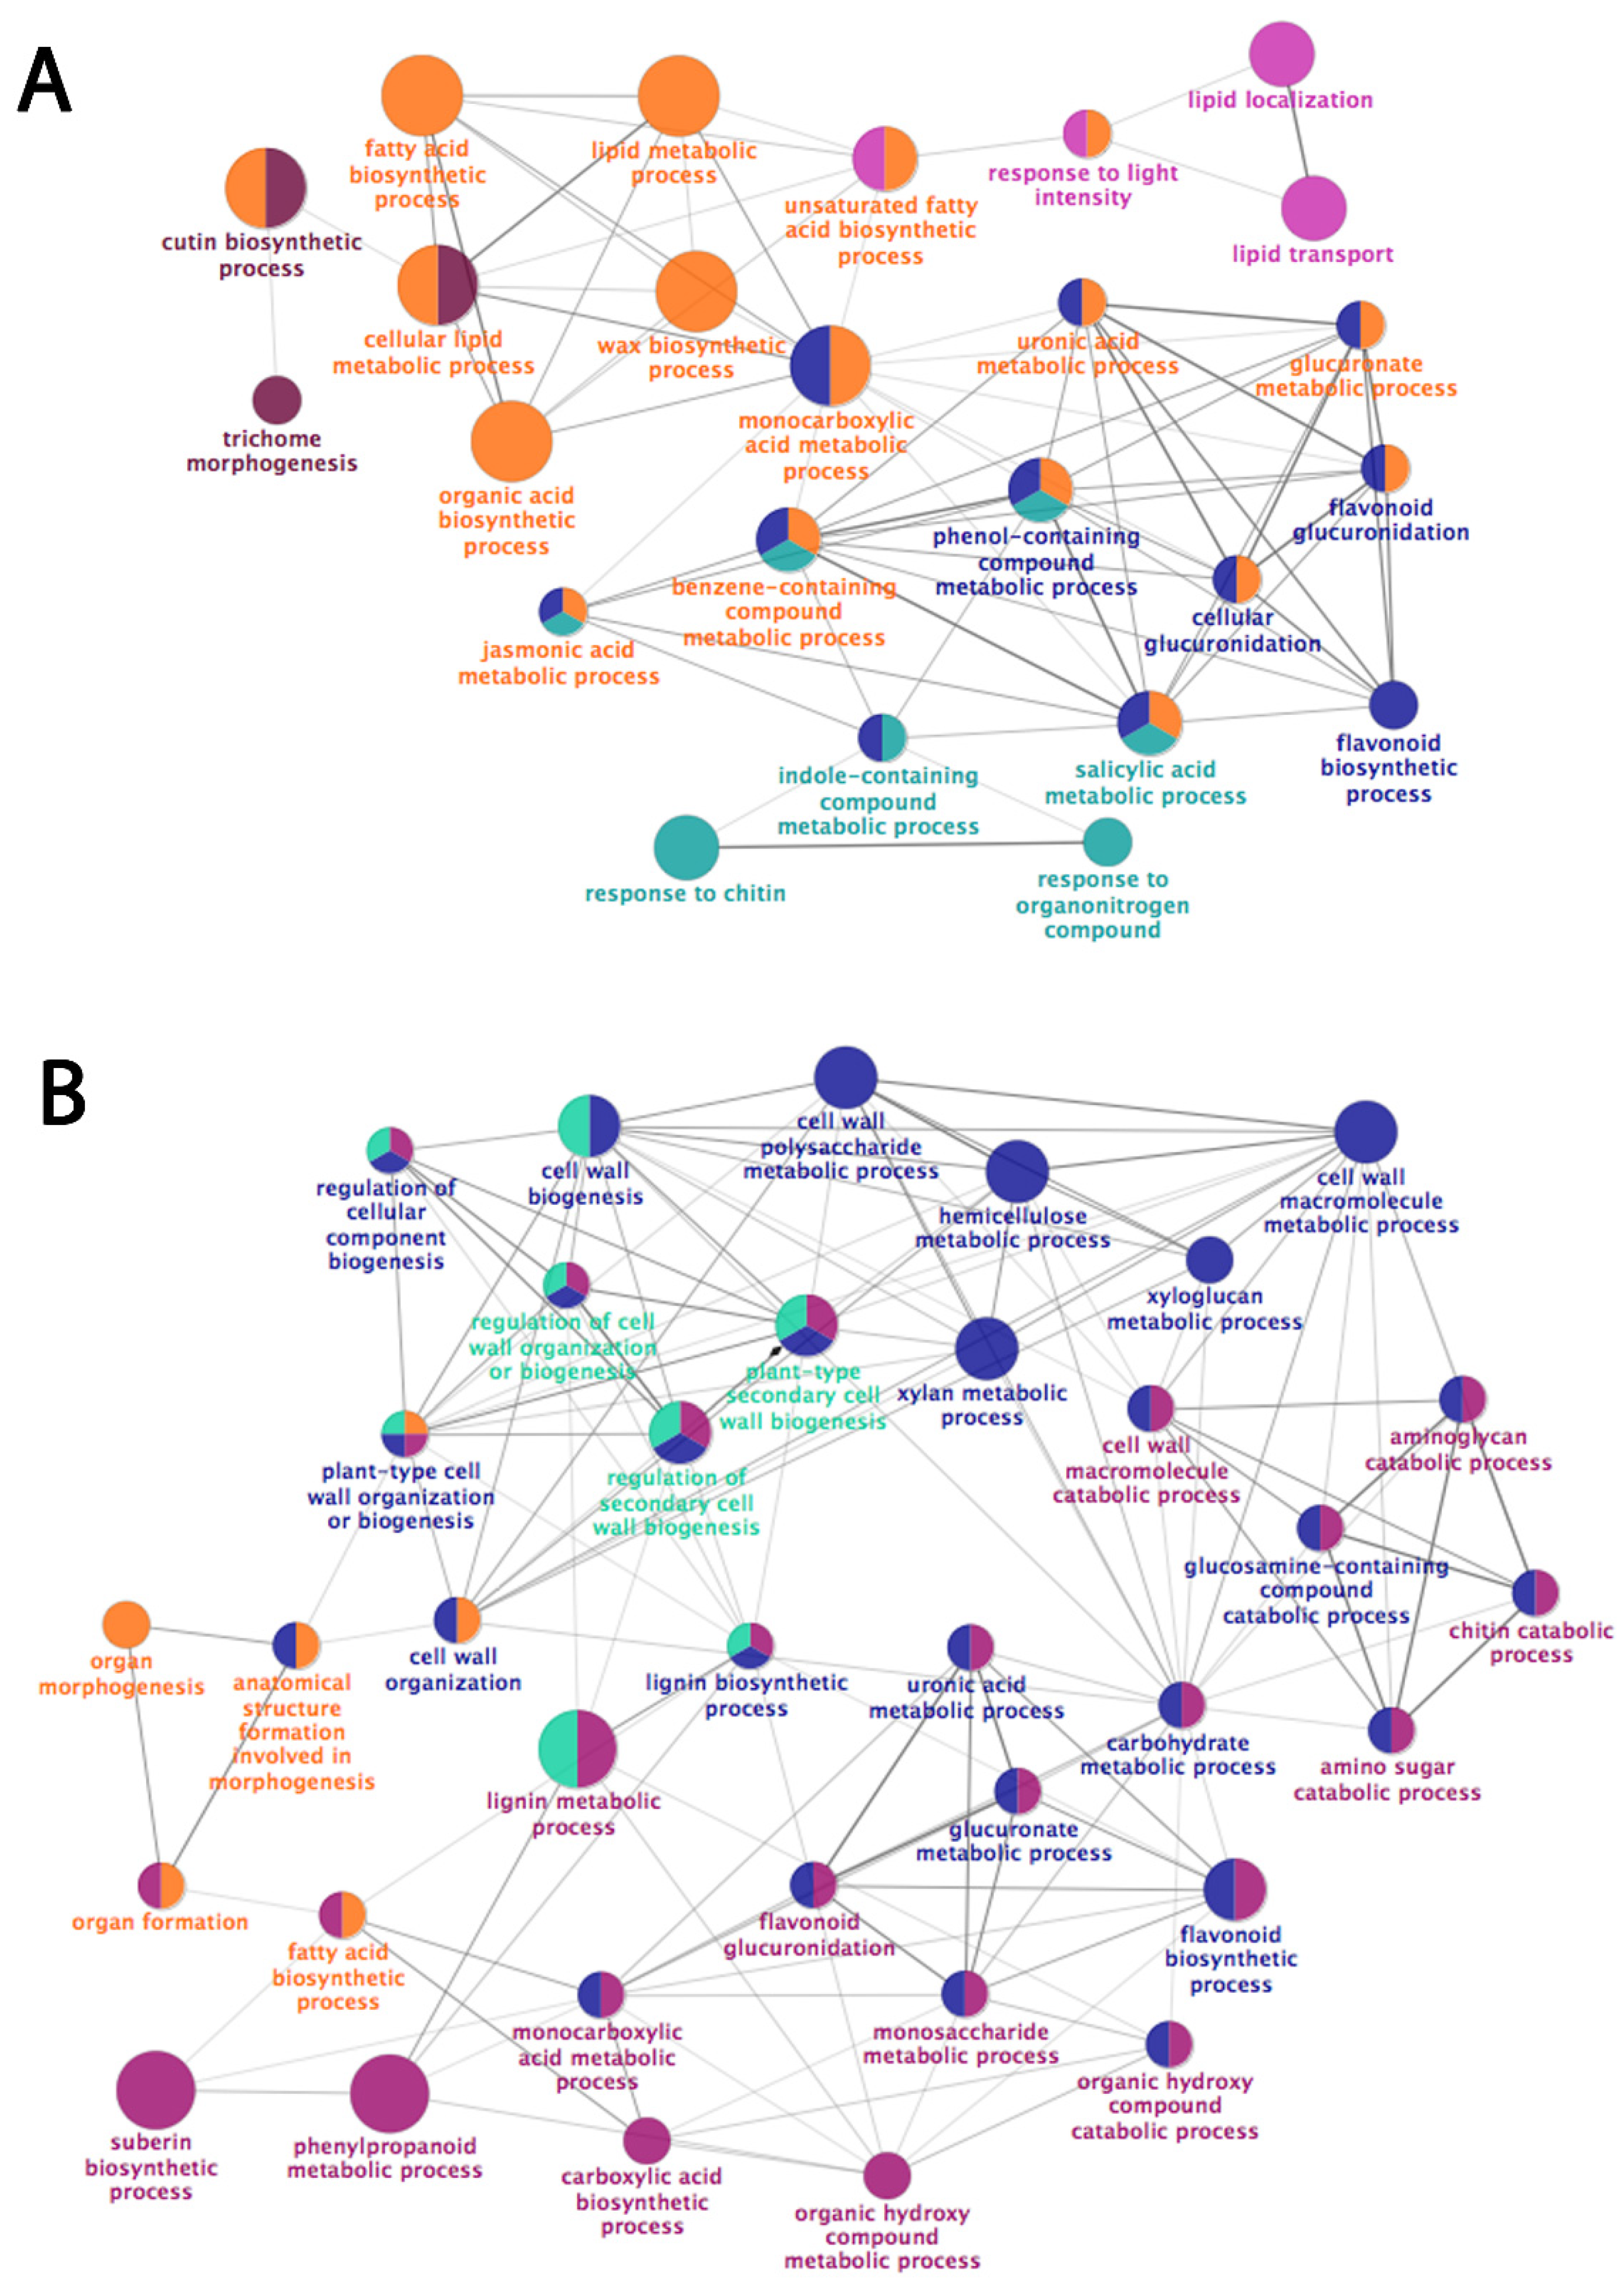
2.6. Cuticle Deposition Markers Show Increased Expression in the Waxy CB Cultivar Both at the Transcriptional and Protein Level

The primary fatty acid metabolism appears more active in the waxy CB as compared to the russet CG. A proteomic analysis indicated some acyl activating enzyme and acyl-Coenzyme A (CoA) oxidase, which were up-regulated in CB at the harvest time-point (Table 3). These two proteins are involved in CoA activation and the dehydration of carboxylic acids occurring during the synthesis and modification of carboxylic acid precursors. Acetoacetyl-CoA thiolase, which belongs to the β-oxidation process, showed increased gene expression and protein abundance in CB through all the time periods sampled (Table 3 and Table S6). Several fatty acid desaturase (FAD), which are involved in core fatty acid synthesis, were up-regulated in CB as compared with CG. Enhancement of the β-oxidation process was also supported by two peroxisomal 3-ketoacyl-CoA thiolase proteins that showed increased expression in CB 150 DAFB. A number of genes involved in cutin and wax synthesis, including 3-ketoacyl-CoA synthase 6 (KCS6), fatty acid hydroxylase (CER1), WSD1, glycerol-3-phospahate acyltransferase 6 (GPAT6), and the cytochrome P450(CYP)77A4, were strongly up-regulated in the waxy cultivar CB (Table S6). Some BAHD acyltransferases were also strongly expressed at the transcriptional and protein level in waxy intact skin and might be implicated in the preliminary oligomerization step of cutin synthesis. Similarly, several GDSL-lipase and α/β-fold hydrolase, likely involved in the last steps of cutin assembly, showed an increase abundance of both proteins and transcripts in CB (Table 3).
In terms of cutin-related triterpene synthesis, the core gene expression data did not show any oxidosqualene cyclase (OSC) genes specifically expressed in the non-russeted (waxy) variety CB (Table S5). However, a protein similar to MdOSC1 (accession FJ032006.1; MDP0000227287) showing an enhanced abundance in CB at the commercial harvest time point was found in the proteomic data (Table 3). In previous work, MdOSC1 was found to be predominantly expressed in non-russeted apple skin, and the encoded enzyme was shown to produce α-amyrin and β-amyrin [10]. A CYP716A1-like gene and protein corresponding to MDP0000478473, displayed higher expression and abundance in CB (Table 3). MDP0000478473 is very similar to the published triterpene monoxygenase CYP716A175 (accession EB148173), which is responsible for the final conversion step of α-amyrin, β-amyrin, and lupeol into ursolic, oleanolic, and betulinic acid, respectively [10].
The lipid transport process associated with cutin and wax deposition was notably affected in the russeted CG apple, with decreased gene expression for the transporters WBC11 (ABCG11—MDP0000200335), ABCG32 (PDR4), ABCG15, and ACBP6. Three genes coding lipid transfer protein 3 (LTP3) were strongly repressed in CG compared to CB. In particular, MDP0000285074 displayed extremely high expression values in CB ranging from 23,540 RPKM at 57 DAFB to 64,941 KPKM at the commercial harvest time point. This gene was between 4 to 24 times less expressed in CG as compared to CB. Two proteins corresponding to two of the three LTP3 gene models that were found in the proteomic data followed the same trend (Table 3).
The expression of MDP0000285074 was significantly correlated with a number of metabolites that were more abundant in the waxy CB (Table 1). Metabolites included cutin-associated wax components such as a C18:3 fatty acid (compound 39) and triterpenes (compounds 27, 28, 40–44). Betulinic acid and betulinic acid-3-trans-caffeate are known russet markers and were added in Figure 5 to emphasize their opposing behavior.
The decreased expression of cutin synthesis genes was accompanied by lower expression of several transcription factors, i.e., the SHN1-like (MdSHN3) and MYB94, MYB15, MYB16, MYB17, MYB73, MYB106, and RD22 (Table S6). Only one protein, similar to MYB17, displayed a slightly higher accumulation in CB (Table 3).

2.7. Increased Abundance of Suberin-, Cell Wall- and Triterpene-Related Transcript and Proteins in the Russet CG Cultivar

A substantive number of genes over-expressed in the russet CG were involved in the synthesis of the suberin building blocks (Figure 4). Genes from fatty acid metabolism, such as KCS2, KCS4, the fatty acid hydroxylase CYP86A1, the very long-chain fatty acid hydroxylase CYP86B1 genes, fatty acyl-coenzyme A reductase 5 (FAR5) were all tightly linked with the russet phenotype. Two GPAT5 genes coding for enzymes producing the suberin monomer sn-2 monoacyl-glyceryls were also strongly expressed in CG compared with CB.
Suberin-related triterpene synthesis was also noticeably different with four genes coding for lupeol synthase-like activity up-regulated, as well as squalene epoxidase (SQE1), responsible for the production of the triterpene precursor 2,3 oxidosqualene (OSC), and a CYP450 enzyme (Table 4).
Suberin-associated waxes are comprised of a large number of alkyl-hydroxycinnamate conjugates produced by BAHD hydroxycinnamoyl transferases [7,22]. Seven HXXXD-motif BAHD acyltransferases were also co-expressed with these suberin biosynthesis genes (Table 4). Among them, two gene models (MDP0000312405, MDP0000258308) belonged to clade V [23], and appeared to be closely related to the potato enzyme StFHT (fatty ω-hydroxyacid/fatty alcohol hydroxycinnamoyl transferase) and the Arabidopsis ortholog feruloyl hydroxycinnamoyl transferase (At5g41040) involved in suberin formation (Figure 6).
We postulated that some members of HXXXD-motif BAHD acyl transferases might participate in the esterification of triterpenes with hydroxycinnamates. In the present data, we found 22 gene models coding for BAHD Acyltransferase HXXXD-type acyltransferase family protein that was differentially expressed and performed correlation analysis with the relative abundance of the triterpene-hydroxycinnamates identified in this study (Table S7). As expected, the seven genes reported in Table 4 were significantly and highly correlated (p-value < 0.01, r > 0.78) with the conjugated triterpenes 45 and 50–53 (Table S7, Figure 6).
ATP-binding cassette subfamily G (ABCG2, ABCG6, ABCG11 (MDP0000193438), and ABCG23) and non-specific lipid transfer proteins (LTPG5, LTPG16 (EDA4), and several LTPG20) were associated with the russeting phenotype (Table 4). Two LTPG20 proteins also accumulated at 78 and 120 DAFB (Table 3). Differential expression was observed in genes associated with the phenylpropanoid pathway, particularly genes linked to suberin polyphenolic domain synthesis (Table 4 and Table S6), consistent with the increase of hydroxycinnamic acids in russet tissue observed during metabolomic analysis (Table 1).
A number of genes involved in cell wall biosynthesis and modification, particularly the expression of those involved in the modification of hemicelluloses (xyloglucan endotransglucosylase/hydrolases and expansins) and lignin (peroxidases and laccases), were found to be up-regulated both at the protein and transcript level (Table 3 and Table 4).
Several transcription factors from the MYB and NAC families (17) were strongly associated with the russet phenotype of CG and might be regulating the transcription of the BAHD acyltransferases (Table 4).

3. Discussion

3.1. The CB/CG Apple Mutational Sports Present Different Skin Phenotype

Our study compared the metabolome, proteome, and transcriptome during fruit development of two genetically close apple varieties, CG and CB. Both varieties displayed a perfect identity in alleles, and generally, both presented similar growth behaviors. Yet, CG and CB presented a distinct fruit skin phenotype, i.e., a russet and a waxy skin, respectively (Figure 1), suggesting that the difference in the genotype might result from one or more localized gene mutations. Apple is particularly sensitive to mutations that can be triggered by multiple causes, such as transposable elements. A study identified an ATP binding cassette family G (ABCG) linked with cuticle deposition as a major quantitative trait locus (QTL) leading to russeting. However, many other genes might also result in the development of apple russeting [24]. At 57 DAFB, CG was already fully russeted, indicating that microcracks in the skin, responsible for the onset of russeting [2], had already occurred. In fully russet apple varieties, russeting can occur as early as 40 DAFB [15].

3.2. Metabolomics Analysis Revealed Key Phenolic and Triterpene Compounds Associated with Skin Phenotype

The abundance of several metabolites was different between phenotypes (Table 1). Two families of compounds were particularly important in discriminating CB and CG: the triterpenes and the phenolic compounds. The waxy phenotype (CB) showed a metabolic profile where phenolic compounds from the flavonol family were predominant, including numerous quercetin derivatives. These phenolic compounds are potent antioxidants and play an important role in protecting the fruit skin against UV light [19]. In contrast, the russet skin phenotype was characterized by higher levels of hydroxycinnamic acids and dihydrochalcones. The relationships between phloretin (dihydrochalcone) derivatives, e.g., phloridzin and suberin synthesis, were previously highlighted in apple cultivars [19,25]. Increased phenolic concentrations were associated with increased expression levels for some related biosynthetic enzymes such as PAL1, 4CL, and HCT. Whilst the level of chlorogenic acid, a major phenolic compound in apple, was not a major discriminating factor between CB and CG, its oxidized versions, chlorogenoquinone (33) and cryptochlorogenoquinone, were. Interestingly, this suggests a higher level of oxidative stress in CG from as early as 57 DAFB [19,26]. The suberin polyphenolic polymerization occurring during suberization was also associated with an increased expression of lignin-related oxidative enzymes such as peroxidases (PRX52, PRX72) and laccases (LAC7, LAC14, LAC15) (Table 3, Figure 4). Application of an exogenous solution of chlorogenic acid at an early developmental stage (30 DAFB) inhibited russet formation in the cultivar ‘Golden Delicious,’ hypothetically through repression of lignin synthesis [27]. From our study, such a direct effect of chlorogenic acid appears unlikely considering the opposite trends of its concentration in CG and CB.
Pentacyclic triterpenes are an integral part of apple skin wax and, more particularly, of the suberin-associated waxes in russet skin and of the cutin-associated ones in non-russet skin [7]. Eleven triterpenes (compounds 26, 27, 28, 40–48) were among the most discriminant variables highlighted in the multigroup comparison (Figure 2A,B) and the meta-analysis (Figure 2C,D). The triterpene derivatives predominating in CB are likely to be part of the ursane or oleanane family, the predominant pentacyclic triterpenes found in waxy apple skin [11,19]. Furthermore, the targeted analysis of the apple triterpenes confirmed the data from previous studies, i.e., a predominance of ursolic and oleanolic acids in waxy tissue (CB) and the shift in triterpene metabolism in russet tissue (CG), particularly an increase in the amount of lupane derivatives, including betulinic acid and betulinic acid-3-trans-caffeate (BAC). This trend was observed at the metabolic level from the earliest time point: 57 DAFB (SI Figure 1) [15,19].
While the core gene expression data did not show any OSC genes specifically being expressed in the non-russeted variety CB, we further investigated the full dataset and found two OSC gene models similar to MdOSC1 (MDP0000227287 and MDP0000474746), which were statistically highly expressed in CB during the whole kinetics (FDR p-value < 0.05) but did not meet the fold change cut-off value (Fold change > 4). MDP0000478473, coding for the published triterpene monoxygenase CYP716A175 was over-expressed and accumulated in CB (Table 3). Interestingly, CYP716A175 did not exhibit any tissue-specific expression when tested against a panel of russeted and non-russeted varieties [10]. The differential expression observed in the present work might be, therefore, considered as specific for the CG/CB couple. Four other OSCs followed the expression pattern of the core suberin synthesis genes (clusters C4-C7, Table 4). One OSC gene was identified as the MdOSC5 (accession KT383436, MDP0000266125), previously shown to produce lupeol and β-amyrin in a 95:5 ratio [10]. The three other OSC genes were annotated as lupeol synthase or terpenoid cyclase/beta amyrin synthase and needed further functional validation.
We highlighted for the first time the presence of various triterpenes linked to hydroxycinnamic acids (Figure 3). The opposing trends in triterpene-hydroxycinnamate abundance in CB and CG throughout fruit development indicate that these compounds are key molecules working at the interface between the suberin-related phenylpropanoid pathway and the cutin-related triterpene pathway. In CG, putative ursane and oleanane related-triterpene-coumarates decreased as fruit developed along with the concentrations of ursolic and oleanolic acid. Initial levels (57 DAFB) of these specific conjugated triterpenes were, however, higher in CG as compared to CB (compounds 44, 45, 49, 54, 55). In the russeted variety (CG), genes responsible for the lupane series synthesis, such as the MdOSC5, as well the triterpene-caffeates were differentially expressed in a way that was highly correlated with the suberin-related genes (clusters C4–C7). Considering the relatively high proportion of triterpenes in the apple waxes and that differential accumulation is highly correlated with the russet/non-russeted trait, we might speculate that the lupanes and the hydroxycinnamate conjugates biosynthesis pathways share a common regulatory network with the suberin deposition pathway. We have previously demonstrated that the transcription factor (TF) MYB66 (MDP000124555, MD09G1183800) was able to bind to the promotor region of MdOSC5 and activate the biosynthesis of lupeol. The expression of MYB66 was significantly linked to the production of lupane-derivatives in the russet mutant of ‘Golden Delicious’ (‘Rugiada’) [15]. In the current dataset (CB-CG), MYB66 expression was also associated with CG but did not exceed the fold change cut-off value (fold change > 4). It cannot be excluded that other TFs are involved in the russet-specific triterpene production and that different mechanisms occur in different apple varieties.

3.3. Loss of Cuticle Integrity in CG Is Associated with Low Abundance of Proteins and Transcripts Coding for Lipid Transfer Protein 3 (LTP3)

We showed that the biological processes linked to cutin and wax (including triterpene) synthesis were downregulated in apples with fully russeted skin compared with non-russeted skin at the first time-point in this study (57 DAFB) and further decreased over the period 78 days to 150 DAFB (Table 3 and Table S6), consistent with previous studies [15]. In the current work, the use of metabolomics and proteomics allowed us to identify potentially important ‘players’ in the cuticle integrity, namely the lipid transporters, which were strongly differentially affected in the CB/CG mutant couple.
In the present data, specific transporters for cutin and its associated wax were identified on the one hand, while some others appeared to be specific to the transport of suberin monomers and their associated wax components. Gene expression for WBC11 (ABCG11—MDP0000200335), which is involved in extracellular transport of the cutin monomers and wax esters [28], displayed a similar trend as that observed for the related metabolic enzymes (Table 3). ABCG32 was described in Arabidopsis to be a major transporter of cuticle monomers [29], while ABCG15 is involved in cuticle synthesis in rice [30]. ACBP6 is localized both in the extracellular space and in the cytosol, its function is mainly associated with C16, C18, and C18:1 fatty acids transports from plastids. In Arabidopsis, the acbp6 loss-of-function mutant displayed impaired development of the cuticle layer, suggesting that ACBP6 might be associated with the strong decrease in expression of the cutin and wax synthesis genes observed in our data [31].
Both the gene expression and the protein abundance of MDP0000285074, coding for a lipid transfer protein 3 (LTP3), were strongly up-regulated in CB (Table 3). Further correlation analyses between MDP0000285074 and wax components (fatty acid and triterpenes) underlined its putative involvement in lipid/triterpene transport. LTPs are quite small, soluble, non-specific transporters that are thought to be involved in several biological processes, including cell lipid homeostasis and cutin assembly [32,33].
This transporter was not found to be significantly regulated between waxy and russeted exocarps during our previous bulk gene expression profiling study [6]. Differences in expression between the varieties were also observed, but these were not correlated with the russet/waxy phenotype. In the study on the ‘Golden Delicious’ mutants, LTP3 (MD12G1187100) was also much more expressed in the waxy non-russet cultivar as compared to the russet one [15]. LTP3 might play a crucial role in the transport of waxes or cutin monomers in apples, something that would be worth further investigating. The lower accumulation of LTP3 (encoded by MDP0000285074 in particular) may, at least in part, explain the differential phenotype between CB/CG. A variant calling analysis on the genome between these two mutants could help to identify where the mutation occurs in CG and if there is any difference in the promotor regions of the LTP3 genes.
Russet-specific transporters were identified in the transcriptomic data, including ABCG2, ABCG6, ABCG23, ABCG11, and different LTPG. In A. thaliana, ABCG2 and ABCG6 are crucial partners of the suberin deposition in seed coat, and ABCG23 was co-expressed with some suberin synthesis genes such as the GPAT5 [34]. The ABCG11 transporter has been previously associated with cutin and wax deposition [35]. However, another study suggested that ABCG11 affected the normal development of the cuticle, in both fruit and reproductive organs, and suberin, in roots [36]. In our study, we observed two ABCG11 genes (MDP0000193438 and MDP0000200335, located on LG4 and LG12, respectively) that displayed inverse expression patterns depending on apple skin phenotype (russet/waxy) (Table 4 and Table S6), supporting the suggestion that there might be suberin- and cuticle-specific ABCG11 transporters, respectively. MDP0000200335 (LG12) was also identified as a major russeting determinant according to a QTL mapping analysis [24].
LTPG transporters present a glycosylphosphatidylinositol (GPI)-anchor at the C-terminal region, which links the protein to the external side of the plasma membrane. In silico analysis of the expression pattern of the A. thaliana LTPGs showed that LTPG5, LTPG16, and LTPG20 participate in phenylpropanoid and suberin metabolism. However, their exact function remains undefined [37].

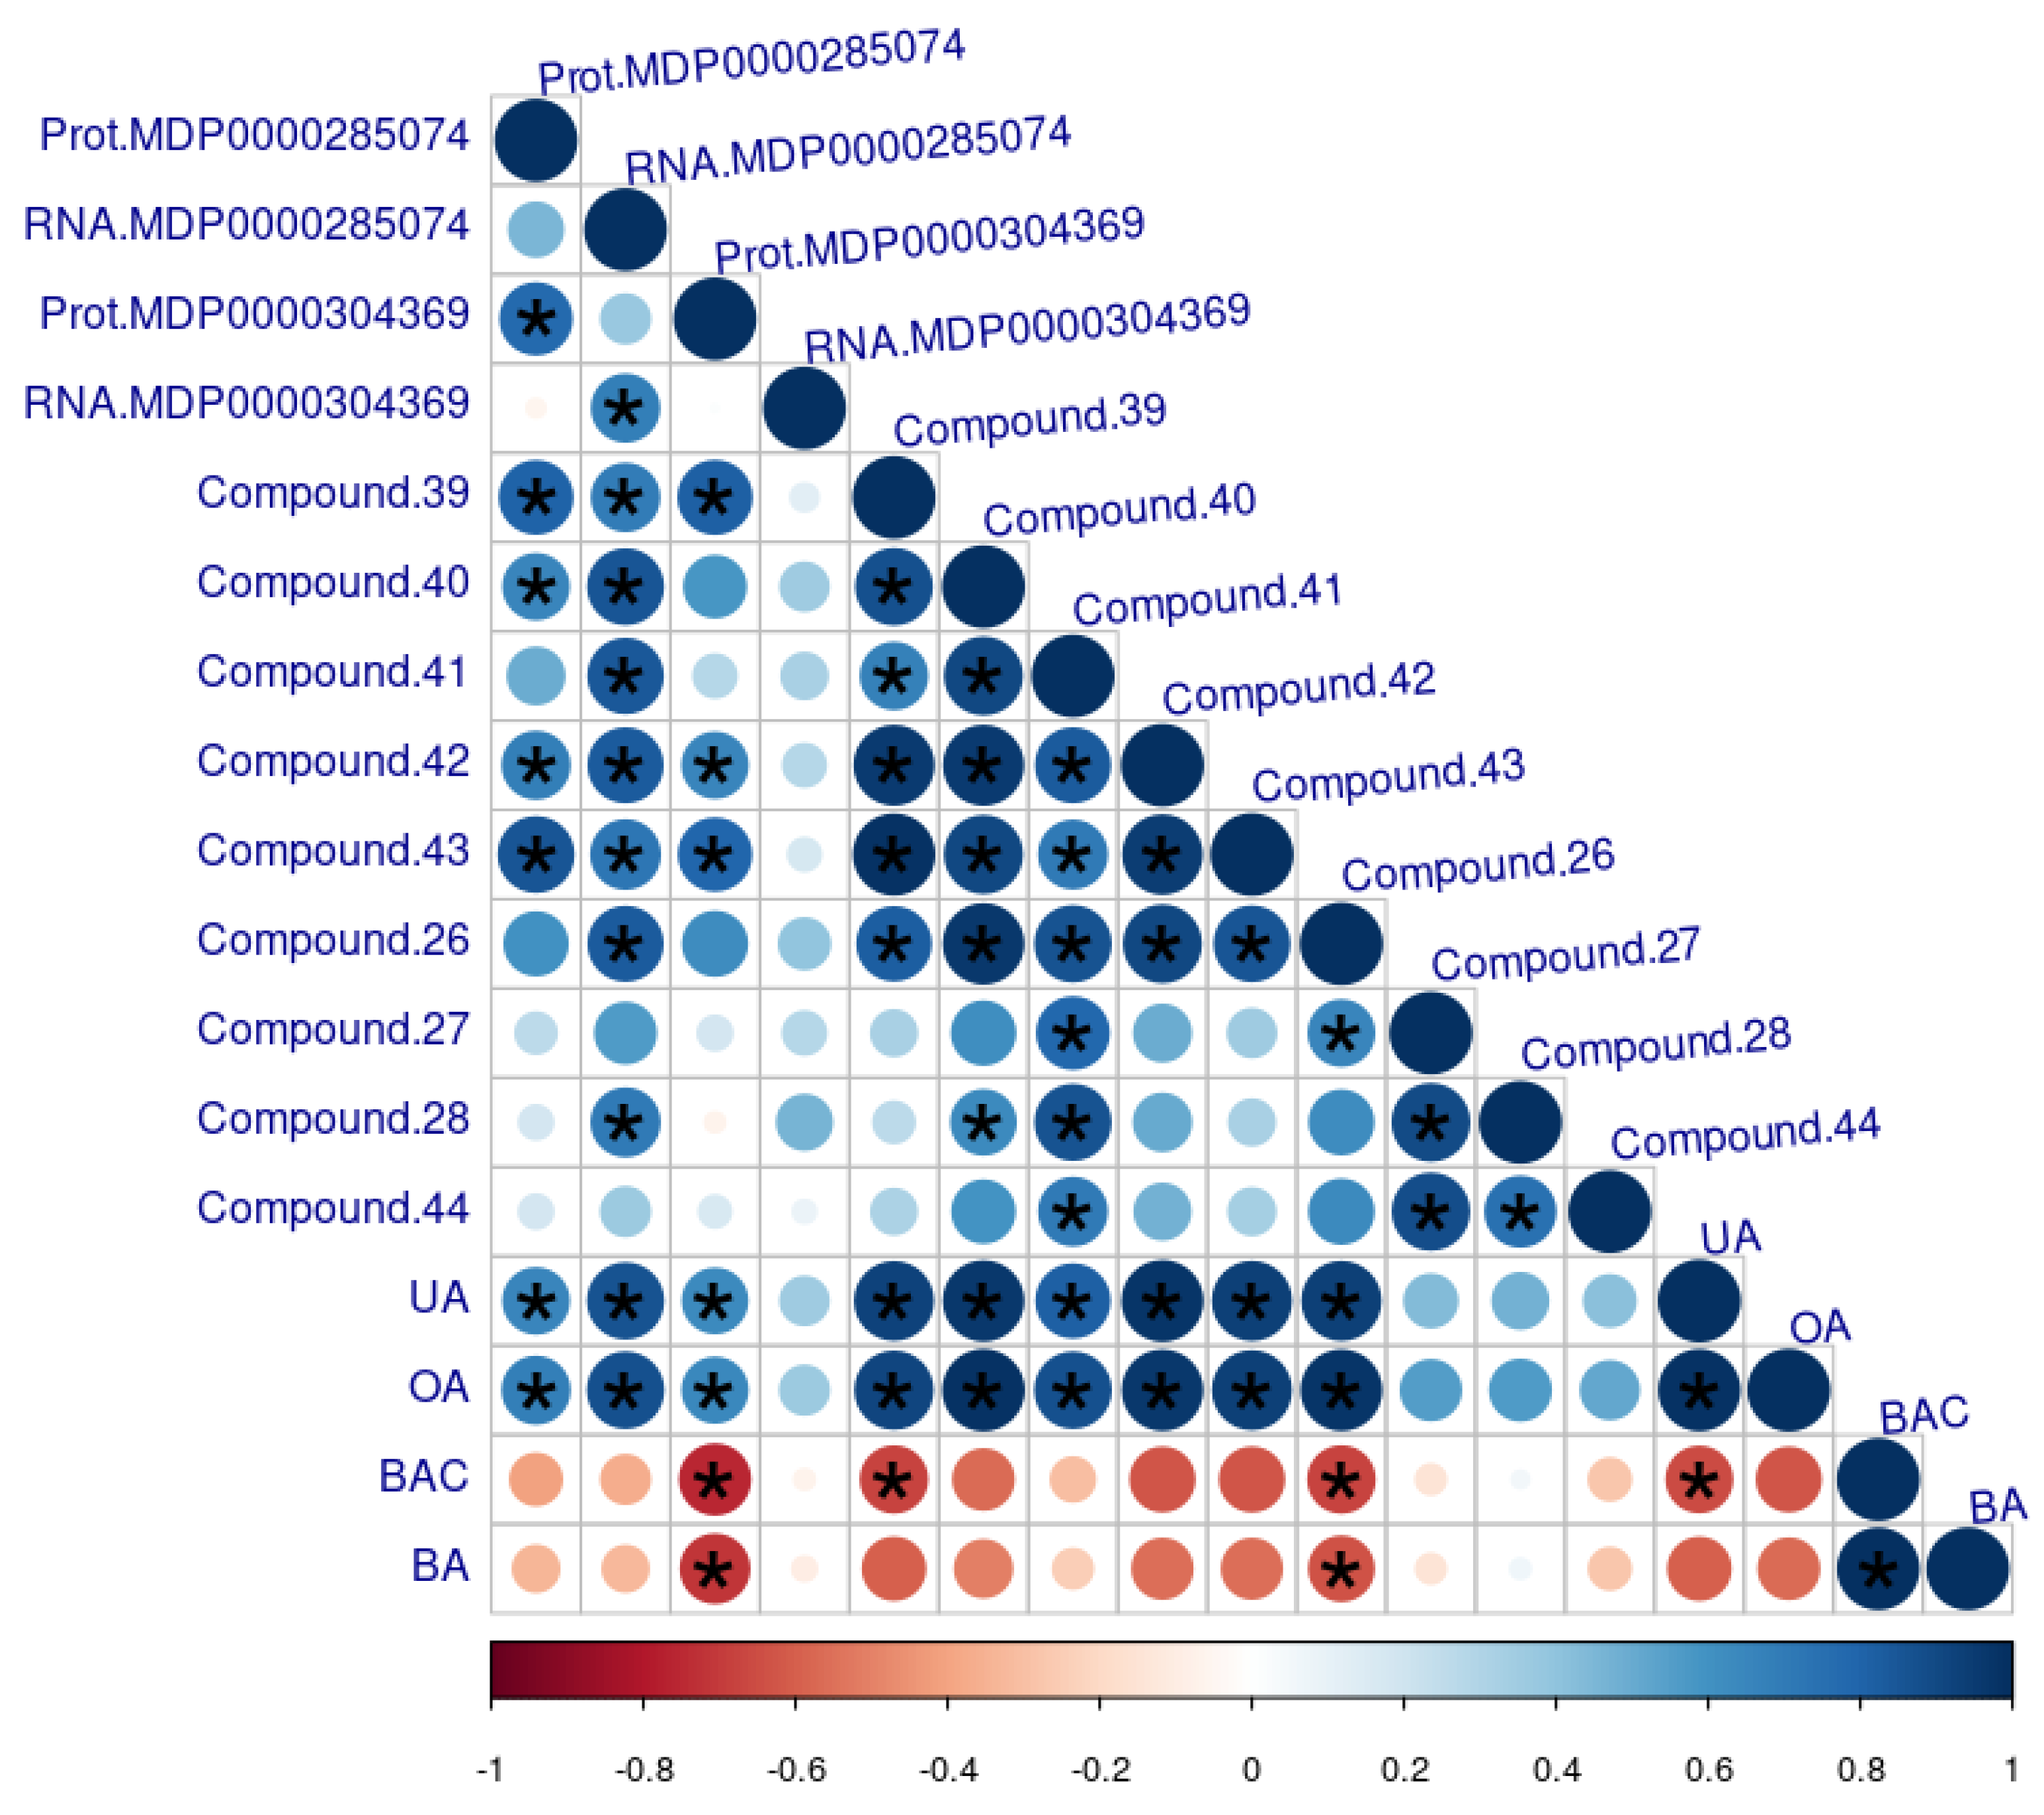
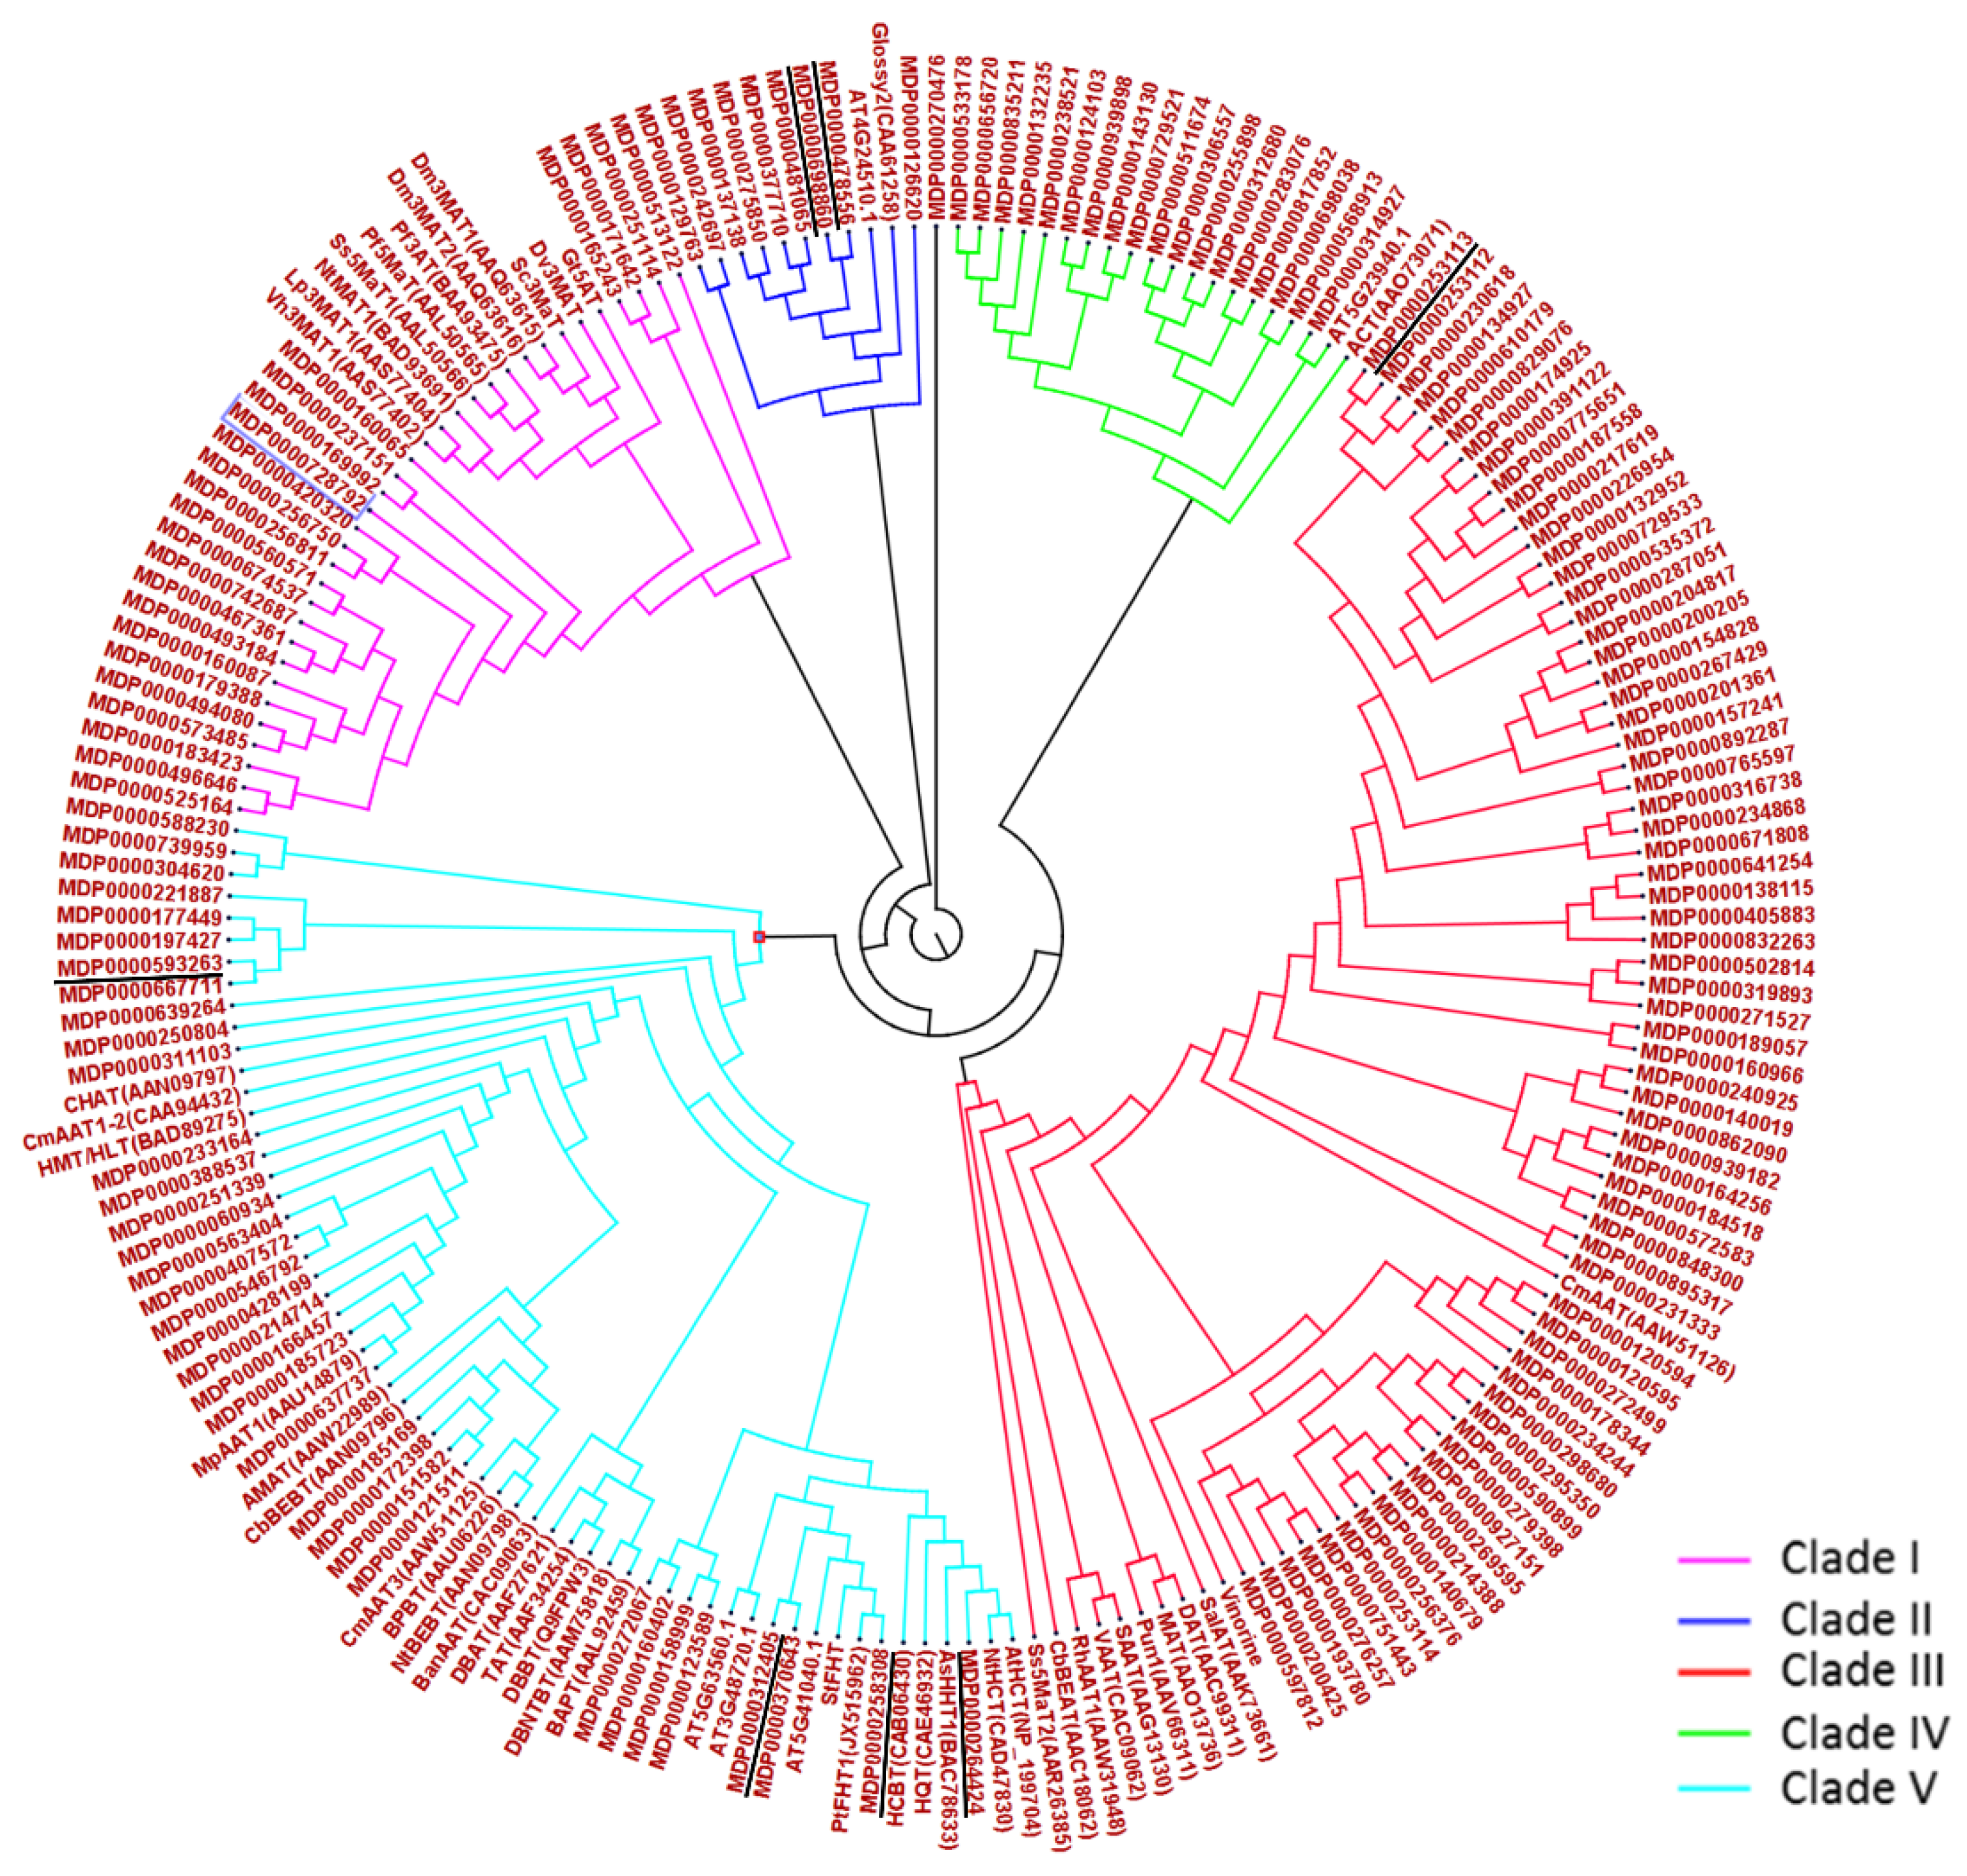
3.4. Identification of Potential BAHD Acyltransferases Involved in the Esterification of Triterpenes with Hydroxycinnamic Acids

Using an untargeted metabolomics approach allowed us to identify several triterpene-hydroxycinnamate derivatives and reveal a more complex triterpene profile in apple skin than previously thought [10,15]. A major finding in the present study is the abundance of triterpene-coumarates in the early stage of fruit development in a russet variety.
In model plants such as Arabidopsis, suberin-associated waxes contain a high concentration of alkyl-hydroxycinnamate conjugates, which are produced by BAHD hydroxycinnamoyl transferases [22,38]. Thus, it can be postulated that some members of this family might participate in the biosynthesis of triterpene-hydroxycinnamate conjugates. Correlation analysis between the level of the different triterpene-hydroxycinnamates and the gene expression of putative enzyme involved in their production (BAHD acyltransferase) highlighted seven strong candidates (Table S7). Strong correlations were found with compounds 45, 50, 52, and 53 (two caffeate and two coumarate derivatives), suggesting the enzyme catalyzing the reaction is not substrate-specific and can accept different sources of hydroxycinnamoyl CoA. Triterpenes from the ursane, oleanane, and lupane series cannot be differentiated by their mass spectra, and we can only speculate on the affiliation of the compounds to one or the other type. We confirmed using authentic standards that ursane (ursolic acid) and oleanane (oleanolic acid) –type of triterpenes decreased during fruit growth in CG and we, therefore, inferred that triterpene-coumarates that followed the same trend, would be from the same series. Previous studies showed that MdMYB93 and MdOSC5 expression starts as early as 40 DAFB [15]. Therefore, it is not impossible that the increased level of triterpene-coumarates observed in this study is the result of early activation of a russet-linked BAHD acyltransferase.
Upon russeting, increased availability of caffeic derivatives was described (Table 1 and Table 2) [18], which, together with an increase of lupane-type triterpene and suberin-related BAHD acyltransferase activity, might explain the occurrence of betulinic acid caffeate compound in russet skin. Triterpenes play an important role in maintaining the strength of cuticle during fruit development [39], but the role of triterpene-hydroxycinnamate remains unclear. The expression of these seven candidates coincided with the expression of numerous russet-related genes (Table 3, cluster C4), including two feruloyl-hydroxycinnamoyl acyltransferase-like (MDP0000312405, MDP0000258308) suspected to be involved in the production of suberin-associated wax (alkyl-hydroxycinnamates). However, there is still no evidence of the involvement of these enzymes in triterpene-hydroxycinnamate biosynthesis. Considering the additional health properties conferred by the conjugation of a phenolic compound to a triterpene scaffold [9,40], the functional validation of this decorating enzyme would constitute a timely and important future study.
Finally, the integrative analysis of two contrasting apple sports allowed us to highlight novel molecular players involved in apple cuticle development, suberin formation, and specialized metabolite synthesis. More precisely, the metabolomics analysis featured strong alterations of the specialized metabolism pathways in russet skin, including triterpene and phenylpropanoid. It also identified a large range of triterpene-coumarates in russeted tissues at the early stage of apple development. Together with the expression of some enzymes belonging to the BAHD acyl transferase family (MDP0000312405, MDP0000258308), these metabolites could be used as an early marker of russeting in apple. Our proteomic and transcriptomic results indicated lower abundance/expression of numerous proteins and genes linked to cuticle (cutin and wax) biosynthesis and transport in russet skin. Importantly, we identified a lipid transfer protein (LTP3, MDP0000285074) as a novel player in cuticle formation, possibly involved in the transport of cuticle components in apple skin.

4. Materials and Methods

4.1. Plant Material

During the spring-autumn 2013 (May–October), apple fruit from 27 varieties, including CG and CB, were collected from the orchards of the Walloon Agronomic Research Center in Gembloux (CRAW, Gembloux, Belgium). For CB and CG, 5 time points were selected: 57, 78, 99, 120, and 150 days after full bloom (DAFB), the last being at the commercial maturity. For each time point and variety, 3 biological replicates of 6 fruit each were randomly chosen in the south exposed part of the tree at 1.2–2.2 m height. Each fruit was split into quarters, and a 5-millimeter (width) longitudinal slice was peeled from each quarter with sterile scalpels, taking care to remove the remaining flesh from the exocarp. The resulting exocarp samples were directly flash-frozen in liquid nitrogen, roughly ground to homogenize the sample, and stored at −80 °C until RNA, protein, and metabolite extraction.

4.2. Genotypic Characterization

A total of 25 apple varieties were used in addition to CG and CB to perform the genetic analysis. Two additional samples corresponding to a Malus sieboldii individual and Malus floribunda 821 were also added as control. A total of 200 milligrams of apple skin was frozen in liquid nitrogen and ground with mortar and pestle. DNA extraction was performed using the Nucleospin® Plant II DNA Extraction Kit (Macherey-Nagel, Düren, Germany). Quantification and purity checks were performed using a Nanodrop® ND-1000 (Thermo Scientific, Waltham, MA, USA). Sixteen Single Sequence Repeat (SSR) markers spread over the Malus × domestica genome were selected for their reliability and polymorphism [41,42,43] (Table S1). SSR primers were ordered with 6-FAM and HEX labeling. PCR was performed using the Q5® Hot Start High-Fidelity 2X Master Mix according to the manufacturer’s guidelines with a 55 °C annealing temperature. SSR markers were then multiplexed, diluted 25-fold, and mixed with a formamide/400 HD-ROX ladder according to the manufacturer’s guidelines (Thermo Scientific, Waltham, MA, USA). Samples were then denatured at 95 °C and run on an ABI 3500 Genetic Analyzer (Thermo Scientific, Waltham, MA, USA). The allele calling was performed using Genemapper v5 (Thermo Scientific, Waltham, MA, USA). In order to deal with diploid and triploid varieties, the alleles were formatted as binary data. The distance matrix was calculated using Pearson correlation distance, and the phenogram was performed using the Unweighted Pair Group Method with Arithmetic Mean (UPGMA) method and 100 bootstraps using the DendroUPGMA online tool (http://genomes.urv.cat/UPGMA (accessed on 23 November 2021)). The tree was built using the Phylodendron online tool (http://iubio.bio.indiana.edu/treeapp/treeprint-form.html (accessed on 23 November 2021)).

4.3. Metabolomics Analysis

Apple skin extracts were prepared as previously described [10] and re-suspended in 1.5 mL EtOH:water (50:50) and filtered (0.2 µm) before Ultra Performance Liquid Chromatography (UPLC) analysis. Analyses were performed in triplicate (n = 3). Extracts were analyzed with a Waters Acquity UPLC system (Milford, MA) hyphenated to a high-resolution time of flight mass spectrometer (TripleTOF 5600+, AB Sciex, Concord, ON, Canada) using a previously published method [18]. Separation of 5 µL aliquot was performed on a reverse-phase Acquity UPLC BEH C18 column (2.1 × 100 mm, 1.7 μm particle size, Waters). In positive mode, the eluents were 0.1% formic acid in water (A) and 0.1% formic acid in acetonitrile (B). In negative mode, the solvents were (A) H2O with 2.5 mM (v/w) ammonium acetate and (B) acetonitrile. The gradient was as follows: 0 min, 1% B; 4 min, 1% B; 16 min, 5% B; 35 min, 40% B; 45 min, 100% B; 50 min, 100% B; 53 min, 1% B; 60 min, 1% B. The flow rate was 0.5 mL min−1 and the column temperature was 50 °C. Analytes were ionized with an electrospray ionization (ESI) source using the following parameters for positive and negative mode: source temperature, 650 °C; ion spray voltage of 4.5 and −4.5 kV, respectively, curtain gas (nitrogen) of 30, nebulizer gas (air) of 55, and turbine gas (air) of 50. Precursor charge state selection was set at 1. For information dependent acquisition (IDA in high sensitivity mode), survey scans were acquired in 175 ms and the 10 most abundant product ion scans were collected if exceeding a threshold of 100 counts per sec. The total cycle time was fixed at 2.25 s. Four time bins were summed for each scan at a pulser frequency value of 16.4 kHz. A sweeping collision energy setting of 15 eV in positive and −15 eV in negative mode was applied to all precursor ions for collision-induced dissociation. The de-clustering potential was set at 60 eV and −60 eV in positive and negative mode, respectively. Dynamic exclusion was set for 8 s after 2 occurrences, and then the precursor was refreshed off of the exclusion list. For MS1, full HR-MS spectra between 100 and 1300 mass-to-charge ratio (m/z) were recorded. MS2 scans were recorded between 25 and 1300 m/z.
Data were first processed with MS Data Converter (Beta v1.3, AB SCIEX, Concord, Ontario, Canada). The software converts the raw data (*.wiff) into peak lists (*.mzML). The Proteowizard software (v3.0, Chambers et al., 2012) was then used to transform the files into *.mzXML. The *.mzXML files (containing MS1 data only) were processed using XCMS online (https://xcmsonline.scripps.edu/ (accessed on 23 November 2021), Table S8) for feature detection, alignment, and statistical analysis to highlight metabolites of interest. Parameters were optimized by comparing external standard mix and blanks and running XCMS (v 1.46.0) in R version 3.2.3 directly with command lines. The software PeakView (v 1.2 0.3, AB SCIEX, Concord, ON, Canada) combined with the Metlin (https://metlin.scripps.edu/index.php (accessed on 23 November 2021)), PubChem (https://pubchem.ncbi.nlm.nih.gov (accessed on 23 November 2021)), and the Human Metabolome (http://www.hmdb.ca (accessed on 23 November 2021)) databases as well as literature data were used for structure elucidation.

4.4. RNA Extraction and Sequencing

Samples were treated as previously described [7], and RNA was extracted using an adapted CTAB buffer extraction protocol [44]. Total RNAs were then sent to the EMBL Genecore sequencing platform (Heidelberg, Germany) for library preparation and sequencing. Libraries were prepared from 1 µg total RNA using the TruSeq Stranded RNA Library Preparation Kit according to the manufacturer’s guidelines (Illumina, San Diego, CA, USA). The pooled libraries were sequenced on an Illumina NextSeq 500 (Illumina, San Diego, CA, USA) using 4 runs (NextSeq 500 High Output Kit 150 cycles) to generate 75 base-pairs paired-end reads.
FASTQ files were imported into CLC genomics workbench v8.5 while discarding reads with poor quality (<Q30). Reads with nucleotide ambiguity (N) and a quality index higher than 0.01 were filtered and further trimmed using Illumina adapter sequences. Finally, sequences with sizes below 35 base pairs were removed. The remaining reads were mapped to the predicted apple transcriptome v1.0 [21] using the following criteria: a minimum of 80% identity and 80% coverage with the reference. Mismatch cost was set at 2 (medium) and a deletion/insertion cost at 3 (highest stringency). Expression values were calculated using the Reads per Kilobase transcript per Million reads (RPKM) method [45]. Genes with less than 10 specifically mapped reads and/or with a mean RPKM value of the biological replicates lower than 0.1 in at least one of the libraries were also removed from the dataset.
Genes displaying a significant and differential expression were determined using a Baggerley’s ‘on proportion’ weighted t-test followed by a false discovery rate correction. Genes, which displayed a significant difference in expression (−2 > log2 ratio (Russet group/Waxy group) > 2, FDR p-value < 0.05) in at least one time-point were retained for the analysis. A hierarchical clustering based on Pearson correlation distances and a complete linkage method was performed from the expression results (RPKM CB and CG) using the Cluster v3.0 software (http://bonsai.hgc.jp/~mdehoon/software/cluster/software.htm (accessed on 23 November 2021)). Output files were then imported and treated using Treeview v1.1.6r4 (http://taxonomy.zoology.gla.ac.uk/rod/treeview.html (accessed on 23 November 2021)).
A gene ontology (GO) enrichment analysis was performed using ClueGO v2.1.1 and CluePedia v1.1.1 [46] plugins from two subsets of genes chosen from the hierarchical clustering results gathering the C2 to C3 and the C4 to C7 clusters, respectively. The significantly regulated biological processes (Benjamini–Hotchberg corrected p-value < 0.05) were selected following these criteria: gene ontology level from 3 to level 8, kappa score set at 0.1.
Neighbor-joining tree of a wide range of HXXXD-motif BAHD (putative hydroxycinnamoyl-CoA transferases) amino acid sequences in apple and other plant species was performed using CLC Main Workbench v.8.5. Distance matrix was calculated using Jukes–Cantor distances, and the tree was generated using the UPGMA method and 100 bootstraps. Sequences of 196 putative BAHD acyltransferases (proteins with an amino acid number between 220 and 660 presenting HXXXD and DFGWG domains) were extracted from the apple transcriptome V1.0 [21] and other references [23,38].

4.5. Proteomic Analysis

Total soluble proteins were extracted by the trichloroacetic acid (TCA)/acetone precipitation method [47] with some modifications: 500 mg of apple skin was ground with mortar and pestle in liquid nitrogen and then resuspended in 20% w/v TCA in acetone with 0.1% w/v dithiothreitol (DTT) and kept at −20 °C overnight. Samples were centrifuged for 45 min at 35,000× g and 4 °C. The pellets were washed with ice-cold acetone and centrifuged again at 4 °C. This step was repeated twice, and the pellets were freeze-dried. Dried samples were solubilized in labeling buffer (7 M urea, 2 M thiourea, 2% w/v 3-([3-cholamidopropyl] dimethylammonio)-1-propanesulfonate (CHAPS), and 30 mM Tris) and incubated for 1 h at room temperature. The pH of the solution was adjusted to 8.5 with sodium hydroxide 0.05 M and the protein concentration was determined with the RC DCTM protein assay (reducing agent and detergent compatible protein assay, Bio-Rad) according to the manufacturer’s instructions.
Ten μg total proteins were loaded in a CriterionTM XT precast 1D gel 4–12% Bis-Tris (1.0 mm × 12 wells, Bio-Rad) according to the manufacturer’s instructions. After a short migration, the gel was stained with Instant Blue (Gentaur BVBA, Kampenhout, Belgium) and ready for band excision. Proteins were reduced, alkylated, and de-stained separately, then digested by trypsin enzyme (sequencing mass grade, Promega, Mannheim, Germany). The extracted peptides were further desalted and separated [48].
The peptides were injected into NanoLCTM 2D system (Eksigent, AB Sciex, Belgium) coupled to the TripleTOF® 5600+ mass spectrometer (AB Sciex, Concord, ON, Canada). The 20 most intense product ion scans were fragmented in high sensitivity mode using the automatically adjusted system of rolling collision energy voltage. Each sample was processed in 3 technical replicates. CID spectra were processed by Mascot (version 2.4.2, Matrix Science Ltd., London, UK) using Mascot Daemon by searching against the apple transcriptome v1.0 [21]. The searches were performed with the following parameters: enzyme: trypsin, 2 missed cleavages, mass accuracy precursor: 20 ppm, mass accuracy fragments: 0.3 Da, fixed modifications: carbamidomethyl (C), dynamic modifications: Oxidation (M), Acetyl (protein N-term). An average number of the spectral counts of a protein across technical repeats within a biological sample was conducted by Mascot Daemon with merging MS/MS files into a single search.
Data analysis and treatment (Normalized Spectral Abundance Factors (NSAF)) was further computed [49]. On the protein family report of Mascot results, supplemental filters were applied: peptide confidence (p-value < 0.05), a minimum of 5 spectra per peptide, and a minimum of 2 or more significant peptides per protein. Proteins displaying less than 50% increase or decrease when comparing abundance between CG and CB were excluded from the dataset. In order to highlight the most altered functional categories, a pie chart was built from results obtained using Mapman [20]. Proteins were classified in the different bins according to the mapping file resulting from the M. × domestica genome draft v1.0 [21].

5. Conclusions

This work builds on previous studies on apple russeting performed by our group and others [6,15,50,51] by combining for the first time proteomic and metabolomic data together with transcriptomic information to highlight putative crucial actors of skin integrity and triterpenes synthesis in apple. We identified a lipid transfer protein (LTP3) as a novel player in cuticle formation, possibly involved in the transport of both cutin and wax components in apple skin. Two enzymes belonging to the BAHD (HXXXD-motif) acyltransferase family were further identified as strong candidates for the esterification of triterpenes with hydroxycinnamic acids. Further functional studies are warranted to confirm the efficacy of these decorating enzymes, which will be valuable in future combinatorial studies aiming at producing compounds with increased health properties.

Supplementary Materials

The following are available online at https://www.mdpi.com/article/10.3390/plants11030289/s1: Section A, Figure S1: Targeted triterpene analysis, Figure S2: Mapman distribution obtained from the proteomic data, Figure S3: Hierarchical clustering performed on the differentially expressed genes, Table S1: Overview of the single sequence repeat (SSR) markers, Table S2: Metabolomic data—Identifications, Table S3: Proteomics data, Table S4: Sequences filtering and mapping, Table S5: Full transcriptomic data, Table S6: Subset of C2-C3 clusters, Table S7 Correlation between triterpene-hydroxycinnamates and BAHD acyltransferase genes.

Author Contributions

Conceptualization, C.M.A., S.L., G.G. and M.L.; methodology, C.M.A., S.L., G.G., S.C. and C.C.L.; formal analysis, C.M.A., S.L., G.G., S.C. and C.C.L.; resources, M.L.; writing—original draft preparation, C.M.A., S.L. and G.G.; writing—review and editing, C.M.A., S.L., G.G., J.R. and J.-F.H.; supervision, S.L., J.R. and J.-F.H.; project administration, S.L.; funding acquisition, S.L. All authors have read and agreed to the published version of the manuscript.

Funding

Sylvain Legay is grateful to the National Research Funds (FNR, Luxembourg) for funding (DANTE-FNR-CORE C18/SR/12700474).

Institutional Review Board Statement

Not applicable.

Informed Consent Statement

Not applicable.

Data Availability Statement

Raw sequences have been deposited at the NCBI Gene Expression Omnibus website (GEO, http://www.ncbi.nlm.nih.gov/geo (accessed on 23 November 2021), accession number: GSEXXXXX). The mass spectrometry proteomics data have been deposited to the ProteomeXchange Consortium via PRIDE repository with the dataset identifier PXD022712.

Acknowledgments

The authors acknowledge Amelie Deleruelle, Aude Corvisy and Laurent Solinhac for their invaluable technical help. The authors also wish to thank the EMBL-GeneCore Team for their collaboration in the transcriptomic analysis. We further thank Richard Espley and Tony McGhie for constructive feedback on the manuscript.

Conflicts of Interest

The authors declare no conflict of interest.

References

  1. Curry, E. Increase in Epidermal Planar Cell Density Accompanies Decreased Russeting of ‘Golden Delicious’ Apples Treated with Gibberellin A4+7. HortScience 2012, 47, 232–237. [Google Scholar] [CrossRef] [Green Version]
  2. Knoche, M.; Grimm, E. Surface Moisture Induces Microcracks in the Cuticle of ‘Golden Delicious’ Apple. HortScience 2008, 43, 1929–1931. [Google Scholar] [CrossRef] [Green Version]
  3. Straube, J.; Chen, Y.-H.; Khanal, B.P.; Shumbusho, A.; Zeisler-Diehl, V.; Suresh, K.; Schreiber, L.; Knoche, M.; Debener, T. Russeting in Apple is Initiated after Exposure to Moisture Ends: Molecular and Biochemical Evidence. Plants 2020, 10, 65. [Google Scholar] [CrossRef] [PubMed]
  4. Khanal, B.P.; Grimm, E.; Knoche, M. Russeting in apple and pear: A plastic periderm replaces a stiff cuticle. AoB Plants 2012, 5, pls048. [Google Scholar] [CrossRef] [Green Version]
  5. Lashbrooke, J.; Aharoni, A.; Costa, F. Genome investigation suggests MdSHN3, an APETALA2-domain transcription factor gene, to be a positive regulator of apple fruit cuticle formation and an inhibitor of russet development. J. Exp. Bot. 2015, 66, 6579–6589. [Google Scholar] [CrossRef] [Green Version]
  6. Legay, S.; Guerriero, G.; Deleruelle, A.; Lateur, M.; Evers, D.; André, C.M.; Hausman, J.-F. Apple russeting as seen through the RNA-seq lens: Strong alterations in the exocarp cell wall. Plant Mol. Biol. 2015, 88, 21–40. [Google Scholar] [CrossRef] [PubMed]
  7. Legay, S.; Cocco, E.; André, C.M.; Guignard, C.; Hausman, J.-F.; Guerriero, G. Differential Lipid Composition and Gene Expression in the Semi-Russeted “Cox Orange Pippin” Apple Variety. Front. Plant Sci. 2017, 8. [Google Scholar] [CrossRef] [Green Version]
  8. Brendolise, C.; Yauk, Y.-K.; Eberhard, E.D.; Wang, M.; Chagne, D.; Andre, C.; Greenwood, D.R.; Beuning, L.L. An unusual plant triterpene synthase with predominant α-amyrin-producing activity identified by characterizing oxidosqualene cyclases from Malus × domestica. FEBS J. 2011, 278, 2485–2499. [Google Scholar] [CrossRef] [PubMed]
  9. Andre, C.M.; Larsen, L.; Burgess, E.J.; Jensen, D.J.; Cooney, J.M.; Evers, D.; Zhang, J.; Perry, N.B.; Laing, W.A. Unusual immuno-modulatory triterpene-caffeates in the skins of russeted varieties of apples and pears. J. Agric. Food Chem. 2013, 61, 2773–2779. [Google Scholar] [CrossRef]
  10. Andre, C.M.; Legay, S.; Deleruelle, A.; Nieuwenhuizen, N.; Punter, M.; Brendolise, C.; Cooney, J.M.; Lateur, M.; Hausman, J.-F.; Larondelle, Y.; et al. Multifunctional oxidosqualene cyclases and cytochrome P450 involved in the biosynthesis of apple fruit triterpenic acids. New Phytol. 2016, 211, 1279–1294. [Google Scholar] [CrossRef] [Green Version]
  11. McGhie, T.K.; Hudault, S.; Lunken, R.C.M.; Christeller, J.T. Apple peels, from seven cultivars, have lipase-inhibitory activity and contain numerous ursenoic acids as identified by LC-ESI-QTOF-HRMS. J. Agric. Food Chem. 2012, 60, 482–491. [Google Scholar] [CrossRef]
  12. He, X.; Liu, R.H. Triterpenoids isolated from apple peels have potent antiproliferative activity and may be partially responsible for apple’s anticancer activity. J. Agric. Food Chem. 2007, 55, 4366–4370. [Google Scholar] [CrossRef]
  13. Pan, H.; Lundgren, L.N.; Andersson, R. Triterpene caffeates from bark of Betula pubescens. Phytochemistry 1994, 37, 795–799. [Google Scholar] [CrossRef]
  14. Jiang, Z.-H.; Tanaka, T.; Kouno, I. A lupane triterpene and two triterpene caffeates from Rhoiptelea chiliantha. Phytochemistry 1995, 40, 1223–1226. [Google Scholar] [CrossRef]
  15. Falginella, L.; Andre, C.M.; Legay, S.; Lin-Wang, K.; Dare, A.P.; Deng, C.; Rebstock, R.; Plunkett, B.J.; Guo, L.; Cipriani, G.; et al. Differential regulation of triterpene biosynthesis induced by an early failure in cuticle formation in apple. Hortic. Res. 2021, 8, 1–15. [Google Scholar] [CrossRef]
  16. Kosma, D.K.; Murmu, J.; Razeq, F.M.; Santos, P.; Bourgault, R.; Molina, I.; Rowland, O. AtMYB41 activates ectopic suberin synthesis and assembly in multiple plant species and cell types. Plant J. Cell Mol. Biol. 2014, 80, 216–229. [Google Scholar] [CrossRef] [Green Version]
  17. Lashbrooke, J.; Cohen, H.; Levy-Samocha, D.; Tzfadia, O.; Panizel, I.; Zeisler, V.; Massalha, H.; Stern, A.; Trainotti, L.; Schreiber, L.; et al. MYB107 and MYB9 Homologs Regulate Suberin Deposition in Angiosperms. Plant Cell 2016, 28, 2097–2116. [Google Scholar] [CrossRef] [PubMed] [Green Version]
  18. Legay, S.; Guerriero, G.; André, C.; Guignard, C.; Cocco, E.; Charton, S.; Boutry, M.; Rowland, O.; Hausman, J.-F. MdMyb93 is a regulator of suberin deposition in russeted apple fruit skins. New Phytol. 2016, 212, 977–991. [Google Scholar] [CrossRef]
  19. Andre, C.M.; Greenwood, J.M.; Walker, E.G.; Rassam, M.; Sullivan, M.; Evers, D.; Perry, N.B.; Laing, W.A. Anti-Inflammatory Procyanidins and Triterpenes in 109 Apple Varieties. J. Agric. Food Chem. 2012, 60, 10546–10554. [Google Scholar] [CrossRef] [PubMed]
  20. Thimm, O.; Bläsing, O.; Gibon, Y.; Nagel, A.; Meyer, S.; Krüger, P.; Selbig, J.; Müller, L.A.; Rhee, S.Y.; Stitt, M. MAPMAN: A user-driven tool to display genomics data sets onto diagrams of metabolic pathways and other biological processes. Plant J. Cell Mol. Biol. 2004, 37, 914–939. [Google Scholar] [CrossRef] [PubMed]
  21. Velasco, R.; Zharkikh, A.; Affourtit, J.; Dhingra, A.; Cestaro, A.; Kalyanaraman, A.; Fontana, P.; Bhatnagar, S.K.; Troggio, M.; Pruss, D.; et al. The genome of the domesticated apple (Malus × domestica Borkh.). Nat. Genet. 2010, 42, 833–839. [Google Scholar] [CrossRef] [PubMed]
  22. Domergue, F.; Kosma, D.K. Occurrence and Biosynthesis of Alkyl Hydroxycinnamates in Plant Lipid Barriers. Plants 2017, 6, 25. [Google Scholar] [CrossRef] [PubMed] [Green Version]
  23. D’Auria, J.C. Acyltransferases in plants: A good time to be BAHD. Curr. Opin. Plant Biol. 2006, 9, 331–340. [Google Scholar] [CrossRef] [PubMed]
  24. Falginella, L.; Cipriani, G.; Monte, C.; Gregori, R.; Testolin, R.; Velasco, R.; Troggio, M.; Tartarini, S. A major QTL controlling apple skin russeting maps on the linkage group 12 of ‘Renetta Grigia di Torriana’. BMC Plant Biol. 2015, 15, 1–13. [Google Scholar] [CrossRef] [PubMed] [Green Version]
  25. Gutierrez, B.L.; Zhong, G.-Y.; Brown, S.K. Increased phloridzin content associated with russeting in apple (Malus domestica (Suckow) Borkh.) fruit. Genet. Resour. Crop Evol. 2018, 65, 2135–2149. [Google Scholar] [CrossRef]
  26. Andre, C.M.; Larondelle, Y.; Evers, D. Dietary Antioxidants and Oxidative Stress from a Human and Plant Perspective: A Review. Curr. Nutr. Food Sci. 2010, 6, 2–12. [Google Scholar] [CrossRef]
  27. Wang, L.; Li, J.; Gao, J.; Feng, X.; Shi, Z.; Gao, F.; Xu, X.; Yang, L. Inhibitory effect of chlorogenic acid on fruit russeting in ‘Golden Delicious’ apple. Sci. Hortic. 2014, 178, 14–22. [Google Scholar] [CrossRef]
  28. McFarlane, H.E.; Shin, J.J.H.; Bird, D.A.; Samuels, A.L. Arabidopsis ABCG transporters, which are required for export of diverse cuticular lipids, dimerize in different combinations. Plant Cell 2010, 22, 3066–3075. [Google Scholar] [CrossRef] [Green Version]
  29. Fabre, G.; Garroum, I.; Mazurek, S.; Daraspe, J.; Mucciolo, A.; Sankar, M.; Humbel, B.M.; Nawrath, C. The ABCG transporter PEC1/ABCG32 is required for the formation of the developing leaf cuticle in Arabidopsis. New Phytol. 2016, 209, 192–201. [Google Scholar] [CrossRef]
  30. Qin, P.; Tu, B.; Wang, Y.; Deng, L.; Quilichini, T.D.; Li, T.; Wang, H.; Ma, B.; Li, S. ABCG15 encodes an ABC transporter protein, and is essential for post-meiotic anther and pollen exine development in rice. Plant Cell Physiol. 2013, 54, 138–154. [Google Scholar] [CrossRef] [Green Version]
  31. Xia, Y.; Yu, K.; Gao, Q.-M.; Wilson, E.V.; Navarre, D.; Kachroo, P.; Kachroo, A. Acyl CoA Binding Proteins are Required for Cuticle Formation and Plant Responses to Microbes. Front. Plant Sci. 2012, 3, 224. [Google Scholar] [CrossRef] [Green Version]
  32. Arondel, V.; Vergnolle, C.; Cantrel, C.; Kader, J. Lipid transfer proteins are encoded by a small multigene family in Arabidopsis thaliana. Plant Sci. Int. J. Exp. Plant Biol. 2000, 157, 1–12. [Google Scholar] [CrossRef]
  33. Edqvist, J.; Blomqvist, K.; Nieuwland, J.; Salminen, T.A. Plant lipid transfer proteins: Are we finally closing in on the roles of these enigmatic proteins? J. Lipid Res. 2018, 59, 1374–1382. [Google Scholar] [CrossRef] [Green Version]
  34. Yadav, V.; Molina, I.; Ranathunge, K.; Castillo, I.Q.; Rothstein, S.J.; Reed, J.W. ABCG transporters are required for suberin and pollen wall extracellular barriers in Arabidopsis. Plant Cell 2014, 26, 3569–3588. [Google Scholar] [CrossRef] [Green Version]
  35. Bird, D.; Beisson, F.; Brigham, A.; Shin, J.; Greer, S.; Jetter, R.; Kunst, L.; Wu, X.; Yephremov, A.; Samuels, L. Characterization of Arabidopsis ABCG11/WBC11, an ATP binding cassette (ABC) transporter that is required for cuticular lipid secretion. Plant J. Cell Mol. Biol. 2007, 52, 485–498. [Google Scholar] [CrossRef]
  36. Panikashvili, D.; Shi, J.X.; Bocobza, S.; Franke, R.B.; Schreiber, L.; Aharoni, A. The Arabidopsis DSO/ABCG11 transporter affects cutin metabolism in reproductive organs and suberin in roots. Mol. Plant 2010, 3, 563–575. [Google Scholar] [CrossRef]
  37. Edstam, M.M.; Blomqvist, K.; Eklöf, A.; Wennergren, U.; Edqvist, J. Coexpression patterns indicate that GPI-anchored non-specific lipid transfer proteins are involved in accumulation of cuticular wax, suberin and sporopollenin. Plant Mol. Biol. 2013, 83, 625–649. [Google Scholar] [CrossRef] [PubMed]
  38. Molina, I.; Kosma, D. Role of HXXXD-motif/BAHD acyltransferases in the biosynthesis of extracellular lipids. Plant Cell Rep. 2015, 34, 587–601. [Google Scholar] [CrossRef] [PubMed]
  39. Tsubaki, S.; Sugimura, K.; Teramoto, Y.; Yonemori, K.; Azuma, J. Cuticular Membrane of Fuyu Persimmon Fruit Is Strengthened by Triterpenoid Nano-Fillers. PLoS ONE 2013, 8, e75275. [Google Scholar] [CrossRef] [PubMed] [Green Version]
  40. Pan, M.-H.; Chen, C.-M.; Lee, S.-W.; Chen, Z.-T. Cytotoxic triterpenoids from the root bark of Helicteres angustifolia. Chem. Biodivers. 2008, 5, 565–574. [Google Scholar] [CrossRef]
  41. Guilford, P.; Prakash, S.; Zhu, J.M.; Rikkerink, E.; Gardiner, S.; Bassett, H.; Forster, R. Microsatellites in Malus X domestica (apple): Abundance, polymorphism and cultivar identification. Theor. Appl. Genet. 1997, 94, 249–254. [Google Scholar] [CrossRef]
  42. Gianfranceschi, L.; Seglias, N.; Tarchini, R.; Komjanc, M.; Gessler, C. Simple sequence repeats for the genetic analysis of apple. Theor. Appl. Genet. 1998, 96, 1069–1076. [Google Scholar] [CrossRef]
  43. Liebhard, R.; Gianfranceschi, L.; Koller, B.; Ryder, C.D.; Tarchini, R.; Van De Weg, E.; Gessler, C. Development and characterisation of 140 new microsatellites in apple (Malus x domestica Borkh.). Mol. Breed. 2002, 10, 217–241. [Google Scholar] [CrossRef]
  44. Gasic, K.; Hernandez, A.; Korban, S.S. RNA extraction from different apple tissues rich in polyphenols and polysaccharides for cDNA library construction. Plant Mol. Biol. Report. 2004, 22, 437–438. [Google Scholar] [CrossRef]
  45. Mortazavi, A.; Williams, B.A.; McCue, K.; Schaeffer, L.; Wold, B. Mapping and quantifying mammalian transcriptomes by RNA-Seq. Nat. Methods 2008, 5, 621–628. [Google Scholar] [CrossRef] [PubMed]
  46. Bindea, G.; Mlecnik, B.; Hackl, H.; Charoentong, P.; Tosolini, M.; Kirilovsky, A.; Fridman, W.-H.; Pagès, F.; Trajanoski, Z.; Galon, J. ClueGO: A Cytoscape plug-in to decipher functionally grouped gene ontology and pathway annotation networks. Bioinformatics 2009, 25, 1091–1093. [Google Scholar] [CrossRef] [PubMed] [Green Version]
  47. Renaut, J.; Lutts, S.; Hoffmann, L.; Hausman, J.-F. Responses of poplar to chilling temperatures: Proteomic and physiological aspects. Plant Biol. Stuttg. Ger. 2004, 6, 81–90. [Google Scholar] [CrossRef]
  48. Chabi, M.; Goulas, E.; Leclercq, C.C.; de Waele, I.; Rihouey, C.; Cenci, U.; Day, A.; Blervacq, A.-S.; Neutelings, G.; Duponchel, L.; et al. A Cell Wall Proteome and Targeted Cell Wall Analyses Provide Novel Information on Hemicellulose Metabolism in Flax. Mol. Cell. Proteomics MCP 2017, 16, 1634–1651. [Google Scholar] [CrossRef] [Green Version]
  49. Bohn, T.; Planchon, S.; Leclercq, C.C.; Renaut, J.; Mihaly, J.; Beke, G.; Rühl, R. Proteomic responses of carotenoid and retinol administration to Mongolian gerbils. Food Funct. 2018, 9, 3835–3844. [Google Scholar] [CrossRef]
  50. Busatto, N.; Matsumoto, D.; Tadiello, A.; Vrhovsek, U.; Costa, F. Multifaceted analyses disclose the role of fruit size and skin-russeting in the accumulation pattern of phenolic compounds in apple. PLoS ONE 2019, 14, e0219354. [Google Scholar] [CrossRef] [Green Version]
  51. Yuan, G.; Bian, S.; Han, X.; He, S.; Liu, K.; Zhang, C.; Cong, P. An Integrated Transcriptome and Proteome Analysis Reveals New Insights into Russeting of Bagging and Non-Bagging “Golden Delicious” Apple. Int. J. Mol. Sci. 2019, 20, 4462. [Google Scholar] [CrossRef] [PubMed] [Green Version]
Figure 1. (A) Phenogram built with allelic data from 27 apple varieties using 16 Simple Sequence Repeats (SSR) markers. The tree was generated using the Unweighted Pair Group Method with Arithmetic Mean (UPGMA) method with 100 bootstraps. (B) Skin phenotype of ‘Canada Gris’ (CG) and ‘Canada Blanc’ (CB) during fruit growth (from 57 days after full bloom (DAFB) to 150 DAFB). (C): Fruit height and width measured in mm) during fruit development. The star indicates the significant difference between CG and CB (p-value < 0.05).
Plants 11 00289 g001
Figure 2. Statistical analysis of the metabolomic data collected using Ultra Performance Liquid Chromatography (UPLC) coupled with a high-resolution mass spectrometer (UPLC-TripleTOF HR-MS). A principal component (PC) analysis was performed on the metabolic profile of the skins of ‘Canada Blanc’ (CB, represented with triangle) and ‘Canada Gris’ (CG, represented with circle) during fruit development (from 57 days after full bloom (DAFB) to harvest (150 DAFB)): (A) score plot of the metabolite profile in positive mode; (B) score plot of the metabolite profile in negative mode. Venn Diagram depicting the meta-analysis of the ‘Canada Blanc’–‘Canada Gris’ comparisons across five time points using data collected in positive (C) and negative mode (D). Shared patterns of the skin metabolome variations were characterized by 12 (C) and 11 (D) differentially regulated features, respectively (p-value < 0.01; fold change > 1.5). See Table S2 for identifications.
Plants 11 00289 g002
Figure 3. Chromatogram recorded between 300 and 320 nm by Ultra Performance Liquid Chromatography and diode array detection (UPLC-DAD), comparing the triterpene-hydroxycinnamate profile between ’Canada Blanc’ (CB) and ‘Canada Gris’ (CG) (A). Relative abundance of triterpene-hydroxycinnamates during fruit development in the skin of CB and CG. Data were obtained by UPLC–Triple TOF in negative electrospray ionization (ESI) mode and are presented as the average value of 3 biological replicates (n = 3) (BG). See Table S2 for identification of the compounds. (B) Triterpene-coumarates identified in CB; (C) Triterpene-coumarates identified in CG; (D) Triterpene-caffeates identified in CB, (E) Triterpene-caffeates identified in CG; (F) data from C enlarged by a change in scale; (G) data from D enlarged by a change in scale. DAFB = days after full bloom.
Plants 11 00289 g003
Figure 4. Gene ontology (GO) enrichment analysis of the significantly differentially expressed genes ordered in clusters C2 to C3 (A) and C4 to C7 (B). Only significant biological processes were represented, and the circle size used is proportional to the p-value (the bigger the circle, the higher the p-value). The colors represent the grouping results of the ClueGO/CluePedia analysis. (A) Lipid metabolism (orange), lipid transport (pink), response to stress (light blue), plant epidermis morphogenesis (purple), and hormone biosynthesis (dark blue). (B) Fatty acid and secondary metabolism (purple), cell wall biosynthesis and regulation (dark blue and light blue, respectively), and organ morphogenesis (orange).
Plants 11 00289 g004
Figure 5. Pearson correlation coefficients between metabolites (from Table 1 and Table 2) and the two Lipid Transport Proteins (LTP3) candidates identified in the proteome and transcriptome datasets (MDP0000285074, MDP0000304369) (Table 3). Abbreviations: UA, ursolic acid; OA, oleanolic acid; BA, betulinic acid; BAC, betulinic acid-3-trans-caffeate. A star indicates a significant relationship (p-value < 0.05).
Plants 11 00289 g005
Figure 6. Neighbor-joining tree of a wide range of HXXXD-motif BAHD (putative hydroxycinnamoyl-CoA transferases) amino acid sequences in apple and other plant species. Seven acyltransferases co-expressed with suberin biosynthesis genes are underlined in black.
Plants 11 00289 g006
Table 1. Putative identity and relative abundance of compounds differentially accumulated in skins of ‘Canada Blanc’ and ‘Canada Gris’ during fruit development (from 57 days after full bloom (57 DAFB) to harvest (150 DAFB)). Most discriminant metabolites according to a Principal Component Analysis (PCA, Figure 1) are presented for both negative and positive modes. Fragmentation data for each compound are presented in Table S2. Data were obtained by UPLC–TTOF in negative and positive electrospray ionization (ESI) mode. The peak area of the extracted ion chromatogram (EIC) of each metabolite feature is presented as the average value of 3 biological replicates (n = 3), each assayed in duplicate (Average EIC). Abbreviations: tr, retention time; UPLC = Ultra Performance Liquid Chromatography.
Putative IdentityCompound Numbertr (min)[M+H]+/[M−H]Error (ppm)Molecular FormulaAverage EIC (‘Canada Blanc’)Average EIC (‘Canada Gris’)
57 DAFB78 DAFB99 DAFB120 DAFB150 DAFB57 DAFB78 DAFB99 DAFB120 DAFB150 DAFB
Negative Mode
- Negatively Associated with fruit development
Quinic Acid10.44191.056112.6C7H12O674,76560,32249,34243,60931,94378,17268,53558,93937,82124,492
Quinic acid- dihexoside50.5533.1709−2.7C19H3401720,37023,39525,05020,91912,61327,37822,88522,52611,4156370
Hydroxybenzoic acid—hexoside70.8315.07420.1C13H16O9183064960647539016481008913658670
Quinic acid ethyl ester82.43219.08771.3C8H16067743171961113015388224229546
Caffeoyl-hexoside107.03341.0873−0.51C15H180942,25232,26832,25522,39715,77048,41839,67740,93131,00216,502
Feruloyl-hexoside1214.72355.1032−0.7C16H20O98596588948234063255089496785565041822703
Flavonol-dimethyl ether-hexoside1621.41491.1178−1.6C23H24O12119446329023213915751077789416205
Trihydroxy-dimethoxyflavanone—hexoside1924.5493.13550.7C23H26O125213180818441371124138742591205018851524
Quercetin dimethyl ether—hexoside2024.53509.1292−1.7C23H26013139648351338235110336895665241396
Coumaroyl-caffeoyl-hexoside2325.28487.12643.7C24H2401120691607179614639432408233921101108802
Negative Mode
- Positively Associated with fruit development
Methyl-phloracetophenone-hexoside (domesticoside)20.49343.1021−4C15H20O977715043498489177186531361256534586172
Ethyl ester di-hexoside30.5387.112−6.2C13H26013162229906124823011402426309902164
Di-saccharide40.5341.1073−1.9C12H22O1119,71135,36684,004112,633166,02418,67233,36765,51287,756147,611
Di-saccharide60.52341.1086−3.7C12H22O1115032858714410,34415,288143025735375696313,122
Vomifoliol-pentosyl-hexoside Isomer 11318.89517.2282−1.6C24H38O12502406478703139229777109826063501
Vomifoliol-pentosyl-hexoside Isomer 21419.67517.2282−1.6C24H38O12782612,15621,72622,11141,273759216,39320,76322,16932,980
Negative Mode
- Positively Associated with russeting
Neochlorogenic acid94.19353.0872−2C16H180932645542631351899159511669311046
p-coumaroyl quinic acid Isomer118.38337.0928−3.5C16H18083611551161086378523871205940917083918850
Hydroxy-Phloretin-hexoside1721.8451.124−1.3C21H24O11741410,52416,78414,43216,39225,91715,28141,50032,95343,274
Phloretin-pentoside2124.64405.1185−1.5C20H22092373073993935981054481124013011466
Hydroxy-phloretin2224.73289.07180.1C15H1406232854101105186277121017071820
Phlroretin2526.89273.07721.3C15H14O5688912968786412811449538410,0978984
Negative Mode
- Negatively Associated with russeting
Quercetin-hexoside1520.42463.08761.3C21H20O1218251505319718414088109215291345961696
Quercitrin1822.12447.0931−0.4C21H20O1172,48771,476123,36981,673122,67037,82552,94943,90132,27628,207
Unknown triterpene2631.74489.358−1.1C30H50O5735756103412311315601440268205126
Maslinic Acid2734.36471.34820.5C30H48042334607891021818429515146266206
Corosolic Acid2835.34471.34820.5C30H4804295277553569684310282265211185
Positive Mode
- Negatively Associated with fruit development
Benzoic acid derivative (sodium adduct)290.5219.0263−0.4C9H8O5143415851143935841115011431144953817
Quinic Acid10.57193.0702−1.9C7H12O659403579215913485318569582424681150398
Hydroxybenzoic acid300.57139.03891C7H6O31490104970043917720701512772368128
Feruloyl-hexoside (sodium adduct)1215.59379.0998−0.4C16H20O95531469539523525185351875252412832111994
Positive Mode
- Positively Associated with fruit development
Tetra-saccharide (sodium adduct)310.58689.2096−2.4C24H42O2123037074896313522273807949291380
Tri-saccharide (sodium adduct)320.62527.1574−1.6C18H32O16812140030364386565310061670339743985730
Phenol-hexoside (sodium adduct)3515.17381.1154−0.6C16H22O911214633867112772434018297271227
Vomifoliol-hexoside (sodium adduct)3619.12387.2009−0.9C19H30O8992147426372674395310342093243926343798
Vomifoliol-pentosyl-hexoside1419.89519.2435−0.2C24H38O125799561848187626946671548195419162609
Positive Mode
- Positively Associated with russeting
Chlorogeno-quinone3310.82353.08680.3C16H16O93826663853813701839330,02712,45026,51823,45215,823
Cryptochlorogeno-quinone3413.13353.08680.3C16H16O9236367244179151969663727596335
Coumaroyl-quinic acid isomer2417.26339.107−1.3C16H18O8107231217214244204433411291191804
Coumaroyl-hexoside derivative3826.34309.0968−0.3C15H16O78227317896756512194152219441345963
Positive Mode
- Negatively Associated with russeting
Quercitrin1822.9449.10752.1C21H20O114186386467744526622219863110238017291658
Quercetin-acetyl-hexoside3723.69507.1132−0.2C23H22O137738323296185452507931586714528719
Linolenic acid3939.2279.2318−0.2C18H30O2380480797707364196188786178
Ursa/Olea-dien-one4039.375423.3617−1C30H46O719960131016391508327428207195175
Alpha/Beta-amyrone4139.69425.3771−1.6C30H48O9721459251627043274932147011521107945
Olea/Ursa-dien-one4240.07423.3613−2C30H46O386502726661581237345157182210
Ursolic/Oleanolic Aldehyde4340.09441.37231,2C30H48O218832098322232111898927672583750505
Table 2. Putative identity and relative abundance of compounds pointed out in the Venn diagram using the meta-analysis of the ‘Canada Blanc’—‘Canada Gris’ comparisons across five time points (Figure 2C,D). Data were collected using UPLC coupled with a high-resolution mass spectrometer (UPLC-TripleTOF HR-MS) in positive and negative mode. Fragmentation data for each compound are presented in Table S2. The peak area of the extracted ion chromatogram (EIC) of each metabolite feature is presented as the average value of 3 biological replicates (n = 3), each assayed in duplicate (Average EIC). Abbreviations: tr, retention time; DAFB = days after full bloom.
Putative IdentityCompound Numbertr (min)Observed [M+H]+/ [M−H]Error (ppm)Molecular FormulaAverage EIC (‘Canada Blanc’)Average EIC (‘Canada Gris’)
57 DAFB78 DAFB99 DAFB120 DAFB150 DAFB57 DAFB78 DAFB99 DAFB120 DAFB150 DAFB
Positive Mode
Chlorogeno-quinone3310.82353.08680.3C16H16O93826663853813701839330,02712,45026,51823,45215,823
Cryptochlorogeno-quinone3413.13353.08670.01C16H16O9149621671379114895881003916462639932438
Coumaroyl-quinic acid isomer2417.26339.107−1.3C16H18O8107231217214244204433411291191804
Maslinic Acid2739.09473.3604−4.9C30H48O41298141244666990842151393872160133383219
Corosolic Acid2839.24473.3616−2C30H48O4242467137619973415697103753311481163
p-coumaroyloxy-hydroxy-urs/olean-12-en-28-oic acid4440.68619.39930C39H5406130914132318701662103720498995623691498
Negative Mode
Quercetin-hexoside1520.42463.08761.3C21H20O1218251505319718414088109215291345961696
Phlroretin2526.89273.07721.3C15H14O5688912968786412811449538410,0978984
p-coumaroyloxy-hydroxy-urs/olean-12-en-28-oic acid4539.65617.38480.1C39H54061501782536676888101175485797430
Caffeoyl-quinic isomer462.1353.0853−7.1C16H18093011444141882301558829,751847919,42320,19414,270
Unknown Triterpene4735.91473.3634−0.5C30H50O4493159627696904489753040287912831041790
3-oxo-hydroxy-urs-12-en-28-oic acid4838.04469.33211.8C30H46O4258245389561672584585866970354
Table 3. A subset of the differentially expressed proteins and genes (FC > 0.5). Features found in both datasets are displayed in the first part of the table. Annotations were obtained from the Malus × domestica genome draft v1.0. Protein abundance obtained from the liquid chromatography (LC) is expressed as Normalized Spectral Abundance Factor (NSAF100), transcript abundance obtained from RNA sequencing (RNA-Seq) is expressed as RPKM. Abbreviations: DAFB = days after full bloom; RPKM = Reads per Kilobase transcript per Million reads.
DatasetContig CodeGene SymbolAnnotation Description‘Canada Blanc’‘Canada Gris’
57 DAFB78 DAFB99 DAFB120 DAFB150 DAFB57 DAFB78 DAFB99 DAFB120 DAFB150 DAFB
Features found in the RNA-Seq and proteomic data
Cutin and wax related
LCMDP0000120594 HXXXD-type acyl-transferase family protein 0.25
RNAseqMDP0000120594 HXXXD-type acyl-transferase family protein270.7252.8332.3207.8455.1138.798.775.364.6115.3
LCMDP0000166457 HXXXD-type acyl-transferase family protein 0.23
RNAseqMDP0000166457 HXXXD-type acyl-transferase family protein4.86.315.38.330.01.10.30.40.23.5
LCMDP0000184619 Li-tolerant lipase 11.981.762.422.38 0.68
RNAseqMDP0000184619ATLTL1, LTL1Li-tolerant lipase 11967.71372.92047.1560.559.0450.2302.347.26.00.3
LCMDP0000231084 acetoacetyl-CoA thiolase 20.470.180.230.250.96 0.28
RNAseqMDP0000231084ACAT2acetoacetyl-CoA thiolase 21195.0848.81219.7834.91366.9532.4287.9282.8218.9396.1
LCMDP0000285074 lipid transfer protein 316.3510.5224.2322.8111.3710.845.039.4414.466.51
RNAseqMDP0000285074LTP3lipid transfer protein 323,540.029,906.749,936.632,077.564,941.56517.55625.12116.92379.119,183.5
LCMDP0000304369 lipid transfer protein 35.984.458.758.041.256.90
RNAseqMDP0000304369LTP3lipid transfer protein 3543.4284.9245.1150.0778.1194.262.925.326.6539.6
LCMDP0000319048 Peroxidase superfamily protein3.062.042.481.370.682.361.291.06
RNAseqMDP0000319048PRX52Peroxidase superfamily protein297.8133.7149.744.029.180.928.34.41.53.6
Suberin-related
LCMDP0000197743 Bifunctional inhibitor/lipid-transfer protein 0.87
RNAseqMDP0000197743 Bifunctional inhibitor/lipid-transfer protein0.61.54.48.513.011.318.623.916.510.2
LCMDP0000208152 peroxidase 2 0.620.180.230.71 0.350.791.940.26
RNAseqMDP0000208152ATPA2, PA2peroxidase 20.42.83.213.310.11.78.520.532.116.0
LCMDP0000306867 Peroxidase superfamily protein 0.55 0.471.150.74 0.67
RNAseqMDP0000306867PRX52Peroxidase superfamily protein22.629.377.2183.4210.9127.6204.2138.5128.5107.5
LCMDP0000312095 Peroxidase superfamily protein 0.21
RNAseqMDP0000312095PRX72Peroxidase superfamily protein4.23.07.514.019.713.119.826.023.132.0
Features found in the proteomic data only
Cutin and wax related
LCMDP0000231084 acetoacetyl-CoA thiolase 20.470.180.230.250.96 0.28
LCMDP0000157284 acetyl co-A carboxylase 0.73
LCMDP0000166116 acyl activating enzyme 5 0.81
LCMDP0000323883 acyl-CoA oxidase 1 0.60
LCMDP0000129664 peroxisomal 3-ketoacyl-CoA thiolase 3 0.48
LCMDP0000231304 peroxisomal 3-ketoacyl-CoA thiolase 3 0.62
LCMDP0000251803 alpha/beta-Hydrolases superfamily protein 0.35
LCMDP0000697378 alpha/beta-Hydrolases superfamily protein 0.49
LCMDP0000122785 alpha/beta-Hydrolases superfamily protein 0.83
LCMDP0000476415LTL1, GDSL1Li-tolerant lipase 1 1.17
LCMDP0000496434LTL1, GDSL1Li-tolerant lipase 1 2.62 2.00
LCMDP0000322755CCRcinnamoyl coa reductase 1 0.48
LCMDP0000227287 Terpenoid cyclases family protein 0.51
LCMDP0000478473CYP716A1cytochrome P450, family 716A1 0.21
LCMDP0000130449CYP716A1cytochrome P450, family 716A1 0.22
LCMDP0000432497EXPA15expansin A15 0.23
LCMDP0000431696EXPA8expansin A8 0.52
LCMDP0000220665PA2, PRX53peroxidase 2 0.320.25
LCMDP0000539299PA2, PRX53peroxidase 2 0.72
LCMDP0000319048 Peroxidase superfamily protein3.062.042.481.370.682.361.291.06
LCMDP0000127521MYB17myb domain protein 17 0.18
Suberin-related
LCMDP0000197743LTPG20Bifunctional inhibitor/lipid-transfer protein 0.87
LCMDP0000293049LTPG20Bifunctional inhibitor/lipid-transfer protein 1.48
LCMDP0000525641FLA1FASCICLIN-like arabinogalactan 10.330.580.34 0.24 0.500.241.190.34
LCMDP0000904458FLA2FASCICLIN-like arabinogalactan 21.290.671.371.380.650.921.012.054.010.83
LCMDP0000658332FLA11FASCICLIN-like arabinogalactan-protein 101.260.480.740.380.441.270.631.091.720.15
LCMDP0000301828PA2, PRX53peroxidase 20.52 0.830.560.451.080.481.903.370.59
LCMDP0000208152PA2, PRX53peroxidase 2 0.620.180.230.71 0.350.791.940.26
LCMDP0000209189 Peroxidase superfamily protein1.651.322.121.742.053.081.735.458.172.61
LCMDP0000207215 Peroxidase superfamily protein1.501.251.881.000.982.071.382.694.741.31
LCMDP0000283650 Peroxidase superfamily protein0.620.661.270.430.490.730.651.262.260.66
LCMDP0000519318WAK3wall associated kinase 3 0.680.38
LCMDP0000323987XTH5xyloglucan endotransglucosylase/hydrolase 5 0.26 0.53
LCMDP0000269483XTH6xyloglucan endotransglucosylase/hydrolase 6 0.35 0.63
Table 4. Subset of the significant differentially expressed genes observed in clusters C4 to C7 (fold change > 4, FDR corrected p-value < 0.05 in at least one sampling date). Genes were sorted in pathways according to the literature cited in the manuscript. Abbreviations: DAFB = days after full bloom; RPKM = Reads per Kilobase transcript per Million reads.
Contig CodeGene SymbolTAIR CodeAnnotation DescriptionLog2 Ratio (RPKM CG/RPKM CB)
57 DAFB78 DAFB99 DAFB120 DAFB150 DAFB
Suberin synthesis
MDP0000433567KCS2AT1G04220.13-ketoacyl-CoA synthase 20.492.041.590.90−0.60
MDP0000922301KCS4AT1G19440.13-ketoacyl-CoA synthase 43.282.842.621.181.48
MDP0000150502GPAT5AT3G11430.1glycerol-3-phosphate acyltransferase 54.003.242.491.23−0.18
MDP0000923760CYP86A1AT5G58860.1cytochrome P450, family 86, subfamily A, polypeptide 14.023.012.381.08−0.21
MDP0000306273CYP86B1AT5G23190.1cytochrome P450, family 86, subfamily B, polypeptide 13.813.342.661.43−0.07
MDP0000138841FAR5AT3G44550.1fatty acid reductase 52.773.412.571.20−0.39
MDP0000312412FATBAT1G08510.1fatty acyl-ACP thioesterases B4.243.422.541.33−0.17
Phenylpropanoid
MDP0000219895C4HAT2G30490.1cinnamate-4-hydroxylase0.162.322.770.790.47
MDP00002605124CL2AT3G21240.14-coumarate: CoA ligase 21.672.061.560.94−0.35
MDP0000287919CHS, TT4AT5G13930.1Chalcone and stilbene synthase family protein−2.872.632.530.672.41
MDP0000274127CHI, TT5AT3G55120.1Chalcone-flavanone isomerase family protein2.262.061.890.600.15
MDP0000264424HCTAT5G48930.1shikimate O-hydroxycinnamoyltransferase0.662.802.330.550.11
MDP0000479113OMT1AT5G54160.1O-methyltransferase 13.803.442.791.26−0.26
MDP0000246535CCoAOMT1AT4G34050.1Caffeoyl CoA methyltransferase2.593.332.711.13−0.24
MDP0000164173CYP84A1, FAH1AT4G36220.1ferulic acid 5-hydroxylase 13.343.152.631.680.40
Transport
MDP0000265619ABCG2AT2G37360.1ABC-2 type transporter family protein1.882.011.921.06−0.05
MDP0000299379ABCG6AT5G13580.1ABC-2 type transporter family protein3.173.082.670.900.00
MDP0000731415ABCG23AT5G19410.1ABC-2 type transporter family protein4.063.202.401.26−0.25
MDP0000193438ABCG11AT1G17840.1white-brown complex homolog protein 11−1.842.432.010.74−0.45
MDP0000940078LTP1AT2G38540.1lipid transfer protein 1−2.012.791.721.900.76
MDP0000197743LTPG20AT3G22620.1Bifunctional inhibitor/lipid-transfer protein4.233.602.461.02−0.28
MDP0000304463LTPG16, EDA4AT2G48140.1Bifunctional inhibitor/lipid-transfer protein4.143.402.671.29−0.18
MDP0000137283LTPG5AT3G22600.1Bifunctional inhibitor/lipid-transfer protein1.962.171.981.05−0.11
Pentacyclic triterpene synthesis
MDP0000207731 AT1G78950.1beta amyrin synthase3.693.183.011.501.81
MDP0000661381CYP96A2AT4G32170.1cytochrome P450, family 96, subfamily A, polypeptide 21.912.552.120.641.54
MDP0000266125MdOSC5AT1G78955.1Oxidosqualene 5/lupeol Synthase3.743.173.041.591.64
MDP0000212688LUP1AT1G78970.1lupeol synthase 14.193.083.271.402.20
MDP0000151814LUP2AT1G78960.1lupeol synthase 22.843.152.691.421.44
MDP0000634676SQE1AT1G58440.1FAD/NAD(P)-binding oxidoreductase family protein−2.701.151.99−0.500.08
Cell wall metabolism
MDP0000139485XTH30AT1G32170.1xyloglucan endotransglucosylase/hydrolase 301.342.681.590.86−0.16
MDP0000311765XTH32AT2G36870.1xyloglucan endotransglucosylase/hydrolase 321.993.012.511.23−0.24
MDP0000398765XTH5AT5G13870.1xyloglucan endotransglucosylase/hydrolase 52.233.142.320.800.01
MDP0000320017XTH23AT4G25810.1xyloglucan endotransglycosylase 61.693.481.981.49−0.48
MDP0000205889AGP16AT2G46330.1arabinogalactan protein 16−0.142.131.020.94−0.89
MDP0000287357AGP30AT2G33790.1arabinogalactan protein 301.812.102.391.540.17
MDP0000165381AGP31AT1G28290.1arabinogalactan protein 310.631.832.351.11−0.02
MDP0000133529PELAT3G53190.1Pectin lyase-like superfamily protein2.783.311.830.94−0.61
MDP0000297071PMEIAT5G09760.1Pectin methylesterase inhibitor0.852.691.710.74−0.26
MDP0000560112EXPA1AT1G69530.1expansin A10.352.052.504.622.58
MDP0000195798EXPA4AT2G39700.1expansin A41.962.311.020.85−1.22
MDP0000290170EXPB2AT1G65680.1expansin B21.433.041.340.900.86
MDP0000208152PA2, PRX53AT5G06720.1peroxidase 21.961.602.721.330.74
MDP0000312095PRX72AT5G66390.1Peroxidase superfamily protein1.632.711.830.780.77
MDP0000306867PRX52AT5G05340.1Peroxidase superfamily protein2.492.790.87−0.44−0.90
MDP0000126274LAC7AT3G09220.1laccase 71.104.161.270.09−1.68
MDP0000262848LAC14AT5G09360.1laccase 141.242.262.290.090.51
MDP0000655646LAC15AT5G48100.1laccase 150.722.161.600.180.28
Transcription factor
MDP0000211677MYB4AT4G38620.1myb domain protein 40.811.372.101.391.18
MDP0000210851MYB7AT2G16720.1myb domain protein 72.133.111.820.900.58
MDP0000124049MYB36AT5G57620.1myb domain protein 363.523.352.671.261.20
MDP0000787808MYB42AT4G12350.1myb domain protein 420.322.011.28−0.29−0.20
MDP0000291518MYB52AT1G17950.1myb domain protein 523.573.522.671.420.79
MDP0000133542MYB58AT1G16490.1myb domain protein 583.703.401.860.74−0.81
MDP0000157506MYB67AT3G12720.1myb domain protein 674.113.242.901.631.18
MDP0000786507MYB68AT5G65790.1myb domain protein 683.873.393.291.420.80
MDP0000682032MYB85AT4G22680.1myb domain protein 853.282.912.461.120.11
MDP0000320772MdMYB93AT1G34670.1myb domain protein 934.113.192.541.34−0.15
MDP0000197283MYB102AT4G21440.1myb domain protein 1022.122.260.820.11−1.20
MDP0000262032ANAC072, RD26AT4G27410.2NAC domain containing protein 721.171.122.011.070.68
MDP0000129335NAC100AT5G61430.1NAC domain containing protein 1001.452.191.060.31−0.36
MDP0000690168NAC038AT2G24430.1NAC domain containing protein 383.233.082.641.220.84
MDP0000235213NAC058AT3G18400.1NAC domain containing protein 583.593.442.491.190.00
MDP0000124509NAC075AT4G29230.1NAC domain containing protein 753.293.202.111.270.39
MDP0000126517NAC083, VNI2AT5G13180.1NAC domain containing protein 832.733.112.521.180.71
Acyl-transferases
MDP0000698860 AT4G13840.1HXXXD-type acyl-transferase family protein3.873.282.521.350.01
MDP0000593263 AT1G32910.1HXXXD-type acyl-transferase family protein3.052.922.501.22−0.10
MDP0000478556 AT4G13840.1HXXXD-type acyl-transferase family protein4.012.682.011.21−0.08
MDP0000312405 AT5G41040.1HXXXD-type acyl-transferase family protein4.033.242.921.600.82
MDP0000253113 AT3G26040.1HXXXD-type acyl-transferase family protein1.362.082.080.930.87
MDP0000258308RWP1, FCT, FHTAT5G41040.1Feruloyl-hydroxycinnamoyl acytransfearase4.183.222.531.24−0.18
Miscellaneous
MDP0000660239 AT1G74460.1GDSL-like Lipase/Acylhydrolase superfamily protein4.453.522.541.32−0.41
MDP0000174332 AT1G75900.1GDSL-like Lipase/Acylhydrolase superfamily protein3.012.912.641.210.23
MDP0000172849 AT3G03990.1alpha/beta-Hydrolases superfamily protein1.062.051.941.241.29
MDP0000594621 AT1G47480.1alpha/beta-Hydrolases superfamily protein3.473.042.541.060.01
MDP0000930224 AT2G18360.1alpha/beta-Hydrolases superfamily protein3.373.072.791.090.68
MDP0000188790 AT5G06570.1alpha/beta-Hydrolases superfamily protein1.661.202.590.510.47
MDP0000927926 AT4G18550.1alpha/beta-Hydrolases superfamily protein3.482.813.041.130.85
Publisher’s Note: MDPI stays neutral with regard to jurisdictional claims in published maps and institutional affiliations.

