Communication

Silencing Phytoene Desaturase Causes Alteration in Monoterpene Volatiles Belonging to the Methylerythritol Phosphate Pathway

Citrus Research and Education Center, Department of Plant Pathology, IFAS, University of Florida, 700 Experiment Station Road, Lake Alfred, FL 33850, USA
Plants 2022, 11(3), 276; https://doi.org/10.3390/plants11030276
Submission received: 21 December 2021 / Revised: 17 January 2022 / Accepted: 17 January 2022 / Published: 20 January 2022
(This article belongs to the Special Issue Volatile Organic Compounds on Plant Communication and Defense)

Abstract

:
Volatile organic compounds (VOCs) are a large group of lipophilic hydrocarbon compounds derived from different biosynthetic pathways in plants. VOCs are produced and released from plants as a defense mechanism against biotic and abiotic stresses. They are involved in communication with the surrounding environment including plant-to-plant interactions and attracting or repelling insects. In citrus, phytoene desaturase (PDS), a precursor of the carotenoid biosynthetic pathway has been silenced using the Citrus tristeza virus-induced gene silencing technique. Silencing PDS resulted in a reduction of carotenoid contents and in the photobleaching phenotype in leaves. Interestingly, the strength of the phenotype was varied within the plants due to the unequal distribution of virus particles. Using solid-phase microextraction (SPME), fibers released VOCs from leaves with gradient degrees of the photobleaching phenotype were collected and analyzed in gas chromatography-mass spectrophotometry (GC-MS). Overall, 47 VOCs belonging to 12 chemically distinguished groups were detected and identified using authentic standards. Simple linear regression showed that monoterpenes belonging to methylerythritol phosphate (MEP) were significantly corrected with the degrees of photobleaching (carotenoid content). Both carotenoids and MEP biosynthetic pathways occurred in the plastid. Thus, we provide preliminary evidence for a potential role of carotenoids in supporting the MEP pathway and/or the production of monoterpenes.

1. Introduction

Virus-induced gene silencing (VIGS) in Citrus spp. has been developed as a powerful tool to study functional genomics and to defend citrus against “Ca. Liberibacter asiaticus”, the pathogen associated with citrus Huanglongbing (HLB), also called citrus greening disease [1,2]. VIGS is achieved by using the mild strain T-36 of Citrus tristeza virus (CTV), a member of the genus Closterovirus, to knockdown endogenous genes in citrus tissues. Among the genes targeted through RNAi is the reporter gene phytoene desaturase (PDS), a key plant enzyme involved in carotenoid biosynthesis [3]. PDS facilitates the conversion of phytoene to β-carotene and other carotenoids in the plastid via the methylerythritol phosphate (MEP) pathway [4]. Carotenoids are plastidic tetraterpenoids and are the essential building blocks for vitamin A and plant-protectant compounds such as lycopene in colored plant parts of fruits and vegetables [5,6]. Silencing the PDS gene via RNAi results in a visible “photo-bleached leaf” phenotype that has been instrumental in the study of plant functional genomics [2,3,7].
The efficiency of gene silencing is influenced by many factors, including the VIGS vector, the host plant, and the gene selected for targeting [1]. In addition, the bleached-leaf phenotype is more pronounced, when the antisense orientation of the construct is used to be compared to the sense orientation [8]. Although PDS gene expression is down-regulated in both sense and antisense orientations, the greater silencing of PDS is induced due to the production of subgenomic RNAs that complements the small interfering RNAs, resulting in a stronger phenotype [9]. The stronger phenotype correlates well with higher levels of accumulated phytoene and lower levels of xanthophylls and carotenes in citrus plants treated with antisense-oriented constructs [8]. Finally, because certain plant volatile organic compounds (VOCs) arise from the carotenoid biosynthetic pathway, the effects of the PDS suppression on the VOC profile of CTV-tPDS citrus were recently studied [10].
Plants emit volatile compounds for communication, to attract pollinators and in response to infestation and herbivory by insects [4,11]. Emission into the atmosphere can occur passively by diffusion through the cell membranes or through the disruption of the storage glands during herbivory or other physical damage to plant tissues. Diaphorina citri respond to both olfactory and visual cues when seeking a host plant and are attracted to the alterations in the leaf color and VOC profile of PDS-silenced Citrus macrophylla [10]. In that study, monoterpenes were increased, and sesquiterpenes were decreased, suggesting some correlation between the disruption of biosynthetic pathways and the altered VOCs profiles found in CTV-tPDS citrus [10]. However, in that study, volatiles were collected from PDS-silenced C. macrophylla without discrimination against the degree of the photobleaching phenotype [10].
Hundreds of plant-emitted VOCs can be classified into 10 major groups stemming from four main biosynthetic pathways: (1) green leaf volatiles and jasmonates, arising from fatty acids in the acetate/lipoxygenase pathway; (2) cinnamates, benzoates, and methyl chavicol from the shikimate pathway; (3) sesquiterpenes (C15) derived from the mevalonic acid (MVA) pathway in the cytosol; and (4) monoterpenes (C10), diterpenes (C20), and apocarotenoids arising from the plastidic MEP pathway [4,12]. Even so, given the large diversity of volatile compounds synthesized in citrus, the specific pathways and steps limiting their biosynthesis remain to be ascertained. Therefore, we hypothesized that the VOC profile of the CTV-tPDS citrus would be altered in a gradient-based manner according to the degree of the photobleached-leaf phenotype.

2. Results

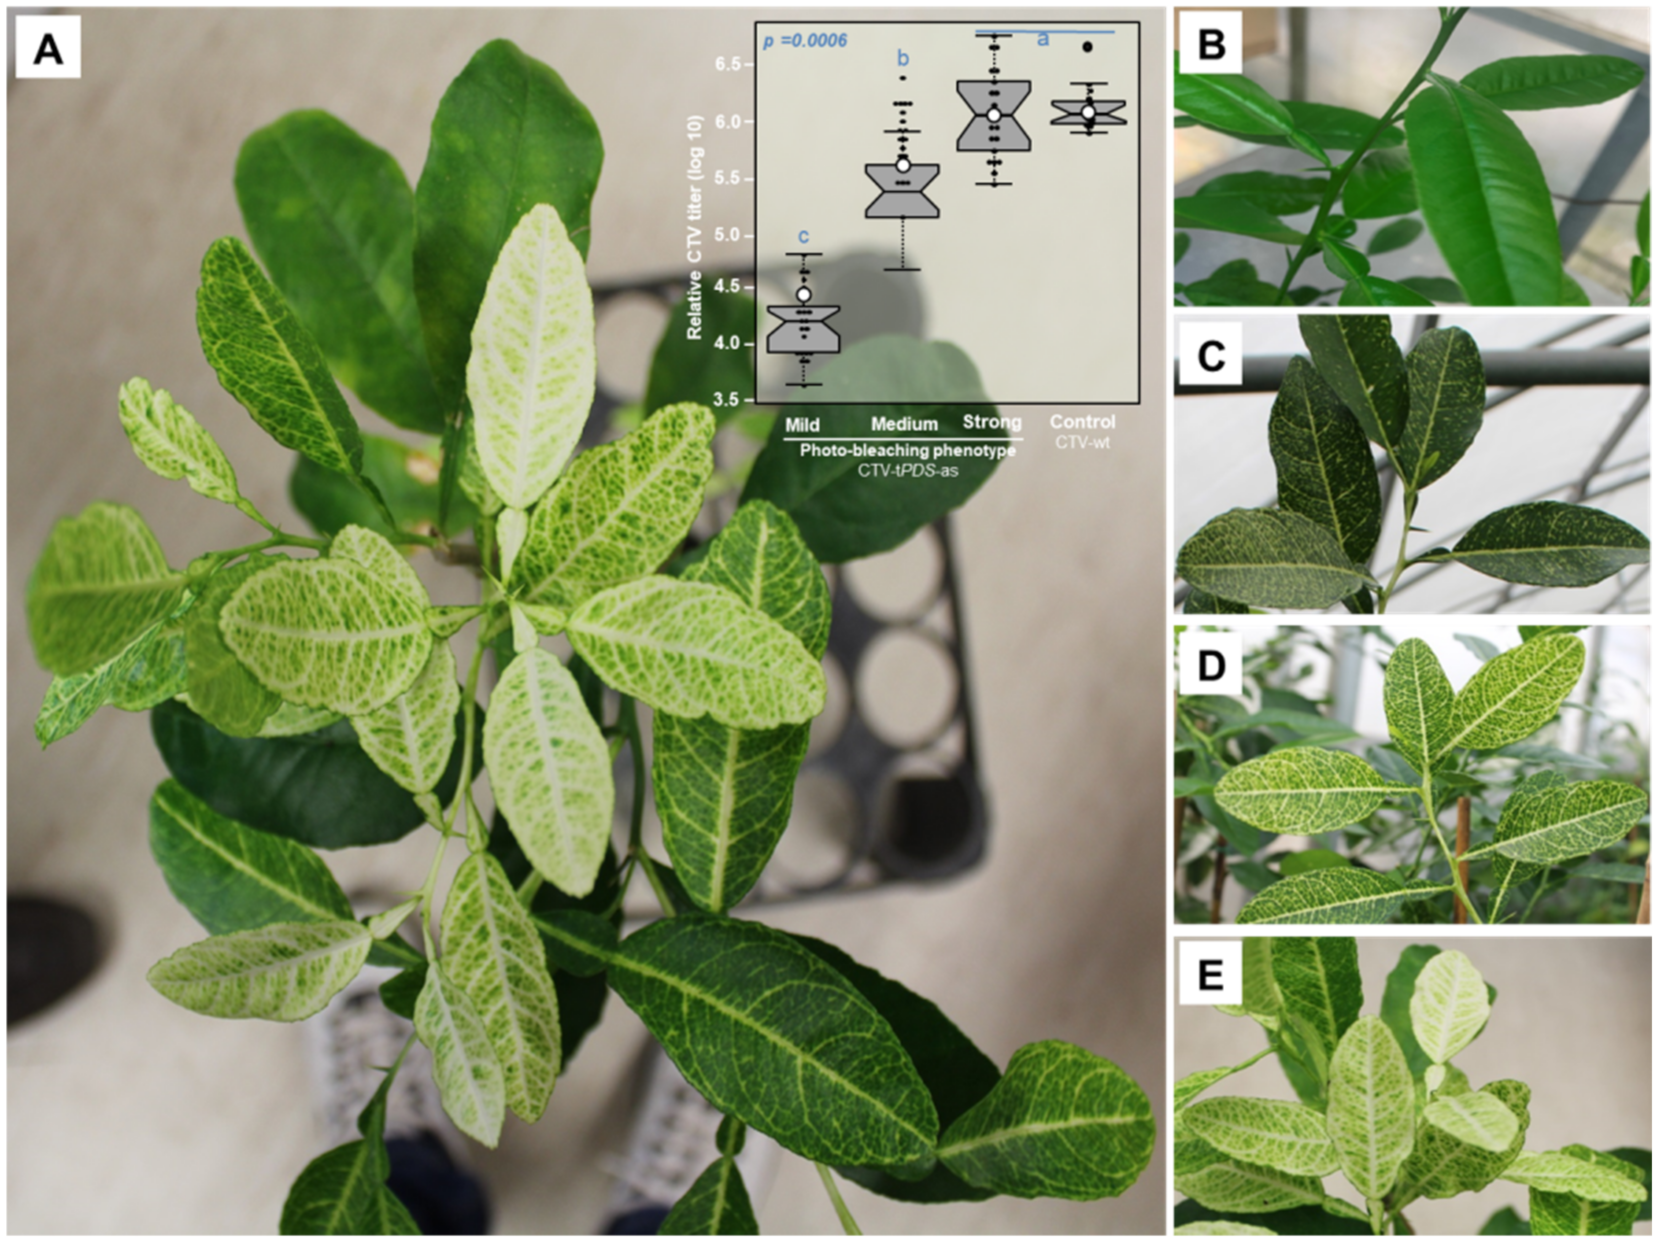
2.1. The Photobleaching Phenotype Is Correlated to the CTV Titer

In this study, we used PDS-silenced C. macrophylla using an antisense orientation (CTV-tPDS-as). We noticed that the photobleached phenotype in the PDS-silenced citrus was not homogenous within the tree (Figure 1A). We selected three degrees of the phenotype (i.e., mild, medium, and strong) in addition to the control (CTV-wt) (Figure 1B–E). The qPCR showed a positive correlation between the CTV titer and the strength of phenotype in the PDS-silenced plant. However, in the control plant that was inoculated with the empty vector (CTV-wt), the virus titer was as high as the strong phenotype of the PDS-silenced plant but did not show any photobleaching (Figure 1A, the upper right).

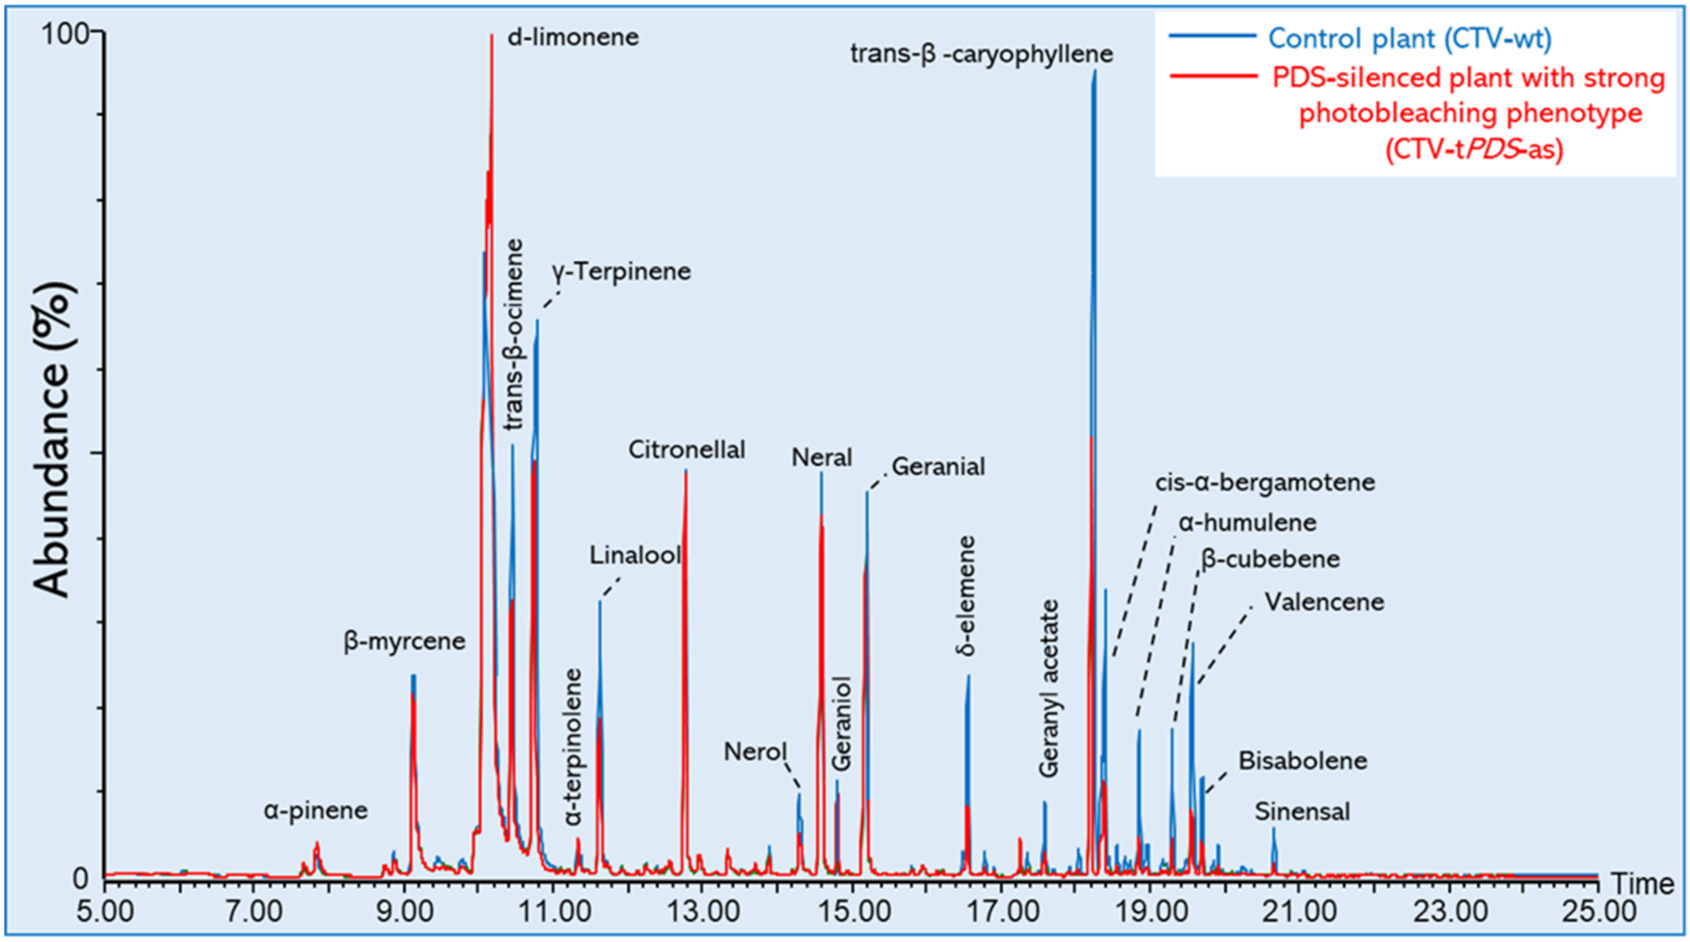
2.2. VOCs Released from C. Macrophylla

To test the relationship between the carotenoid pathway and the production of VOCs, we selected leaves with varying degrees of PDS gene expression (photobleaching phenotype) and collected their released volatiles using solid phase microextraction (SPME) followed by gas chromatography-mass spectrometry (GC-MS) (Figure 2).
We collected the released volatiles from the mature, fully expanded leaves of C. macrophylla plants inoculated with CTV-tPDS-as categorized with having a “mild”, “medium”, or “strong” phenotype and compared them to emissions from C. macrophylla inoculated with the empty vector CTV-wt as the control plants (Figure 1B–E).
Overall, 47 volatile compounds were detected, identified mainly with authentic standards and quantified using the peak areas (Table 1). The compounds were classified into 12 VOC classes including 13 monoterpenes, 11 sesquiterpenes, six monoterpene alcohols, five monoterpene aldehydes, three monoterpene esters, three sesquiterpenes alcohols, and six compounds from other classes. The biosynthetic pathway associated with each compound class is indicated in Table 1.

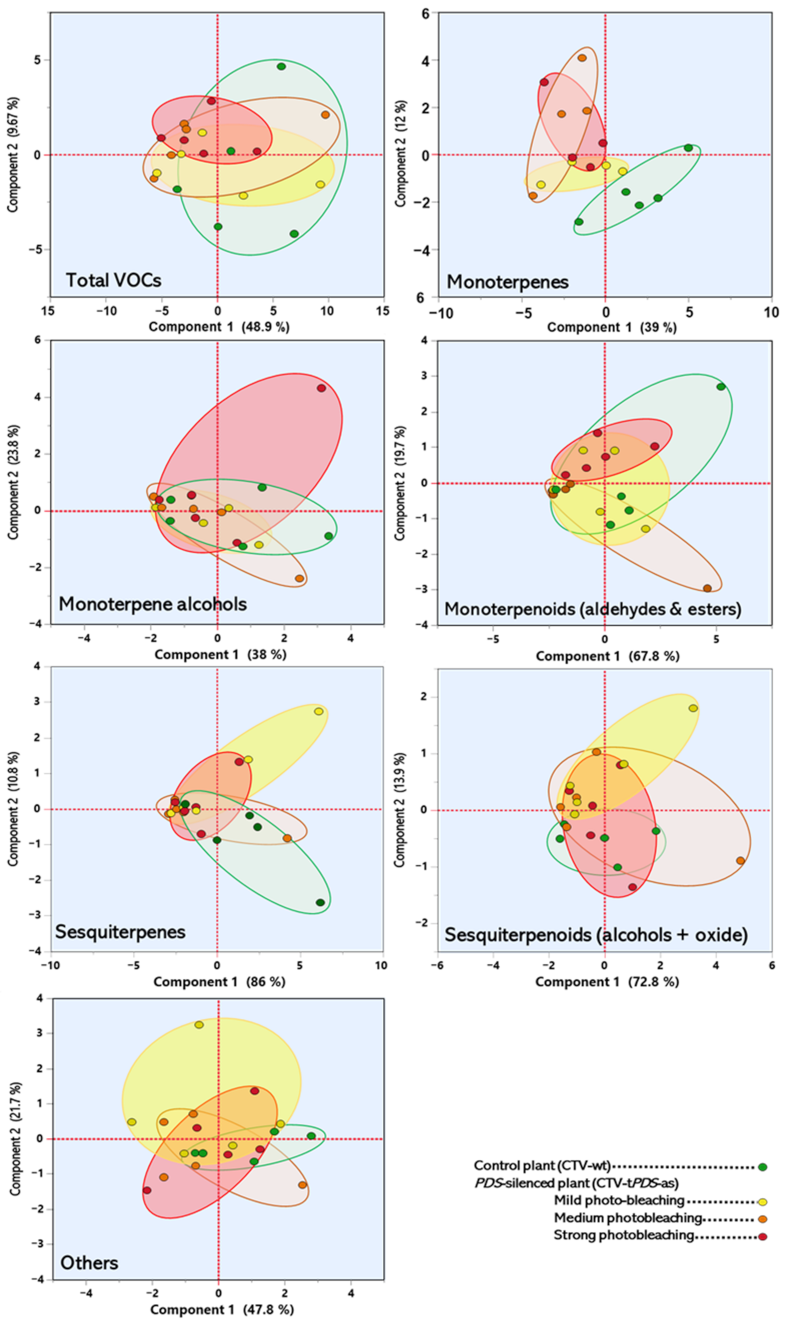
2.3. Prencipal Component Analysis (PCA)

To discriminate the effects of the silencing of PDS with different degrees of photobleaching on the production of VOCs, PCA was performed using all detected compounds or only main classes. When all compounds were used, no clear separation was observed (Figure 3). Similar results were observed when individual groups were used. Only the PCA performed with monoterpenes showed a clear separation for the three degrees of photobleaching from the control leaves (Figure 3). This finding suggested that monoterpenes is the main class of volatile that is affected with the reduction in the carotenoid pathway.

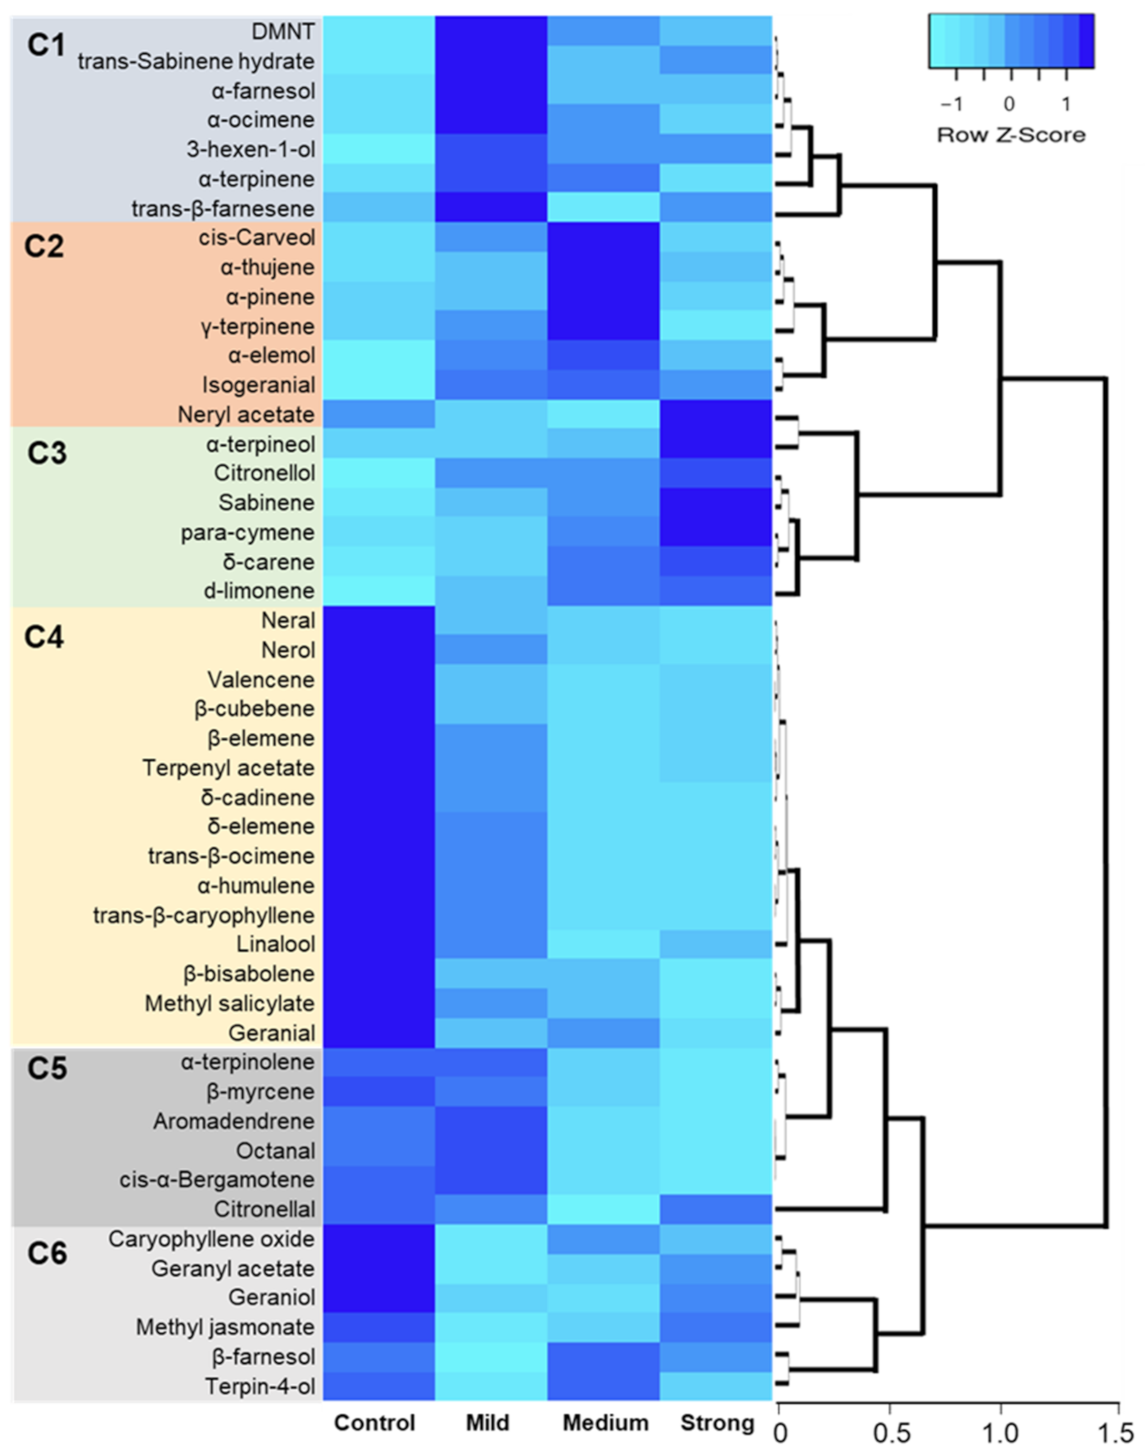
2.4. Hierarchical Clustering, Heat Map, and Simple Linear Regression

The two ways hierarchical cluster analysis and heat map diagram of the volatiles released from citrus leaves with a gradient degree of the PDS leaf phenotype are shown in Figure 4.
Cluster 1 (C1) depicted those compounds associated with the mild phenotype. They included 4,8-dimethyl-1,3,7-nonatriene (DMNT), α-terpinene, trans-sabinene hydrate, and α-ocimene (derived from the MEP pathway), trans-β-farnesene and α-farnesol that are derived from the MVA pathway, and the green leaf volatile 3-hexen-1-ol derived from the lipoxygenase (LOX) pathway. Cluster 2 (C2) compounds were associated with the medium grade of phenotype and included α-thujene, α-pinene, γ-terpinene, isogeranial, cis-carveol, and α-elemol. All, except α-elemol, were derived from the MEP pathway. Cluster 3 (C3) and cluster 4 (C4) were associated with the VOCs that correlated well (positively or negatively) with the increasing PDS phenotype strength. C3 compounds were associated with the strongest PDS phenotype and increased in the concentration with the increasing phenotype. Using simple linear regression analysis allowed us to study relationships between two continuous (quantitative) variables. In our case, the two variables were the degree of the photobleaching phenotype (carotenoid content) and the quantity of a VOC. The simple linear regression revealed the correlation between carotenoids and volatile production, suggesting a possible connection.
Simple liner regression confirmed this correlation (Table 1). These included sabinene (p = 0.0239), δ-carene (p = 0.0046), para-cymene (p = 0.0256), d-limonene (p = 0.0296), α-terpineol, citronellol, and neryl acetate, and all were from the MEP pathway. Cluster 4 consisted of 15 compounds, the largest of the clusters generated by the hierarchical clustering analysis. The compounds in C4 were highest in the control plants (CTV-wt), and their concentrations generally decreased with the increasing phenotype. Simple liner regression confirmed this correlation (Table 1). These compounds included trans-β-ocimene (p = 0.0303), linalool, methyl salicylate (p = 0.0363), nerol, neral, geranial, terpenyl acetate, δ-elemene (p = 0.0405), β-elemene, trans-β-caryophyllene, β-cubebene, α-humulene, valencene, β-bisabolene, and δ-cadinene. About half (8 of 15) C4 compounds were from the MVA pathway. Cluster 5 (C5) was correlated with the compounds that increased slightly in the mild phenotype compared to the control and then decreased with the increasing phenotype. These included β-myrcene (p = 0.015), octanal, α-terpinolene (p = 0.045), and citronellal from the MEP pathway and aromadendrene and cis-α-bergamotene from the MVA pathway. Finally, C6 represented compounds that were initially reduced in the mild phenotype and then recovered with increasing phenotype or which had a mixed response to the PDS phenotype. The C6 group included compounds from several biosynthetic pathways: terpin-4-ol, geraniol, and geranyl acetate (MEP); caryophyllene oxide and β-farnesol (MVA); and methyl jasmonate (shikimate). None were well correlated with the PDS phenotype gradient (Figure 4).
Thus, overall, the VOCs detected via SPME/GC-MS with statistically significant changes in the emission quantity with respect to the degree of the leaf phenotype using linear regression analysis included seven monoterpenes, one sesquiterpene (δ-elemene), and one benzenoid (methyl salicylate). The monoterpenes with strong correlations to phenotype included sabinene, β-myrcene, δ-carene, para-cymene, d-limonene, trans-β-ocimene, and α-terpinolene.

3. Discussion

PDS gene is widely used as a reporter gene for the virus-induced gene silencing technique, because the knockdown of PDS creates a specific photobleaching phenotype as a result of reduced carotenoid production [13,14,15,16]. We utilized CTV to construct a gene-silencing vector, and PDS was used as a reporter gene to demonstrate its efficiency [1]. In addition, we previously showed that the efficacy of silencing was higher when we used the antisense orientation of truncated PDS [8]. Furthermore, we showed that the augmented silencing effect observed after using the antisense orientation was caused by additional subgenomic RNA that was available as a supplemental source for complementary sequences, thereby resulting in more RNA inference and a subsequent increase in the photobleaching phenotype [8]. Silencing PDS in citrus resulted in the alterations of both carotenoids and chlorophyll pigments, indicating that carotenoids play a photoprotective role for chlorophyll and that when reducing carotenoids by PDS silencing, chlorophyll pigments may be more exposed to light-causing degradation [8].
Interestingly, PDS-silenced citrus plants were more attractive to Diaphorina citri, the psyllid vector of “Candidatus Liberibacter asiaticus”, the putative bacterial pathogen of huanglongbing in citrus, suggesting that these plants could potentially be used as trap crops [10]. The preference assay, electrical penetration graph, and chemical analysis indicated that these plants provide gustatory, visual, and olfactory cues that attract D. citri [10]. PDS-silenced plants exhibited an enriched metabolite content of the phloem sap, which offered appropriate gustatory cues that influenced probing/feeding behavior, while the bleaching phenotype on leaves provided a sufficient close-range visual attractant to stimulate D. citri landing [10]. Alternately, the olfactory cues that attracted D. citri to PDS-silenced plants could stem from the alteration in the biosynthesis and release of VOCs from leaves [10], demonstrating an interplay between the carotenoid and VOCs pathways.
The photobleaching in PDS-silenced citrus plants is not homogeneous within the tree due to the unequal distribution of CTV particles and the co-localization of the RNA inference with the CTV particles [8]. In the current study, we took advantage of this phenomenon to investigate the correlation between the carotenoid pathway and VOCs biosynthesis by using different degrees of photobeaching and the in vivo collection of VOCs. Although many VOCs were altered in PDS-silenced citrus plants, most VOCs that showed a strong correlation (statistically significant) with the photobleaching degree were monoterpenes belonging to the MEP pathway. These VOCs included sabinene, β-myrcene, δ-carene, para-cymene, d-limonene, trans-β-ocimene, α-terpinolene, citronellol, and geraniol. It is worth mentioning that the carotenoid and MEP biosynthetic pathways are localized in the plastid [4]. This co-localization and the gradient response of MEP monoterpenes with a contemporaneous reduction of carotenoids suggest an alternative route from carotenoids for theses volatiles. In support of our findings, Lewinsohn, et al. [17] showed that a yellow-fleshed tomato (r) mutant and water melon (early moonbeam), which carry nonfunctional phyotene synthase gene (psy1), were almost absent of geranial and several volatiles derivatized from norisoprenoid. This previous study suggested an alternative route to geranial from the carotenoids neurosporene, lycopene, and δ-carotene and confirmed that degraded carotenoids provided a substrate for many aroma compounds in tomato and watermelon [17].
Collectively, current findings strongly suggested the presence of a correlation between the carotenoid content and monoterpenes. More in-depth investigations are needed to increase our understanding regarding the correlation between the carotenoid pathway and the MEP pathway, which is responsible for the production monoterpenes, and their biosynthetic regulation in plants.

4. Materials and Methods

4.1. Production of CTV-wt and CTV-tPDS Plants

PDS-silenced citrus plants were produced in our previous study [8]. Briefly, the infectious cDNA clone of CTV (isolate T36; GenBank accession no. AY170468) in the binary vector pCAMBIA-1380 was used as a base plasmid, and a truncated PDS gene in its antisense orientation was used for engineering the construct (CTV-tPDS-as) [8]. CTV-tPDS-as and CTV-wt were agroinfiltrated into Nicotiana benthamiana to propagate the virions. CTV virions were isolated from N. benthamiana and inoculated into Citrus macrophylla seedlings [1]. The CTV titer was estimated using qPCR as described by Killiny [9].

4.2. Plant Maintenance

Experimental plants were about 12 months old and were maintained at 28 ± 2 °C, with 65 ± 5% relative humidity (RH), and a 16-h light/8-h dark photoperiod in a USDA-APHIS-approved secured greenhouse (Citrus Research and Education Center, University of Florida, Lake Alfred, FL, USA). Plants were irrigated twice weekly, fertilized with water soluble 20-10-20 NPK weekly (Peter’s Florida Special, Allentown, PA, USA) and once quarterly with a 16-8-10 NPK slow-release fertilizer (Harrell’s, Lakeland, FL, USA).

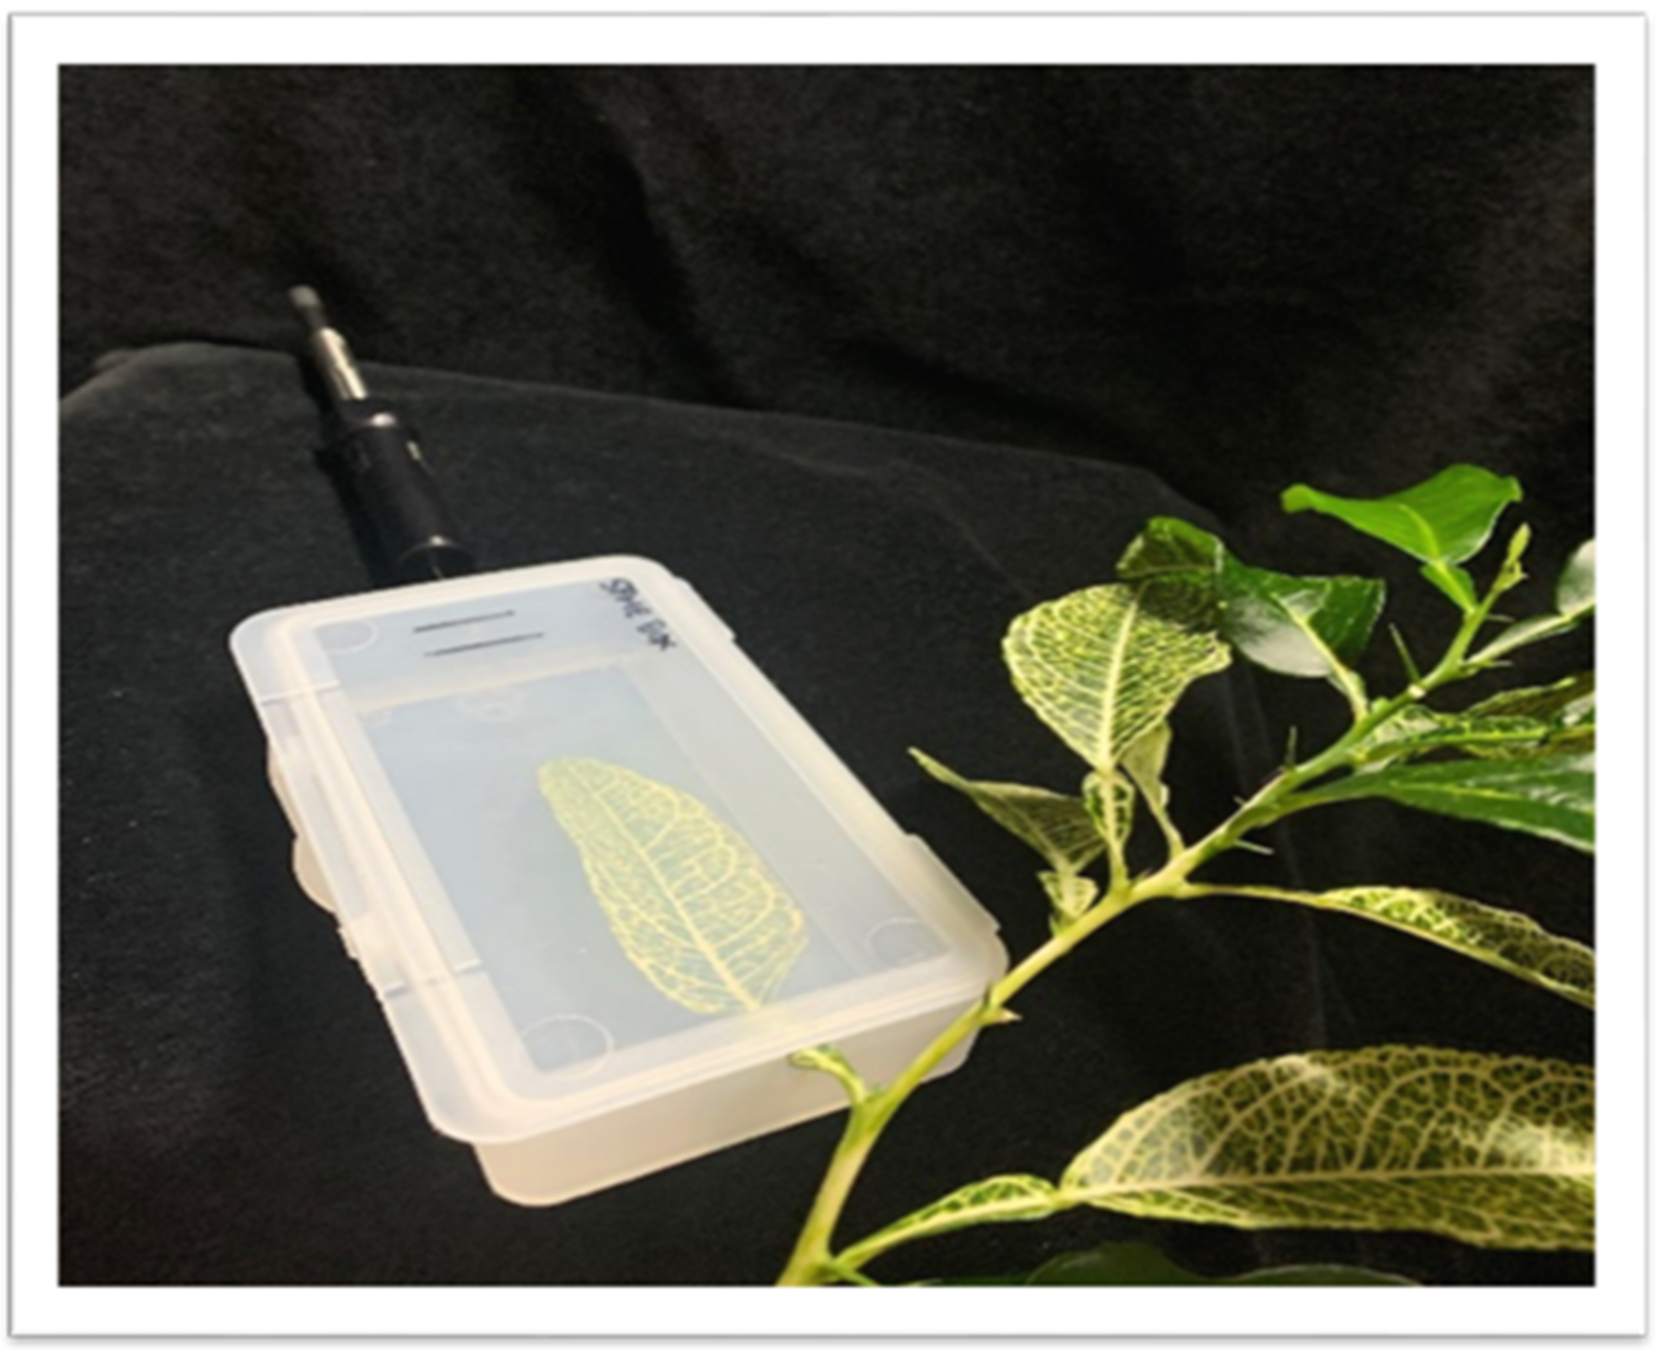
4.3. In Vivo VOC Collection

Released VOCs were collected from intact plant leaves using SPME and were analyzed by GC-MS. The SPME fiber was a mixed polarity fiber (#57328U, Supelco, Bellefonte, PA, USA), as previously reported for the in vivo collection of citrus leaf volatiles [10,18]. This SPME fiber was chosen for its capacity to trap a broad range of volatile compounds [18]. The collection device was modified from that previously reported to allow for VOC collection from the leaf in a more natural position (Figure 5). Each leaf was placed lying flat (adaxial epidermis up) inside a clear plastic clamshell box about the size of a cassette tape holder (120 mm long × 75 mm wide × 10 mm deep) with a notch cut out at one end for the stem and a pinhole at the other end for fiber entry. After the box was closed around the leaf, it was sealed carefully with a strip of Parafilm® M. As previously reported, we collected the released volatiles at 27 °C for 2 h from the static headspace above each enclosed leaf.

4.4. GS

After the collection period, the fiber was desorbed into the GC-MS inlet for 5 min at 250 °C splitlessly, and the volatiles were separated on an Elite-5 column (30 mL × 0.25 mm I.D. × 0.25 µm film thickness, Perkin Elmer, Waltham, MA, USA) with ultrahigh purity helium as the carrier gas. The chromatographic conditions, peak area normalization, and compound identification procedures were identical to those previously reported in Killiny and Jones [18].

4.5. Statistical Analysis

Statistical analyses were performed using JMP version 9.0 (SAS Institute Inc., Cary, NC, USA). Data were normally distributed. Each treatment (a degree of photobleaching) was composed of five biological replicates. Simple linear regressions were conducted to elucidate the correlations between the detected volatiles and the degree of photobleaching in the CTV-tPDS-as plants. The two-way Hierarchical Cluster Analysis (HCA) and the heat map of released volatiles from C. macrophylla leaves with different degrees of photobleaching were generated using the means of the data matrices based on the Ward’s minimum variance method.

5. Conclusions

Volatiles were synthetized through many biosynthetic pathways in plastid, mitochondria, and cytosol and released through leaf openings such as stomata. In addition to the MEP pathway, plastid hosted many other pathways including chlorophyll, carotenoids, and shikimic acid pathways. The MEP pathway was responsible for the production of isoprene, monoterpenes, and diterpenes. Diterpenes fed to the homoterpenes and carotenoids pathways. Silencing PDS caused photobleaching phenotypes (reduction of carotenoids contents) in citrus leaves. Monoterpenes released from citrus leaves were significantly correlated with the degree of photobleaching. These findings suggested a relation between carotenoid and MEP pathways. More investigations are needed to reveal this connection.

Funding

This project was funded by the Citrus Initiative program, University of Florida.

Institutional Review Board Statement

Not applicable.

Informed Consent Statement

Not applicable.

Data Availability Statement

All data are contained within the article.

Acknowledgments

I thank our laboratory members for the helpful discussion and technical assistance. I acknowledge Lorraine Jones for maintaining the citrus plants in the greenhouse.

Conflicts of Interest

The author declares that they have no conflicts of interest.

References

  1. Hajeri, S.; Killiny, N.; El-Mohtar, C.; Dawson, W.O.; Gowda, S. Citrus tristeza virus-based RNAi in citrus plants induces gene silencing in Diaphorina citri, a phloem-sap sucking insect vector of citrus greening disease (Huanglongbing). J. Biotechnol. 2014, 176, 42–49. [Google Scholar] [CrossRef] [PubMed]
  2. Killiny, N.; Gonzalez-Blanco, P.; Gowda, S.; Martini, X.; Etxeberria, E. Plant Functional Genomics in A Few Days: Laser-Assisted Delivery of Double-Stranded RNA to Higher Plants. Plants 2021, 10, 93. [Google Scholar] [CrossRef] [PubMed]
  3. Ruiz, M.T.; Voinnet, O.; Baulcombe, D.C. Initiation and maintenance of virus-induced gene silencing. Plant Cell 1998, 10, 937–946. [Google Scholar] [CrossRef] [PubMed]
  4. Maffei, M.E. Sites of synthesis, biochemistry and functional role of plant volatiles. S. Afr. J. Bot. 2010, 76, 612–631. [Google Scholar] [CrossRef] [Green Version]
  5. DellaPenna, D.; Pogson, B.J. Vitamin synthesis in plants: Tocopherols and carotenoids. Annu. Rev. Plant Biol. 2006, 57, 711–738. [Google Scholar] [CrossRef] [PubMed] [Green Version]
  6. Bartley, G.E.; Scolnik, P.A. Plant carotenoids—Pigments for photoprotection, visual attraction, and human health. Plant Cell 1995, 7, 1027–1038. [Google Scholar] [CrossRef] [PubMed]
  7. Ratcliff, F.; Martin-Hernandez, A.M.; Baulcombe, D.C. Tobacco rattle virus as a vector for analysis of gene function by silencing. Plant J. 2001, 25, 237–245. [Google Scholar] [CrossRef] [PubMed]
  8. Killiny, N.; Nehela, Y.; Hijaz, F.; Ben-Mahmoud, S.K.; Hajeri, S.; Gowda, S. Citrus tristeza virus-based induced gene silencing of phytoene desaturase is more efficient when antisense orientation is used. Plant Biotechnol. Rep. 2019, 13, 179–192. [Google Scholar] [CrossRef]
  9. Killiny, N. Shrink the giant: Scale down the citrus tree to a model system to investigate the RNA interference efficiency. Plant Signal. Behav. 2019, 14, 1612681. [Google Scholar] [CrossRef] [PubMed]
  10. Killiny, N.; Nehela, Y.; George, J.; Rashidi, M.; Stelinski, L.L.; Lapointe, S.L. Phytoene desaturase-silenced citrus as a trap crop with multiple cues to attract Diaphorina citri, the vector of Huanglongbing. Plant Sci. 2021, 308, 110930. [Google Scholar] [CrossRef]
  11. Engelberth, J.; Alborn, H.T.; Schmelz, E.A.; Tumlinson, J.H. Airborne signals prime plants against insect herbivore attack. Proc. Natl. Acad. Sci. USA 2004, 101, 1781–1785. [Google Scholar] [CrossRef] [Green Version]
  12. Dudareva, N.; Klempien, A.; Muhlemann, J.K.; Kaplan, I. Biosynthesis, function and metabolic engineering of plant volatile organic compounds. New Phytol. 2013, 198, 16–32. [Google Scholar] [CrossRef] [PubMed]
  13. Kumagai, M.H.; Donson, J.; Dellacioppa, G.; Harvey, D.; Hanley, K.; Grill, L.K. Cytoplasmic inhibition of carotenoid biosynthesis with virus-derived RNA. Proc. Natl. Acad. Sci. USA 1995, 92, 1679–1683. [Google Scholar] [CrossRef] [PubMed] [Green Version]
  14. Romero, I.; Tikunov, Y.; Bovy, A. Virus-induced gene silencing in detached tomatoes and biochemical effects of phytoene desaturase gene silencing. J. Plant Physiol. 2011, 168, 1129–1135. [Google Scholar] [CrossRef]
  15. Zhang, X.H.; Ji, N.N.; Min, D.D.; Shu, P.; Cui, X.X.; Zhou, J.X.; Dong, L.L.; Ren, C.T.; Li, F.J.; Li, J.; et al. A co-silencing system for functional analysis of genes without visible phenotype in tomato plant development and fruit ripening using tobacco rattle virus. Sci. Hortic. 2018, 241, 100–106. [Google Scholar] [CrossRef]
  16. Agüero, J.; Vives, M.d.C.; Velázquez, K.; Pina, J.A.; Navarro, L.; Moreno, P.; Guerri, J. Effectiveness of gene silencing induced by viral vectors based on Citrus leaf blotch virus is different in Nicotiana benthamiana and citrus plants. Virology 2014, 460–461, 154–164. [Google Scholar] [CrossRef] [PubMed] [Green Version]
  17. Lewinsohn, E.; Sitrit, Y.; Bar, E.; Azulay, Y.; Meir, A.; Zamir, D.; Tadmor, Y. Carotenoid Pigmentation Affects the Volatile Composition of Tomato and Watermelon Fruits, As Revealed by Comparative Genetic Analyses. J. Agric. Food Chem. 2005, 53, 3142–3148. [Google Scholar] [CrossRef] [PubMed]
  18. Killiny, N.; Jones, S.E. Profiling of volatile organic compounds released from individual intact juvenile and mature citrus leaves. J. Plant Physiol. 2017, 208, 47–51. [Google Scholar] [CrossRef] [PubMed]
Figure 1. Silencing phytoene desaturase (PDS) causes a photobleaching phenotype in citrus plants: (A) photo showing the bleaching phenotype was not homogenous within the tree due to the unequal distribution of the Citrus tristeza virus (CTV)-tPDS-as vector. Note the different degrees of phenotype. The phenotype strength was correlated with the CTV titer (upper right corner in (A)); (B) photo showing the control plant (CTV-wt) did not show a photobleaching phenotype; (C) photo showing the mild phenotype; (D) photo showing the medium phenotype; (E) photo showing the strong phenotype.
Plants 11 00276 g001
Figure 2. Overlayed total ion chromatograms (TICs) of released volatiles from citrus leaves separated by gas chromatography-mass spectrometry (GC-MS) analysis. The green peaks indicate released leaf volatiles from the control plants (CTV-wt), while red peaks indicate released leaf volatiles from PDS-silenced plants (CTV-tPDS-as) with a strong photobleaching phenotype.
Plants 11 00276 g002
Figure 3. Principal component analysis of the VOCs released from the leaves of C. macrophylla with different degrees of photobleaching using total VOC and individual classes. For the members of each class, see Table 1.
Plants 11 00276 g003
Figure 4. Two-way hierarchical cluster analysis and heat map of the VOCs released leaves from C. macrophylla with different degrees of photobleaching. Clusters 1–6 represent groups of compounds with a similar response to the reduction of carotenoids. Rows represent compounds, while columns represent treatments (photobleaching degrees). Cells are the mean peak area of each compound (n ranges from 6 to 8).
Plants 11 00276 g004
Figure 5. Collection of the released VOCs from citrus leaves using the overhead space. Leaf was placed lying flat inside a clear plastic box with a notch cut out at one end for the stem and a pinhole at the other end for fiber entry.
Plants 11 00276 g005
Table 1. Volatile organic compounds (VOCs) from hexane-extracted leaves of C. macrophylla and their GC-MS chromatographic parameters, terpene class and biosynthetic pathway. Simple linear regression was performed using the peak areas of each compound in C. macrophylla leaf extracts with a gradient of the photobleaching (control, mild, medium, and strong) phenotype.
CompoundRTCompoundIdentifier ions (m/z)RIChemical formulaPathwayTerpene classSLR equationp-value
16.003-Hexen-1-ol a67, 82, (100)838C6H12OLOXGreen leaf volatileY = 0.6615007 + 1.5039 × 10⁻⁶ × X0.6371
27.66α-thujene a93, (136)900C10H16MEPMonoterpeneY = −1.124171 + 4.2505 × 10⁻⁸ × X0.5255
37.83α-pinene b77, (136)946C10H16MEPMonoterpeneY = 0.5354597 + 5.293 × 10⁻⁹ × X0.8134
48.74sabinene b93, (136)962C10H16MEPMonoterpeneY = −2.043718 + 6.3962 × 10⁻⁸ × X0.0239
59.12β-myrcene b77, (136)989C10H16MEPMonoterpeneY = 5.4066127 − 5.6089× 10⁻⁹ × X0.0151
69.40octanal b56, 84, (128)1008C8H16OLOXAliphatic aldehydeY = 9.7890063 − 1.1892 × 10⁻⁷ × X0.1339
79.58δ-carene b93, (136)1009C10H16MEPMonoterpeneY = −1.024644 + 4.9396 × 10⁻⁸ × X0.0046
89.78α-terpinene b121, (136)1018C10H16MEPMonoterpeneY = 1.6879193 − 3.3425 × 10⁻⁹ × X0.9665
99.95para-cymene b119, (134)1026C10H14MEPMonoterpeneY = −0.309639 + 9.4336 × 10⁻⁹ × X0.0256
1010.08d-limonene b68, (136)1038C10H16MEPMonoterpeneY = −5.256629 + 1.2465 × 10⁻⁹ × X0.0296
1110.42trans-β-ocimene b107, (136)1055C10H16MEPMonoterpeneY = 5.4322736 − 6.2774 × 10⁻⁹ × X0.0303
1210.72γ-terpinene b93, 121, (136)1071C10H16MEPMonoterpeneY = 1.6124691 − 7.942 × 10⁻¹¹ × X0.9824
1310.99trans-sabinene hydrate a93, (154)1081C10H18OMEPMonoterpeneY = 0.9934156 + 4.3591 × 10⁻⁸ × X0.5838
1411.34α-terpinolene b93, (136)1101C10H16MEPMonoterpeneY = 5.3820149 − 3.3693 × 10⁻⁸ × X0.0450
1511.62linalool b71, 80, (154)1114C10H18OMEPMonoterpene alcoholY = 5.8499642 − 1.2174 × 10⁻⁸ × X0.1903
1611.92DMNT b135, (150)1131C11H18MVAHomoterpeneY = 1.3459995 + 8.853 × 10⁻¹⁰ × X0.9179
1712.25α-ocimene a93, (136)1152C10H16MEPMonoterpeneY = 2.0591518 − 1.3416 × 10⁻⁸ × X0.8609
1812.75citronellal b69, (154)1178C10H18OMEPMonoterpene aldehydeY = 2.8260106 − 9.765 × 10⁻¹⁰ × X0.6888
1913.44isogeranial a81, (152)1211C10H16OMEPMonoterpene aldehydeY = −1.524911 + 6.9897 × 10⁻⁸ × X0.7376
2013.55Terpin-4-ol b71, 111, (154)1225C10H18OMEPMonoterpene alcoholY = 3.0069503 − 1.3479 × 10⁻⁷ × X0.7797
2113.71methyl salicylate b120, (152)1228C8H8O3ShikimateBenzenoidY = 5.6708351 − 1.4192 × 10⁻⁷ × X0.0363
2213.82α-terpineol b59, (136)1233C10H18OMEPMonoterpene aldehydeY = 0.5691447 + 1.0031 × 10⁻⁷ × X0.2207
2314.31nerol b69, (154)1264C10H18OMEPMonoterpene alcoholY = 4.1787856 − 1.3466 × 10⁻⁷ × X0.0885
2414.35citronellol b69, (156)1267C10H20OMEPMonoterpene alcoholY = −2.214841 + 8.4327 × 10⁻⁸ × X0.0467
2514.42cis-carveol b109, (152)1275C10H16OMEPMonoterpene alcoholY = 0.6619045 + 4.0657 × 10⁻⁸ × X0.6612
2614.56neral b69, (152)1280C10H16OMEPMonoterpene aldehydeY = 4.2283559 − 3.3036 × 10⁻⁹ × X0.1167
2714.86geraniol b69, (154)1292C10H18OMEPMonoterpene alcoholY = 2.1508954 − 2.2447 × 10⁻⁸ × X0.4888
2815.16geranial b69, (152)1308C10H16OMEPMonoterpene aldehydeY = 4.2872926 − 2.9944 × 10⁻⁹ × X0.1342
2916.56δ-elemene a121, (204)1360C15H24MVASesquiterpeneY = 3.5948159 − 1.1139 × 10⁻⁸ × X0.0405
3016.75terpenyl acetate b121, 136, (181)1366C12H20O2MEPMonoterpene EsterY = 4.5742907 − 1.2065 × 10⁻⁷ × X0.1008
3116.91neryl acetate b69, (196)1373C12H20O2MEPMonoterpene EsterY = 0.6446098 + 8.1427 × 10⁻⁸ × X0.5523
3217.30geranyl acetate b69, (196)1378C12H20O2MEPMonoterpene EsterY = 3.2687338 − 3.1068 × 10⁻⁸ × X0.5486
3317.59β-elemene b93, (189)1384C15H24MVASesquiterpeneY = 3.7802501 − 3.4001 × 10⁻⁸ × X0.1234
3418.22trans-β-caryophyllene b133, (204)1461C15H24MVASesquiterpeneY = 4.7685504 − 2.6421 × 10⁻⁹ × X0.0789
3518.35aromadendrene a161, (204)1476C15H24MVASesquiterpeneY = 4.4307055 − 2.1659 × 10⁻⁸ × X0.1442
3618.40cis-α-bergamotene a119, (204)1482C15H24MVASesquiterpeneY = 4.4877318 − 8.7324 × 10⁻⁹ × X0.1192
3718.77trans-β-farnesene b93, (204)1505C15H24MVASesquiterpeneY = 1.9219621 − 4.4732 × 10⁻⁸ × X0.8137
3818.85α-humulene b93, (204)1511C15H24MVASesquiterpeneY = 4.0697399 − 2.3463 × 10⁻⁸ × X0.0814
3919.30β-cubebene a161, (204)1526C15H24MVASesquiterpeneY = 3.184197 − 1.9774 × 10⁻⁸ × X0.1491
4019.55valencene b189, (204)1535C15H24MVASesquiterpeneY = 3.2005192 − 1.1617 × 10⁻⁸ × X0.1518
4119.69β-bisabolene b93, (204)1541C15H24MVASesquiterpeneY = 4.3461062 − 3.8601 × 10⁻⁸ × X0.0665
4219.91δ-cadinene a93, (204)1549C15H24MVASesquiterpeneY = 4.5764693 − 1.2446 × 10⁻⁷ × X0.0784
4320.44α-elemol a59, 93, (204)1563C15H26OMVASesquiterpene alcoholY = −2.631255 + 1.2806 × 10⁻⁶ × X0.5189
4421.07caryophyllene oxide b79, 93, (220)1589C15H24OMVASesquiterpenoidY = 4.5729864 − 3.0942 × 10⁻⁷ × X0.5161
4521.89methyl jasmonate b84, 151, (224)1665C13H20O3LOXJasmonatesY = 1.8891837 − 1.0704 × 10⁻⁷ × X0.9031
4622.69β-farnesol b69, (222)1725C15H26OMVASesquiterpene alcoholY = 0.5641273 + 5.0138 × 10⁻⁷ × X0.9155
4723.19α-farnesol b69, (222)1740C15H26OMVASesquiterpene alcoholY = 1.5524536 − 1.7063 × 10⁻⁷ × X0.9731
a Tentatively identified by an linear retention index (LRI) and a library matching score of >700. b Compound confirmed by an authentic reference standard. Bold p-values indicate significance (p < 0.05). RT: retention time; RI: retention index.
Publisher’s Note: MDPI stays neutral with regard to jurisdictional claims in published maps and institutional affiliations.

