Abstract
A field experiment was carried out with 20 genotypes of Transplant Aman (T. Aman) rice at the Department of Genetics and Plant Breeding, Bangabandhu Sheikh Mujibur Rahman Agricultural University, Salna, Gazipur-1706, Bangladesh. The study was performed to evaluate the genetic deviation, trait association, and path coefficient (PC) based on grain yield (GY) and different yield-contributing agronomic characters. Variance analysis displayed extensive traits-wise variations across accessions, indicating variability and the opportunity for genetic selection for desirable traits. The high mean, range, and genotypic variances observed for most of the characters indicated a wide range of variation for these traits. All the characters indicated the minimum influence of environment on the expression of the trait and genetic factors had a significant role in the expressivity of these characters. High heritability in broad sense (h2b) and high to moderate genetic advance in percent of the mean (GAPM) were recorded for all the characters except for panicle length (PL). Based on mean, range, and all genetic parameters, the selection of all the traits except for PL would contribute to the development of T. Aman rice genotypes. A correlation study revealed that selection based on plant height (PH), number of effective tillers per hill (NET), PL, number of filled spikelets per panicle (NFS), flag leaf length (FLL), spikelet sterility (SS) percentage, and harvest index (HI) would be effective for increasing the GY of rice. Genotypic correction with grain yield (GCGY), PC and principal component analysis (PCA) revealed that direct selection of NFS, HI, SS%, and FLL would be effective for improving the GY of rice in future breeding programs.
1. Introduction
Rice (Oryza sativa L.) is the most dynamic main food for one-third of the world’s people, and rice production in Asia accounts for nearly 90% of the total output [1]. The production of rice, the oldest and the greatest significant crop, contributes not only to the provision of food security but also to the generation of money and job opportunities [2]. Worldwide, the rice cultured area surpasses 16.2 crore ha and total produce of 75.5 crore tons [3]. Bangladesh has long been known as the world’s fourth biggest rice producer, after only India, Indonesia, and China. The rice culture occupies 75% of all agricultural land in the country and employs 48% of the nation’s farm laborers. It contributes 70% of the agricultural gross domestic product (GDP), while its proportion of national revenue is 1/6 [4]. Roughly 11 million hectares are dedicated to rice farming, a number that has remained almost unchanged for more than the last three decades and which produces approximately 3.4 crore tons [4]. Rice is still the dominant source of energy, fiber, minerals, and protein in the Asian diet. Of the entire daily calorie intake, >1/2 of the dietary calories and a lion’s share of protein come from it. The use of variation in genotypic level for improving rice production potential is a critical way to feed over 9 billion people by 2050 and adapt to climate change.
In Bangladesh, rice is planted year-round, with three separate growing seasons: Boro, Aman, and Aus. It is cultivated in four ecosystems, viz., irrigated rice (Boro), rainfed or partially irrigated (transplanted Aus and Aman), rainfed upland (direct-seeded Aus), and deep-water (broadcast Aman) [5]. Considering total production, Aman is the country’s second-largest crop after Boro rice. Broadcast Aman is planted in lowlands from mid-March until mid-April, then transplanted in July and August. Approximately 46 lacs ha of rain-fed Aman rice plantations in Bangladesh provide >50% of the country’s total rice output [6]. In certain agro-ecological situations, T. Aman becomes the major crop, promoting the large-scale growth of T. Aman rice.
Genetic richness in any germplasm is vital for any crop improvement effort since it is the key to integrating favorable alleles and bringing about desired modifications [7,8]. Breeding and agricultural development require a thorough understanding of current genetic diversity [9,10]. Inborn deviation among traits is central to bringing and selecting anticipated types [11,12]. For increasing grain output via breeding, it is important to recognize the species’ variability, the nature of character associations, and the involvement of various traits [13,14]. The growing demand for rice necessitates the development of outstanding genotypes that can thrive in an assortment of environments [15,16]. Grain yield (GY) is a multifaceted attribute that is impacted by an arrangement of genes, the environment in which they develop, and the degree and types of diversity in genotypes [17]. In addition, GY is directly or indirectly interrelated with other agronomic traits such as plant stature, growth spell, panicle length (PL), tiller per plant, loaded grains per panicle, and primary and secondary branches per panicle [18,19]. The primary focus of plant breeders concentrates on picking desirable features in the blend, granting each an economic gain based on GY to generate a preference index [20].
Despite GY having a low genetic inheritance, it is possible to improve yields via many yield-related component attributes [21]. Selecting traits only based on heredity may result in a bad option, while combining genetic advancement and heritability may be more advantageous [22]. Knowing the association of yield and related causal variables is essential for most efforts to discover plant selection guidelines [23,24]. Furthermore, GY and associated characteristics may also be partitioned into direct and indirect impacts to find which characteristics are most responsible for increasing seed yield [25]. Therefore, it is crucial to link component qualities to yield and to each other. Research on rice GY and various component properties has been investigated phenotypically in a vast number of studies [18,26]. There is a positive significant association of GY with days to maturity, grains per panicle, days to 50% flowering (DFF), number of effective tillers per hill (NET), PL, number of filled spikelets per panicle (NFS), and spikelet fertility (SS) [17,18,27].
Path coefficient (PC) analysis subdivides the genetic link of GY with its paying traits into direct and indirect PCs, revealing useful features as standards for selection to boost the GY of rice [1,7]. It evaluates the reason for the link of two variables based on simple correlations among characters and linearity and additively. It may be used to determine each character’s contribution to the total yield. The current research studied genetic diversity, heritability, genetic advance, association, and contribution of attributes to GY, and PC analysis is specifically chosen genotypes to provide selection criteria for high-yielding rice varieties [8,25].
Therefore, the present study was undertaken to study the variability among T. Aman rice genotypes, determine the relative contributions of each character towards yield and their inter-relationships, and find out the direct and indirect PCs of component traits towards GY.
2. Results
2.1. Genetic Variability
There were substantial deviations in the accessions for all traits (Table 1). The extent of variation in GY and the related agronomic variables that contribute to GY were examined and the mean value, range, genotypic variance (σ2g), phenotypic variance (σ2p), environmental variance (σ2e), genotypic coefficient of variation (GCV), phenotypic coefficient of variation (PCV), heritability in broad sense (h2b), genetic advance (GA), and genetic advance in percent of the mean (GAPM) are shown in Table 2. An extensive genetic deviation was recorded for DFF among the genotypes, which suggested a considerable variation for this character (Table 1). DFF varied from 95 to 113 days (Table 2). Phenotypic variance (σ2p) for DFF (26.39) was slightly superior to the σ2g (25.98). As revealed by the characteristic, the trait’s expressivity was significantly impacted by genetic rather than environmental variables. PCV (4.87) was close to the GCV (4.83), suggesting a minimal environmental effect on the manifestation of the trait. The estimate of h2b for this variable was high (98.46), while the GA (10.42) and GAPM (9.87) were moderate, indicating that apparent variation was owing to genotypes.

Table 1.
Analysis of variance (mean sum of squares) for yield and its component characters in 20 T. Aman rice genotypes.
Table 2.
Estimation of genetic parameters for yield and its component characters in 20 genotypes of T. Aman rice.
ANOVA for plant height (PH) showed a highly noteworthy genotypic mean sum of squares (Table 1). These differences exposed a large spectrum of variability for PH across genotypes. PH ranged from 111.20 to 177.00 cm, with a mean of 137.75 cm (Table 2). The σ2p (371.63) was only marginally superior to σ2g (368.90) for this trait, indicating a minimal environmental effect on the expressivity of the genes regulating the characteristic. The deviation of PCV (13.99) and GCV (13.94) was minimum (Table 2) for PH. PH exhibited a high h2b (99.26) connected to high GA (39.42) and GAPM (28.62), indicating that apparent variation was attributed to genotype.
NET ranged from 6.50 to 10.20. The σ2p (0.84) was a little bit higher than σ2g (0.78) and PCV (10.96) was close to the GCV (10.61) (Table 2). Thus, the trait had low contextual influence, but genetics played a significant influence on NET expressivity. The GA was low (1.77), but h2b of NET was high (93.77) along with GAPM (21.16). Noteworthy variations in flag leaf length (FLL) were found among the tested genotypes (Table 1). The genotypes showed a large matrix of variation from 25.04 to 40.41 cm (Table 2). σ2p (19.28) was the closest to σ2g (19.24). The deviation of PCV (13.68) and GCV (13.67) showed a less environmental influence on FLL (Table 2). The inheritance of FLL was high (99.83), with a high GAPM (28.14). However, GA was low (9.03). PL ranged from 22.35 to 28.90 cm, with a mean of 26.43 cm (Table 2). There was a visible deviation in σ2p (1.48) and σ2g (0.84) and PCV (4.61) and the GCV (3.48), indicating a considerable environmental influence on the manifestation of the PL (Table 2). PL showed high h2b (82.93) but very low GA (1.43) and GAPM (5.42).
The number of primary branches per panicle (PBP) showed low σ2p (1.09) and σ2g (0.82) and moderate h2b (75.25) and low GA (1.62), indicating a considerable environmental influence on PBP (Table 2). However, the number of secondary branches per panicle (SBP) had high h2b (89.14) was high with low GA (9.35) with higher GAPM (26.52). The NFS ranged from 76 to 162, with a mean of 129.58. σ2p (502.57) was superior to σ2g (482.64) and had close disparities between PCV (17.30) and GCV (16.95), with high h2b (96.03) revealing NFS has a sturdy genetic regulator. Like NFS, the genetic parameters of SS percentage also indicate a strong genetic control among the selected lines.
The 1000-grain weight (TGW) ranged from 21.95 to 31.42 g, with a mean of 27.10 g. σ2p (8.37), σ2g (8.33), and the deviation of PCV (10.67) and GCV (10.65) indicate the least environmental influence on the character expression (Table 2). h2b of TGW was very high (99.49), with a significant GAPM (21.88). There is a large deviation in harvest index (HI) among the genotypes (28.24 to 37.88). σ2p of HI (8.56) was very close to σ2g (8.49). In addition to h2b (99.19), PCV (9.02), GCV (8.98), and GAPM showed that HI had more genetic control than the environment. The genotypes differ significantly for GY. GY ranged from 4.55 tons to 8.18 tons, with a mean of 6.61 tons (Table 2). GCV (13.60), PCV (14.39), and h2b (89.40) showed that the environment has less influence on the GY of selected rice genotypes.
2.2. Character Association
DFF had insignificant positive correlation (IPC) with NET (0.018, 0.016), SS (0.048, 0.048), and TGW (0.187, 0.187), respectively at both genotypic and phenotypic (G and P) level (Table 3 and Table 4). DFF and TGW proved a positive connection, indicating that late-flowering cultivars yielded panicles with higher weights. Inversely, DFF had an insignificant negative correlation (NC) with PH, FLL, PL, PBP, SBP, NFS, HI, and GY per hectare at both levels. PH showed significant positive correlation (SPC) with FLL (r = 0.719, 0.718), PL (r = 0.730, 0.644), HI (r = 0.498, 0.497), and GY (r = 0.587, 0.580) at G and P levels, respectively, suggesting that yield might be augmented by raising PH. Plant stature showed an IPC with NET, SBP, NFS, and TGW. Alternatively, this variable exhibited an NC with PBP (r = −0.066, −0.062) and SS (r = −0.293, −0.092) at the G and P levels, respectively.
Table 3.
The genotypic correlation coefficient among 12 characters in 20 genotypes of T. Aman rice.
Table 4.
The phenotypic correlation coefficient among 12 characters in 20 genotypes of T. Aman rice.
NET was found to parade a SPC with NFS (r = 0.621, 0.617), HI (r = 0.505, 0.501), and GY (r = 0.656, 0.635) at both the G and P levels, respectively. Therefore, yield could be enhanced by augmenting NET. SS showed a negative and noteworthy interrelation (r = −0.447, −0.440) with NET at both levels, which indicated an increase in NET resulted in a decrease in the SS percentage. The correlation between NET and the rest of the characters was insignificant. The FLL a showed an SPC with PL (r = 0.723, 0.647) and GY (r = 0.472, 0.463) at the G and P levels, respectively, indicating that PL and GY could be increased by improving this trait. However, the NC between FLL and SS (%) was insignificant but considerable. The results indicated that an increase in FLL decreased the SS percentage (Table 3 and Table 4). The association of this trait with PBP, SBP, NFS, and HI was insignificant in the positive direction.
PL had a SPC with NFS (r = 0.451), at a phenotypic level, but with HI (r = 0.529, 0.476) and GY (r = 0.576, 0.492), both at the G and P levels. This result specifies that GY was increased with the increase of PL and HI. SS showed a negative and significant genotypic relationship (r = −0.455) with PL, which indicated that an increase in PL decreased the SS percentage. The association of this trait with PBP, SBP, and TGW was insignificant in a positive direction.
PBP showed an insignificant NC with TGW, HI, and GY both at the G and P levels. This result indicates that PBP increases and decreases the GY, along with HI, and TGW. PBP showed an IPC with SBP, NFS, and SS percentages. The negative association between GY and PBP indicated that the assortment based on this appeal would not be concrete for bumping GY. In contrast, the SBP showed a significant positive connection with NFS (r = 0.548, 0.538) at both G and P levels, indicating that NFS could be increased by improving SBP. SBP showed an insignificant relationship in a positive direction with HI and GY. Even though this positive relationship was small but still important, the results showed that HI and GY could be raised by raising SBP.
NFS displayed a highly momentous positive link with GY (r = 0.488, 0.485) and HI (r = 0.611, 0.595), both at the G and P levels, respectively, indicating that GY increased with the increase of NFS and HI. SS (r = −0.625, −0.620) and TGW (r = −0.627, −0.623) correlated negatively with NFS at both levels, indicating that they adversely reacted to this character. The SS exhibited a very significant NC with GY (r = −0.646, −0.634) and negative and insignificant interrelation with HI (r = −0.349, −0.348) at both G and P levels, respectively, indicating that increasing SS lowered HI and GY. The trend of association between TGW and GY and HI was positive but trivial both at G and P levels. Therefore, TGW had little influence on GY for the genotype studied. The association between HI (r = 0.866, 0.845) and GY was extremely positive both at the G and P levels, showing HI might boost grain production.
2.3. PC Analysis
Path analysis was utilized to discover the link between GY and other yield-donating traits, allowing for a deeper understanding of the interaction. In the current inquest, GY per hectare was measured as a resultant (dependent) variable and DFF, PH, NET, FLL, PL, PBP, SBP, NFS, SS (%), TGW, and HI were causal (independent) variables. Using the genotypic PC analysis, the indirect and direct PCs (bold phase) of eleven causative factors on GY have been illustrated in Table 5.
Table 5.
Partitioning of genotypic correlation with GY into direct (bold) and indirect PCs in 20 genotypes of T. Aman rice.
DFF displayed direct PC in a positive direction (0.018) on GY (Table 5). While the indirect PC was found to be negative via FLL (−0.015), NFS (−0.103), SS (−0.011), and HI (−0.101). Indirect PCs were positive for PL (0.007), PBP (0.013), SBP (0.019), and TGW (0.049), which were almost negligible in magnitude. As a result, the overall correlation (−0.125) between GY and other features turned negative. Consequently, increasing rice GY could not be achieved by selecting DFF. Despite the direct PC in a negative direction of PH (−0.011) on GY, FLL (0.110), TGW (0.106), and HI (0.237) had strong indirect PCs in a positive direction, consequentially a statistically SPC with GY (0.587) (Table 5). However, the positive PCs through DFF (0.004), NET (0.006), PBP (0.015), and SS (0.061) were minimal. The indirect PC is balanced out by several other factors, which makes the overall association of GY and PH (0.587) positive.
The NET had a negligible direct PC in a positive direction (0.015) on GY. The indirect PC in a positive direction via NFS (0.334) and HI (0.238) on GY were sizable, triggering a high SPC (0.656). The positive impacts of PH (0.003), FLL (0.040), PBP (0.035), and SS (0.091) were trifling. The indirect PCs were negative for PL (−0.004), SBP (−0.046), and TGW (−0.056), which were almost negligible in magnitude. Therefore, improving grain production may be accomplished either by directly selecting NET or indirectly selecting through NFS. The FLL bore a direct PC and positive (0.150) on GY. It did not have much of a PC on PH (−0.008), PL (−0.019), PBP (−0.007), or SBP (−0.030). The indirect impact via DFF (0.001), NET (0.005), NFS (0.062), SS (0.046), TGW (0.070), and HI (0.202) on GY was positive, which caused the overall positive correlation (0.472) between FLL and GY.
PL had a trivial adverse direct PC (−0.021) on GY. The indirect PCs of this trait on yield via NFS (0.196) and HI (0.208) were positive and considerable, making the total SPC (0.576). Whereas the positive PCs via DFF (0.014), PH (0.011), NET (0.021), FLL (0.098), and SS (0.086) were marginal. The PBP (−0.014) and SBP (−0.041) had a negative and practically insignificant stimulus on GY. As a result, there was an SPC between PL and GY (0.576).
PBP and SBP had a direct negative (−0.209 and −0.209) impact on GY, respectively. The indirect PC of PBP on yield via FLL (0.004) and NFS (0.137) was positive but almost negligible in magnitude. PBP showed indirect PCs in negative direction through DFF (−0.004), PH (−0.002), NET (−0.004), PL (−0.009), SBP (−0.036), SS (−0.005), TGW (−0.056), and HI (−0.117). As a consequence, the total correlation (−0.303) was negative with GY. The indirect PCs of SBP on yield via DFF (0.003), PH (0.004), NET (0.007), FLL (0.029), NFS (0.284), and HI (0.204) were positive. Indirect PCs in negative direction were lean via PL (−0.007), PBP (−0.028), SS (−0.007), and TGW (−0.0722). The interrelation between SBP and GY was positive but small (0.216), hence direct selection for SBP will not boost GY.
NFS showed the highest positive direct PC (0.542) on yield (Table 5, and Figure 1). A considerable indirect PC in a positive direction via HI (0.232), causing a total correlation significantly positive (0.611), whereas the PCs in positive direction via DFF (0.001), PH (0.002), NET (0.010), FLL (0.021) and SS (0.125) were low. The indirect PCs of NFS on GY via PL (−0.009), PBP (−0.049), SBP (−0.103), and TGW (−0.161) were negative and almost negligible in magnitude. As a result, improving GY by simply relying on this NFS is a possibility. The SS showed a direct PC in a negative direction (−0.200) on GY. The indirect PCs of PH, PL, and TGW in a positive direction were smaller than the indirect PCs in a negative direction via DFF, NET, FLL, PBP, SBP, NFS, and HI, resulting in the overall correlation being negative and very significant (−0.646). Therefore, direct selection based on SS could be effective for increasing GY. The TGW had a positive direct impact on GY (0.268) and a positive indirect impact on GY through DFF (0.004), FLL (0.037), PBP (0.042), SBP (0.061), and HI (0.015). Indirect negative impacts through PH (−0.005), NET (−0.002), NFS (−0.333), and SS (−0.082) reduced the overall association (0.004). The result revealed that direct selection of TGW would have little influence on GY. HI showed a direct PC in a positive direction (0.479) on GY (Figure 1). The indirect PC of HI on GY via NFS (0.263) was positive, resulting in the total correlation being highly SPC (0.866). Thus, selection directly based on this character would be achievable for increasing GY.
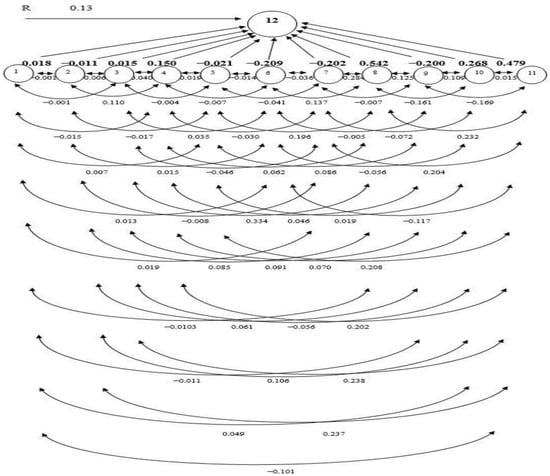
Figure 1.
The path coefficient (PC) diagram representing cause and effect relationships among quantitative traits and grain yield. (1. days to 50% flowering; 2. plant height; 3. number of effective tillers per hill; 4. flag leaf length; 5. panicle length; 6. number of primary branches per panicle; 7. number of secondary branches per panicle; 8. number of filled spikelets per panicle, 9. spikelet sterility, 10. 1000-grain weight; 11. harvest index; 12. Grain yield (t/ha); R—residual effect).
2.4. Principal Component Analysis (PCA)
The biplots also visualized the position of the 20 accessions and illustrated the correlations among traits of this study (Figure 2). Principal component analysis (PCA) of yield and yield-contributing traits of 20 genotypes generated 12 PC, and the first two components together explained more than 50 percent of the total variation (Figure 2 and Supplementary Table S2). PC1 contributed 37.5% of the total variation, which was mainly represented by the variation in PH, NET, FLL, PL, and HI. However, SS is the only major contributing trait that was negatively associated with GY. PC2 accounted for 18.8% of the variation and represents mostly the variation in PH, FLL, and TGW. The PCA revealed that the NFS, GY, FLL, PH, and HI were closely associated and were the main contributors in PC1.
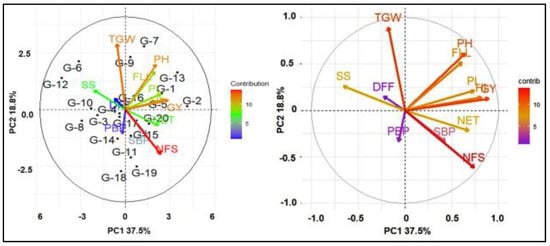
Figure 2.
Biplot based on PCA shows the relationship of secondary traits with grain yield. DFF—days to 50% flowering; PH—plant height; NET—number of effective tillers per hill; FLL—flag leaf length; PL—panicle length; PBP—number of primary branches per panicle; SBP—number of secondary branches per panicle; NFS—number of filled spikelets per panicle; SS—spikelet sterility; TGW—1000-grain weight; HI—harvest index; GY—grain yield.
3. Discussion
The GY is a complicated product impacted by many interdependent quantitative factors. Therefore, it is probable that unless other factors affecting yield are taken into account, selection for yield may not be effective [1]. The improvement of one character that is closely linked to yield has a knock-on effect on several other closely connected characteristics [1]. In other words, the plant breeder has a blueprint for selection if they understand how other traits impact yield and how they interact. Using this information, plant breeders can better understand how genetic and non-genetic components interact [28].
Success in crop breeding schemes is largely determined by genetic diversity and the transmission of desired characteristics. Exploring the genetic diversity of a species with the intervention of plant breeders may result in the improvement of commercially desired qualities [1]. An indispensable trait is yield, which emerges from the multiplicative interactions of several contributing factors [29]. To provide food security for the anticipated expanding population, breeders have boosted the production capacity of all key crops. To address these complex relationships, we must create high-yield varieties by introgression traits from existing genotypes with high trait values. In the current study, the genotypes disclosed highly significant variation for all the traits (Table 1). To investigate the genetic diversity of any genetic resources, G and P variations, coefficient of variation as well as its h2b, GA, were frequently exploited [29,30]. The mean and range for all the traits studied specified the presence of gigantic variability for the GY and its allied traits, which provides more opportunity to utilize these traits for the further rice improvement program. The amount of heterogeneity in germplasm might be influenced by σ2g and σ2p of traits [30].
All studied genotypes displayed significant deviations across traits which specified a large array of variability among the traits. Similar deviations were also displayed in morphological traits [31,32,33,34,35], and other yield-contributing traits of different crops [20,36,37]. The selection of genotypes based on σ2p may be deceptive owing to environmental impacts. Hence, splitting the σ2p into genotypic and environmental effects is crucial [38]. NFS, PH, SS, DFF, SBP, and FLL had higher σ2g, suggesting that these characteristics had more variability and, thus, a wider window of opportunity for selection [1]. The σ2p was somewhat greater than the σ2g, showing that the phenotypic manifestation of these features was influenced by the environment to some extent. There have been several studies in the past that documented environmental impacts on yield-contributing characteristics of rice [27,38,39]. The differences between σ2p and σ2g were very small for DFF, NET, FLL, SS, and TGW, indicating additive gene action for these traits. This observation is consistent with the previous research findings [40] that reported minimal differences between σ2p and σ2g for PH, NFS, SS, and HI.
High PCV and GCV values suggest that there is a great amount of genetic diversity, whereas traits with low PCV and GCV values illustrate a low level of diversity [1,8]. The presence of considerable variation implies the prospect of successful selection for character enrichment. Environmental influences may be seen in the lower GCV and higher PCV values. In the present research, SS had the greatest GCV and PCV, followed by NFS, PH, FLL, SBP, and GY. This suggests that GY might be improved by using these features as a selection criterion. The result is in line with the previous research that reported that the GY of rice could be improved through the selection of these traits [1,7]. A considerably lower GCV and PCV were found for PL, PBP, and DFF, indicating that selection would not be effective based on these traits. This result was comparable with the previously reported results [1]. Heritability in the broad sense was classified as high (>60%), moderate (40–60%), and low (40%) [41]. Among the 12 traits studied, 11 exhibited high heritability, except PL which displayed moderate heritability indicating higher possibility of selection for the improvement of rice. The levels of GA were ranked as low, moderate, and high, with corresponding ranges of 10%, 10–20%, and >20%, respectively [42]. High h2b coupled with high GA of a trait is crucial for the selection of a trait in any breeding program. In the present study, high h2b coupled with high GAPM was reported for PL, NET, FLL, SBP, NFS, SS, TGW, and GY, suggesting the additive gene action for the traits, so selection based on these traits could be contributed largely for the improvement of rice. Previous literature reported high heritability with high genetic advance in percent of the mean for different yield-related traits [1]. PBP had high h2b with moderate GAPM (13.30), indicating the equal influence of additive and non-additive gene action in the manifestation of the traits. Similar results were reported by several researchers on rice [1]. The calculated variability, h2b, and GAPM among the genotypes tested indicate that there is plenty of room for selection to improve rice GY.
The selection of desirable phenotypes based only on yield may not be realistic due to the sensitivity of quantitative traits to environmental impact [43]. In addition to h2b and GA, to boost yield genetically, selection should be based on the correlation coefficient analysis of GY and its component characters [1,14]. For achieving the highest yield potential, all quantitative factors that influence yield must be considered [1]. The association between GY and yield-related characteristics facilitates the identification of traits that, via indirect selection, may boost seed yield [1]. The prime economic trait, GY, showed significant positive G and P correlation at (p ≤ 0.01) with HI, NFS, PH, PL, NET, and FLL. A similar finding was reported by other researchers [1,7,27]. Pratap et al. [39] reported that GY had a strong positive association with SS, filled grains panicle−1, NET, PH, and TGW in rice. Fentie et al. [3] found an SPC between GY with NFS, HI, PL, FLL, and PH. Li et al. [2] reported a positive, significant correlation that persisted between GY and field grain per panicle, TGW, PH, and PL. In the present study, DFF, PBP, and SS were negatively correlated with GY. However, a significant negative phenotypic and genotypic correlation was found between GY and SS. The NC of these variables with GY makes concurrent selection profitable implying that, GY would be high with a low SS percentage. The result was consistent with the previous studies, which reported an NC between DFF, NPB, and SS of rice [1,18,44].
PC analysis offers a realistic assessment of the direct and indirect stimulus of each trait linked with the other traits [43]. PC analysis has been used to assess selection criteria in a vast array of species. Using path analysis, the G and P correlation coefficients were further segmented into direct and indirect impacts through substitute features or pathways. The principles of such analysis create inklings to the encounters of important component traits useful in the indirect selection of multifaceted traits such as yield [1]. In the present study, based on stepwise selection methods of regression, 11 traits were selected as causal variables for GY. GY was considered as a resultant variable and DFF, PH, NET, PL, PBP, SBP, SS, TGW, and HI were causal (independent) variables. PC analysis of the genotypic correlations revealed that NFS had the highest positive direct PC on GY, followed by HI, and TGW. GY also had a direct PC in a positive direction on DFF, NET, and FLL. The positive relationship between NET, FLL, and GY emphasizes the need to directly select these attributes to boost rice seed production. The results were similar to the results of Takele et al. [45] who revealed that HI and DFF had a direct PC in a positive direction on GY. Hasan-Ud-Daula and Sarkar [1] reported that NFS had a direct PC in a positive direction on the GY of rice [1]. Roy et al. [46] reported that there was a significant direct PC in a positive direction of TGW and HI on the GY of T. Aman rice. PBP, SBP, SS, PH, and PL had a direct negative impact on GY. These results are consistent with results reported by Hasan-Ud-Daula and Sarkar [1], who found a direct PC in a negative direction of SS, SBP, and PH on GY. In addition to the direct and indirect PCs of HI, NFS also had a positive correlation with GY. These results are in accordance with the findings of other research that reported HI, and NFS had a considerable indirect PC in a positive direction on GY [47]. Therefore, selection focused on these traits would be gratifying for the GY enhancement of rice. The residual (0.13) indicates that the traits included in the genotypic path analysis can explain 87% of the total variation of GY. The least residual effect (0.13) of the genotypic path for GY indicated that all the important characters were included in the present study. The principal component analysis reflects that NFS, TGW, FLL, and HI were the main contributing traits for yield. According to the findings of this study, traits with a direct PC in a positive direction and a positive and extensive assembly with GY should be given special consideration in the selection process. The residual effect was 0.13 indicating that 87% of the variability was explained by the 12 characters studied. There were other contributors (13%) which were responsible for yield but were not taken into consideration in the present investigation.
4. Materials and Methods
4.1. Experimental Location and Source of Germplasm
The research was carried out on the Bangabandhu Sheikh Mujibur Rahman Agricultural University’s (BSMRAU) experimental farm between the years 2015 and 2016. Investigations were conducted out in the Madhupur Tract (AEZ28, about 24°23′ N–90°08′ E, with a mean elevation of 8.4 m above the mean sea level [1]. A typical rice-growing lowland with a soil pH of 6.5 was used in the experiment. The test area’s particular rainfall pattern makes it an ideal place for T. Aman rice cultivation, with a rainy summer and a mainly dry winter. The soil exhibited low levels of organic matter (0.87 percent), total N (0.09 percent), and exchangeable K (0.13 cmol/kg) [1]. A total of twenty T. Aman rice genotypes from the central seed gene bank of BSMRAU were employed in the experiments. These advanced lines were developed by hybridizing between local and modern inbred lines or cultivars of T. Aman rice. The rice genotypes are presented in Table S1.
4.2. Experimental Layout and Observation Recording
The experiment was conducted using a Randomized Complete Block Design (RCBD) with three replications. A single genotype was planted in a 5.0 m × 1.0 m plot. A seedling at 30 days of age [48] was shifted per hill, with a 20 cm × 20 cm space between rows and plants. Each genotype consists of 5 rows with 25 hills per row, for a total of 125 hills per replication. To keep the soil fertility in the experimental units at the optimal level for rice cultivation in Bangladesh, additional chemical fertilizers including urea, tripolyphosphate, muriate of potash (KCl), and gypsum (CaSO4·2H2O) were sprayed at rates of 220-120-90-60 kg/ha, respectively [1]. Three applications of total urea were administered at 15, 30, and 45 days after transplantation. During the growing season, all the important intercultural operation (gap filling, weeding at regular intervals, insecticide application, top dressing of fertilizers, etc.) was done to help the plants grow and develop healthily. Statistical information was gathered from ten indiscriminately chosen hills for each genotype under each replication from the middle two rows to avoid border effects. Data were collected based on DFF, PH (cm), NET, TGW (g), FLL (cm), PL (cm), (PBP), (%) (SS), (SBP), NSP, NFS, HI, and GY (t/ha).
4.3. Statistical Analysis
Every character was subjected to an analysis of variance (ANOVA) using the PROC GLM model in SAS version 9.2 for Windows. Through the use of SPSS, estimates were made for the mean, range, and standard deviation of each characteristic. The mean sum of squares (MS) of error and σ2p were estimated following Johnson et al. [42]. The square root of the error mean was used to get the error variance (σ2e). The G and P components of variance (σ2g and σ2p), respectively, phenotypic and genotypic coefficients of variation (PCV, GCV) [49], broad-sense heritability (h2b) [50], genetic advance (GA) [42], and genetic advance as percent of the mean (GA%) [51] were estimated by adapting the formulae suggested by the researchers were mentioned in the table (Table 6). Correlation coefficients were further partitioned into components of direct and indirect effects by PC analysis [52]. PCA was conducted by factoextra package in R version 4.3.1.
Table 6.
A list of the formula used to estimate different parameters studied in the experiment.
5. Conclusions
The σ2p and PCV were slightly higher than the corresponding σ2g and GCV for all the characters indicating the minimum influence of the environment on the expression of the trait and genetic factors had a significant role in the expressivity of these characters. Except for PL, all the characters showed high to moderate mean and range, moderate PCV, GCV, high h2b, and high to moderate GAPM indicating selection of these characters could significantly contribute to improving the yield potential of rice. These results revealed that superior genotypes could be used as preferable cultivars and moderate yielder genotypes could be used as parent materials in future hybridization programs for the development of new cultivars because of the presence of high heritability and GAPM. The genotypic coefficient of correlation was generally a little bit higher than the corresponding phenotypic coefficient of correlation which indicated that the apparent association might be due to genetic reasons. SS (%) showed a direct PC in a negative direction. As an NC was desirable for SS (%), direct selection through these characters would be effective for improving the GY of rice. Although GCGY for PH, NET, PL, NFS, FLL, SS (%), and HI were significant but considering three analyses, such as GCGY, PC and PCA revealed that direct selection of NFS, SS (%), FLL, and HI would be effective for improving the GY of rice. The residual effect was 0.13 indicating that 87% of the variability was explained by the 12 characters studied. Therefore, the present study suggested that NFS, SS (%), FLL, and HI which are the main components of the yield of these genotypes should be given high priority in selection for future breeding programs.
Supplementary Materials
The following supporting information can be downloaded at: https://www.mdpi.com/article/10.3390/plants11212952/s1, Table S1: List of rice genotypes with their ancestry, biological status, and source of collection; Table S2: Principal component (PC) coefficients of all traits.
Author Contributions
Conceptualization, U.S.; methodology, U.S. and A.S.M.F.; software, U.S.; validation, U.S., L.A. and M.G.A.; formal analysis, A.S.M.F.; investigation, A.S.M.F.; resources, U.S.; data curation, A.S.M.F.; writing—original draft preparation, A.S.M.F., L.A. and U.S.; writing—review and editing, U.S., L.A., M.G.A., S.E., K.S.G. and R.A.M.; visualization, U.S.; supervision, U.S. All authors have read and agreed to the published version of the manuscript.
Funding
The current work was funded by the Department of Genetics and Plant Breeding, the Bangabandhu Sheikh Mujibur Rahman Agricultural University, Gazipur 1706, Bangladesh.
Institutional Review Board Statement
Not applicable.
Informed Consent Statement
Not applicable.
Data Availability Statement
All data generated or analyzed during this study are included in this published article.
Acknowledgments
The authors acknowledge the Department of Genetics and Plant Breeding, the Bangabandhu Sheikh Mujibur Rahman Agricultural University, Gazipur 1706, Bangladesh.
Conflicts of Interest
The authors declare no conflict of interest.
References
- Hasan-Ud-Daula, M.; Sarker, U. Variability, Heritability, Character Association, and Path Coefficient Analysis in Advanced Breeding Lines of Rice (Oryza sativa L.). Genetika 2020, 52, 711–726. [Google Scholar] [CrossRef]
- Li, R.; Li, M.; Ashraf, U.; Liu, S.; Zhang, J.J. Exploring the Relationships between Yield and Yield-related Traits for Rice Varieties Released in China from 1978 to 2017. Front. Plant Sci. 2019, 10, 543. [Google Scholar] [CrossRef] [PubMed]
- Fentie, D.B.; Abera, B.B.; Ali, H.M. Association of Agronomic Traits with Grain Yield of Lowland Rice (Oryza sativa L.) Genotypes. Int. J. Agric. Sci. 2021, 8, 161–175. [Google Scholar]
- Rabbany, M.G.; Mehmood, Y.; Hoque, F.; Sarkar, T.; Hossain, K.Z.; Khan, A.A.; Hossain, M.S.; Roy, R.; Luo, J. Do credit constraints affect the technical efficiency of Boro rice growers? Evidence from the District Pabna in Bangladesh. Environ. Sci. Pollut. Res. 2022, 29, 444–456. [Google Scholar] [CrossRef]
- Shelley, I.J.; Takahashi-Nosaka, M.; Kano-Nakata, M.; Haque, M.S.; Inukai, Y. Rice cultivation in Bangladesh: Present scenario, problems, and prospects. J. Int. Coop. Agric. Dev. 2016, 14, 20–29. [Google Scholar] [CrossRef]
- Ghose, B.; Islam, A.R.M.; Islam, H.; Hasanuzzaman, M.; Huang, J.; Hu, Z.; Moniruzzaman, M.; Gustave, W.; Karim, M.; Ibrahim, S.M. Rain-fed rice yield fluctuation to climatic anomalies in Bangladesh. Int. J. Plant Prod. 2021, 15, 183–201. [Google Scholar] [CrossRef]
- Hasan, M.J.; Kulsum, M.U.; Majumder, R.R.; Sarker, U. Genotypic Variability for Grain Quality Attributes in Restorer Lines of Hybrid Rice. Genetika 2020, 52, 973–989. [Google Scholar] [CrossRef]
- Sharma, S.; Schulthess, A.W.; Bassi, F.M.; Badaeva, E.D.; Neumann, K.; Graner, A.; Özkan, H.; Werner, P.; Knüpffer, H.; Kilian, B. Introducing beneficial alleles from plant genetic resources into the wheat germplasm. Biology 2021, 10, 982. [Google Scholar] [CrossRef]
- Pandey, J.; Scheuring, D.C.; Koym, J.W.; Coombs, J.; Novy, R.G.; Thompson, A.L.; Holm, D.G.; Douches, D.S.; Miller, J.C.; Vales, M.I. Genetic diversity and population structure of advanced clones selected over forty years by a potato breeding program in the USA. Sci. Rep. 2021, 11, 1–18. [Google Scholar] [CrossRef]
- Verma, S.; Yashveer, S.; Rehman, S.; Gyawali, S.; Kumar, Y.; Chao, S.; Sarker, A.; Verma, R.P.S. Genetic and Agro-morphological diversity in global barley (Hordeum vulgare L.) collection at ICARDA. Genet. Resour. Crop Evol. 2021, 68, 1315–1330. [Google Scholar] [CrossRef]
- Khan, M.K.; Pandey, A.; Hamurcu, M.; Hakki, E.E.; Gezgin, S. Role of molecular approaches in improving genetic variability of micronutrients and their utilization in breeding programs. In Wheat and Barley Grain Biofortification; Elsevier: Amsterdam, The Netherlands, 2020; pp. 27–52. [Google Scholar] [CrossRef]
- Sarker, U.; Mian, M.A.K. Genetic Variations and Correlations between Floral Traits in Rice. Bangladesh J. Agril. Res 2004, 29, 553–558. [Google Scholar]
- Yadav, A.K.; Kumar, A.; Grover, N.; Ellur, R.K.; Bollinedi, H.; Krishnan, S.G.; Bhowmick, P.K.; Vinod, K.K.; Nagarajan, M.; Singh, A.K. Genome-Wide Association Study Reveals Marker–Trait Associations for Early Vegetative Stage Salinity Tolerance in Rice. Plants 2021, 10, 559. [Google Scholar] [CrossRef] [PubMed]
- Ketema, W.; Geleta, N. Studies on Genetic Variability of Common Bean Varieties for Yield and Yield Related Traits in Western Ethiopia. Int. J. Appl. Agric. 2022, 8, 41. [Google Scholar] [CrossRef]
- Sarker, U.; Biswas, P.S.; Prasad, B.; Mian, M.A.K. Correlated Response, Relative Selection Efficiency and Path Analysis in Cold Tolerant Rice. Bangladesh J. Pl. Breed. Genet. 2001, 14, 33–36. [Google Scholar]
- Thant, A.A.; Zaw, H.; Kalousova, M.; Singh, R.K.; Lojka, B. Genetic Diversity and Population Structure of Myanmar Rice (Oryza sativa L.) Varieties Using DArTseq-Based SNP and SilicoDArT Markers. Plants 2021, 10, 2564. [Google Scholar] [CrossRef]
- Sarker, U.; Mian, M.A.K. Genetic Variability, Character Association and Path Analysis for Yield and Its Components in Rice. J. Asiat. Soc. Bangladesh Sci. 2003, 29, 47–54. [Google Scholar]
- Asante, M.D.; Adjah, K.L.; Annan-Afful, E. Assessment of genetic diversity for grain yield and yield component traits in some genotypes of rice (Oryza sativa L.). J. Crop. Sci. Biotechnol. 2019, 22, 123–130. [Google Scholar] [CrossRef]
- Beena, R.; Veena, V.; Jaslam, M.; Nithya, N.; Adarsh, V.S. Germplasm innovation for high-temperature tolerance from traditional rice accessions of Kerala using genetic variability, genetic advance, path coefficient analysis and principal component analysis. J. Crop. Sci. Biotechnol. 2021, 24, 555–566. [Google Scholar] [CrossRef]
- Saroj, R.; Soumya, S.L.; Singh, S.; Sankar, S.M.; Chaudhary, R. Unraveling the Relationship Between Seed Yield and Yield-Related Traits in a Diversity Panel of Brassica juncea Using Multi-Traits Mixed Model. Front. Plant Sci. 2021, 12, 651936. [Google Scholar] [CrossRef]
- Atlin, G. Improving drought tolerance by selecting for yield. In Breeding Rice for Drought-Prone Environments; International Rice Research Institute: Los Baños, Philippines, 2003; p. 14. [Google Scholar]
- Rahman, M.H.; Sarker, U.; Main, M.A.K. Assessment of Variability of Floral and Yield Traits; I Restorer Lines of Rice. Ann. Bangladesh Agric. 2007, 11, 87–94. [Google Scholar]
- Aman, J.; Bantte, K.; Alamerew, S.; Sbhatu, D.B. Correlation and path coefficient analysis of yield and yield components of quality protein maize (Zea mays L.) hybrids at Jimma, western Ethiopia. Int. J. Agron. 2020, 2020, 9651537. [Google Scholar] [CrossRef]
- Singh, M.; Avtar, R.; Kumar, N.; Punia, R.; Pal, A.; Lakra, N.; Kumari, N.; Kumar, D.; Naruka, A.; Bishnoi, M.; et al. Genetic Analysis for Resistance to Sclerotinia Stem Rot, Yield and Its Component Traits in Indian Mustard [Brassica juncea (L.) Czern & Coss.]. Plants 2022, 11, 671. [Google Scholar] [CrossRef] [PubMed]
- Kumar, A.; Pandey, A.; Aochen, C.; Pattanayak, A. Evaluation of Genetic Diversity and Interrelationships of Agro-Morphological Characters in Soybean (Glycine max) Genotypes. Proc. Natl. Acad. Sci. India Sect. B Biol. Sci. 2015, 85, 397–405. [Google Scholar] [CrossRef]
- Rahman, M.M.; Sarker, U.; Swapan, M.A.H.; Raihan, M.S.; Oba, S.; Alamri, S.; Siddiqui, M.H. Combining Ability Analysis and Marker-Based Prediction of Heterosis in Yield Reveal Prominent Heterotic Combinations from Diallel Population of Rice. Agronomy 2022, 12, 1797. [Google Scholar] [CrossRef]
- Ganapati, R.K.; Rasul, M.G.; Mian, M.A.K.; Sarker, U. Genetic Variability and Character Association of T-Aman Rice (Oryza sativa L.). Int. J. Plant Biol. Res. 2014, 2, 1–4. [Google Scholar]
- Dewey, D.R.; Lu, K. A correlation and path coefficient analysis of components of crested wheatgrass seed production 1. J. Agron. 1959, 51, 515–518. [Google Scholar] [CrossRef]
- Baraki, F.; Gebregergis, Z.; Belay, Y.; Berhe, M.; Teame, G.; Hassen, M.; Gebremedhin, Z.; Abadi, A.; Negash, W.; Atsbeha, A.J.H. Multivariate analysis for yield and yield-related traits of sesame (Sesamum indicum L.) genotypes. Heliyon 2020, 6, e05295. [Google Scholar] [CrossRef]
- Shilpashree, N.; Devi, S.N.; Manjunathagowda, D.C.; Muddappa, A.; Abdelmohsen, S.A.; Tamam, N.; Elansary, H.O.; El-Abedin, T.K.Z.; Abdelbacki, A.M.; Janhavi, V. Morphological characterization, variability and diversity among vegetable soybean (Glycine max L.) genotypes. Plants 2021, 10, 671. [Google Scholar] [CrossRef]
- Khan, F.; Naaz, S.; Singh, N.; Shukla, P.K.; Tripathi, R.; Yadav, H.K.; Shirke, P.A. Molecular, physiological and agronomic assessment of genetic diversity in rice varieties in relation to drought treatment. Curr. Plant Biol. 2022, 29, 100232. [Google Scholar] [CrossRef]
- Gharib, M.; Qabil, N.; Salem, A.; Ali, M.; Awaad, H.; Mansour, E. Characterization of wheat landraces and commercial cultivars based on morpho-phenological and agronomic traits. Cereal Res. Commun. 2021, 49, 149–159. [Google Scholar] [CrossRef]
- Kishor, D.S.; Seo, J.; Chin, J.H.; Koh, H.-J. Evaluation of Whole-Genome Sequence, Genetic Diversity, and Agronomic Traits of Basmati Rice (Oryza sativa L.). Front. Genet. 2020, 11, 86. [Google Scholar] [CrossRef] [PubMed]
- Lee, J.-H.; Seo, J.; Lar, S.M.; Jang, S.-G.; Zhang, H.; Lee, A.-R.; Cao, F.Y.; Kim, N.E.; Lee, J.; Kwon, S.W. QTL Analysis of Rice Grain Size Using Segregating Populations Derived from the Large Grain Line. Agriculture 2021, 11, 565. [Google Scholar] [CrossRef]
- Fongfon, S.; Pusadee, T.; Prom-u-thai, C.; Rerkasem, B.; Jamjod, S. Diversity of Purple Rice (Oryza sativa L.) Landraces in Northern Thailand. Agronomy 2021, 11, 2029. [Google Scholar] [CrossRef]
- Azam, M.G.; Sarker, U.; Hossain, M.A.; Iqbal, M.S.; Islam, M.R.; Hossain, M.F.; Ercisli, S.; Kul, R.; Assouguem, A.; AL-Huqail, A.A.; et al. Genetic Analysis in Grain Legumes [Vigna radiata (L.) Wilczek] for Yield Improvement and Identifying Heterotic Hybrids. Plants 2022, 11, 1774. [Google Scholar] [CrossRef] [PubMed]
- Lei, Q.-Y.; Zhou, J.-J.; Xiong, Y.; Zhang, W.-H.; Luo, J.; Long, C.-L. Genetic Diversity Evaluation and Conservation of Kam Fragrant Glutinous Rice (Oryza sativa L.) Germplasm in Southeast Guizhou, China. Plants 2021, 10, 1898. [Google Scholar] [CrossRef] [PubMed]
- Zaid, I.U.; Zahra, N.; Habib, M.; Naeem, M.K.; Asghar, U.; Uzair, M.; Latif, A.; Rehman, A.; Ali, G.M.; Khan, M.R. Estimation of Genetic Variances and Stability Components of Yield-Related Traits of Green Super Rice at Multi-Environmental Conditions in Pakistan. Agronomy 2022, 12, 1157. [Google Scholar] [CrossRef]
- Pratap, A.; Bisen, P.; Loitongbam, B.; Singh, P.K. Assessment of genetic variability for yield and yield components in rice (Oryza sativa L.) germplasms. Int. J. Bio-Resour. Stress Manag. 2018, 9, 87–92. [Google Scholar] [CrossRef]
- Dhurai, S.; Bhati, P.; Saroj, S.K. Studies on genetic variability for yield and quality characters in rice (Oryza sativa L.) under integrated fertilizer management. Bioscan 2014, 9, 745–748. [Google Scholar]
- Robinson, H.F.; Comstock, R.E.; Harvey, V.H. Estimates of heritability and degree of dominance in corn. Agron. J. 1949, 41, 353–359. [Google Scholar] [CrossRef]
- Johnson, H.W.; Robinson, H.; Comstock, R.E. Estimates of genetic and environmental variability in soybeans 1. J. Agron. 1955, 47, 314–318. [Google Scholar] [CrossRef]
- Li, M.; Liu, Y.; Wang, C.; Yang, X.; Li, D.; Zhang, X.; Xu, C.; Zhang, Y.; Li, W.; Zhao, L. Identification of traits contributing to high and stable yields in different soybean varieties across three Chinese latitudes. Front. Plant Sci. 2020, 10, 1642. [Google Scholar] [CrossRef]
- Azad, A.K.; Sarker, U.; Ercisli, S.; Assouguem, A.; Ullah, R.; Almeer, R.; Sayed, A.A.; Peluso, I. Evaluation of Combining Ability and Heterosis of Popular Restorer and Male Sterile Lines for the Development of Superior Rice Hybrids. Agronomy 2022, 12, 965. [Google Scholar] [CrossRef]
- Takele, E.; Mekbib, F.; Mekonnen, F. Genetic variability and characters association for yield, yield attributing traits and protein content of lentil (Lens Culinaris Medikus) genotype in Ethiopia. CABI Agric. Biosci. 2022, 3, 1–14. [Google Scholar] [CrossRef]
- Kulsum, U.; Sarker, U.; Rasul, M.G. Genetic variability, heritability and interrelationship in salt-tolerant lines of T. Aman rice. Genetika 2022, 54, 761–776. [Google Scholar] [CrossRef]
- Immanuel, S.C.; Pothiraj, N.; Thiyagarajan, K.; Bharathi, M.; Rabindran, R. Genetic parameters of variability, correlation and path coefficient studies for grain yield and other yield attributes among rice blast disease-resistant genotypes of rice (Oryza sativa L.). Afr. J. Biotechnol. 2011, 10, 3322–3334. [Google Scholar] [CrossRef]
- Hasan, M.J.; Kulsum, M.U.; Sarker, U.; Matin, M.Q.I.; Shahin, N.H.; Kabir, M.S.; Ercisli, S.; Marc, R.A. Assessment of GGE, AMMI, Regression, and Its Deviation Model to Identify Stable Rice Hybrids in Bangladesh. Plants 2022, 11, 2336. [Google Scholar] [CrossRef]
- Burton, G.W. Quantitative inheritance in grasses. In Proceedings of the 6th International Grassland Congress, State College, PA, USA, 17–23 August 1952; pp. 277–283. [Google Scholar]
- Hanson, C.; Robinson, H.; Comstock, R.E. Biometrical studies of yield in segregating populations of Korean lespedeza 1. J. Agron. 1956, 48, 268–272. [Google Scholar] [CrossRef]
- Comstock, R.; Robinson, H. Genetic parameters, their estimation and significance. In Proceedings of the 6th International Grassland Congress, State College, PA, USA, 17–23 August 1952; pp. 248–291. [Google Scholar]
- Wright, S. The theory of path coefficients a reply to Niles’s criticism. Genetics 1923, 8, 239. [Google Scholar] [CrossRef]


Publisher’s Note: MDPI stays neutral with regard to jurisdictional claims in published maps and institutional affiliations. |
© 2022 by the authors. Licensee MDPI, Basel, Switzerland. This article is an open access article distributed under the terms and conditions of the Creative Commons Attribution (CC BY) license (https://creativecommons.org/licenses/by/4.0/).