Article

Novel Insights into the Nature of Intraspecific Genome Size Diversity in Cannabis sativa L.

1
Institut Botànic de Barcelona (IBB, CSIC-Ajuntament de Barcelona), Passeig del Migdia s.n., 08038 Barcelona, Catalonia, Spain
2
Royal Botanic Gardens, Kew, Kew Green, Richmond TW9 3AE, UK
3
Laboratori de Botànica (UB), Unitat Associada al CSIC, Facultat de Farmàcia i Ciències de l’Alimentació–Institut de Recerca de la Biodiversitat (IRBio), Universitat de Barcelona, Av. Joan XXIII 27–31, 08028 Barcelona, Catalonia, Spain
*
Author to whom correspondence should be addressed.
These authors contributed equally to this work.
Plants 2022, 11(20), 2736; https://doi.org/10.3390/plants11202736
Submission received: 31 August 2022 / Revised: 8 October 2022 / Accepted: 11 October 2022 / Published: 16 October 2022
(This article belongs to the Special Issue Trends and Prospects of Genetic and Molecular Research in Plant)

Abstract

:
Cannabis sativa has been used for millennia in traditional medicine for ritual purposes and for the production of food and fibres, thus, providing important and versatile services to humans. The species, which currently has a worldwide distribution, strikes out for displaying a huge morphological and chemical diversity. Differences in Cannabis genome size have also been found, suggesting it could be a useful character to differentiate between accessions. We used flow cytometry to investigate the extent of genome size diversity across 483 individuals belonging to 84 accessions, with a wide range of wild/feral, landrace, and cultivated accessions. We also carried out sex determination using the MADC2 marker and investigated the potential of flow cytometry as a method for early sex determination. All individuals were diploid, with genome sizes ranging from 1.810 up to 2.152 pg/2C (1.189-fold variation), apart from a triploid, with 2.884 pg/2C. Our results suggest that the geographical expansion of Cannabis and its domestication had little impact on its overall genome size. We found significant differences between the genome size of male and female individuals. Unfortunately, differences were, however, too small to be discriminated using flow cytometry through the direct processing of combined male and female individuals.

1. Introduction

Cannabis sativa L. (hereafter referred to as Cannabis) is one of the most versatile plants used by humans over millennia. Despite being mostly known for its psychoactive use, Cannabis has played an important role in everyday life for hundreds of years. For example, it was extensively used in traditional medicine and became an important source of fibre and food [1]. However, as a consequence of its illegal status, the use of Cannabis was abandoned in many parts of the world. Nonetheless, in recent years, the cannabis industry has experienced a rising interest beyond its recreational uses, including more sustainable options in textile, automotive, construction, food, and cosmetic applications [1,2,3,4].
The genus most likely originated in the NE Tibetan Plateau more than 25 Mya [5,6], from where it is thought to have spread to North and West Asia and Europe, before continuing to expand eastwards and southwards [5]. Genetic and archaeological evidence suggests that the domestication of Cannabis took place approximately 12,000 years ago in East Asia. It was used as a multipurpose crop until c. 4000 years ago, when separate selections for fibre and drug production started [7]. Since then, large-scale cultivation as a crop has enabled its spread around the world, and today, Cannabis has a worldwide distribution [8,9].
The wealth of different applications through centuries resulted in the development of a wide range of cultivars, varieties, and strains adapted to different climates with high morphological and phytochemical diversity [10]. Depending on the cultivation purpose, morphology, and chemical composition, domesticated Cannabis can be separated into fibre-type (namely hemp; <0.3% Δ9-tetrahydrocannabinol (THC)) or drug-type (marijuana and medicinal Cannabis; >0.3% THC) plants [11]. Within the drug-type plants, different chemotypes are recognised based on their chemical profiles, which are mainly underpinned by the differences in THC/CBD (cannabidiol) ratios. Recently, other secondary metabolites (such as terpenoids and flavonoids) have also gained an important role [12,13,14]. The morphological and chemical diversity of Cannabis has hampered its taxonomic resolution, leading to different taxonomic treatments over the years (see McPartland and Small [15] for a detailed review). Currently, it is considered a monotypic genus, with C. sativa as the only accepted species. However, according to a recent evolutionary study based on whole-genome resequencing, fibre-type and drug-type cultivars constitute distinct genetic lineages that diverged from an ancestral gene pool, currently represented by wild or naturalised plants in Central and East Asia, which could have taxonomic implications [7].
Genome size (or C-value) is defined as the amount of DNA in the holoploid genome of an individual [16], and is considered to be relatively constant within a species [17]. Despite reports of intraspecific genome size variation having long been treated with caution, the advent of high-resolution techniques for genome size estimation, such as flow cytometry, has provided strong evidence of intraspecific variability in several taxonomic groups. In general, such variation has been attributed to, e.g., hybridisation and/or polyploidisation events [18,19], B-chromosomes [20], heteromorphic sex chromosomes [21,22], changes in non-coding repetitive DNA [23], presence/absence of specific DNA sequences [24], and illegitimate recombination [25]. In addition to that, intraspecific genome size variation has also been related to extrinsic and/or abiotic factors such as altitude [26,27,28,29,30], latitude [24,31,32,33], and temperature [31], and to different phenological and morphological characters [27,34].
Cannabis is an annual, wind-pollinated, dioecious plant, although some monoecious cultivars also exist [35]. The diploid genome generally presents 20 chromosomes, 18 autosomal chromosomes and one pair of sex chromosomes. Female and monoecious plants have two X chromosomes (XX), while male plants have heteromorphic X and Y (XY) chromosomes [36,37]. Multiple studies investigating genetic [7,38,39,40], morphological [41,42,43], and phytochemical diversity [12,44,45,46,47] in Cannabis have been published, however, only five of them included genome size measurements [37,48,49,50,51]. Most of these studies were carried out on cultivars and centred on either detecting polyploids, or differences in genome size between individuals of different sexes. Certainly, only the study by Lee et al. [50] focused on intraspecific genome size variation in Cannabis. These authors detected differences between accessions of different origins, suggesting that genome size could be used as a character to discriminate among accessions. Despite this, intraspecific variability in the genomic content of Cannabis has continued to receive little attention. With regard to ploidy levels, natural polyploidisation in Cannabis has only been reported once so far, in a wild tetraploid population from India [52]. Small [53] analysed over 200 accessions and found all of them to consistently be diploids (2n = 20). However, artificial polyploids can be induced under laboratory conditions (e.g., chemical treatments), and indeed, triploid, tetraploid, and mixoploid Cannabis plants have been produced in plant breeding programs [11,51,54,55,56,57].
Many efforts have been made to develop tools to discriminate between male and female Cannabis individuals, some of them involving genome size. Although the exact mechanism underpinning sex determination in the species is not yet fully comprehended [8,58], it is thought to be determined by an XY chromosome pair [36,49,59] or by the X to autosome ratio [37,60]. Since the Y chromosome is slightly longer than the X chromosome, male individuals are expected to present a larger genome size. This was corroborated by studies that have found a difference between sexes of ∆ = c. 0.05 pg/2C [37,49] or even up to ∆ = 0.15 pg/2C [50]. Early sex determination is usually carried out using male-associated DNA markers [61,62,63,64,65,66,67], but the accuracy and reproducibility of some of them have been questioned [67,68]. Based on the above, there is no doubt that developing a method of sex detection through flow cytometry, as previously suggested [50], would be of great interest. However, the reliability and limitations of the method are still to be evaluated for Cannabis.
The worldwide distribution of Cannabis, its large morphological and phytochemical variability, the existence of heteromorphic sex chromosomes, and the fact that the plant has been a target for selection by humans, could be reflected (to some extent) at the genome size level. So far, most of the studies have focused on a few different (either fibre or drug) Cannabis cultivars, but very rarely wild accessions were included. Here, we gathered a large number of wild/feral, landrace and cultivar Cannabis accessions, covering a wide distribution area in order to (i) evaluate the extent of genome size and ploidy level diversity in the species; (ii) investigate how this diversity distributes across accessions, geographical ranges, and sexes; and (iii) test whether flow cytometry can be used as a standard tool to distinguish between male and female Cannabis individuals in both wild/feral and cultivated accessions.

2. Results and Discussion

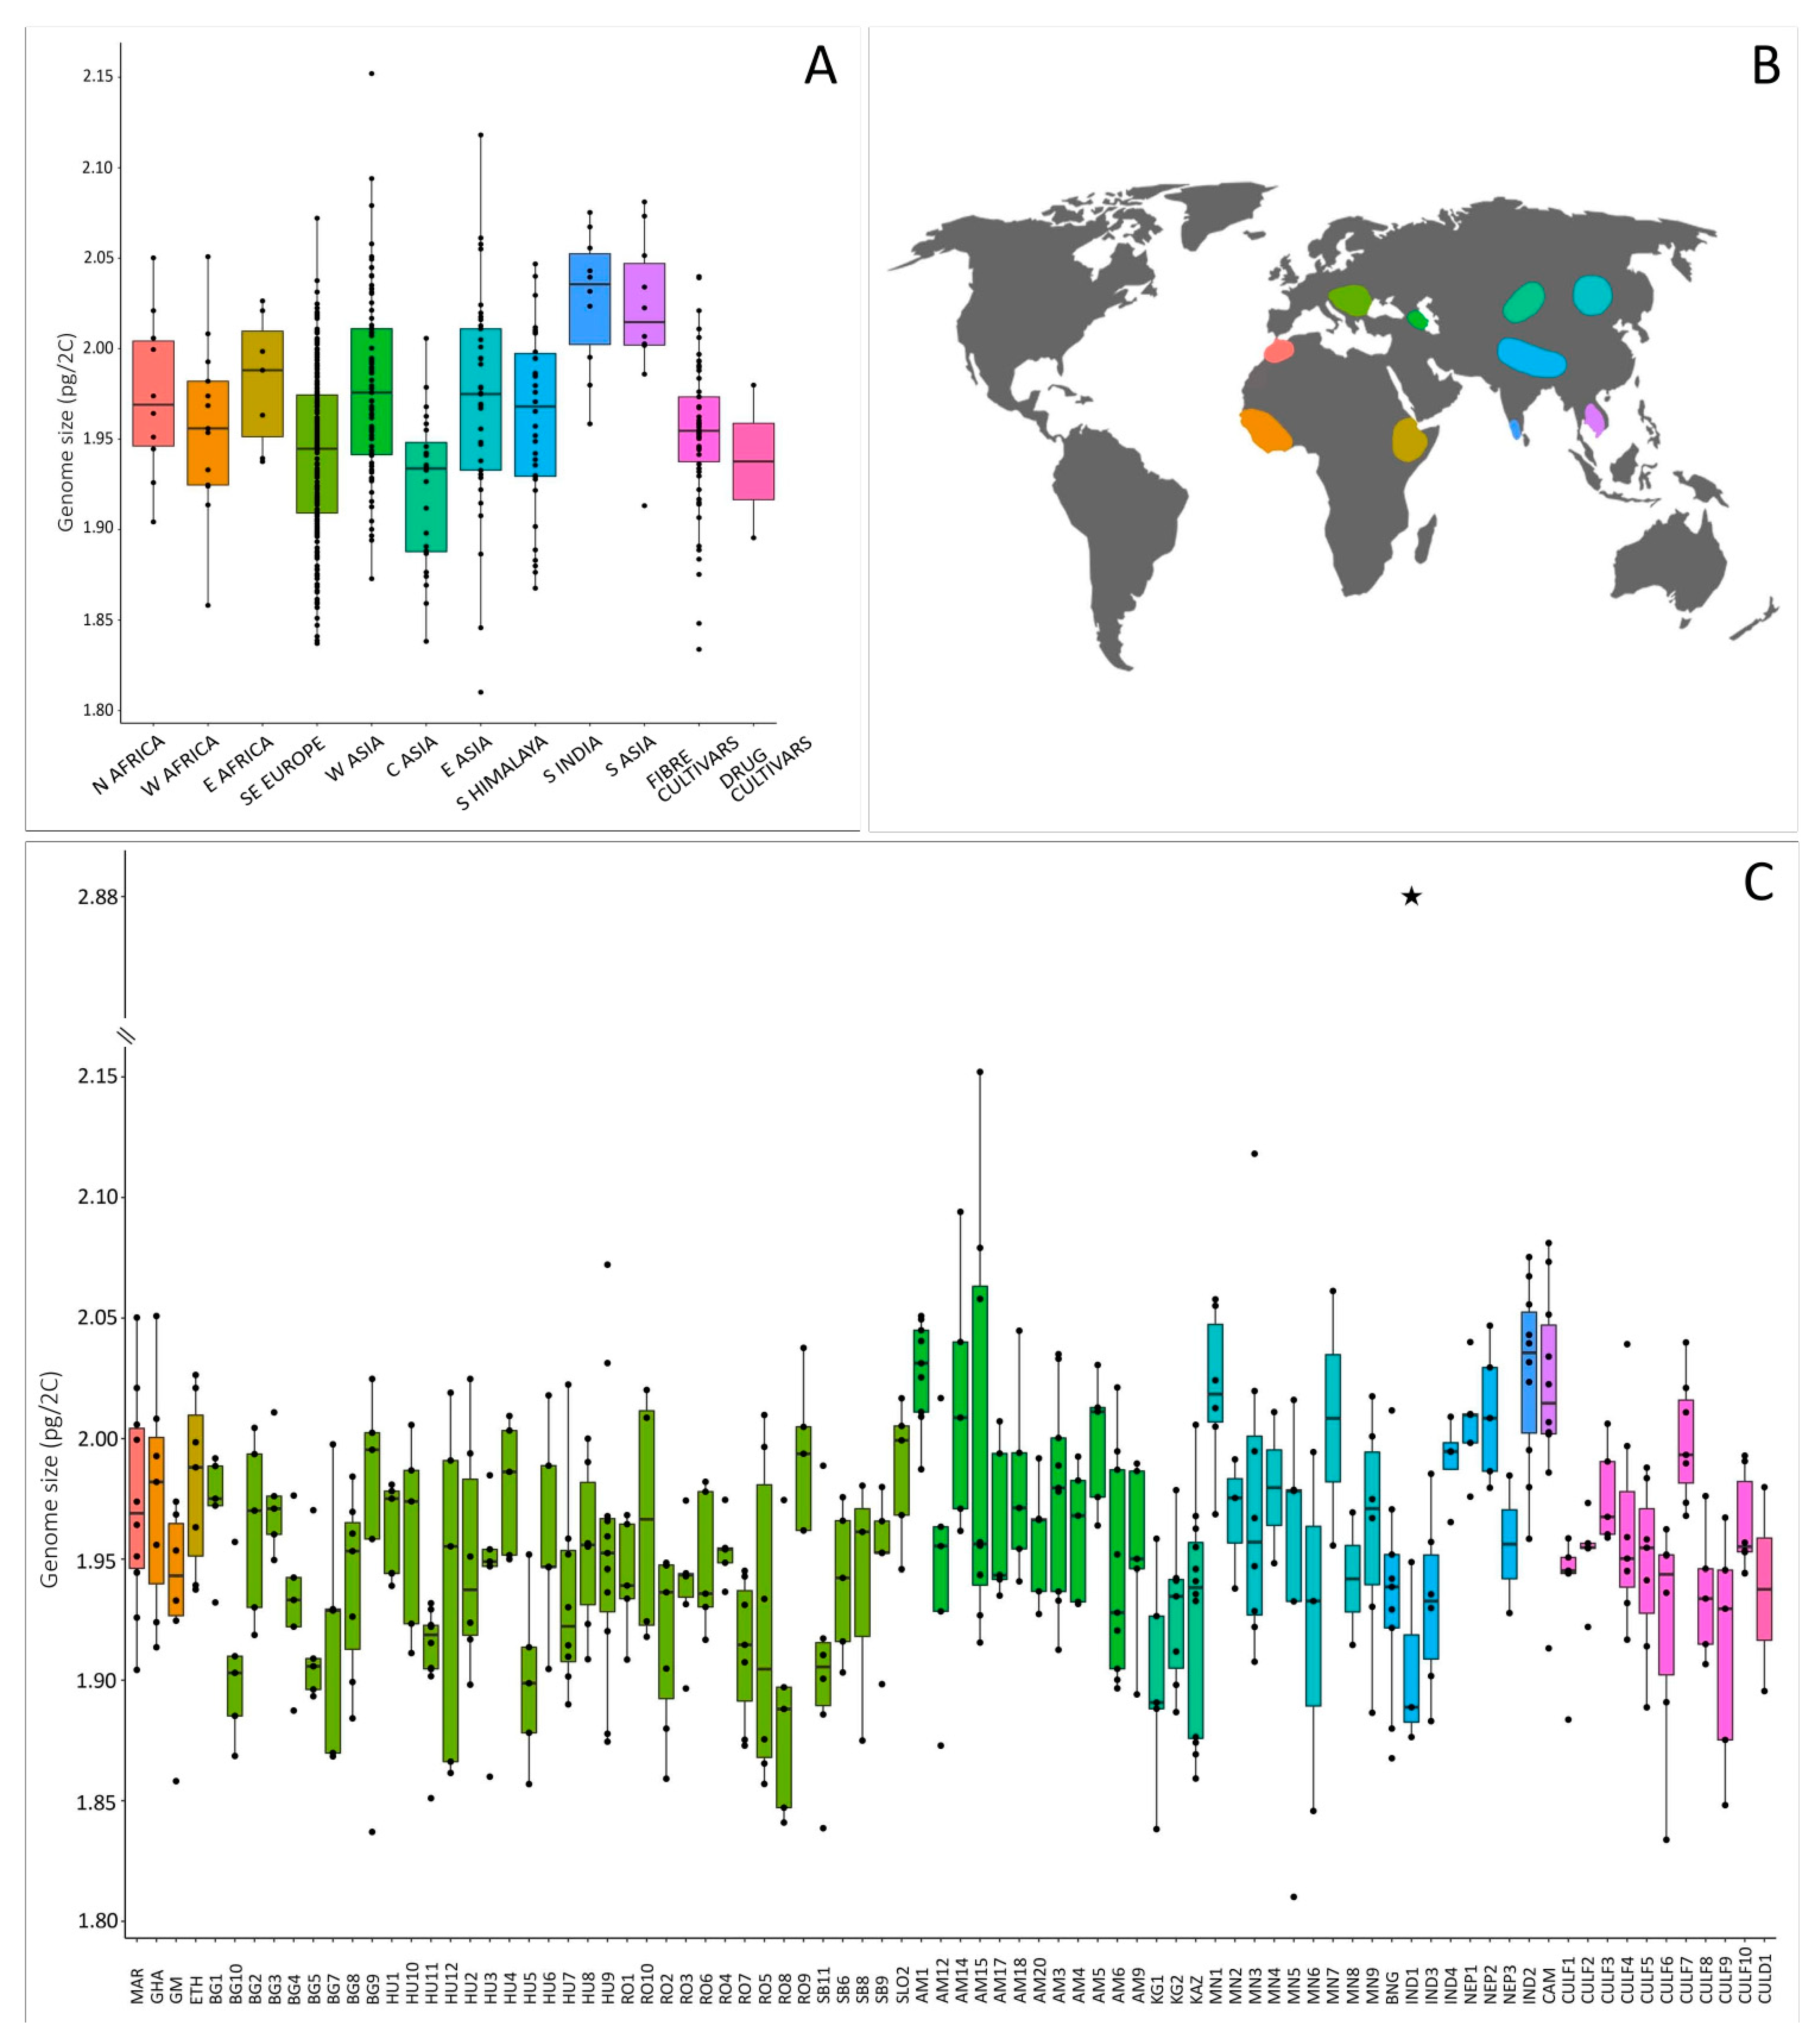
2.1. Genome Size in Cannabis: Evidence of Intraspecific Variation

We analysed 483 individuals belonging to 84 accessions (i.e., populations of wild/feral plants, or any landrace and cultivar) from an area spreading over more than 12,000 km and three continents (Figure 1, Table S1). Nuclear DNA content (2C-values) obtained per individual and summarised by accession and geographical region are depicted in Figure 1 and Table S1.
All but one of the individuals analysed were diploid, with genome sizes ranging from 1.810 pg/2C (individual Mongolia 5.14) up to 2.152 pg/2C (individual Armenia 15.3), and an average of 1.956 ± 0.051 pg/2C. One triploid individual was found in a North-Indian wild accession, with a genome size of 2.884 pg/2C. Illustrative flow cytometry histograms for diploid and triploid individuals are presented in Figure 2A,B. The average genome size value for diploid Cannabis accessions obtained in our study is slightly higher than average values previously reported (1.720 pg/2C, range = 1.42–1.97 pg/2C; Table S2; [37,48,49,50,51]). These differences could be explained by the use of different internal standards, instruments, and stains [69].
The overall genome size difference between diploid individuals spanned over a 1.189-fold range (18.89%). We illustrated for the first time the intraspecific variation in Cannabis by processing samples with different genome sizes together and obtaining two peaks (Figure 2C). It is to note that the variation we highlighted through the analyses of 482 diploid individuals is much smaller than the one previously obtained by Lee et al. [50]. Indeed, these authors found a 1.373-fold (37.3%) intraspecific difference through the analysis of 35 individuals.
At the accession’s level, we detected significant differences in genome size of diploids across the 84 analysed accessions (p < 0.001, Table 1), with average 2C-values ranging from 1.890 ± 0.053 pg/2C (Romania 8) to 2.028 ± 0.022 pg/2C (Armenia 1), which represented a 1.073-fold variation (7.3%). Lee et al. [50] found, however, a much larger variability (1.36-fold range; 35.9%), although they analysed only 14 accessions, with 2C-values ranging from 1.42 to 1.93 pg/2C. In turn, Faux et al. [37] did not find a significant difference among the genome sizes of five Cannabis monoecious cultivars. The variation within accessions in our dataset ranged from 1.020-fold (∆ = 0.038 pg/2C, Romania 4) up to 1.123-fold (∆ = 0.236 pg/2C, in Armenia 15), with an average of 1.053-fold (∆ = 0.101 ± 0.032 pg/2C) (Figure 1C, Table S1). Similarly, the study by Lee et al. [50] detected a within-accession variation from 1.006-fold (∆ = 0.01 pg/2C) to 1.127-fold (∆ = 0.22 pg/2C). We found a significant difference in genome size across accessions and distribution areas (Figure 1; ANOVA, p < 0.001, Table 1), however, no accession nor area could be clearly separated from the rest through the Tukey HSD post hoc test.
Taking together these results, despite the differences in the degree of genome size variation when compared with previous studies, our results provide compelling evidence of genuine intraspecific variation in Cannabis.

2.2. Potential Factors Influencing Genome Size Variation in Cannabis

Intraspecific genome size variation of taxa with a large distribution area or isolated populations has been mostly attributed to changes in ploidy level, though, cases of intraspecific variation at the same ploidy level as found in Cannabis have also been reported, such as in Urtica dioica (2x and 4x populations with 3.05% within 2x accessions and 9.8% variability within 4x accessions [33]), Festuca pallens (2x and 4x populations with 16.6% variation in 2x and 15% in 4x [70]), Picris hieracioides (37.6% variability [71]), Senecio carniolicus (13.1% variability in 2x, 10.2% in 4x, 5.4% in 5x, and 10.5% in 6x populations [72]), Ranunculus parnassifolius (2x populations with 8.58% and 4x with 1.29% variability [73]), and Euphrasia arctica (27.4% variability in 2x accessions [24]). Intraspecific genome size variation in species with characteristics comparable to Cannabis, i.e., a large distribution area and/or the presence of numerous cultivars, has also been reported in Chenopodium album (Europe–China; 6.13% [74]), Chenopodium quinoa (Americas; 5.9% [75]), Prunus armeniaca (Europe–China; 2.3% [76]), and Cardamine occulta (Europe–Japan; 8.98% [77]). The intraspecific variation in genome size we found in diploid Cannabis at the level of the individuals (18.89%) and accessions (7.3%) is, therefore, similar to that found in other taxa.
Given that no differences in chromosome numbers—except for a few cases—have been found in Cannabis (see [50,53] and Table S1), the variation we observed is unlikely to be caused by aneuploidy (i.e., changes in chromosome number). Cannabis has heteromorphic sex chromosomes [49], therefore, the sex of individuals could account for some of the variation in genome size. Even though most of our analysed dioecious accessions included both male and female individuals, their frequencies within accessions were not always the same, which could affect the average genome size values per accession. However, according to our results, sex does not fully explain the variation detected between accessions (further discussed below). In the absence of chromosome number variation, another possible explanation for intraspecific genome size variation could be the differences in repetitive DNA sequence content. Pisupati et al. [78] found that 64% of the Cannabis genome is made up of repetitive sequences. This is less than in Zea mays (c. 85% [79]), but more than in Arabidopsis thaliana (c. 21% [80]), where intraspecific genome size variation has also been found [29,81]. Finally, although we have made a great effort to optimise the method for genome size assessment in Cannabis by testing a wide range of plant tissues, growing stages, and nuclei extraction buffers (see Section 3. Materials and Methods), we cannot entirely rule out that part of the variation could be due to a technical error. Indeed, all Cannabis parts are very rich in secondary metabolites [44], and previous studies have shown that chemical compounds can interfere with DNA binding of the stain, thus, potentially altering the genome size assessments [82,83,84,85,86,87]. However, we are confident that we have minimised this effect by using only very young leaves from newly germinated seedlings, which provided the best quality measurements in our preliminary tests.

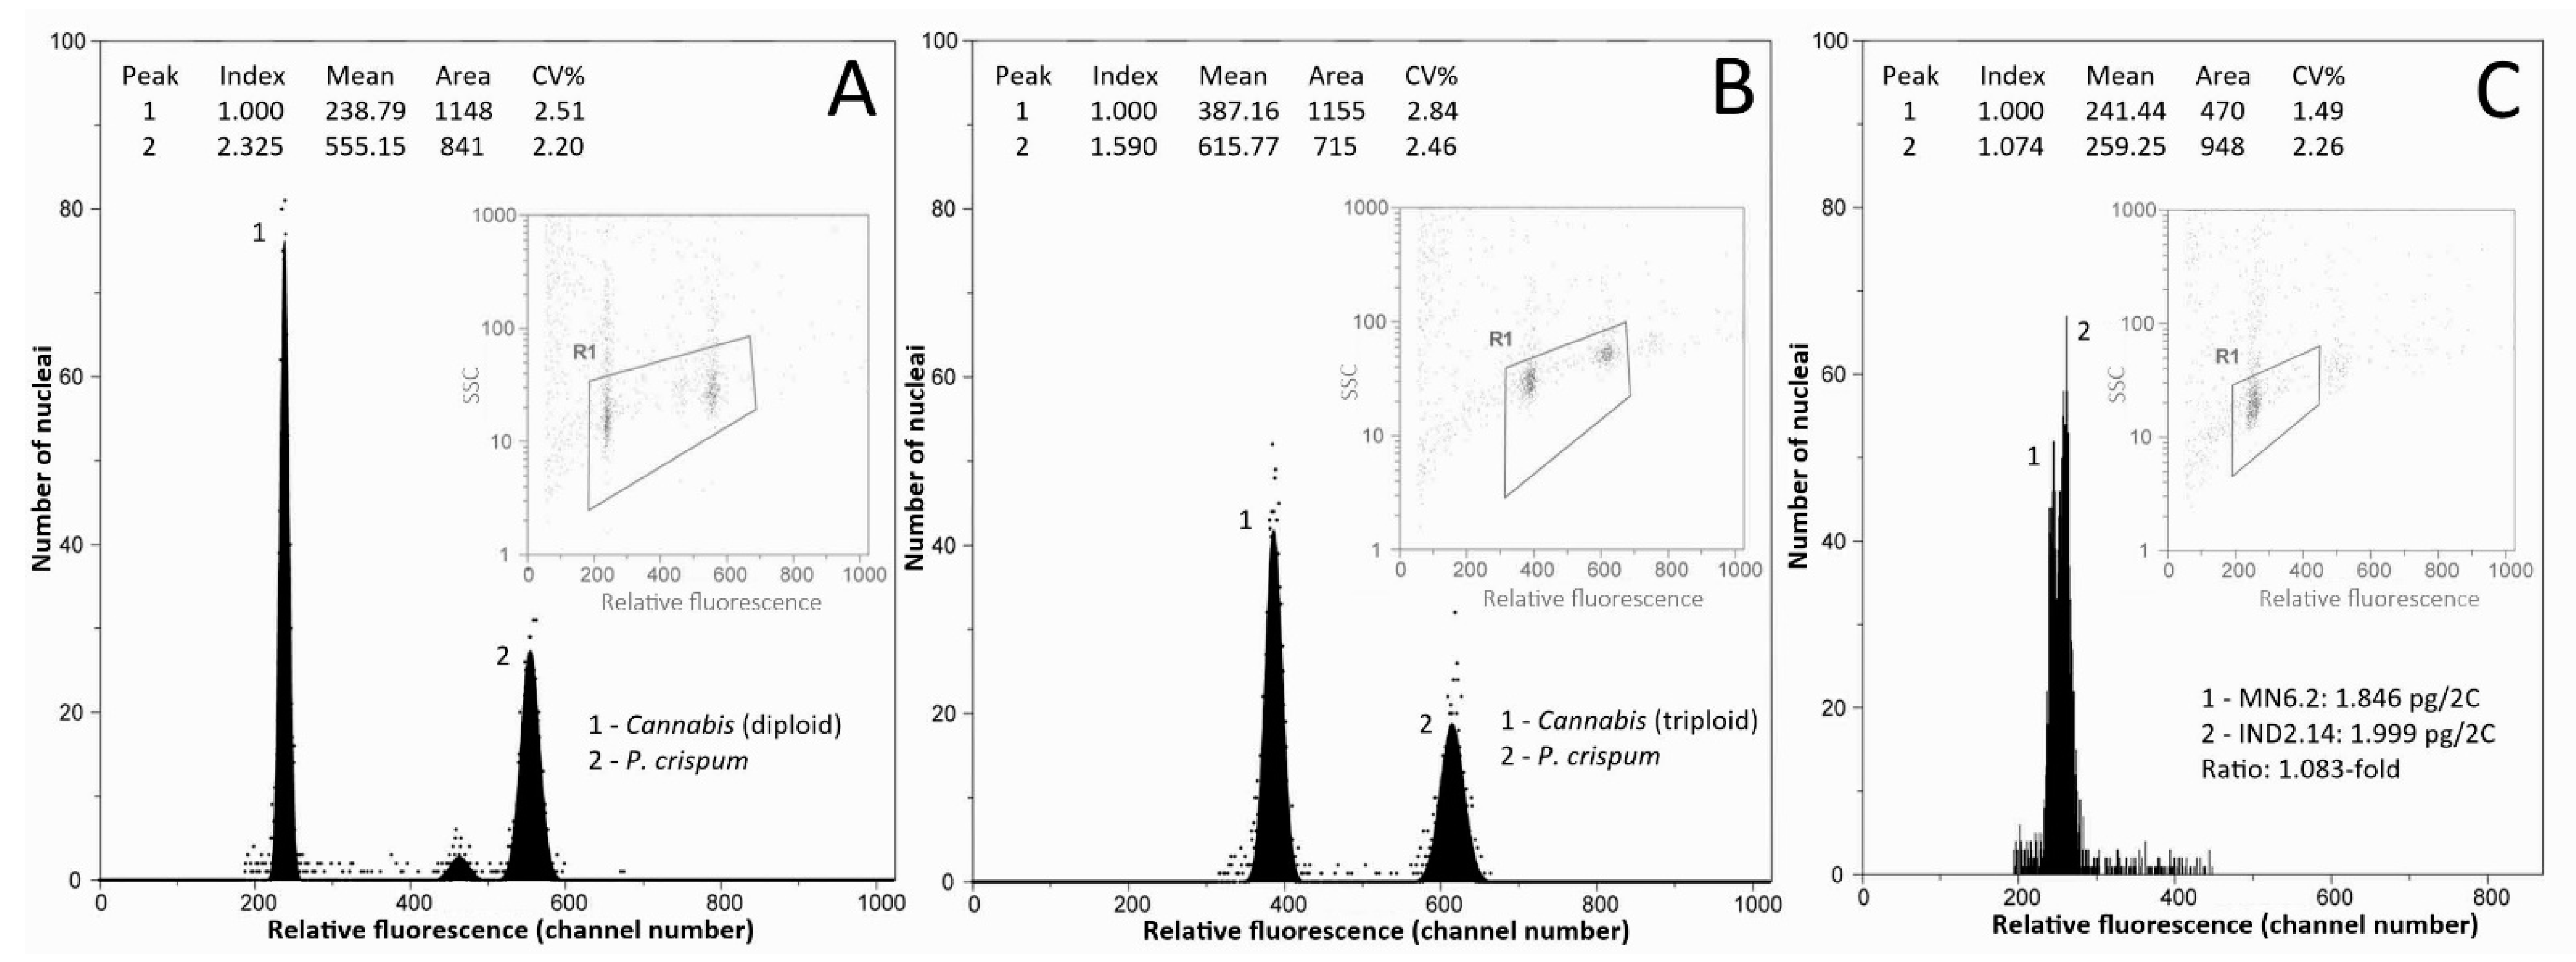
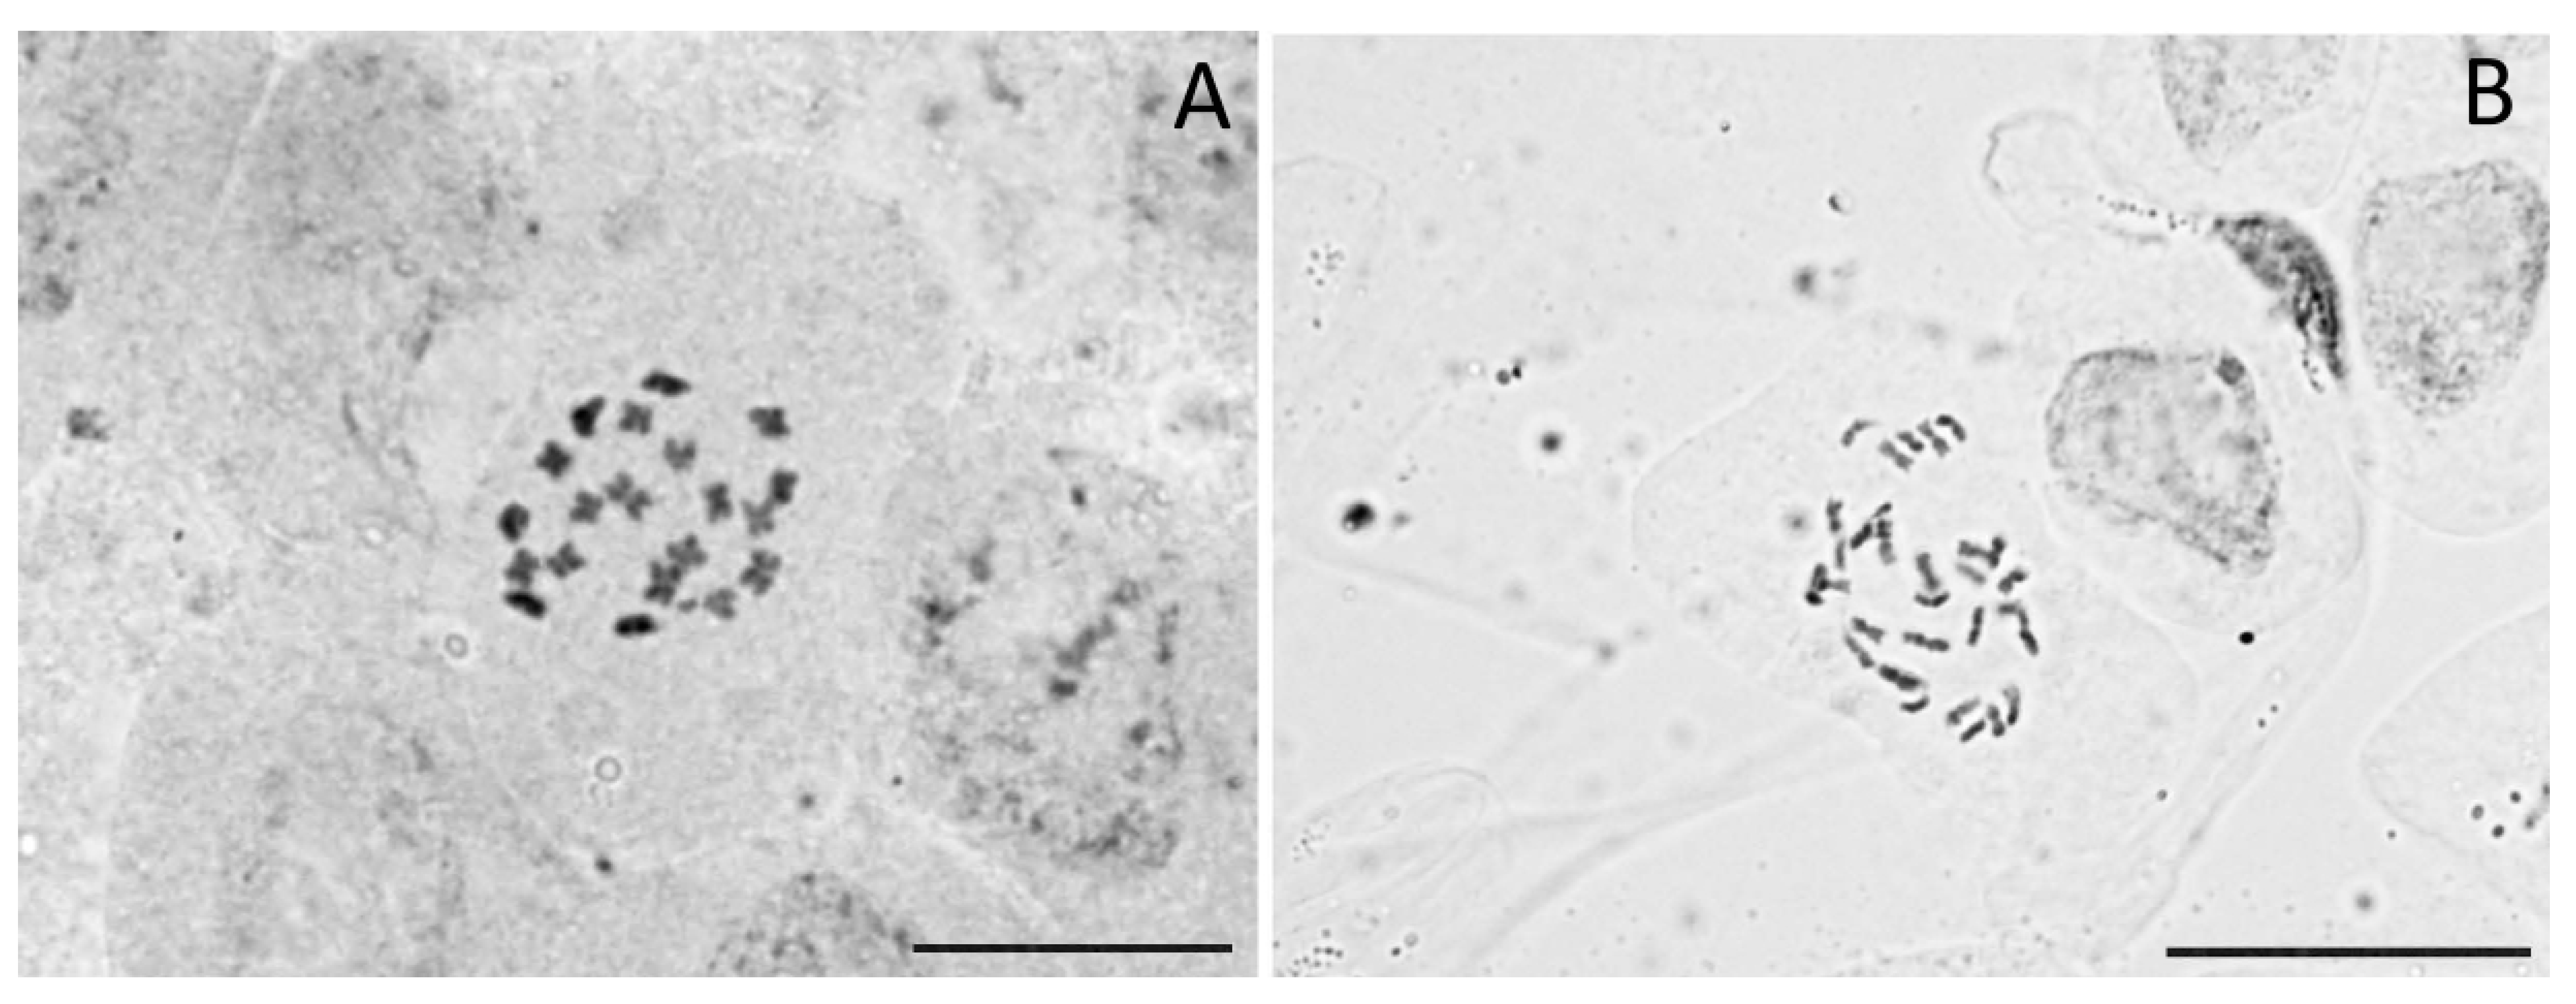
2.3. Events of Polyploidy in Cannabis Are Extremely Rare

We found one triploid and 482 diploid individuals (Figure 1, Table S1). These results are similar to the previous evidence of Small [53] and Lee et al. [50], showing consistent diploidy (with minimal exceptions) in the species. We confirmed chromosomally that the ploidy levels inferred with flow cytometry by carrying out chromosome counts in 10 individuals from 10 accessions. We found 2n = 20 in diploids and 2n = 30 in the triploid individual (wild North-Indian accession IND1; Figure 3; Table S1). This is the first report of a wild-born triploid individual in Cannabis. Records of non-diploid Cannabis individuals were indeed so far limited to a tetraploid population in North India [52], or they were otherwise induced by chemical treatment [51]. From the same accession as the triploid individual, the genome size of three other individuals was measured—they were all diploids. The triploid was a male, had a similar morphology than other individuals, and it flowered normally. Unfortunately, we were not able to study this accession further due to the limited number of seeds available, but it would certainly be interesting to investigate whether other ploidy levels could be found in this or more accessions.
Our results confirm that natural polyploidy seems to be extremely rare or even practically non-existent in Cannabis, despite its rich domestication background. This contrasts with evidence found in many other species, where genome polyploidisation is preceding or concomitant with their domestication [88,89]. Whole genome multiplication and subsequent diploidization processes provide plants with increased allelic diversity, heterozygosity, and enhanced meiotic recombination, which may increase their adaptive plasticity and evolutionary success [89]. It is, therefore, not surprising that the domestication of some of the most economically important cultivated plants is associated with a polyploidization event, e.g., Avena sativa [90], Triticum sp. [91], Ipomoea batatas [92], Brassica rapa [93], and Musa sp. [94], among others. In Cannabis, artificial polyploids have been obtained by several breeding programs; however, the changes in morphology and phytochemistry of the polyploids have not been extensively investigated so far, thus, requiring more research to be carried out [95].

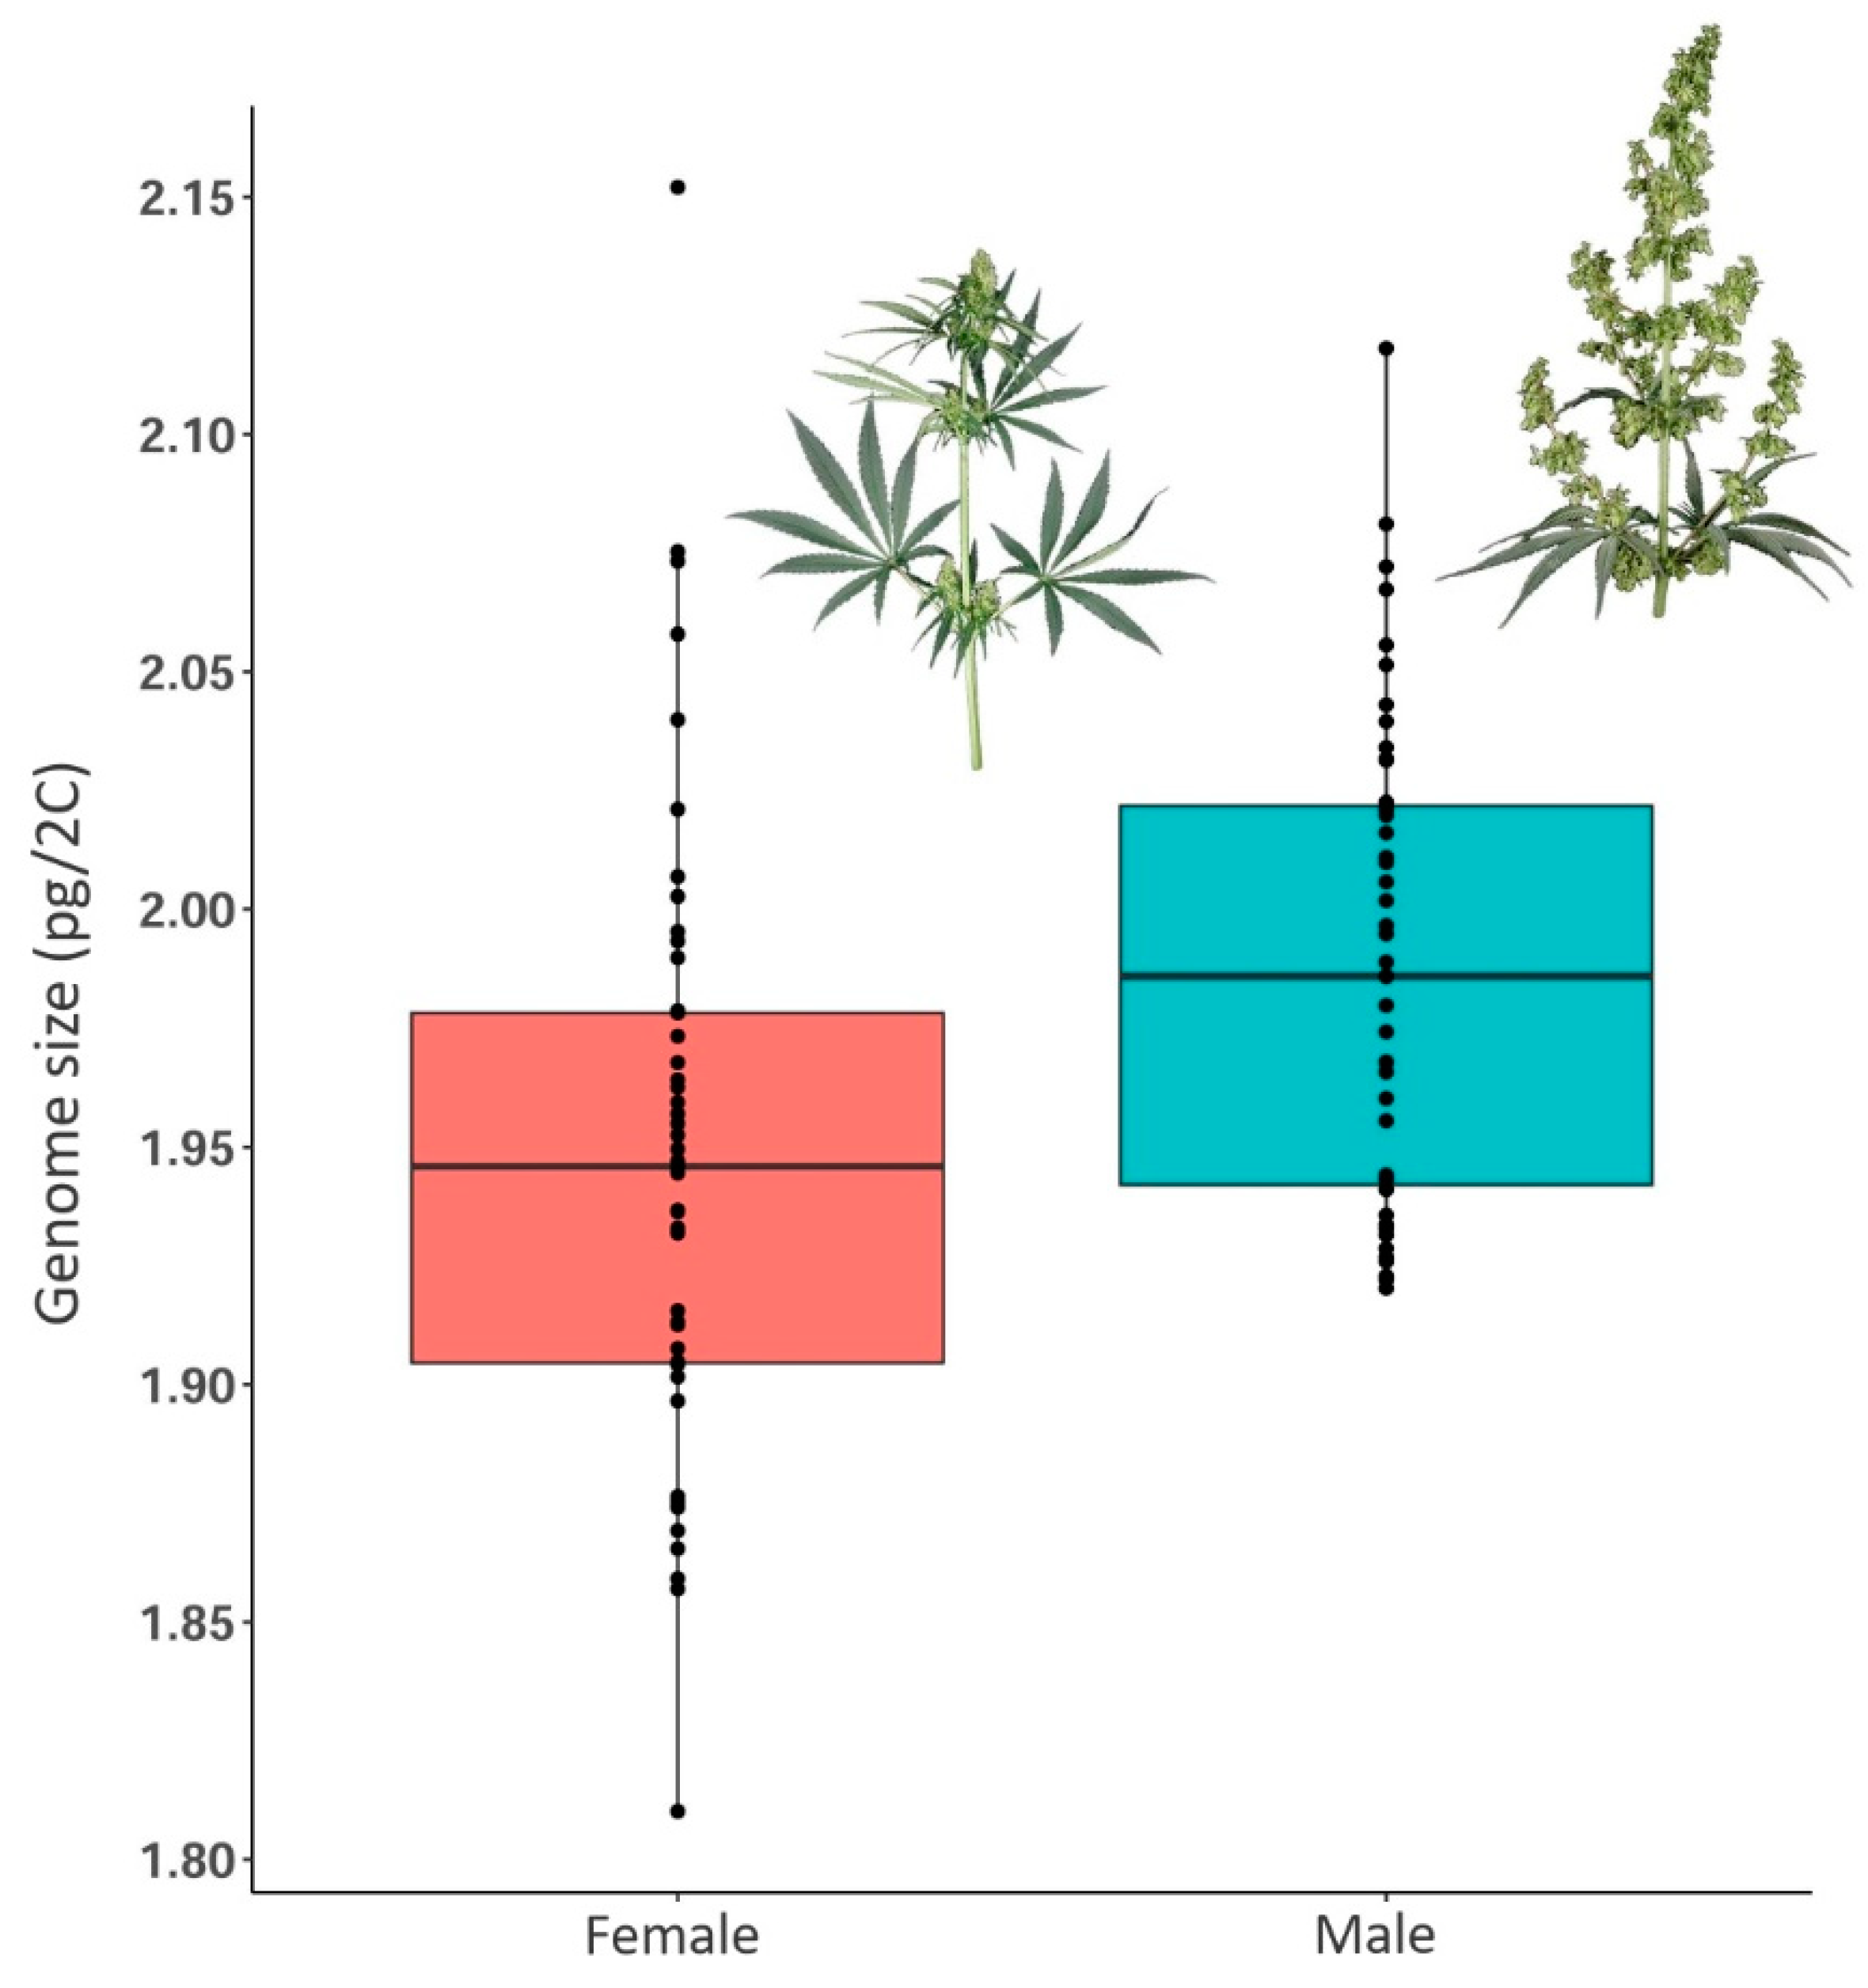
2.4. Differences in Genome Size Values of Male and Female Cannabis Individuals

From the 99 individuals with the previously measured genome size selected for sex determination, a MADC2 male-associated band of 390 bp amplified in 46 of them (considered males), while the male-associated band was absent in 49 (considered females). Four individuals showed inconclusive results, with either no PCR bands or two non-indicative bands.
The average female genome size was 1.947 ± 0.065 pg/2C (1.810–2.152 pg/2C), and the average male genome size was 1.987 ± 0.0521 pg/2C (1.920–2.112 pg/2C) (Figure 4 and Figure S1; Table 2). Using ANOVA, we found a significant difference in genome size between male and female plants (p < 0.001) (Figure 4, Table 1). The 2C-value of male individuals was in general larger than females for ∆ = c. 0.050 pg (0.0009–0.114 pg), which agrees with previous studies [37,49,50]. However, we found few cases where within the same accession, male individuals had a smaller genome size than females. Additionally, the overlap of genome size values of male and female individuals within accessions was, in general, quite high (Figure S1).
Cannabis is showing significant genome size differences between male and female individuals, which is not always the case in dioecious species (e.g., in Juniperus thurifera [96]). The presence of a larger genome size in males has been reported in most plant species with heteromorphic sex chromosomes. While some dioecious species have differences in genome size between male and female individuals of similar magnitude to those found in Cannabis (2.05%), e.g., 0.45% in Simmondsia chinensis [97], 1.97% in Viscum album [97], and 2.09–4.19% in Silene latifolia [97,98], other species present much larger differences, e.g., 7.14% in Rumex acetosa [99], 9.83% in R. hastatulus [100], and 10% in Coccinia grandis [101]. A larger genome size in male is probably related with Y chromosome degeneration in plants, likely involving the accumulation of repeats in this non-recombining chromosome, as found in R. acetosa [102], Cannabis, and some Humulus species [103].

2.5. Sex Determination in Cannabis Using Flow Cytometry

Peaks of male and female Cannabis individuals from the same accession analysed together through flow cytometry overlapped in all cases. This can be explained by the fact that the largest difference between male and female individuals we intended to discriminate was ∆ = 0.076 pg/2C (Armenia 3; Table S3), which is well below the smallest genome size difference for which we obtained distinguishable fluorescence double peaks in Cannabis (i.e., ∆ = 0.130 pg/2C). Our results showed that while differences between the genome size of male and female individuals are significant (according to ANOVA; see part 2.3 for more details), they are simply too small to be discriminated using flow cytometry, by directly processing together male and female individuals. In previous reports, the differences between male individuals on the one hand, and female and monoecious individuals (in both the sex is determined by two X chromosomes) on the other, detected by Faux et al. [37] and Sakamoto et al. [49] (∆ = 0.046 pg/2C and ∆ = 0.048 pg/2C, respectively), were also extremely small. Only Lee et al. [50] found larger differences of ∆ = 0.05–0.15 pg/2C (2.90–10.56%) between sexes, that could potentially be discriminated in flow cytometry histograms. Unfortunately, the individuals demonstrating these large differences were not processed together to confirm these results. It should be noted, however, that our results were obtained using propidium iodide as the dye in the flow cytometry experiments. Certainly, other methods of flow cytometry, such as the use of other fluorochromes (for example DAPI) or flow sorting, that could offer an improved resolution limit of the technique, should be explored in the future for inexpensive and high-throughput early sex determination in Cannabis. Indeed, a previous study has shown the suitability of DAPI flow cytometry for direct sex identification in Silene latifolia (formerly Melandrium album) and Silene dioica (formerly M. rubrum) [22], allowing for the discrimination of approximately 1.04-fold genome size difference.

3. Materials and Methods

3.1. Plant Sampling and Cultivation

We analysed 483 Cannabis individuals from 84 accessions distributed worldwide, spanning over 12,000 km (Table S4). On average, 5 individuals from each accession were analysed (see Table S1 for details on specific accessions). Seeds from the studied accessions were germinated in Petri dishes and transplanted to pots after the emergence of the first leaves. Plants were cultivated in a growth chamber under controlled conditions (25 °C, 18 h light/6 h dark). Studied individuals were grown for approximately 2–3 weeks until the development of the first or second pair of leaves.

3.2. Flow Cytometry Measurements

Genome size was determined using a CyFlow Space instrument (Sysmex-Partec GmbH, Goerlitz, Germany), fitted with a 100 mW green solid-state laser (Cobolt Samba, Cobolt AB, Solna, Sweden). The internal standard Petroselinum crispum ‘Champion Moss Curled’ (2C = 4.50 pg) [104] was used.
Cannabis plants have many secondary metabolites [44] that could potentially interfere with DNA staining and worsen the quality of the measurements. To overcome such potential issues, different plant tissues and growing stages were tested. The best results were obtained using the first or second pair of leaves of young Cannabis plants. Additionally, different flow cytometry buffers (LB01 [105], Ebihara [106], Cystain Ox Protect and PI Absolute buffers (Sysmex-Partec GmbH)) were tested as well, before choosing the general purpose buffer GPB [107] supplemented with 3% PVP-40 [108] as the most appropriate one. Additional measures, such as reducing chopping intensity and working in ice-cold conditions, were taken to reduce the potential effects of secondary metabolites.
We followed the one-step procedure [109] with some modifications. Fresh leaf samples of Cannabis and the standard were co-chopped in a Petri dish over ice using 2 mL of the selected nuclei extraction buffer. The sample was then filtered, stained with 40 µL of propidium iodide (PI), and vortexed; samples were left on ice for approximately 30 min before the measurement.
For each sample, the nuclear DNA content was estimated by counting approximately 1000 nuclei per fluorescence peak. Each sample was assessed two times and the results averaged to obtain the final genome size value for the individual. The histograms were analysed using the FlowMax software (v. 2.9, Sysmex-Partec GmbH). Histograms with coefficients of variation (CVs) larger than 5% were discarded.

3.3. Chromosome Counts

Root meristems from each accession were collected for chromosome counts, pre-treated for 2.5 h in 0.05% aqueous colchicine and fixed in fresh absolute ethanol and glacial acetic acid (3:1) for 3 h at room temperature, before being stored in the fixative at 4 °C. They were hydrolysed for 10 min at 60 °C in 1N HCl and stained in 1% aqueous aceto-orcein for at least two hours. Root tips were subsequently squashed in a drop of 45% acetic acid-glycerol (9:1) and observed with a Zeiss Axioplan microscope (Carl Zeiss, Oberkochen, Germany). Metaphases were photographed using a Zeiss AxioCam HRm camera (Carl Zeiss).

3.4. Sex Determination Using Male-Associated Marker and Flow Cytometry

To address the potential differences in genome size between male and female individuals, leaf material from 15 accessions (99 individuals) (Table S5) was collected after genome size measurements and stored in silica gel. DNA was extracted either using the E.Z.N.A. SP Plant DNA Kit (Omega Bio-Tek, Norcross, GA, USA) or the CTAB protocol, following the method by Doyle and Doyle [110] with some modifications.
The sex of individuals was tested using a male-associated DNA marker MADC2, with sequences 5′-GTGACGTAGGTAGAGTTGAA-3′, corresponding to the positions 1–20, and 5′-GTGACGTAGGCTATGAGAG-3′, corresponding to the positions 373–391 [62]. PCR reactions were performed in a 25 µL reaction mixture, containing 1 µL of genomic DNA (approximately 50 ng), 14.3 µL of sterile water, 2.5 µL of 2 mM MgCl2, 2.5 µL of 10X Gene Taq Universal buffer (Applied Biosystems, Carlsbad, CA, USA), 2.5 µL of 2.5 mM dNTPs mixture, 1 µL of each primer (5 pmol/µL), and 0.2 µL of AmpliTaq DNA polymerase (Applied Biosystems, Carlsbad, CA, USA). The amplification was carried out following the steps: 94 °C for 5 min followed by 37 cycles of 94 °C for 30 s, 58 °C for 1 min, 72 °C for 1 min, and a final step of 72 °C for 5 min. PCR products and ladder (HyperLadder™ 100 bp; Meridian Bioscience, Cincinnati, OH, USA) were separated on 2% agarose gels stained with SYBR Safe-DNA Gel Stain (Thermo Fisher Scientific, MA, USA), and were run at 100 V.
As the reliability of the MADC2 marker used here has been questioned in the past, we first tested the marker on 43 individuals of wild/feral, landrace, and cultivar Cannabis accessions with previously known sex (plants grown until the reproductive phase). The marker proved to be a reliable method to assign the correct sex in all but one case, which was inconclusive. No false positives were detected.
To test the suitability of flow cytometry to discriminate between male and female Cannabis plants, we selected five accessions (Table S3) displaying a particularly wide range of genome sizes in a preliminary genome size survey (Table S4). New plants from these accessions were cultivated. The first leaf of all individuals was collected and dried in silica gel, and this material was then used to detect the sex-associated marker MADC2 as described above. The genome size was determined by flow cytometry. Samples of each sex from the same or different accessions showing the most divergent genome size values were processed together to test whether genome size differences were large enough to be detected directly by flow cytometry (presence of double peaks).

3.5. Statistical Analyses

To analyse genome sizes across different accessions and distribution areas, we used the dataset composed of all 482 diploid individuals from 84 accessions (Table S4). We analysed the differences using the analysis of variance (ANOVA). The difference in genome size between male and female individuals was also analysed using ANOVA on a dataset of 96 individuals from 15 accessions for which the sex was previously determined with the MADC2 marker (95 individuals); one additional individual where the MADC2 marker showed inconclusive results, but rapidly reached the reproductive phase, was also included (Table S5). Before performing the ANOVA tests, the normality of the datasets was tested on residuals using the Shapiro–Wilk test and Q-Q plots, and homogeneity of variances with Bartlett’s test. All the analyses and data visualisations were performed using R version 4.2.1 [111].

4. Conclusions

This study evidenced the extent of intraspecific genome size variation in Cannabis and its distribution between and within accessions in an extended sampling covering a wide range of wild/feral, landrace, and cultivated accessions. Our results suggest that the geographical expansion of Cannabis and its domestication had little impact on its genome size. In this sense, the pattern observed for genome size is similar to that of other traits in Cannabis (e.g., leaf and inflorescence phenotype): a high variability of difficult interpretation, as it does not seem tightly related to its geographical distribution or to infraspecific taxonomic differentiation. Consequently, further studies will be needed to confidently determine whether the observed pattern is a consequence of the history of Cannabis, tightly linked to humans, or an intrinsic characteristic of the species.

Supplementary Materials

The following supporting information can be downloaded at: https://www.mdpi.com/article/10.3390/plants11202736/s1, Supplementary Figure S1: Genome size of male and female individuals per accession; Table S1: Details of analysed accessions, Table S2: Review of the previously published genome size assessments of Cannabis, Table S3: Genome size values of the five selected accessions for sex differentiation, Table S4: Dataset with all Cannabis diploid accessions analysed, Table S5: Dataset with 15 selected Cannabis diploid accessions analysed.

Author Contributions

Conceptualization, M.B., T.G., O.H., D.V., with the assistance of the remaining authors; fieldwork, management of collection and cultivation permits, M.B., T.G., J.V., D.V.; preliminary tests for the optimisation of genome size assessments in Cannabis, M.B., O.H.; genome size assessments, M.B., R.R.G.; sex determination through genetic marker and statistical analyses, M.B., R.R.G., T.G., D.V.; writing—original draft preparation, M.B.; writing—review and editing, M.B., S.G., T.G., J.P., J.V., D.V., O.H. All authors have read and agreed to the published version of the manuscript.

Funding

This research was funded by Ministerio de Ciencia, Innovación y Universidades, grant numbers CGL2017-84297-R, PRE2018-083226, Generalitat de Catalunya, grant number 2017SGR1116, S.G. and J.P. benefited from a Ramón y Cajal grant funded by MCIN/AEI/ 10.13039/501100011033 and by “ESF Investing in your future”, grant numbers RYC-2014-16608 and RYC-2017-2274.

Institutional Review Board Statement

Not applicable.

Informed Consent Statement

Not applicable.

Data Availability Statement

The data presented in this study are available in the Supplementary Materials.

Acknowledgments

This research was supported by projects WECANN (CGL2017-84297-R, Ministerio de Ciencia, Innovación y Universidades), 2017SGR1116 from the Generalitat de Catalunya, and M. Balant FPI predoctoral contract of the Ministerio de Ciencia, Innovación y Universidades (PRE2018-083226). J. Pellicer benefited from a Ramón y Cajal grant ref: RYC-2017-2274, and S. Garcia benefited from a Ramón y Cajal grant ref: RYC-2014-16608 funded by MCIN/AEI/ 10.13039/501100011033 and by “ESF Investing in your future”. We would also like to thank Cannaflos—Gesellschaft für medizinisches Cannabis mbH and Joan Uriach Marsal from Uriach Laboratories for additional financial support. We would also like to acknowledge Cannaflos—Gesellschaft für medizinisches Cannabis mbH, and especially Carlos Sáez and Carlos Ribelles for the collaboration in sample collection, and contributions during the original proposal for the WECANN project design. We would also like to thank the colleagues who helped with the sample collection and laboratory work: Zoltán Barina, Ciprian C. Buzna, Marco Calvi, Teodora Dalmacija, Branko Dolinar, İrem Erdoğan, Airy Gras, María Luisa Gutiérrez Merino, Kunigunda Macalik, Marine Oganesian, Alexandra Papamichail, Sonja Siljak-Yakovlev, Nina Stepanyan-Gandilyan, Vladimir Stevanović, Nusrat Sultana, Boštjan Surina, Paul Szatmari, Shagdar Tsooj, Magsar Urgamal, and Vladimir Vladimirov.

Conflicts of Interest

The funders had no role in the design of the study; analyses or interpretation of data; in the writing of the manuscript; or in the decision to publish the results. Cannaflos—Gesellschaft für medizinisches Cannabis mbH contributed to the collection of the samples analysed in this study.

References

  1. Clarke, R.; Merlin, M. Cannabis: Evolution and Ethnobotany, 1st ed.; University of California Press: Berkley, MI, USA; Los Angeles, CA, USA; London, UK, 2013; ISBN 9780520270480. [Google Scholar]
  2. Gedik, G.; Avinc, O. Hemp fiber as a sustainable raw material source for textile industry: Can we use its potential for more eco-friendly production? In Sustainability in the Textile and Apparel Industries. Sustainable Textiles: Production, Processing, Manufacturing & Chemistry; Muthu, S., Gardetti, M., Eds.; Springer: Cham, Switzerland, 2020; pp. 87–109. ISBN 9783030385415. [Google Scholar]
  3. Rupasinghe, H.P.V.; Davis, A.; Kumar, S.K.; Murray, B.; Zheljazkov, V.D. Industrial hemp (Cannabis sativa subsp. sativa) as an emerging source for value-added functional food ingredients and nutraceuticals. Molecules 2020, 25, 4078. [Google Scholar]
  4. Gomez, F.P.; Hu, J.; Clarke, M.A. Cannabis as a Feedstock for the Production of Chemicals, Fuels, and Materials: A Review of Relevant Studies to Date. Energy Fuels 2021, 35, 5538–5557. [Google Scholar] [CrossRef]
  5. McPartland, J.M.; Hegman, W.; Long, T. Cannabis in Asia: Its center of origin and early cultivation, based on a synthesis of subfossil pollen and archaeobotanical studies. Veg. Hist. Archaeobot. 2019, 28, 691–702. [Google Scholar] [CrossRef]
  6. Jin, J.J.; Yang, M.Q.; Fritsch, P.W.; van Velzen, R.; Li, D.Z.; Yi, T.S. Born migrators: Historical biogeography of the cosmopolitan family Cannabaceae. J. Syst. Evol. 2020, 58, 461–473. [Google Scholar] [CrossRef]
  7. Ren, G.; Zhang, X.; Li, Y.; Ridout, K.; Serrano-Serrano, M.L.; Yang, Y.; Liu, A.; Ravikanth, G.; Nawaz, M.A.; Mumtaz, A.S.; et al. Large-scale whole-genome sequencing unravels the domestication history of Cannabis sativa. Sci. Adv. 2021, 7, eabg2286. [Google Scholar] [CrossRef]
  8. Kovalchuk, I.; Pellino, M.; Rigault, P.; van Velzen, R.; Ebersbach, J.; Ashnest, J.R.; Mau, M.; Schranz, M.E.; Alcorn, J.; Laprairie, R.B.; et al. The genomics of Cannabis and its close relatives. Annu. Rev. Plant Biol. 2020, 71, 20.1–20.27. [Google Scholar] [CrossRef] [Green Version]
  9. Hesami, M.; Pepe, M.; Alizadeh, M.; Rakei, A.; Baiton, A.; Phineas Jones, A.M. Recent advances in cannabis biotechnology. Ind. Crops Prod. 2020, 158, 113026. [Google Scholar] [CrossRef]
  10. Small, E. Evolution and Classification of Cannabis sativa (Marijuana, Hemp) in Relation to Human Utilization. Bot. Rev. 2015, 81, 189–294. [Google Scholar] [CrossRef]
  11. Hurgobin, B.; Tamiru-Oli, M.; Welling, M.T.; Doblin, M.S.; Bacic, A.; Whelan, J.; Lewsey, M.G. Recent advances in Cannabis sativa genomics research. New Phytol. 2021, 230, 73–89. [Google Scholar] [CrossRef]
  12. Watts, S.; McElroy, M.; Migicovsky, Z.; Maassen, H.; van Velzen, R.; Myles, S. Cannabis labelling is associated with genetic variation in terpene synthase genes. Nat. Plants 2021, 7, 1330–1334. [Google Scholar] [CrossRef]
  13. Hazekamp, A.; Fischedick, J.T. Cannabis—From cultivar to chemovar. Drug Test. Anal. 2012, 4, 660–667. [Google Scholar] [CrossRef]
  14. Bautista, J.L.; Yu, S.; Tian, L. Flavonoids in Cannabis sativa: Biosynthesis, Bioactivities, and Biotechnology. ACS Omega 2021, 6, 5119–5123. [Google Scholar] [CrossRef]
  15. Mcpartland, J.M.; Small, E. A classification of endangered high-THC cannabis (Cannabis sativa subsp. indica) domesticates and their wild relatives. PhytoKeyes 2020, 144, 81–112. [Google Scholar] [CrossRef] [Green Version]
  16. Greilhuber, J.; Doležel, J.; Lysák, M.A.; Bennett, M.D. The origin, evolution and proposed stabilization of the terms “genome size” and “C-value” to describe nuclear DNA contents. Ann. Bot. 2005, 95, 255–260. [Google Scholar] [CrossRef]
  17. Bennett, M.D.; Leitch, I.J. Genome Size Evolution in Plants. In The Evolution of the Genome; Gregory, T.R., Ed.; Elsevier Inc.: Amsterdam, The Netherlands, 2005; pp. 89–162. ISBN 9780123014634. [Google Scholar]
  18. Pellicer, J.; López-Pujol, J.; Aixarch, M.; Garnatje, T.; Vallès, J.; Hidalgo, O. Detecting introgressed populations in the Iberian endemic Centaurea podospermifolia through genome size. Plants 2021, 10, 1492. [Google Scholar] [CrossRef]
  19. Fernández, P.; Hidalgo, O.; Juan, A.; Leitch, I.J.; Leitch, A.R.; Palazzesi, L.; Pegoraro, L.; Viruel, J.; Pellicer, J. Genome Insights into Autopolyploid Evolution: A Case Study in Senecio doronicum (Asteraceae) from the Southern Alps. Plants 2022, 11, 1235. [Google Scholar] [CrossRef]
  20. González, G.E.; Poggio, L. Intragenomic conflict between knob heterochromatin and b chromosomes is the key to understand genome size variation along altitudinal clines in maize. Plants 2021, 10, 1859. [Google Scholar] [CrossRef]
  21. Costich, D.E.; Meagher, T.R.; Yurkow, J.E. A rapid means of sex identification in Silene latifolia by use of flow cytometry. Plant Mol. Biol. Report. 1991, 9, 359–370. [Google Scholar] [CrossRef]
  22. Doležel, J.; Göhde, W. Sex determination in dioecious plants Melandrium album and M. rubrum using high-resolution flow cytometry. Cytometry 1995, 19, 103–106. [Google Scholar] [CrossRef]
  23. Zhang, S.J.; Liu, L.; Yang, R.; Wang, X. Genome Size Evolution Mediated by Gypsy Retrotransposons in Brassicaceae. Genom. Proteom. Bioinforma 2020, 18, 321–332. [Google Scholar] [CrossRef]
  24. Becher, H.; Powell, R.F.; Brown, M.R.; Metherell, C.; Pellicer, J.; Leitch, I.J.; Twyford, A.D. The nature of intraspecific and interspecific genome size variation in taxonomically complex eyebrights. Ann. Bot. 2021, 128, 639–651. [Google Scholar] [CrossRef] [PubMed]
  25. Devos, K.M.; Brown, J.K.M.; Bennetzen, J.L. Genome size reduction through illegitimate recombination counteracts genome expansion in Arabidopsis. Genome Res. 2002, 12, 1075–1079. [Google Scholar] [CrossRef] [PubMed] [Green Version]
  26. Achigan-Dako, E.G.; Fuchs, J.; Ahanchede, A.; Blattner, F.R. Flow cytometric analysis in Lagenaria siceraria (Cucurbitaceae) indicates correlation of genome size with usage types and growing elevation. Plant Syst. Evol. 2008, 276, 9–19. [Google Scholar] [CrossRef]
  27. Benor, S.; Fuchs, J.; Blattner, F.R. Genome size variation in Corchorus olitorius (Malvaceae s.l.) and its correlation with elevation and phenotypic traits. Genome 2011, 54, 575–585. [Google Scholar] [CrossRef]
  28. García-Fernández, A.; Iriondo, J.M.; Vallès, J.; Orellana, J.; Escudero, A. Ploidy level and genome size of locally adapted populations of Silene ciliata across an altitudinal gradient. Plant Syst. Evol. 2012, 298, 139–146. [Google Scholar] [CrossRef]
  29. Díez, C.M.; Gaut, B.S.; Meca, E.; Scheinvar, E.; Montes-Hernandez, S.; Eguiarte, L.E.; Tenaillon, M.I. Genome size variation in wild and cultivated maize along altitudinal gradients. New Phytol. 2013, 199, 264–276. [Google Scholar] [CrossRef] [Green Version]
  30. Bilinski, P.; Albert, P.S.; Berg, J.J.; Birchler, J.A.; Grote, M.N.; Lorant, A.; Quezada, J.; Swarts, K.; Yang, J.; Ross-Ibarra, J. Parallel altitudinal clines reveal trends in adaptive evolution of genome size in Zea mays. PLoS Genet. 2018, 14, e1007162. [Google Scholar] [CrossRef] [Green Version]
  31. Walker, D.J.; Moñino, I.; Correal, E. Genome size in Bituminaria bituminosa (L.) C.H. Stirton (Fabaceae) populations: Separation of “true” differences from environmental effects on DNA determination. Environ. Exp. Bot. 2006, 55, 258–265. [Google Scholar] [CrossRef]
  32. Pellicer, J.; Vallès, J.; Garcia, S.; Garnatje, T. Changes in genome size in a fragmented distribution area: The case of Artemisia crithmifolia L. (Asteraceae, Anthemideae). Caryologia 2009, 62, 152–160. [Google Scholar] [CrossRef] [Green Version]
  33. Cronk, Q.; Hidalgo, O.; Pellicer, J.; Percy, D.; Leitch, I.J. Salix transect of Europe: Variation in ploidy and genome size in willow-associated common nettle, Urtica dioica L. sens. lat., from Greece to arctic Norway. Biodivers. Data J. 2016, 4, e10003. [Google Scholar] [CrossRef] [Green Version]
  34. Qiu, Y.; Hamernick, S.; Ortiz, J.B.; Watkins, E. DNA content and ploidy estimation of Festuca ovina accessions by flow cytometry. Crop Sci. 2020, 60, 2757–2767. [Google Scholar] [CrossRef]
  35. Small, E.; Cronquist, A. A Practical and Natural Taxonomy for Cannabis. Taxon 1976, 25, 405–435. [Google Scholar] [CrossRef]
  36. Hirata, K. Sex determination in hemp (Cannabis sativa L.). J. Genet. 1925, 19, 65–79. [Google Scholar] [CrossRef]
  37. Faux, A.M.; Berhin, A.; Dauguet, N.; Bertin, P. Sex chromosomes and quantitative sex expression in monoecious hemp (Cannabis sativa L.). Euphytica 2014, 196, 183–197. [Google Scholar] [CrossRef]
  38. Soorni, A.; Fatahi, R.; Haak, D.C.; Salami, S.A.; Bombarely, A. Assessment of Genetic Diversity and Population Structure in Iranian Cannabis Germplasm. Sci. Rep. 2017, 7, 15668. [Google Scholar] [CrossRef] [Green Version]
  39. Bocharkina, Y.V.; Alexandrov, O.S.; Razumova, O.V.; Karlov, G.I. The comparative analysis of the DNA repeat composition among Cannabis sativa L., Humulus lupulus L. and Humulus japonicus Siebold & Zucc. with heteromorphic sex chromosomes. Preprints 2021, 2021120040. [Google Scholar] [CrossRef]
  40. Grassa, C.J.; Weiblen, G.D.; Wenger, J.P.; Dabney, C.; Poplawski, S.G.; Motley, S.T.; Michael, T.P.; Schwartz, C.J. A new Cannabis genome assembly associates elevated cannabidiol (CBD) with hemp introgressed into marijuana. New Phytol. 2021, 230, 1665–1679. [Google Scholar] [CrossRef]
  41. Márquez, F.; Lozada, M.; Idaszkin, Y.L.; González-José, R.; Bigatti, G. Cannabis Varieties Can Be Distinguished by Achene Shape Using Geometric Morphometrics. Cannabis Cannabinoid Res. 2022, 7, 409–414. [Google Scholar] [CrossRef]
  42. Petit, J.; Salentijn, E.M.J.; Paulo, M.J.; Thouminot, C.; van Dinter, B.J.; Magagnini, G.; Gusovius, H.J.; Tang, K.; Amaducci, S.; Wang, S.; et al. Genetic Variability of Morphological, Flowering, and Biomass Quality Traits in Hemp (Cannabis sativa L.). Front. Plant Sci. 2020, 11, 102. [Google Scholar] [CrossRef] [Green Version]
  43. Vergara, D.; Feathers, C.; Huscher, E.L.; Holmes, B.; Haas, J.A.; Kane, N.C. Widely assumed phenotypic associations in Cannabis sativa lack a shared genetic basis. PeerJ 2021, 9, e10672. [Google Scholar] [CrossRef]
  44. Jin, D.; Dai, K.; Xie, Z.; Jie, C. Secondary metabolites profiled in Cannabis inflorescences, leaves, stem barks, and roots for medicinal purposes. Sci. Rep. 2020, 10, 3309. [Google Scholar] [CrossRef]
  45. Busta, L.; Dweikat, I.; Sato, S.J.; Qu, H.; Xue, Y.; Zhou, B.; Gan, L.; Yu, B.; Clemente, T.E.; Cahoon, E.B.; et al. Chemical and genetic variation in feral Cannabis sativa populations across the Nebraska climate gradient. Phytochemistry 2022, 200, 113206. [Google Scholar] [CrossRef] [PubMed]
  46. Di Sotto, A.; Gullì, M.; Acquaviva, A.; Tacchini, M.; Di Simone, S.C.; Chiavaroli, A.; Recinella, L.; Leone, S.; Brunetti, L.; Orlando, G.; et al. Phytochemical and pharmacological profiles of the essential oil from the inflorescences of the Cannabis sativa L. Ind. Crop. Prod. 2022, 183, 114980. [Google Scholar] [CrossRef]
  47. Sharma, K.; Rana, R.; Ashawat, M.S. Preliminary Phytochemical Screening of Leaves, Stems and Roots of wild Cannabis sativa. Res. J. Pharmacogn. Phytochem. 2022, 14, 19–22. [Google Scholar] [CrossRef]
  48. Kubešová, M.; Moravcová, L.; Suda, J.; Jarošík, V.; Pyšek, P. Naturalized plants have smaller genomes than their non-invading relatives: A flow cytometric analysis of the Czech alien flora. Preslia 2010, 82, 81–96. [Google Scholar]
  49. Sakamoto, K.; Akiyama, Y.; Fukui, K.; Kamada, H.; Satoh, S. Characterization; Genome Sizes and Morphology of Sex Chromosomes in Hemp (Cannabis sativa L.). Cytologia (Tokyo) 1998, 63, 459–464. [Google Scholar] [CrossRef] [Green Version]
  50. Lee, I.-J.; Uchiyama, H.; Sekita, S.; Goda, Y.; Satake, M. Analytical studies on Cannabis sativa L. introduced into Japan. Part III. The range variation of genome size in C. sativa. Foods Food Ingred. J. Jpn. 2003, 208, 382–386. [Google Scholar]
  51. Parsons, J.L.; Martin, S.L.; James, T.; Golenia, G.; Boudko, E.A.; Hepworth, S.R. Polyploidization for the Genetic Improvement of Cannabis sativa. Front. Plant Sci. 2019, 10, 476. [Google Scholar] [CrossRef]
  52. Sharma, V.; Srivastava, D.K.; Gupta, R.C.; Singh, B. Abnormal Meiosis in Tetraploid (4x) Cannabis sativa (L.) from Lahaul-Spiti (Cold Desert Higher Altitude Himalayas)-A Neglected But Important Herb. J. Biol. Chem. Chron. 2015, 2, 38–42. [Google Scholar]
  53. Small, E. Interfertility and chromosomal uniformity in Cannabis. Can. J. Bot. 1972, 50, 1947–1949. [Google Scholar] [CrossRef]
  54. Bagheri, M.; Mansouri, H. Effect of Induced Polyploidy on Some Biochemical Parameters in Cannabis sativa L. Appl. Biochem. Biotechnol. 2015, 175, 2366–2375. [Google Scholar] [CrossRef]
  55. Mansouri, H.; Bagheri, M. Induction of Polyploidy and Its Effect on Cannabis sativa L. In Cannabis sativa L.—Botany and Biotechnology; Chandra, S., Lata, H., ElSohly, M.A., Eds.; Springer International Publishing: Berlin/Heidelberg, Germany, 2017; pp. 365–383. ISBN 9783319545646. [Google Scholar]
  56. Galán-Ávila, A.; García-Fortea, E.; Prohens, J.; Herraiz, F.J. Development of a Direct in vitro Plant Regeneration Protocol From Cannabis sativa L. Seedling Explants: Developmental Morphology of Shoot Regeneration and Ploidy Level of Regenerated Plants. Front. Plant Sci. 2020, 11, 645. [Google Scholar] [CrossRef] [PubMed]
  57. Kurtz, L.E.; Brand, M.H.; Lubell-Brand, J.D. Production of tetraploid and triploid hemp. HortScience 2020, 55, 1703–1707. [Google Scholar] [CrossRef]
  58. Lynch, R.C.; Vergara, D.; Tittes, S.; White, K.; Schwartz, C.J.; Gibbs, M.J.; Ruthenburg, T.C.; DeCesare, K.; Land, D.P.; Kane, N.C. Genomic and Chemical Diversity in Cannabis. CRC. Crit. Rev. Plant Sci. 2016, 35, 349–363. [Google Scholar] [CrossRef]
  59. McPhee, H.C. The genetics of sex in Hemp. J. Agric. Res. 1926, 31, 935–943. [Google Scholar]
  60. Westergaard, M. The Mechanism of Sex Determination in Dioecious Flowering Plants. Adv. Genet. 1958, 9, 217–281. [Google Scholar] [CrossRef] [PubMed]
  61. Sakamoto, K.; Abe, T.; Matsuyama, T.; Yoshida, S.; Ohmido, N.; Fukui, K.; Satoh, S. RAPD markers encoding retrotransposable elements are linked to the male sex in Cannabis sativa L. Genome 2005, 48, 931–936. [Google Scholar] [CrossRef] [PubMed] [Green Version]
  62. Mandolino, G.; Carboni, A.; Forapani, S.; Faeti, V.; Ranalli, P. Identification of DNA markers linked to the male sex in dioecious hemp (Cannabis sativa L.). Theor. Appl. Genet. 1999, 98, 86–92. [Google Scholar] [CrossRef]
  63. Flachowsky, H.; Schumann, E.; Weber, W.E.; Peil, A. Application of AFLP for the detection of sex-specific markers in hemp. Plant Breed. 2001, 120, 305–309. [Google Scholar] [CrossRef]
  64. Törjék, O.; Bucherna, N.; Kiss, E.; Homoki, H.; Finta-Korpelová, Z.; Bócsa, I.; Nagy, I.; Heszky, L.E. Novel male-specific molecular markers (MADC5, MADC6) in hemp. Euphytica 2002, 127, 209–218. [Google Scholar] [CrossRef]
  65. Peil, A.; Flachowsky, H.; Schumann, E.; Weber, W.E. Sex-linked AFLP markers indicate a pseudoautosomal region in hemp (Cannabis sativa L.). Theor. Appl. Genet. 2003, 107, 102–109. [Google Scholar] [CrossRef]
  66. Sakamoto, K.; Shimomura, K.; Komeda, Y.; Kamada, H.; Satoh, S. A Male-Associated DNA Sequence in a Dioecious Plant, Cannabis sativa L. Plant Cell Physiol. 1995, 36, 1549–1554. [Google Scholar] [CrossRef] [Green Version]
  67. Toth, J.A.; Stack, G.M.; Cala, A.R.; Carlson, C.H.; Wilk, R.L.; Crawford, J.L.; Viands, D.R.; Philippe, G.; Smart, C.D.; Rose, J.K.C.; et al. Development and validation of genetic markers for sex and cannabinoid chemotype in Cannabis sativa L. GCB Bioenergy 2020, 12, 213–222. [Google Scholar] [CrossRef] [Green Version]
  68. Mandolino, G.; Carboni, A. Potential of marker-assisted selection in hemp genetic improvement. Euphytica 2004, 140, 107–120. [Google Scholar] [CrossRef]
  69. Doležel, J.; Greilhuber, J.; Lucretti, S.; Meister, A.; Lysák, M.A.; Nardi, L.; Obermayer, R. Plant genome size estimation by flow cytometry: Inter-laboratory comparison. Ann. Bot. 1998, 82, 17–26. [Google Scholar] [CrossRef]
  70. Šmarda, P.; Bureš, P. Intraspecific DNA content variability in Festuca pallens on different geographical scales and ploidy levels. Ann. Bot. 2006, 98, 665–678. [Google Scholar] [CrossRef] [Green Version]
  71. Slovák, M.; Vít, P.; Urfus, T.; Suda, J. Complex pattern of genome size variation in a polymorphic member of the Asteraceae. J. Biogeogr. 2009, 36, 372–384. [Google Scholar] [CrossRef]
  72. Suda, J.; Weiss-Schneeweiss, H.; Tribsch, A.; Schneeweiss, G.M.; Trávníček, P.; Schönswetter, P. Complex distribution patterns of di-, tetra-, and hexaploid cytotypes in the European high mountain plant Senecio carniolicus (Asteraceae). Am. J. Bot. 2007, 94, 1391–1401. [Google Scholar] [CrossRef] [Green Version]
  73. Cires, E.; Cuesta, C.; Revilla, M.Á.; Fernández Prieto, J.A. Intraspecific genome size variation and morphological differentiation of Ranunculus parnassifolius (Ranunculaceae), an Alpine-Pyrenean-Cantabrian polyploid group. Biol. J. Linn. Soc. 2010, 101, 251–271. [Google Scholar] [CrossRef] [Green Version]
  74. Vít, P.; Krak, K.; Trávníček, P.; Douda, J.; Lomonosova, M.N.; Mandák, B. Genome size stability across Eurasian Chenopodium species (Amaranthaceae). Bot. J. Linn. Soc. 2016, 182, 637–649. [Google Scholar] [CrossRef] [Green Version]
  75. Kolano, B.; Siwinska, D.; Pando, L.G.; Szymanowska-Pulka, J.; Maluszynska, J. Genome size variation in Chenopodium quinoa (Chenopodiaceae). Plant Syst. Evol. 2012, 298, 251–255. [Google Scholar] [CrossRef] [Green Version]
  76. Li, W.; Liu, L.; Wang, Y.; Fan, G.; Zhang, S.; Wang, Y.; Liao, K. Determination of genome size and chromosome ploidy of selected taxa from Prunus armeniaca by flow cytometry. Sci. Hortic. (Amsterdam) 2020, 261, 108987. [Google Scholar] [CrossRef]
  77. Šlenker, M.; Zozomová-Lihová, J.; Mandáková, T.; Kudoh, H.; Zhao, Y.; Soejima, A.; Yahara, T.; Skokanová, K.; Španiel, S.; Fls, K.M. Morphology and genome size of the widespread weed Cardamine occulta: How it differs from cleistogamic C. kokaiensis and other closely related taxa in Europe and Asia. Bot. J. Linn. Soc. 2018, 187, 456–482. [Google Scholar] [CrossRef]
  78. Pisupati, R.; Vergara, D.; Kane, N.C. Diversity and evolution of the repetitive genomic content in Cannabis sativa. BMC Genom. 2018, 19, 156. [Google Scholar] [CrossRef] [PubMed] [Green Version]
  79. Schnable, P.S.; Ware, D.; Fulton, R.S.; Stein, J.C.; Wei, F.; Pasternak, S.; Liang, C.; Zhang, J.; Fulton, L.; Graves, T.A.; et al. The B73 maize genome: Complexity, diversity, and dynamics. Science 2009, 326, 1112–1115. [Google Scholar] [CrossRef] [PubMed]
  80. Quesneville, H. Twenty years of transposable element analysis in the Arabidopsis thaliana genome. Mob. DNA 2020, 11, 28. [Google Scholar] [CrossRef] [PubMed]
  81. Schmuths, H.; Meister, A.; Horres, R.; Bachmann, K. Genome size variation among accessions of Arabidopsis thaliana. Ann. Bot. 2004, 93, 317–321. [Google Scholar] [CrossRef] [PubMed] [Green Version]
  82. Loureiro, J.; Rodriguez, E.; Doležel, J.; Santos, C. Flow cytometric and microscopic analysis of the effect of tannic acid on plant nuclei and estimation of DNA content. Ann. Bot. 2006, 98, 515–527. [Google Scholar] [CrossRef] [PubMed] [Green Version]
  83. Sharma, S.; Kaushik, S.; Raina, S.N. Estimation of nuclear DNA content and its variation among Indian Tea accessions by flow cytometry. Physiol. Mol. Biol. Plants 2019, 25, 339–346. [Google Scholar] [CrossRef]
  84. Noirot, M.; Barre, P.; Louarn, J.; Duperray, C.; Hamon, S. Nucleus-cytosol interactions—A source of stoichiometric error in flow cytometric estimation of nuclear DNA content in plants. Ann. Bot. 2000, 86, 309–316. [Google Scholar] [CrossRef] [Green Version]
  85. Noirot, M.; Barre, P.; Duperray, C.; Louarn, J.; Hamon, S. Effects of caffeine and chlorogenic acid on propidium iodide accessibility to DNA: Consequences on genome size evaluation in coffee tree. Ann. Bot. 2003, 92, 259–264. [Google Scholar] [CrossRef] [Green Version]
  86. Bennett, M.D.; Price, H.J.; Johnston, J.S. Anthocyanin inhibits propidium iodide DNA fluorescence in Euphorbia pulcherrima: Implications for genome size variation and flow cytometry. Ann. Bot. 2008, 101, 777–790. [Google Scholar] [CrossRef]
  87. Price, H.J.; Hodnett, G.; Johnston, J.S. Sunflower (Helianthus annuus) leaves contain compounds that reduce nuclear propidium iodide fluorescence. Ann. Bot. 2000, 86, 929–934. [Google Scholar] [CrossRef] [Green Version]
  88. Akagi, T.; Jung, K.; Masuda, K.; Shimizu, K.K. Polyploidy before and after domestication of crop species. Curr. Opin. Plant Biol. 2022, 69, 102255. [Google Scholar] [CrossRef]
  89. Salman-Minkov, A.; Sabath, N.; Mayrose, I. Whole-genome duplication as a key factor in crop domestication. Nat. Plants 2016, 2, 16115. [Google Scholar] [CrossRef]
  90. Peng, Y.; Yan, H.; Guo, L.; Deng, C.; Wang, C.; Wang, Y.; Kang, L.; Zhou, P.; Yu, K.; Dong, X.; et al. Reference genome assemblies reveal the origin and evolution of allohexaploid oat. Nat. Genet. 2022, 54, 1248–1258. [Google Scholar] [CrossRef]
  91. Peng, J.H.; Sun, D.; Nevo, E. Domestication evolution, genetics and genomics in wheat. Mol. Breed. 2011, 28, 281–301. [Google Scholar] [CrossRef]
  92. Yang, J.; Moeinzadeh, M.H.; Kuhl, H.; Helmuth, J.; Xiao, P.; Haas, S.; Liu, G.; Zheng, J.; Sun, Z.; Fan, W.; et al. Haplotype-resolved sweet potato genome traces back its hexaploidization history. Nat. Plants 2017, 3, 696–703. [Google Scholar] [CrossRef]
  93. Qi, X.; An, H.; Hall, T.E.; Di, C.; Blischak, P.D.; McKibben, M.T.W.; Hao, Y.; Conant, G.C.; Pires, J.C.; Barker, M.S. Genes derived from ancient polyploidy have higher genetic diversity and are associated with domestication in Brassica rapa. New Phytol. 2021, 230, 372–386. [Google Scholar] [CrossRef]
  94. Šimoníková, D.; Nĕmečková, A.; Čížková, J.; Brown, A.; Swennen, R.; Doležel, J.; Hřibová, E. Chromosome painting in cultivated bananas and their wild relatives (Musa spp.) reveals differences in chromosome structure. Int. J. Mol. Sci. 2020, 21, 7915. [Google Scholar] [CrossRef]
  95. Hesami, M.; Baiton, A.; Alizadeh, M.; Pepe, M.; Torkamaneh, D.; Phineas Jones, A.M. Advances and Perspectives in Tissue Culture and Genetic Engineering of Cannabis. Int. J. Mol. Sci. 2021, 22, 5671. [Google Scholar] [CrossRef]
  96. Romo, A.; Hidalgo, O.; Boratyński, A.; Sobierajska, K.; Jasińska, A.K.; Vallès, J.; Garnatje, T. Genome size and ploidy levels in highly fragmented habitats: The case of western Mediterranean Juniperus (Cupressaceae) with special emphasis on J. thurifera L. Tree Genet. Genomes 2013, 9, 587–599. [Google Scholar] [CrossRef]
  97. Marie, D.; Brown, S.C. A cytometric exercise in plant DNA histograms, with 2C values for 70 species. Biol. Cell 1993, 78, 41–51. [Google Scholar] [CrossRef]
  98. Vagera, J.; Paulíková, D.; Doležel, J. The Development of Male and Female Regenerants by In Vitro Androgenesis in Dioecious Plant Melandrium album. Ann. Bot. 1994, 73, 455–459. [Google Scholar] [CrossRef]
  99. Błocka-Wandas, M.; Sliwinska, E.; Grabowska-Joachimiak, A.; Musial, K.; Joachimiak, A.J. Male gametophyte development and two different DNA classes of pollen grains in Rumex acetosa L., a plant with an XX/XY1Y2 sex chromosome system and a female-biased sex ratio. Sex. Plant Reprod. 2007, 20, 171–180. [Google Scholar] [CrossRef]
  100. Grabowska-Joachimiak, A.; Kula, A.; Książczyk, T.; Chojnicka, J.; Sliwinska, E.; Joachimiak, A.J. Chromosome landmarks and autosome-sex chromosome translocations in Rumex hastatulus, a plant with XX/XY1Y2 sex chromosome system. Chromosom. Res. 2015, 23, 187–197. [Google Scholar] [CrossRef] [Green Version]
  101. Sousa, A.; Fuchs, J.; Renner, S.S. Molecular cytogenetics (FISH, GISH) of Coccinia grandis: A ca. 3 myr-old species of cucurbitaceae with the largest Y/autosome divergence in flowering plants. Cytogenet. Genome Res. 2013, 139, 107–118. [Google Scholar] [CrossRef] [Green Version]
  102. Charlesworth, D. Plant sex determination and sex chromosomes. Heredity (Edinb.) 2002, 88, 94–101. [Google Scholar] [CrossRef]
  103. Razumova, O.V.; Divashuk, M.G.; Alexandrov, O.S.; Karlov, G.I. GISH painting of the Y chromosomes suggests advanced phases of sex chromosome evolution in three dioecious Cannabaceae species (Humulus lupulus, H. japonicus, and Cannabis sativa). Protoplasma 2022. [Google Scholar] [CrossRef]
  104. Obermayer, R.; Leitch, I.J.; Hanson, L.; Bennett, M.D. Nuclear DNA C-values in 30 species double the familial representation in pteridophytes. Ann. Bot. 2002, 90, 209–217. [Google Scholar] [CrossRef] [Green Version]
  105. Doležel, J.; Binarová, P.; Lucretti, S. Analysis of Nuclear DNA content in plant cells by Flow cytometry. Biol. Plant. 1989, 31, 113–120. [Google Scholar] [CrossRef]
  106. Ebihara, A.; Ishikawa, H.; Matsumoto, S.; Lin, S.J.; Iwatsuki, K.; Takamiya, M.; Watano, Y.; Ito, M. Nuclear DNA, chloroplast DNA, and ploidy analysis clarified biological complexity of the Vandenboschia radicans complex (Hymenophyllaceae) in Japan and adjacent areas. Am. J. Bot. 2005, 92, 1535–1547. [Google Scholar] [CrossRef]
  107. Loureiro, J.; Rodriguez, E.; Doležel, J.; Santos, C. Two new nuclear isolation buffers for plant DNA flow cytometry: A test with 37 species. Ann. Bot. 2007, 100, 875–888. [Google Scholar] [CrossRef] [Green Version]
  108. Pellicer, J.; Powell, R.F.; Leitch, I.J. The Application of Flow Cytometry for Estimating Genome Size, Ploidy Level Endopolyploidy, and Reproductive Modes in Plants. In Molecular Plant Taxonomy: Methods and Protocols; Besse, P., Ed.; Springer: New York, NY, USA, 2021; pp. 325–361. ISBN 9781071609972. [Google Scholar]
  109. Doležel, J.; Greilhuber, J.; Suda, J. Estimation of nuclear DNA content in plants using flow cytometry. Nat. Protoc. 2007, 2, 2233–2244. [Google Scholar] [CrossRef]
  110. Doyle, J.; Doyle, J.L. Genomic plant DNA preparation from fresh tissue-CTAB method. Phytochem. Bull. 1987, 19, 1–15. [Google Scholar]
  111. R Core Team. R: A Language and Environment for Statistical Computing; R Foundation for Statistical Computing: Vienna, Austria, 2019. [Google Scholar]
Figure 1. (A) Boxplots showing the distribution of genome size in diploid Cannabis individuals in different distribution areas. (B) Map of the areas of origin of the sampled accessions. (C) Boxplots showing the distribution of genome size in Cannabis individuals per accessions (the star indicates the genome size of the triploid individual found in the accession IND1—North India).
Plants 11 02736 g001
Figure 2. Flow histograms obtained from analysing (A) diploid Cannabis individual (accession KAZ, Kazakhstan) (peak 1) and (B) triploid Cannabis individual (accession IND1, North India), using Petroselinum crispum (4.5 pg/2C, peak 2) as the internal standard. (C) Flow histogram obtained from co-processing diploid individuals from accessions MN6 (Mongolia) and IND2 (South India).
Plants 11 02736 g002
Figure 3. Somatic metaphase plates of a diploid Cannabis individual from the accession IND4—North India (2n = 20) (A) and a triploid individual from the accession IND1—North India (2n = 30) (B). Scale bars = 10 µm.
Plants 11 02736 g003
Figure 4. Boxplots showing the genome size distribution of female and male Cannabis individuals.
Plants 11 02736 g004
Table 1. Results of ANOVA analysis comparing the effect of accessions, distribution areas, and sex on genome size values of Cannabis.
VariableNo. ind.DFSum Sq.Mean Sq.F Valuep Value
Accessions482
Accession 830.52060.0062723.386<0.001
Residuals 3980.73720.001852
Distribution area482
Distribution area 110.21850.0198638.983<0.001
Residuals 4701.03930.002211
Sex96
Sex 10.03970.0396511.62<0.001
Residuals 940.32080.00341
Table 2. Differences in genome size between male and female individuals in the 15 selected Cannabis accessions. More details of the accessions can be found in the Supplementary Table (Table S1).
Female Genome Size (pg/2C)Male Genome Size (pg/2C)
AccessionNo. ind.MeanSD 1Min.Max.No. ind.MeanSD 1Min.Max.Difference
AM1542.0210.1061.9162.15231.9420.0141.9271.9560.079
AM331.9270.0131.9131.93711.989/1.9891.9890.061
BG311.950/1.9501.95021.9860.0361.9602.0110.036
CAM41.9990.0661.9132.07362.0290.0341.9862.0810.030
HU1131.9130.0171.9021.93221.9230.0001.9221.9230.010
HU961.9390.0341.8751.96841.9970.0681.9202.0720.058
IND222.0350.0571.9952.07562.0360.0301.9802.0670.001
CUL752.0030.0271.9732.04021.9890.0301.9682.0110.014
KAZ61.9140.0451.8691.96351.9570.0311.9332.0060.043
MAR31.9380.0311.9041.96421.9730.0671.9262.0210.036
MN321.9270.0281.9081.94751.9970.0801.9222.1180.069
MN541.9250.0801.8101.97912.016/2.0162.0160.091
RO221.8820.0321.8591.9050/////
RO311.897/1.8971.89751.9470.0161.9321.9740.051
RO542.0210.1061.9162.15231.9420.0141.9271.9560.079
1 SD: standard deviation.
Publisher’s Note: MDPI stays neutral with regard to jurisdictional claims in published maps and institutional affiliations.

