
Antarctic Lichens under Long-Term Passive Warming: Species-Specific Photochemical Responses to Desiccation and Heat Shock Treatments

 ,
,  ,
,
Abstract
:1. Introduction
2. Results
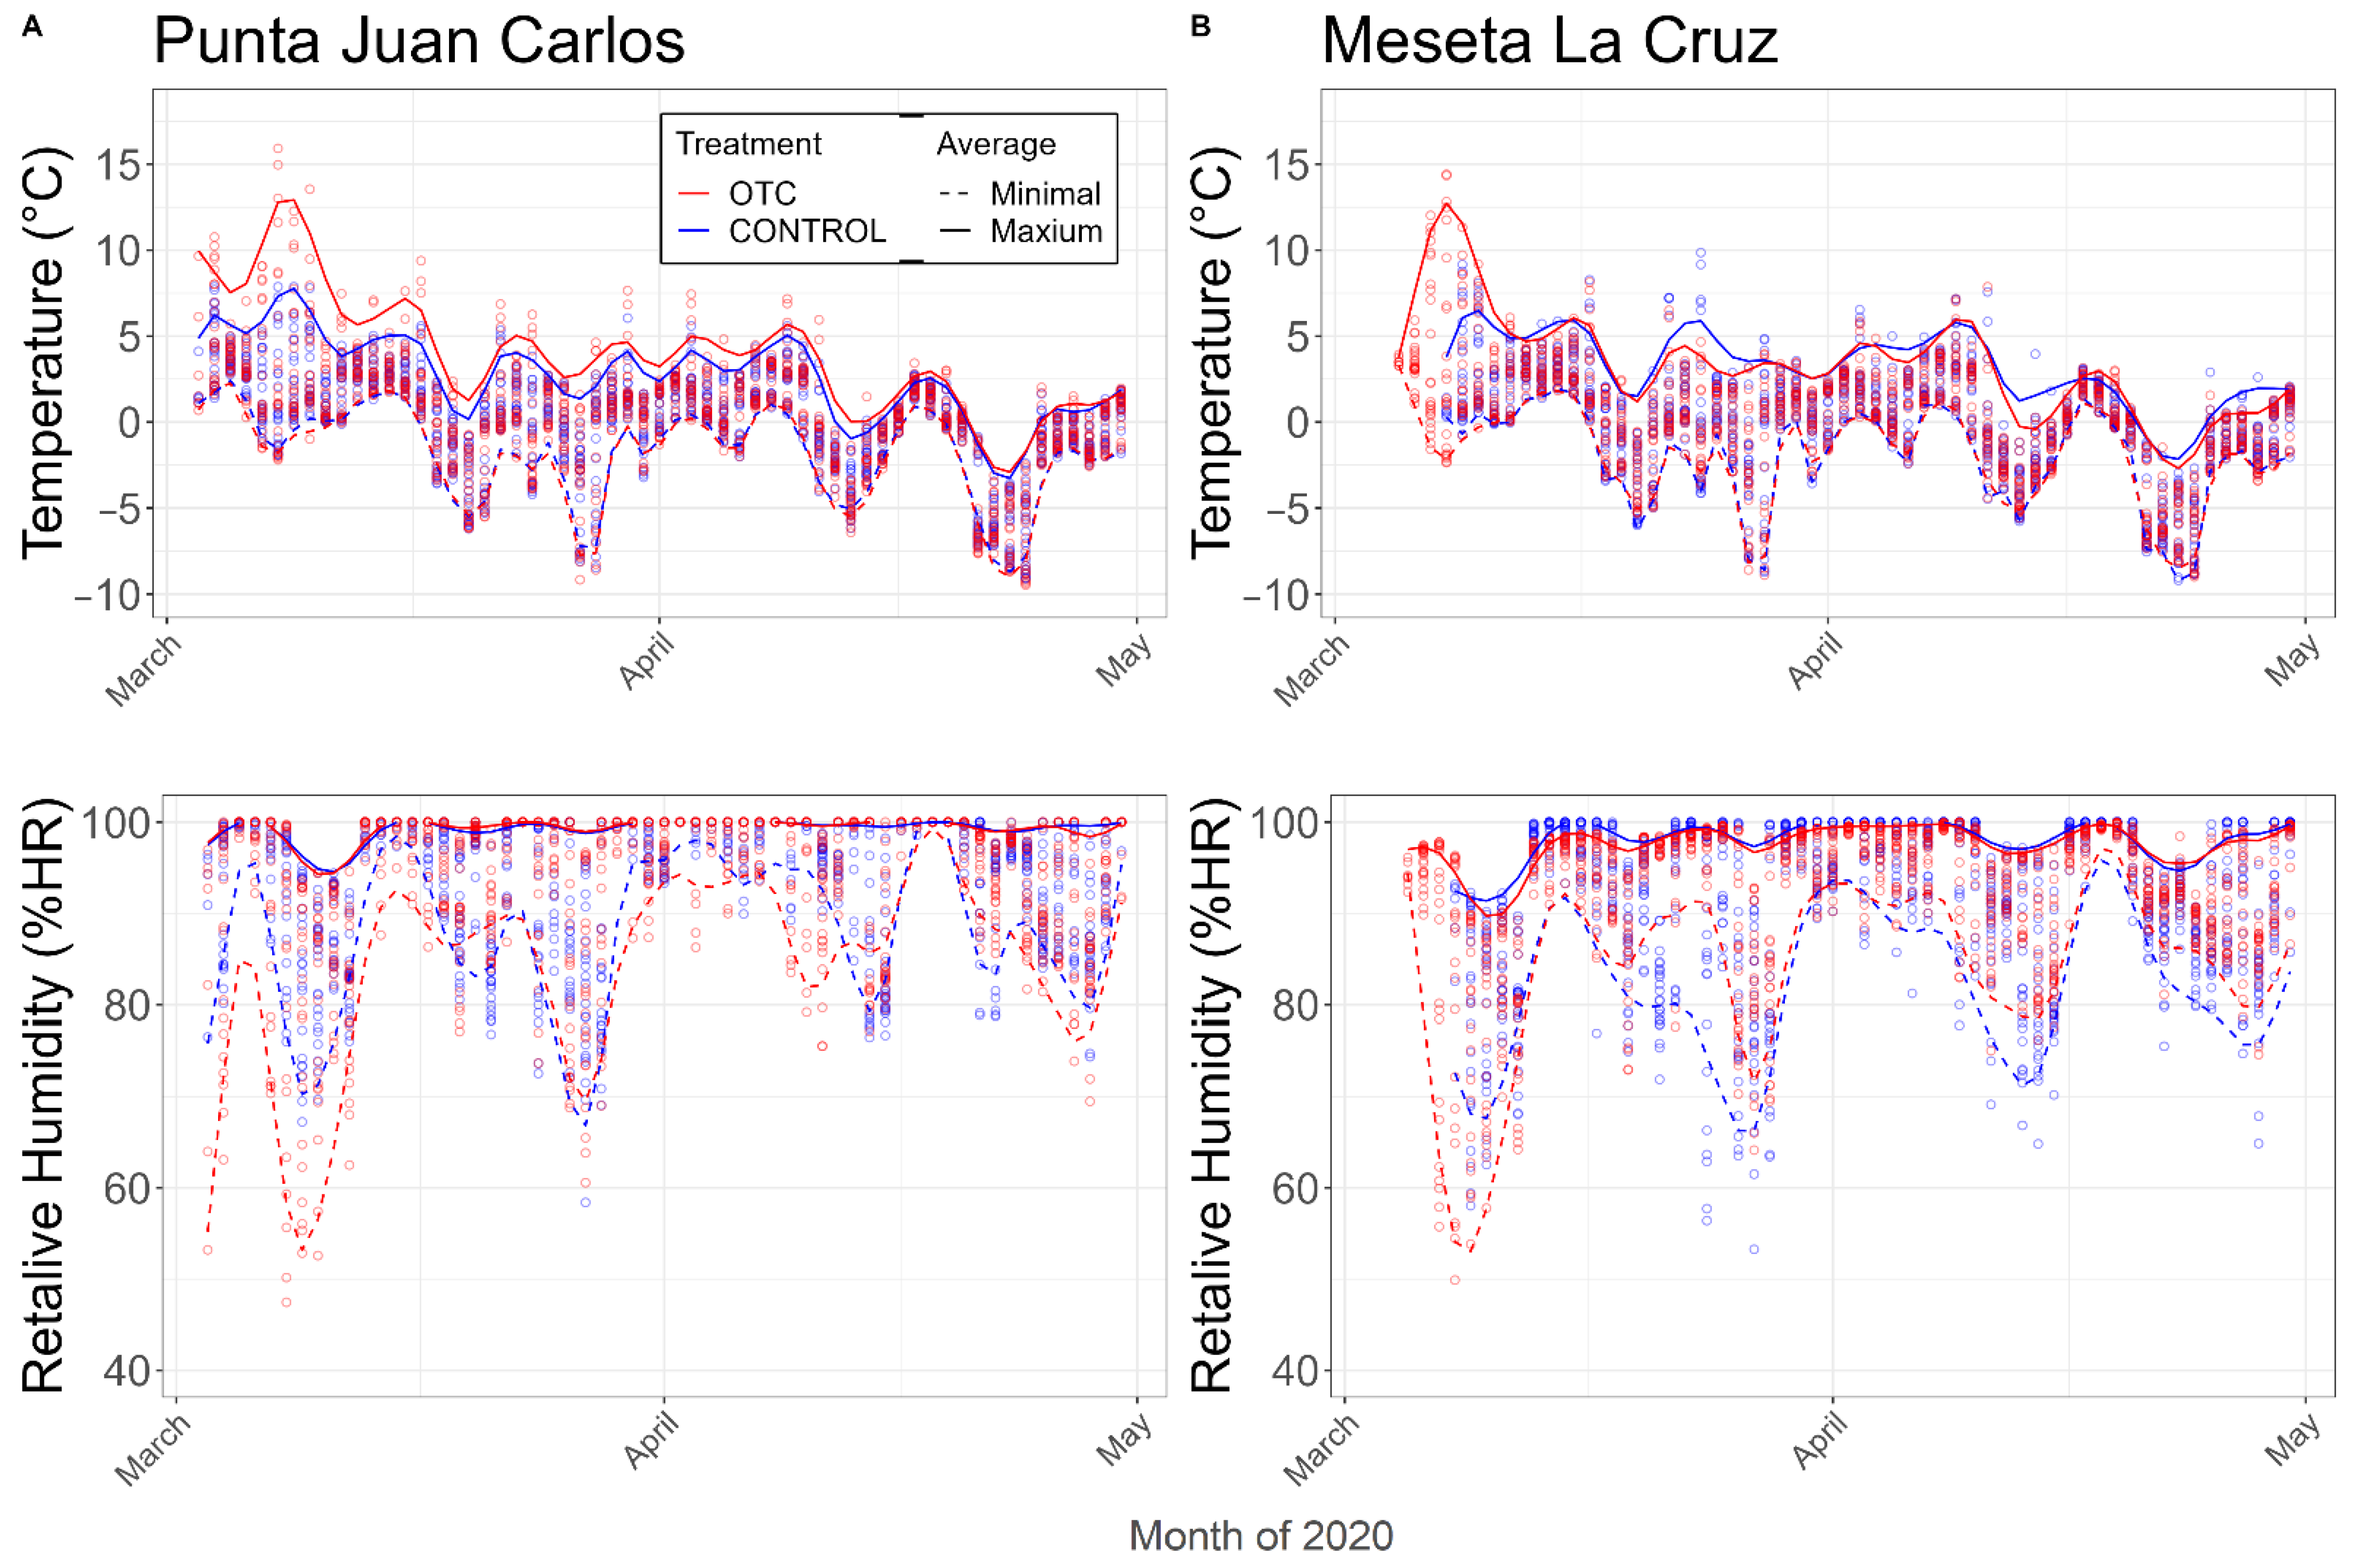
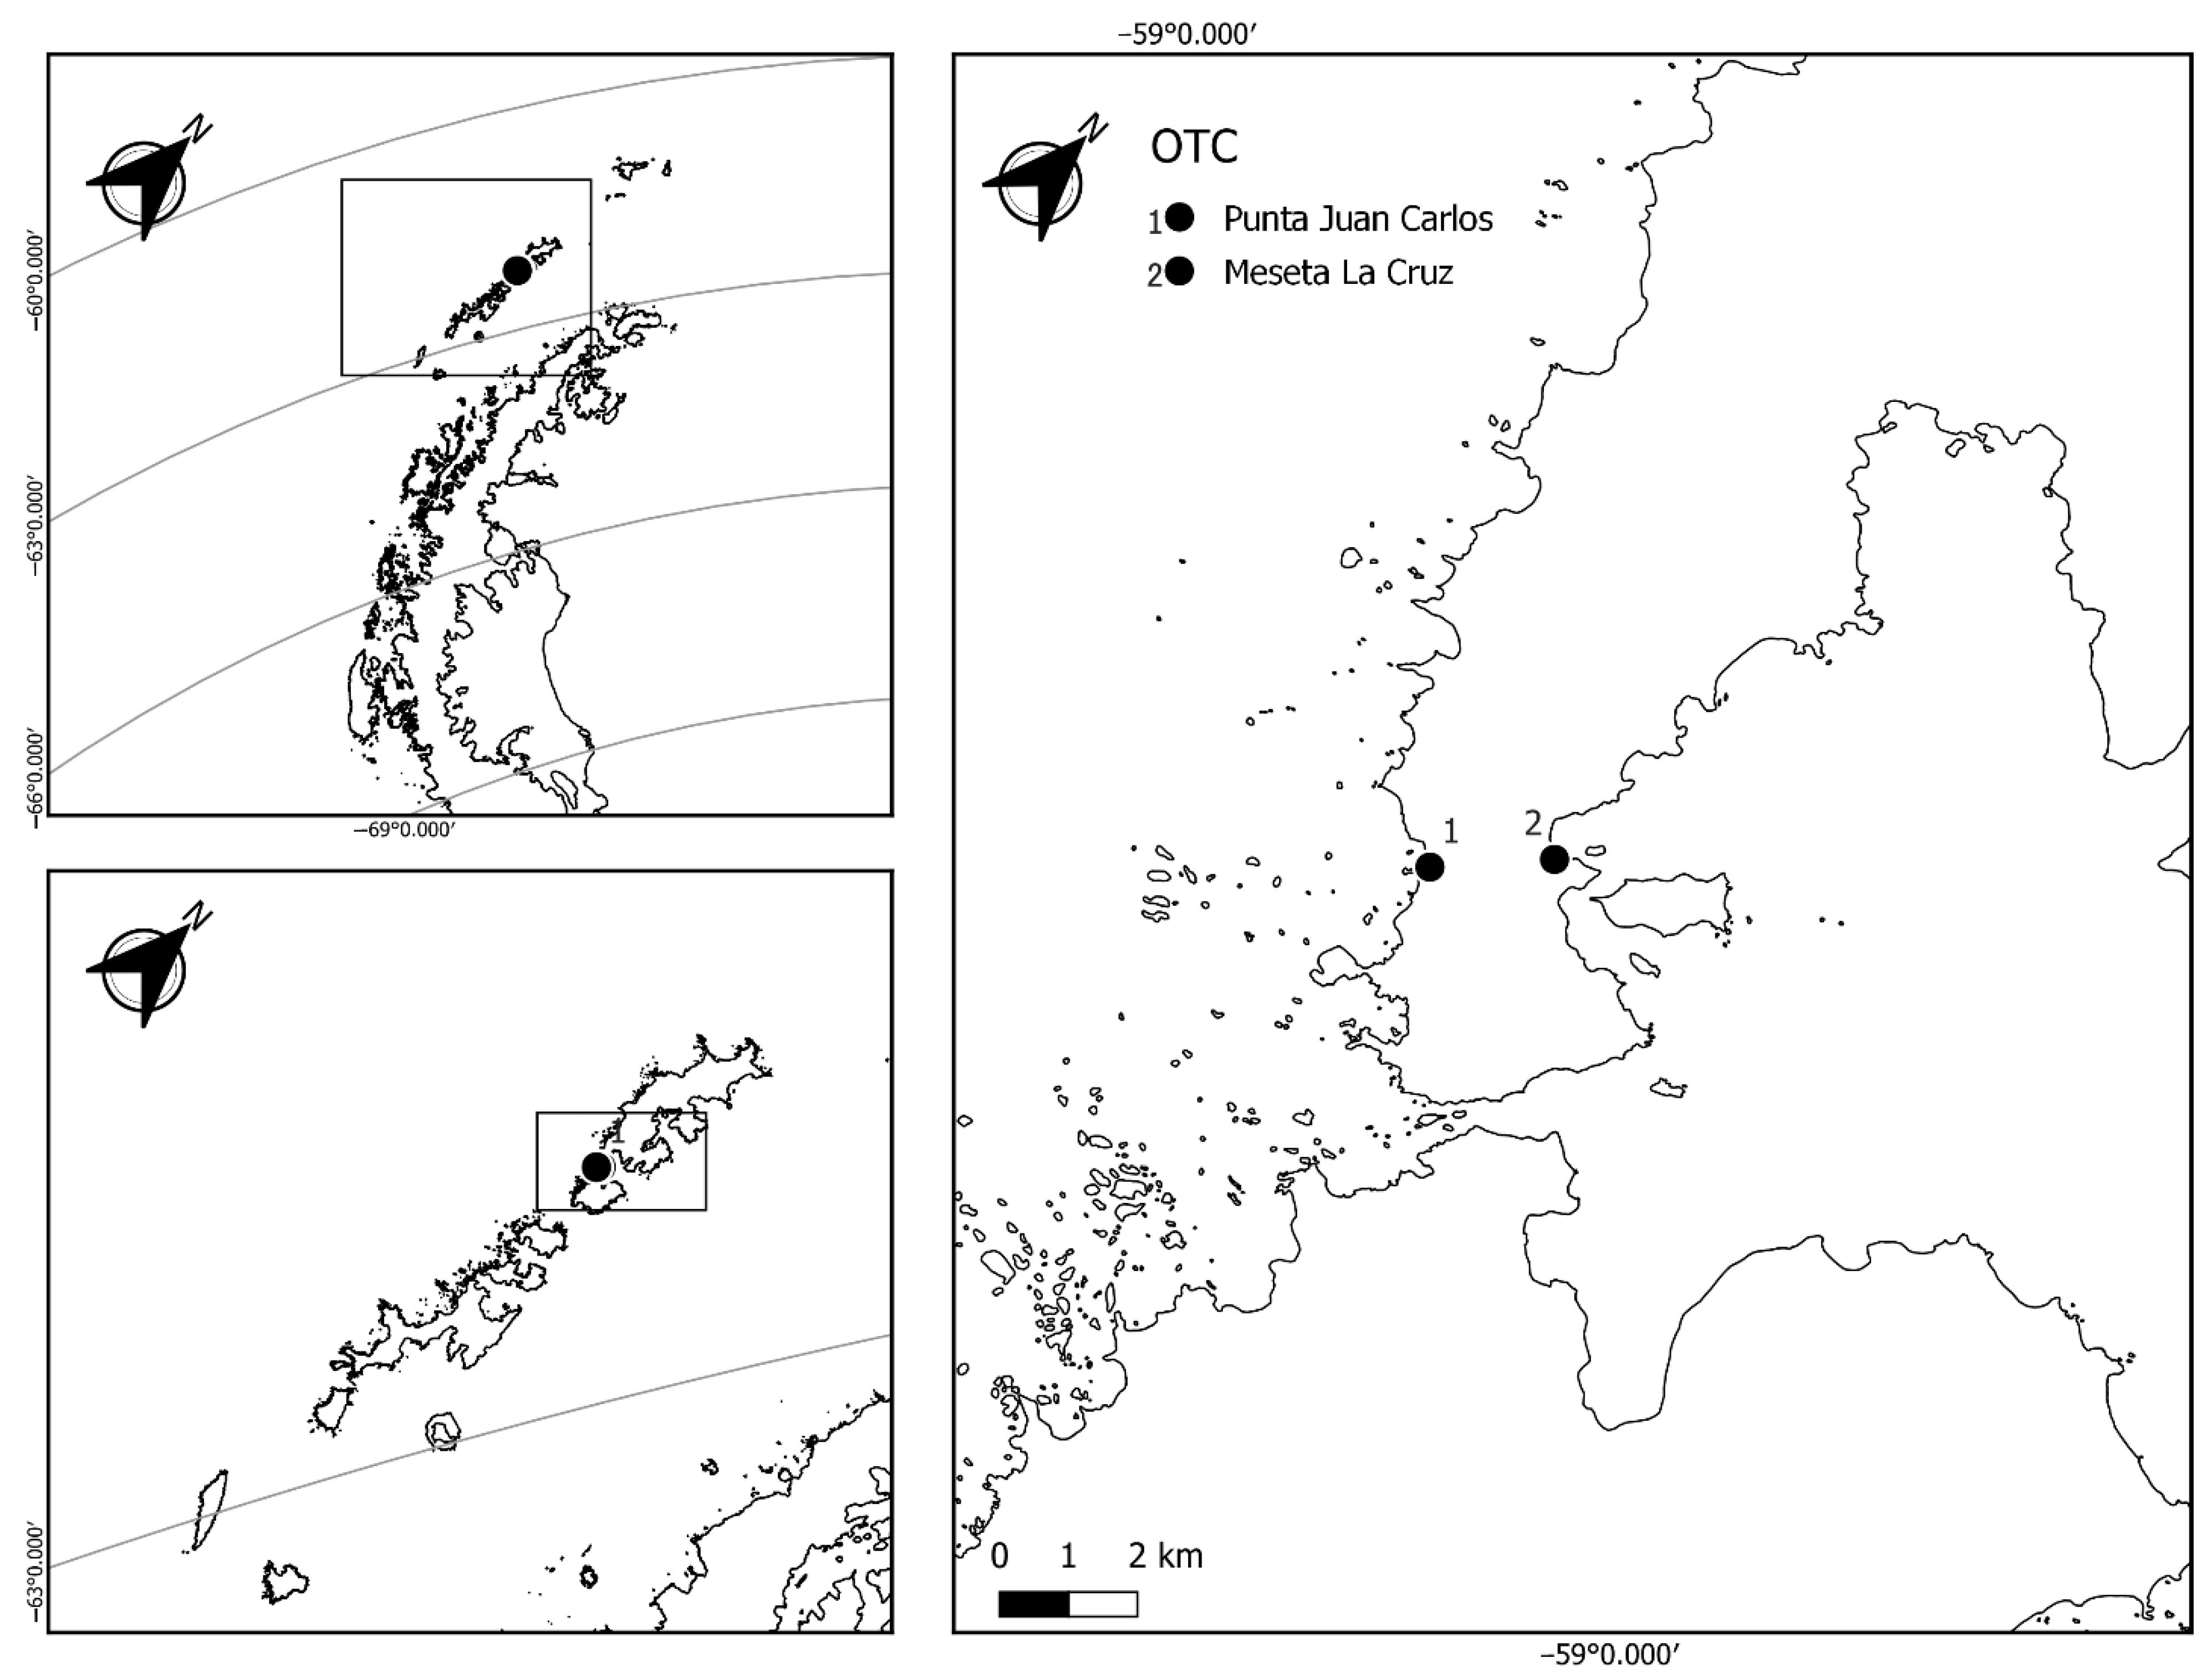
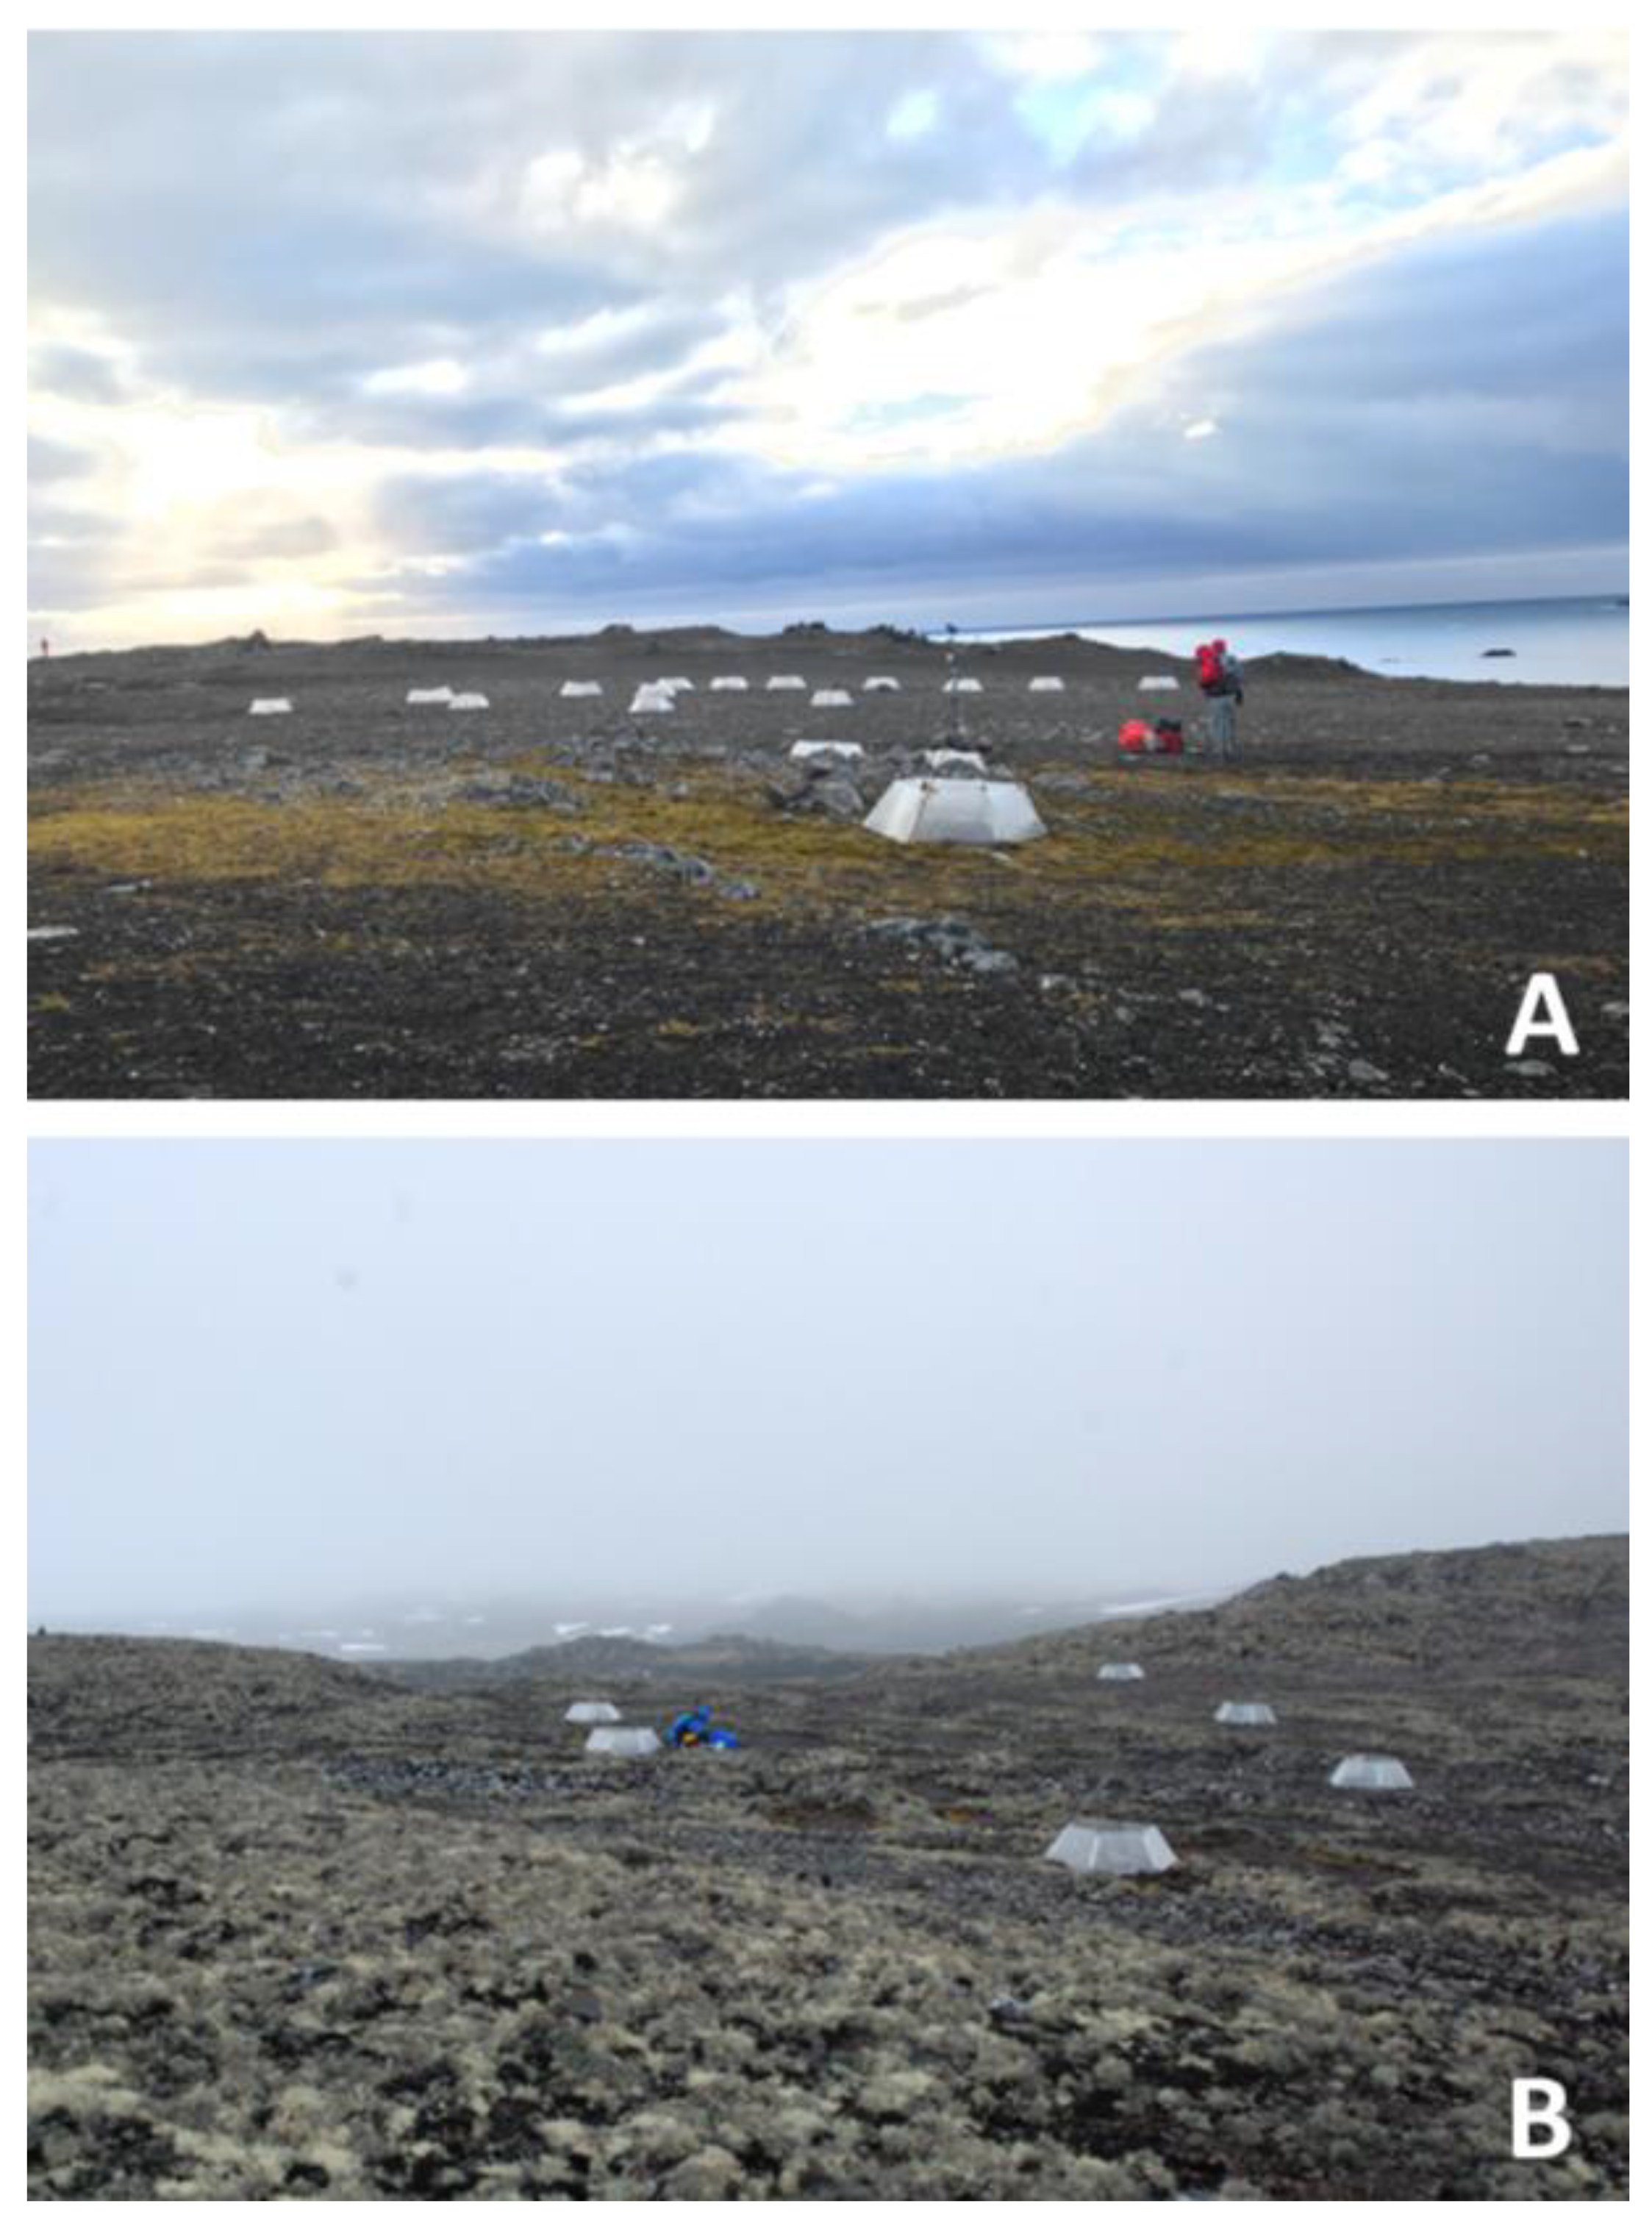
2.1. Microenvironmental Characterization of Study Sites
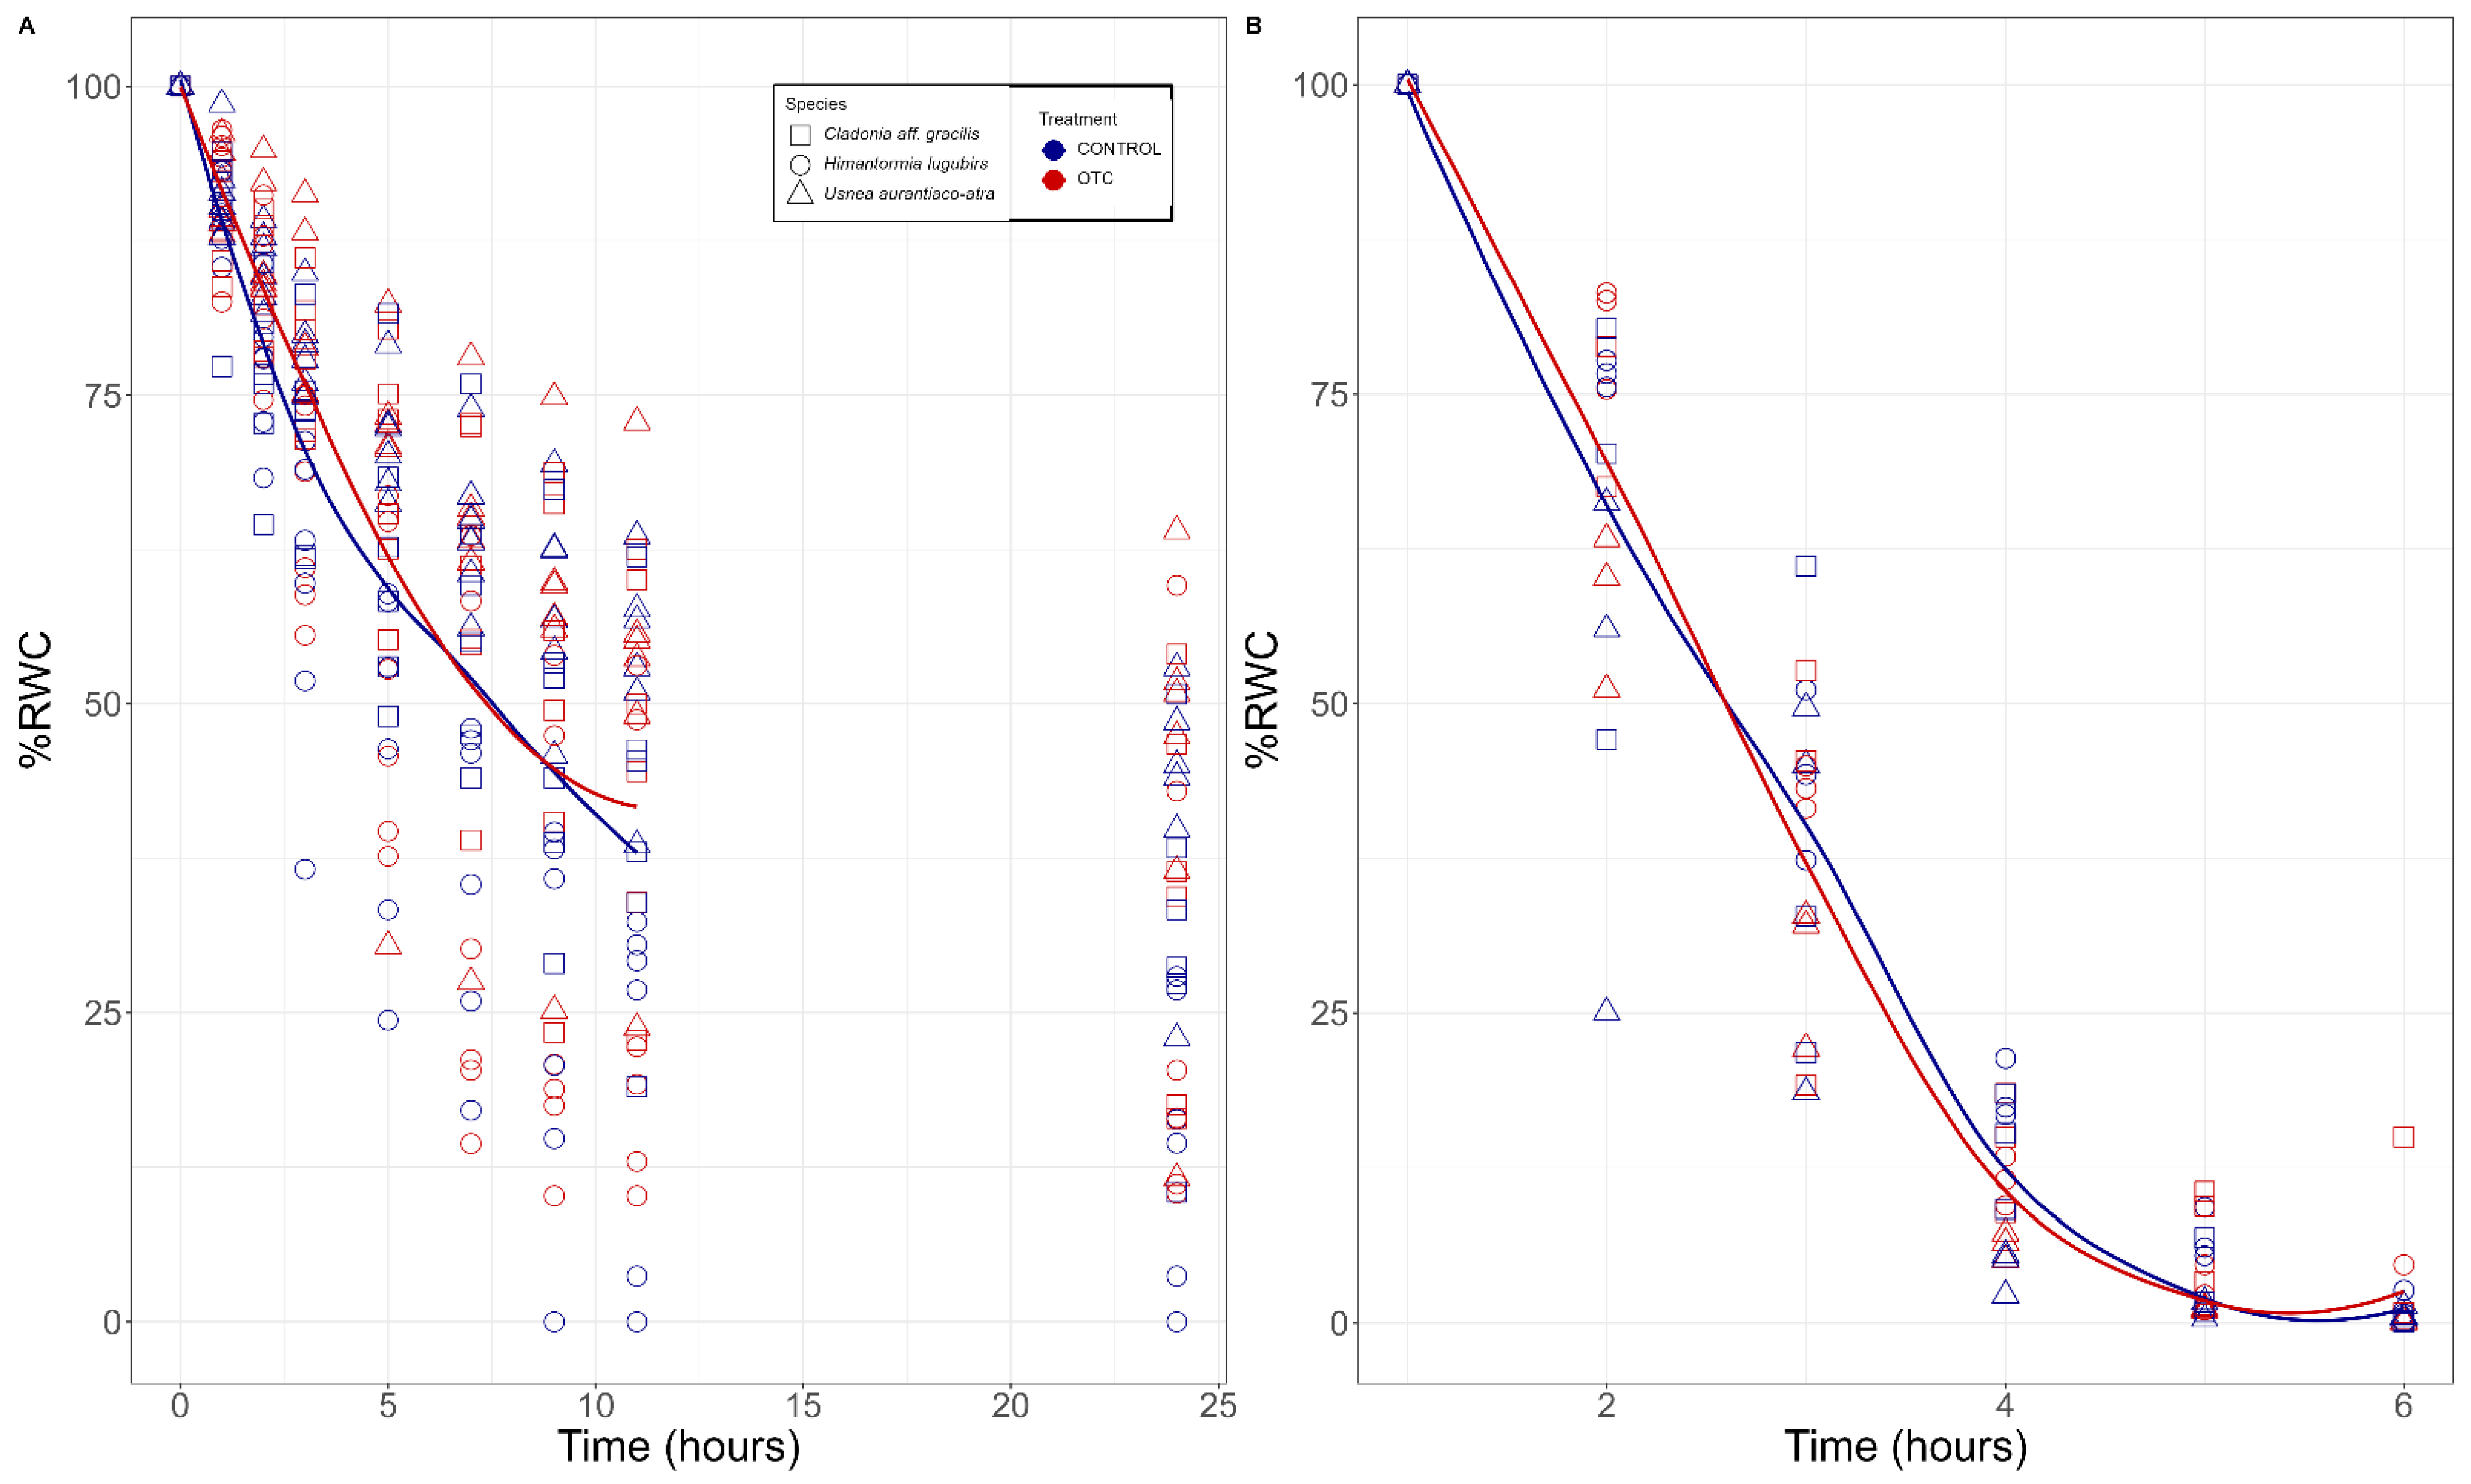
2.2. Desiccation Kinetcs
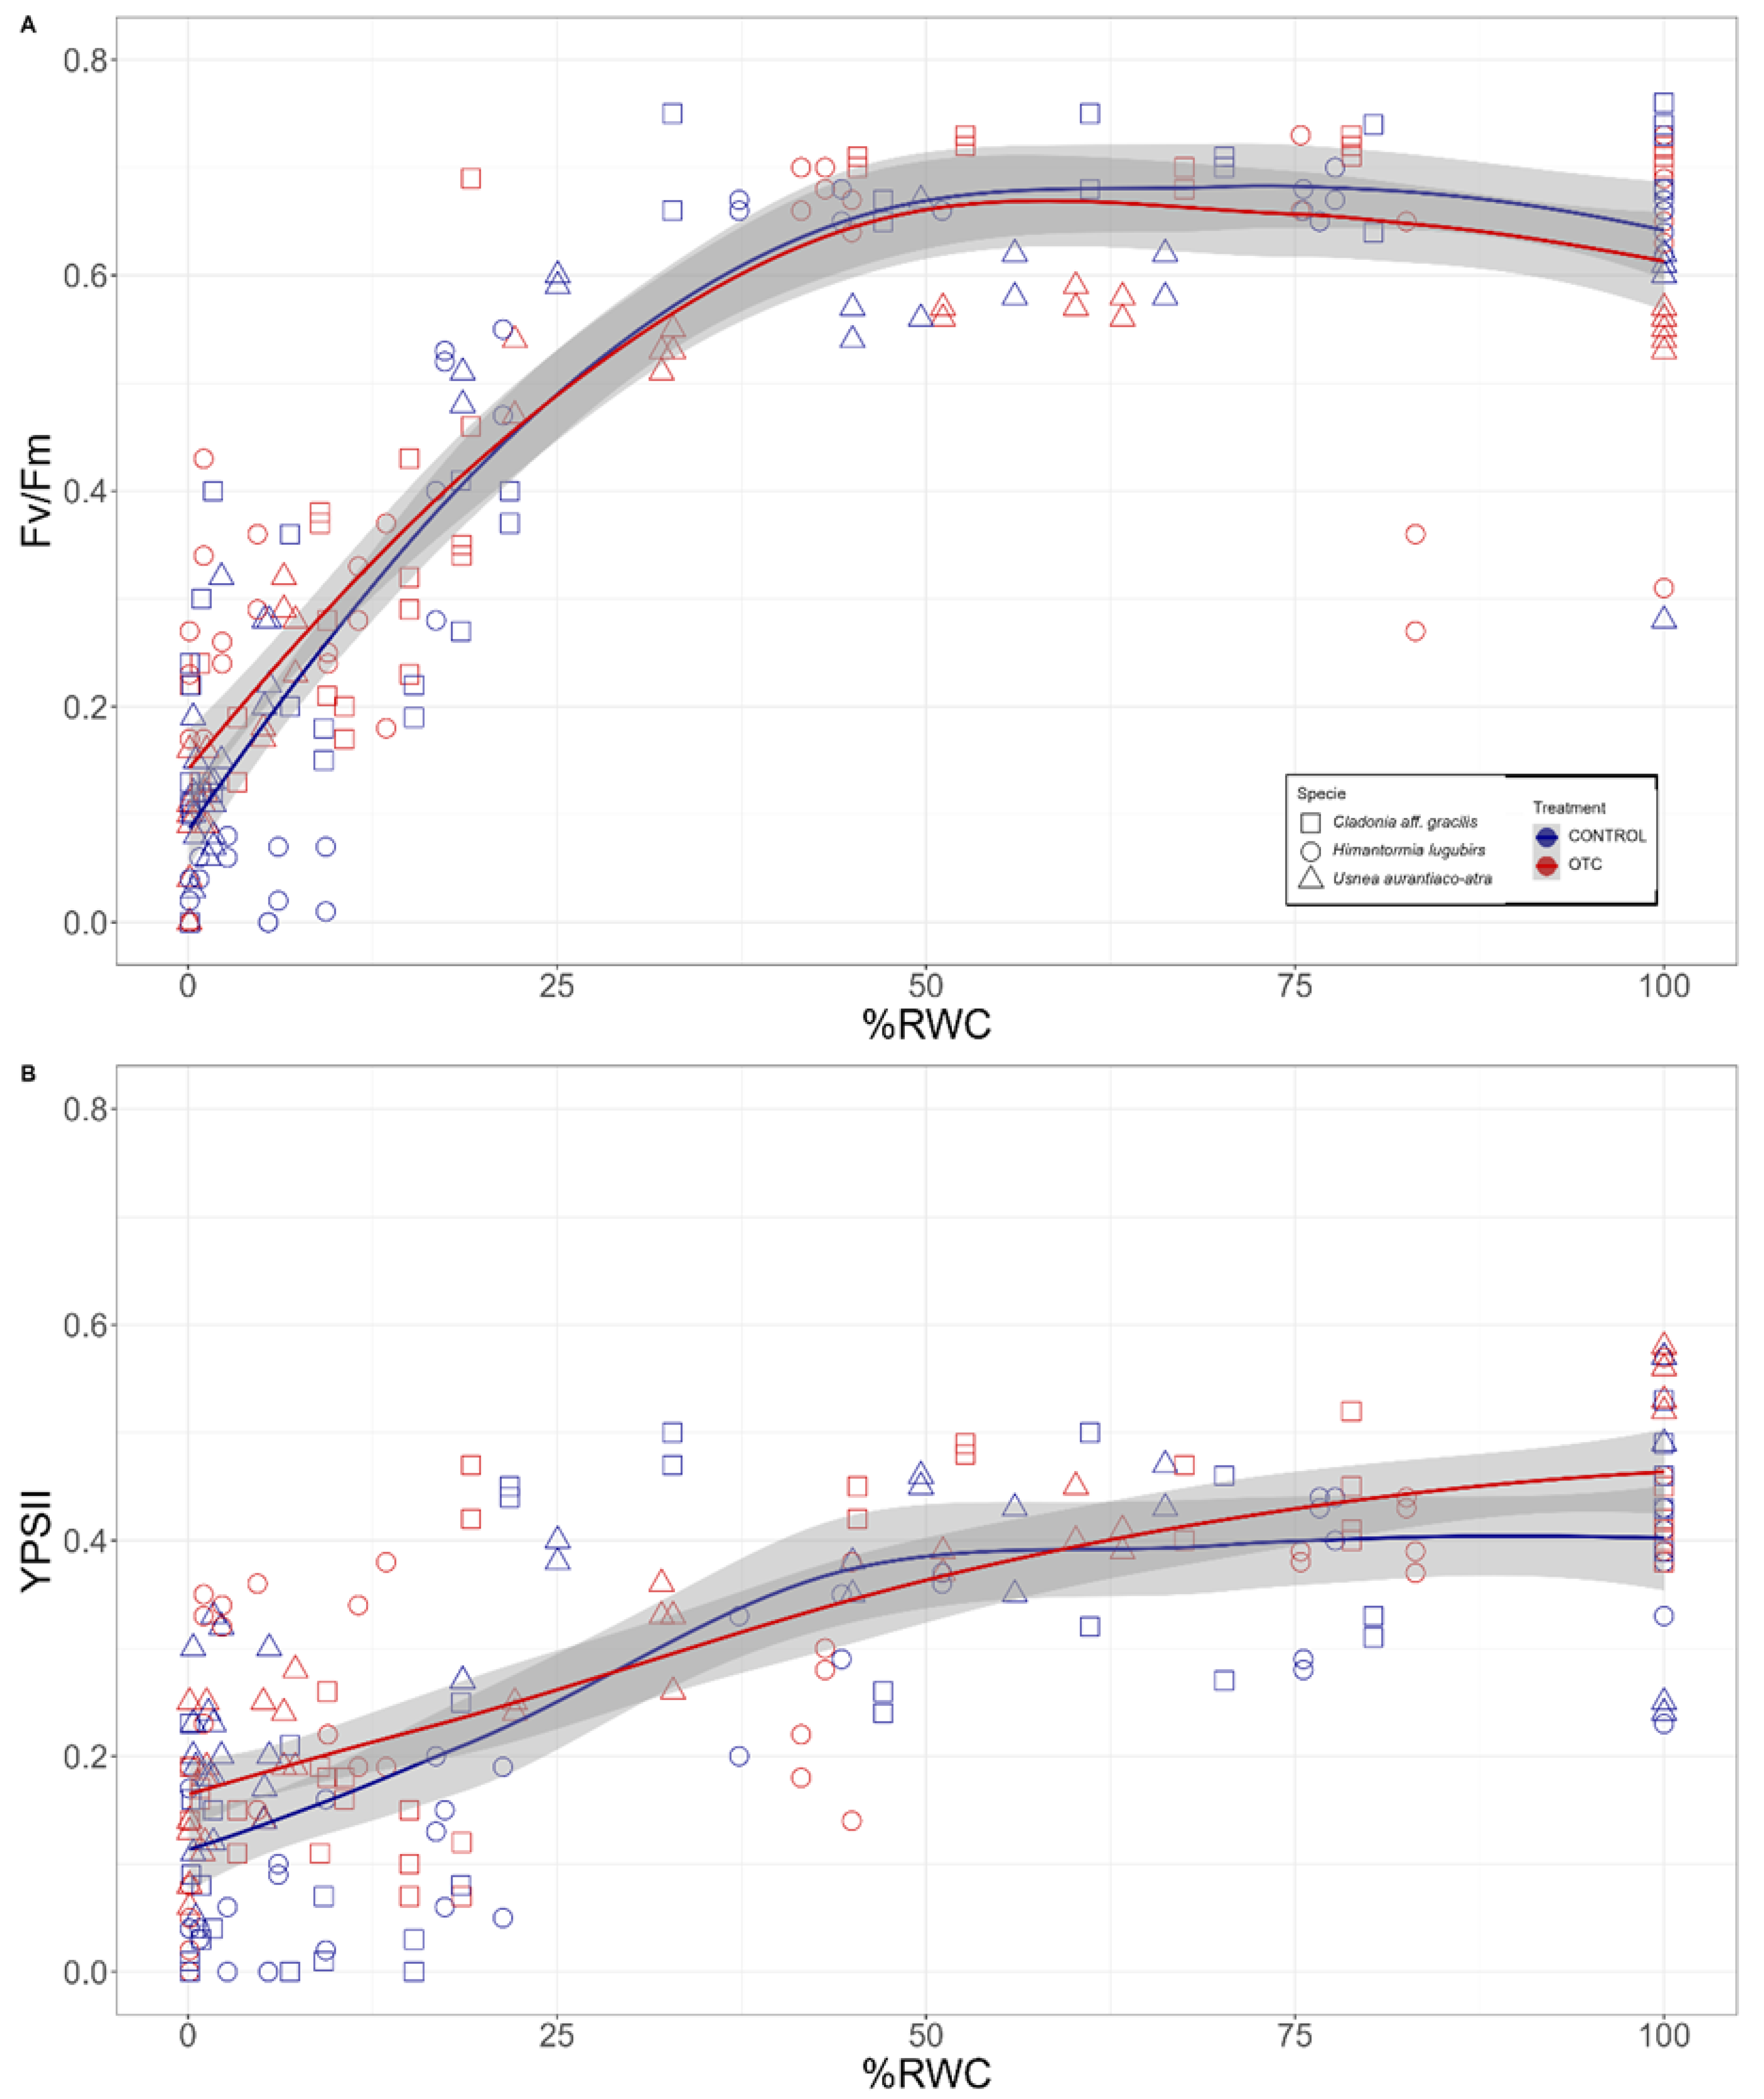
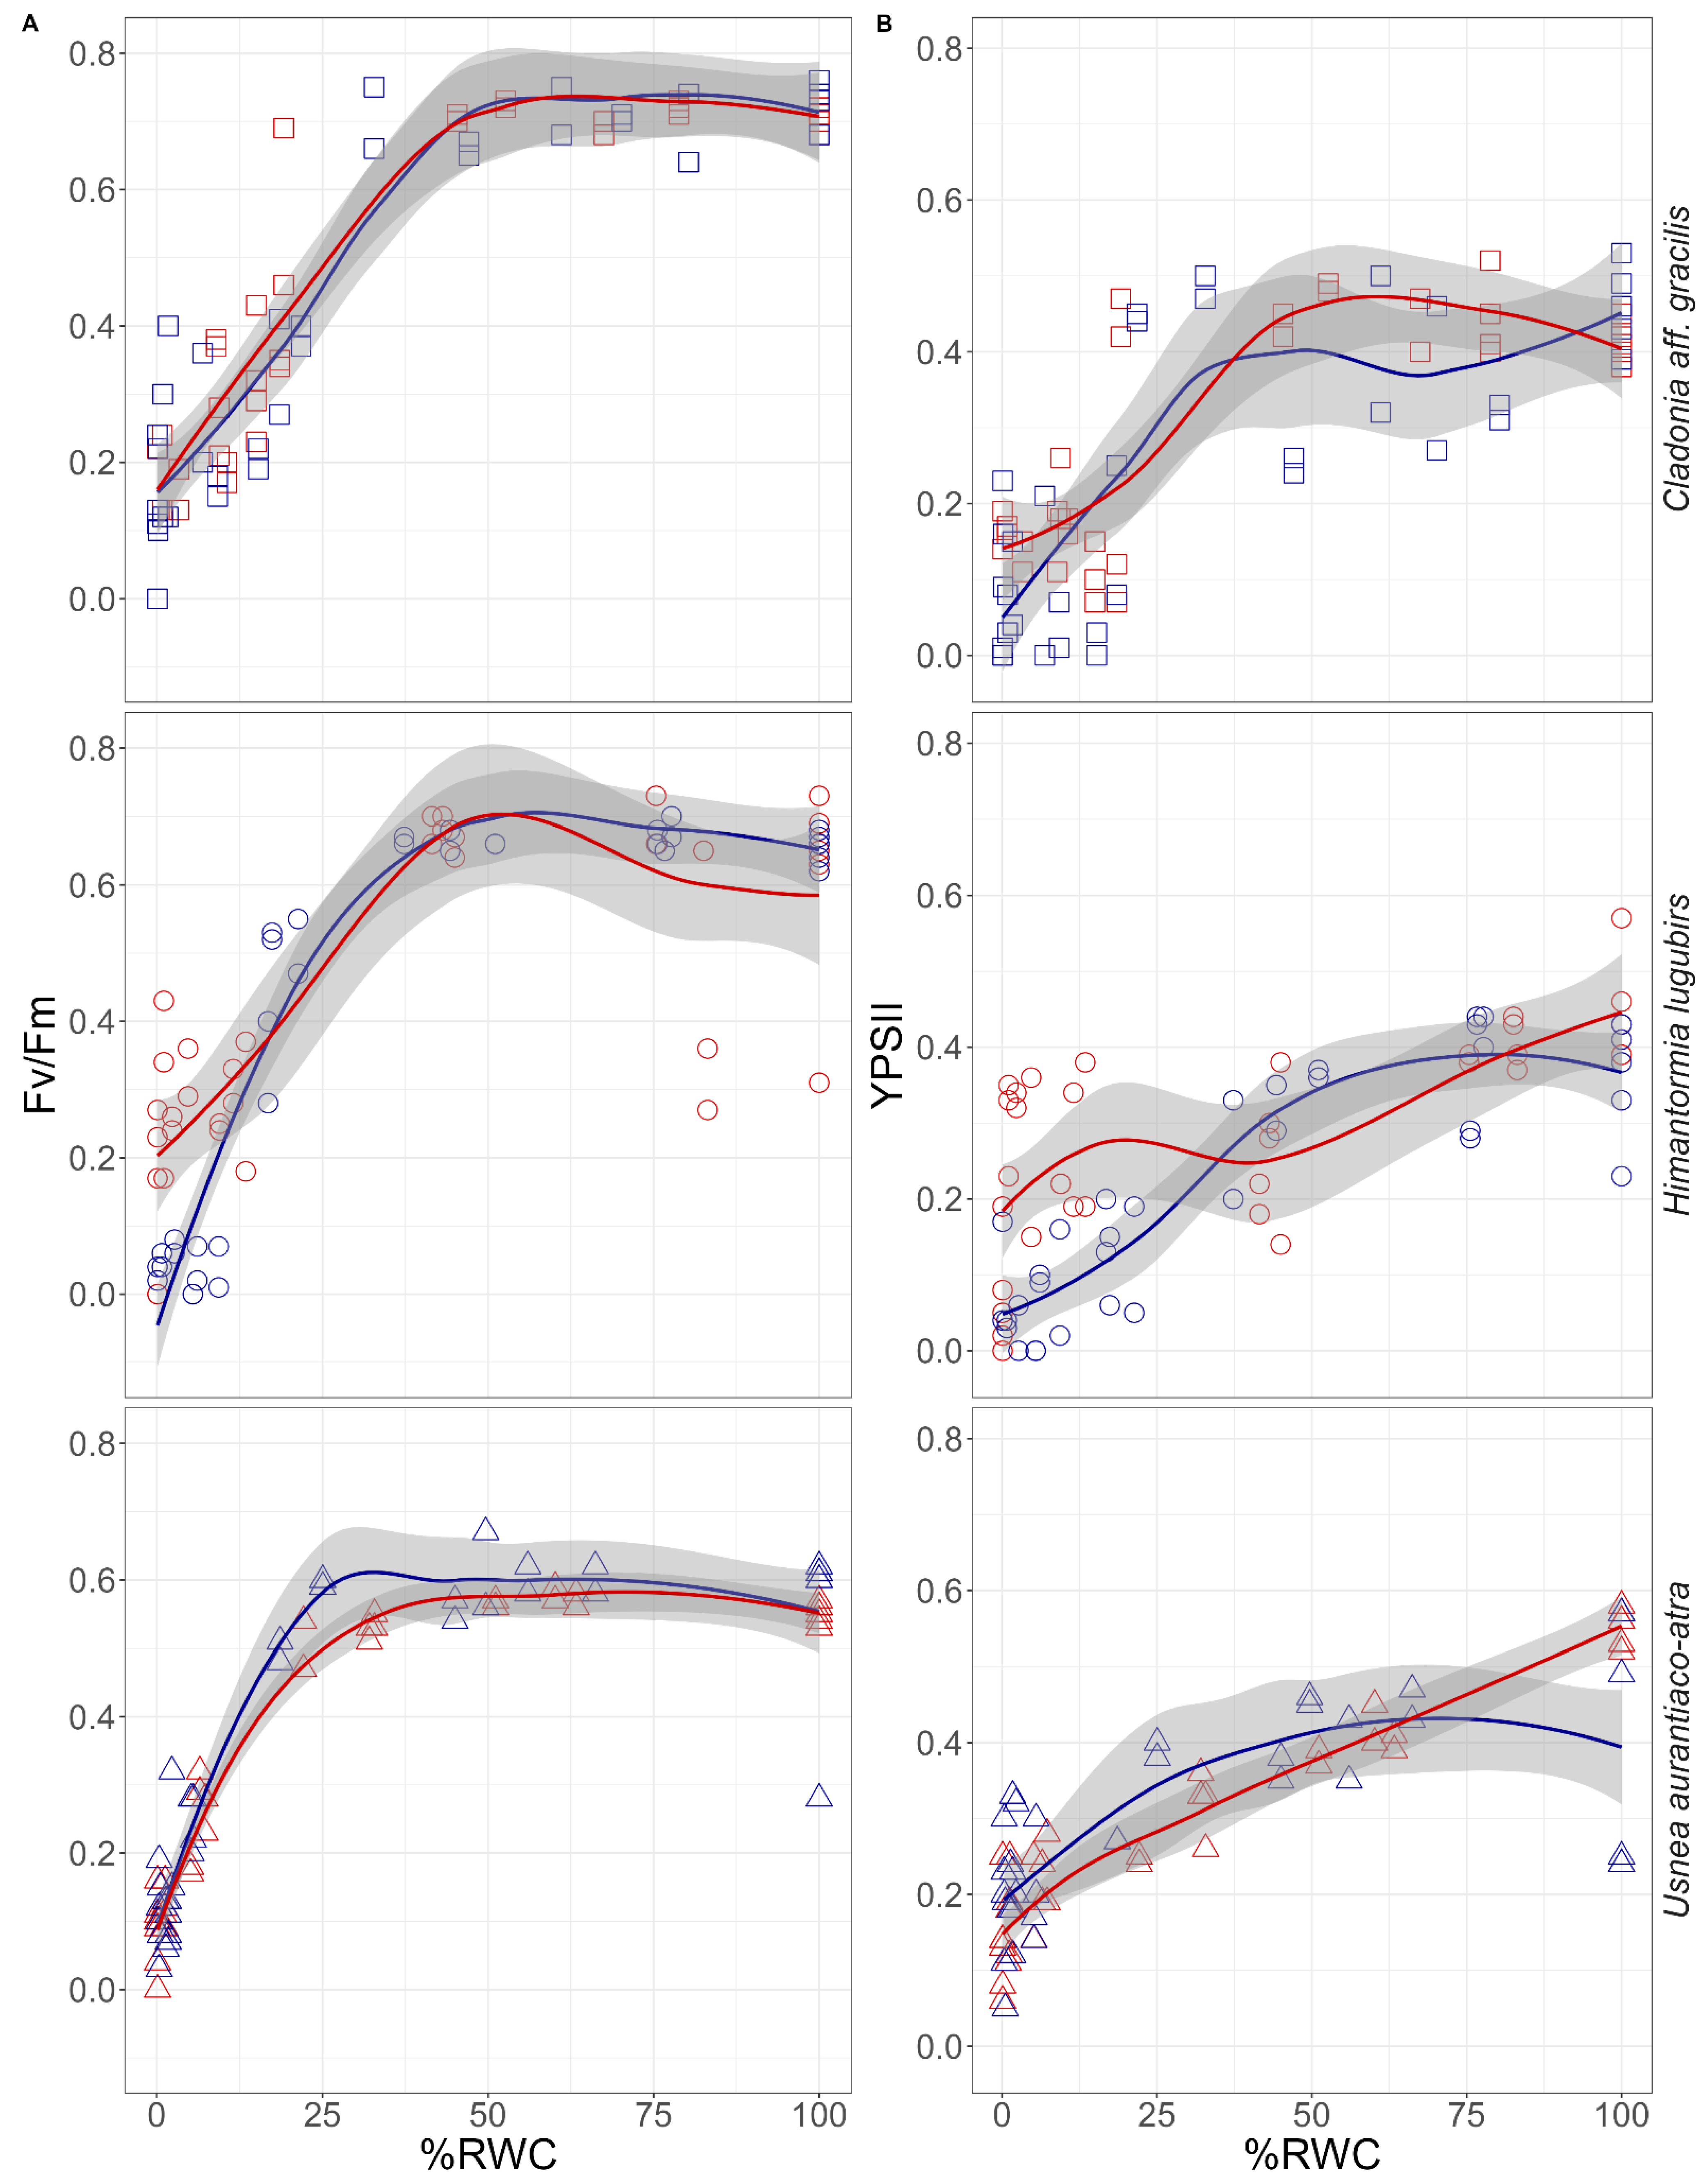
2.3. Chlorophyll Fluorescence vs. Desiccation
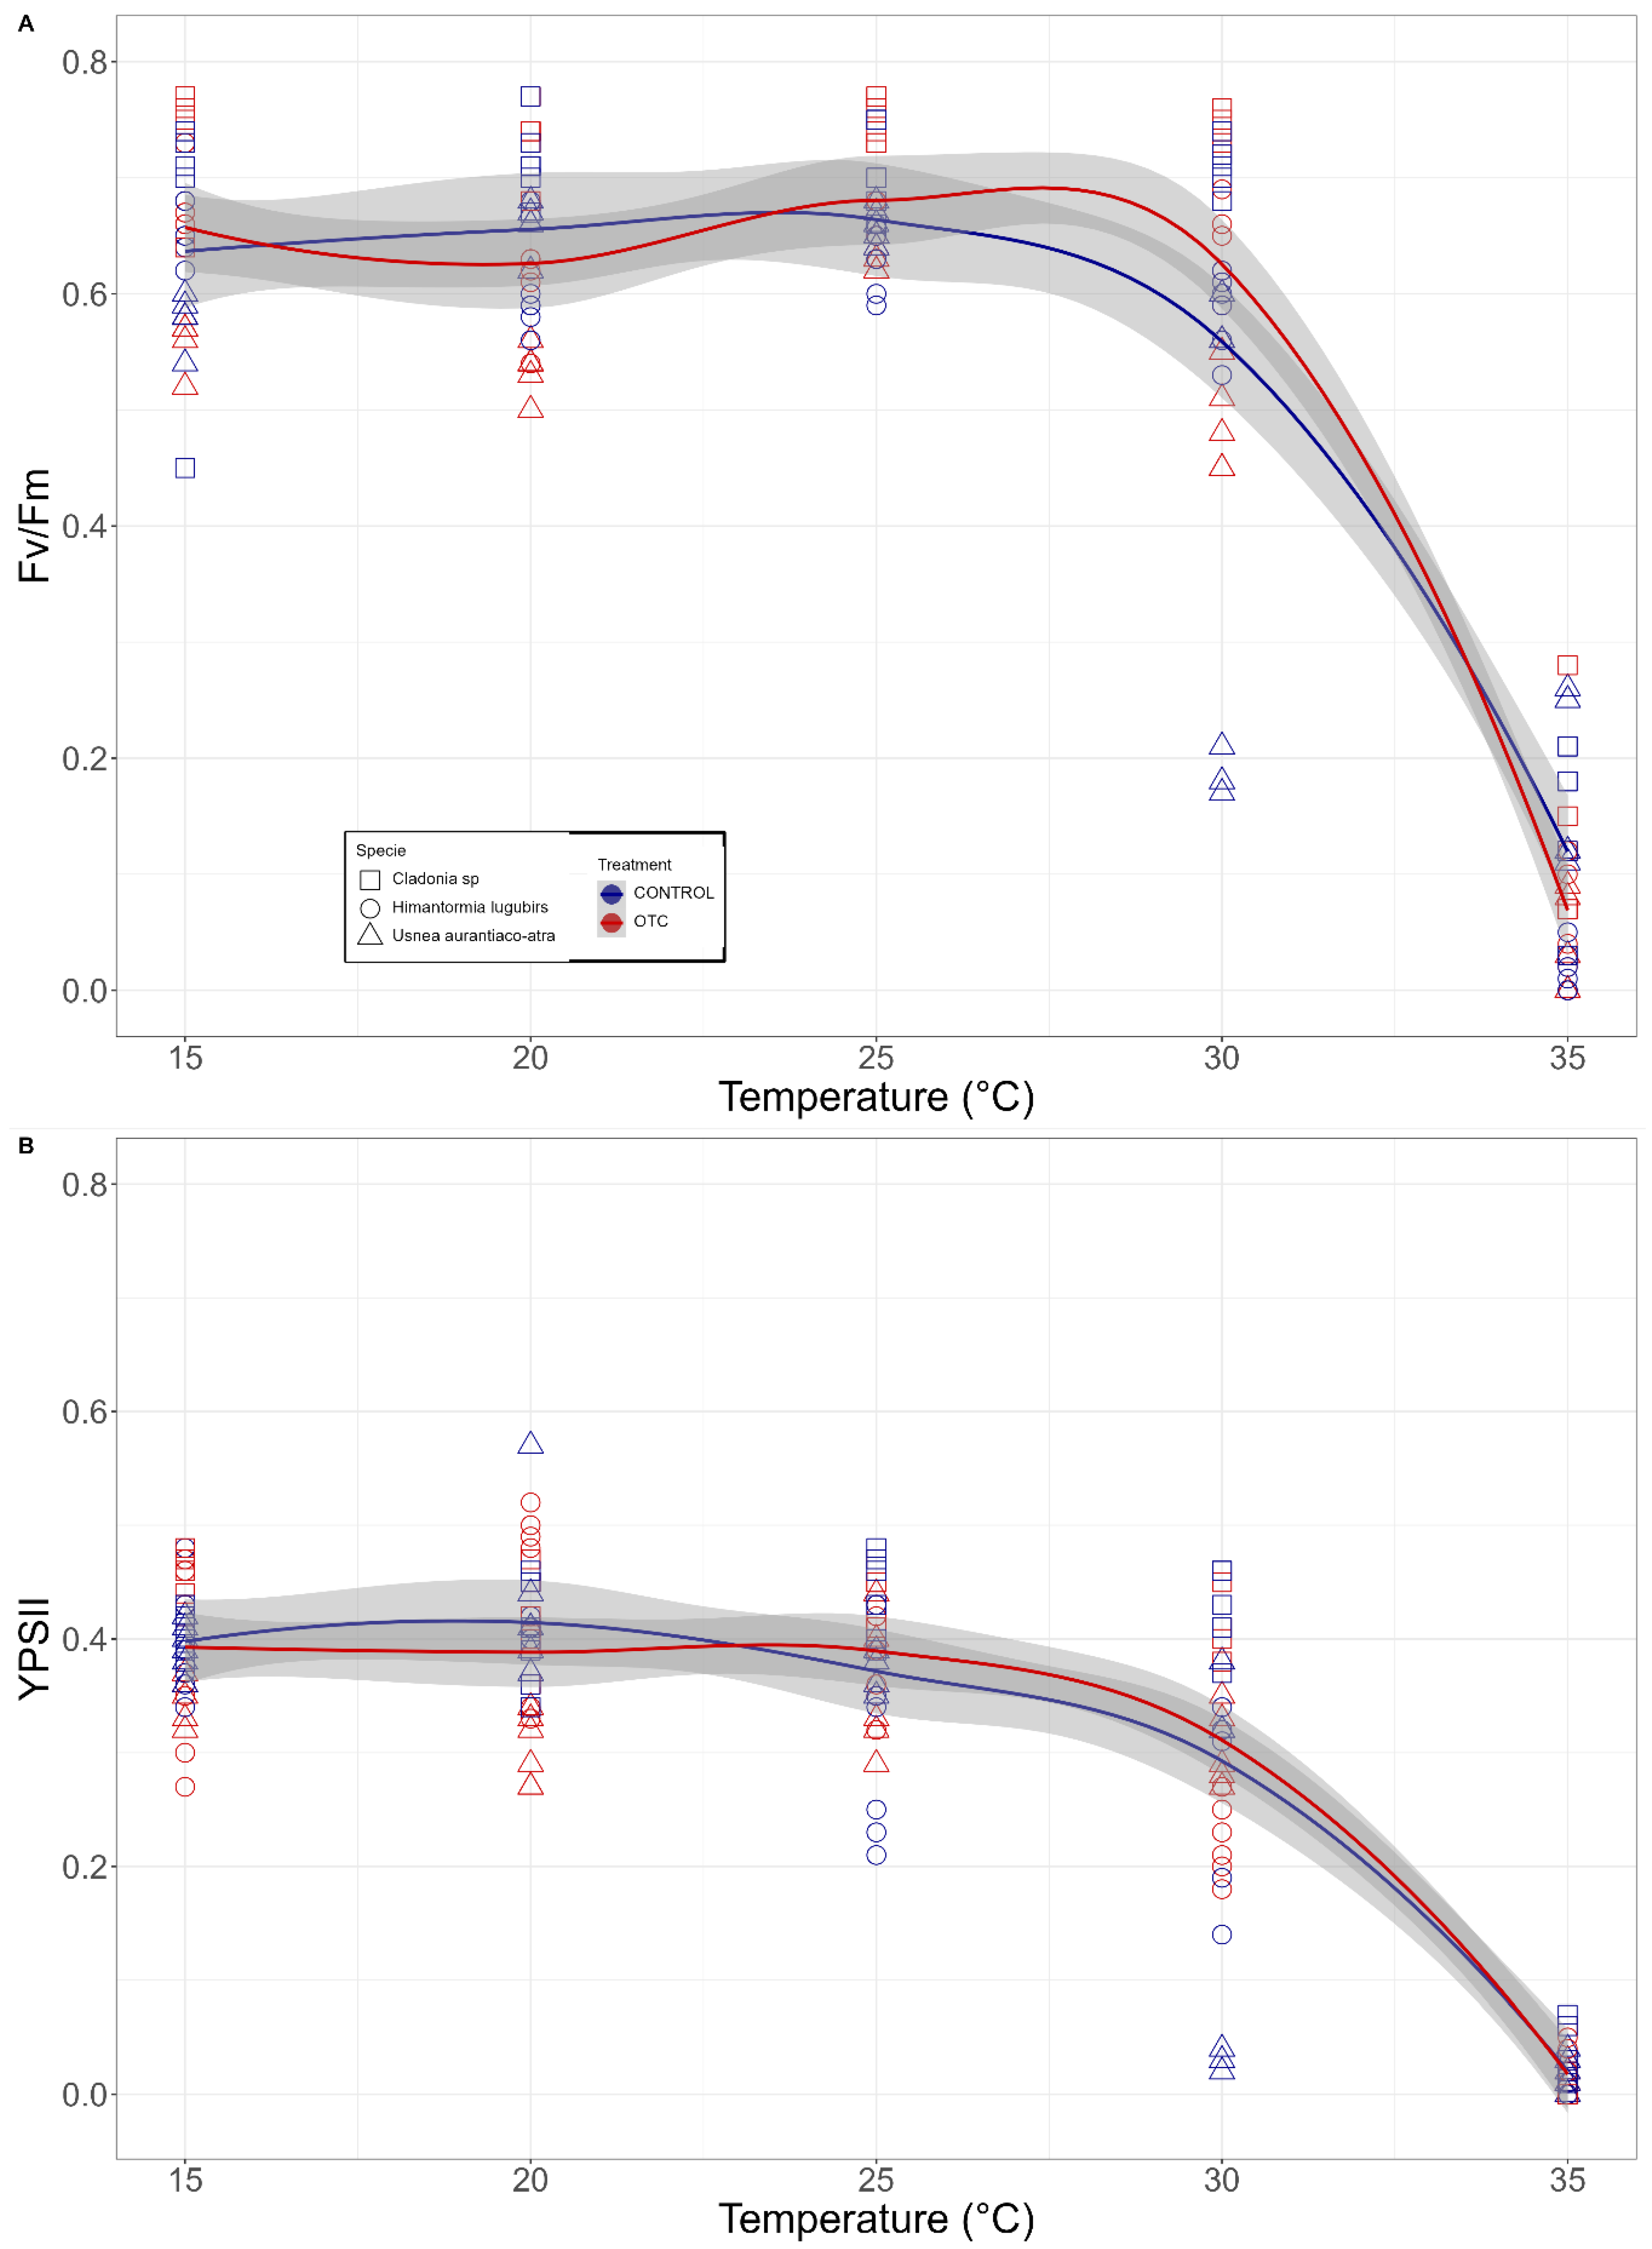
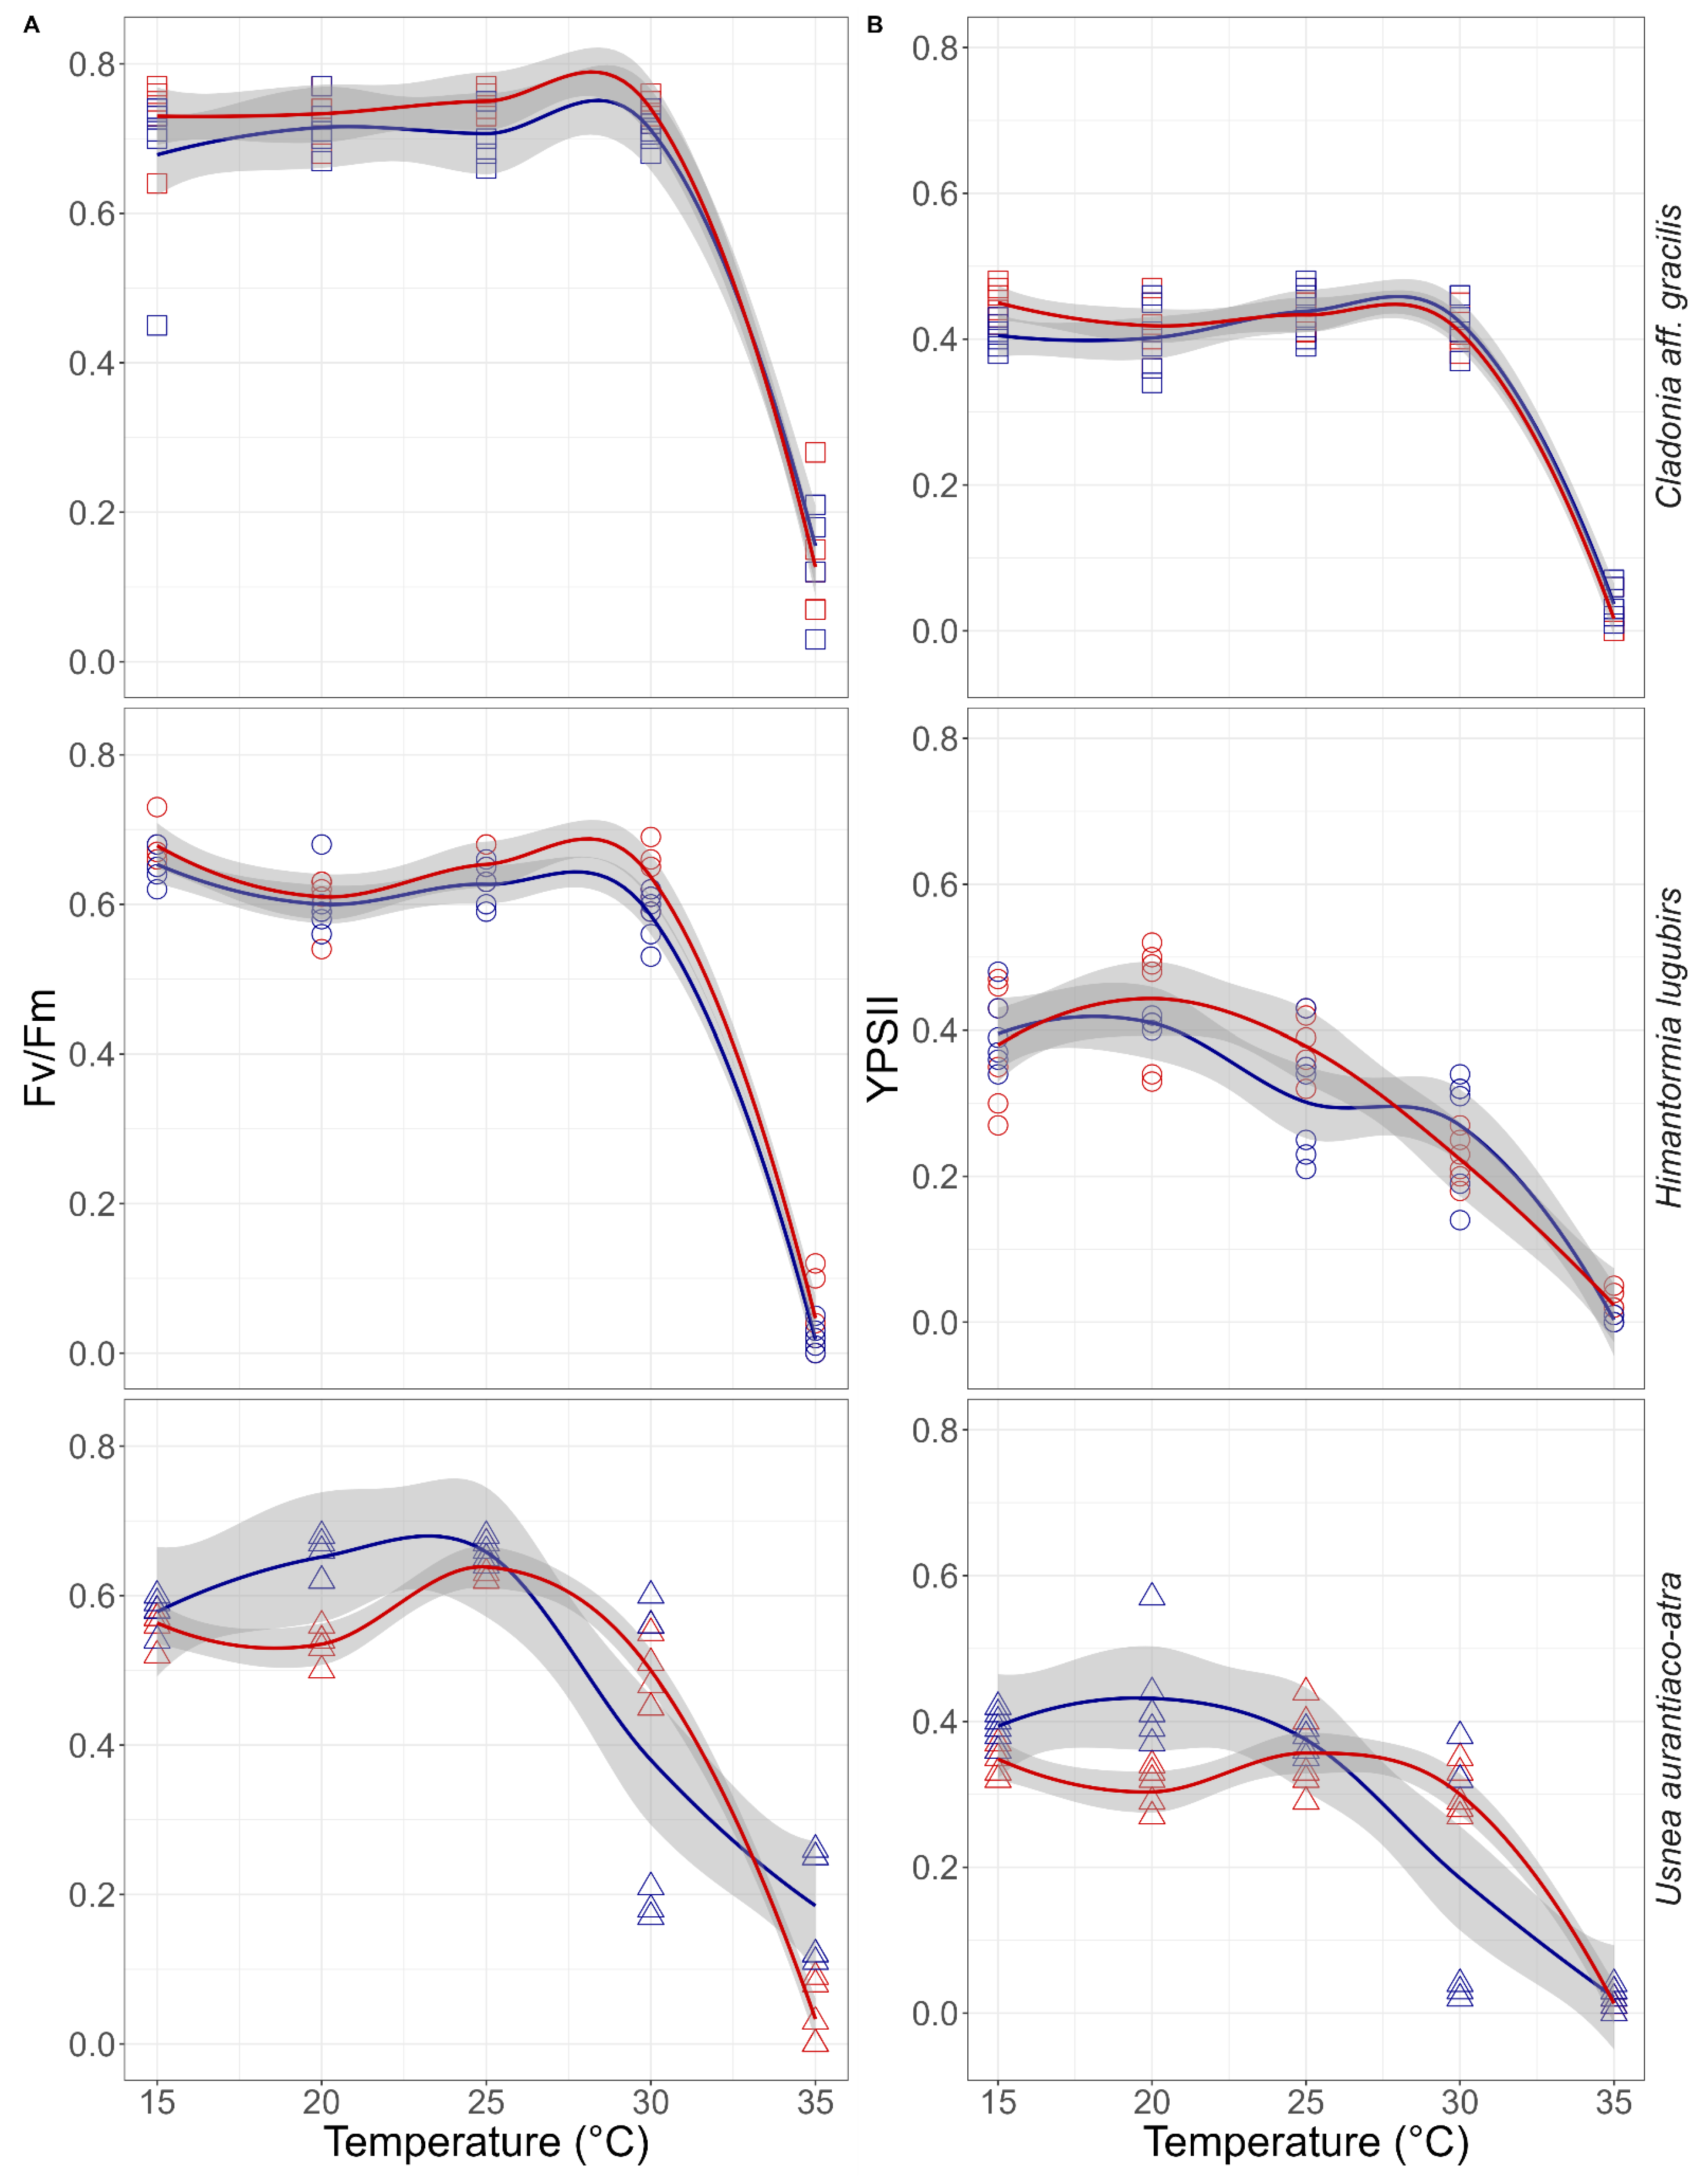
2.4. Heat Shock Experiments

| p-Value Bootstrapping | |||||
|---|---|---|---|---|---|
| Experiment | General | Cladonia aff. gracilis | Himantormia lugubris | Usnea aurantiaco-atra | |
| Desiccation Kinetics | RWC | 0.7 | 0.8 | 0.7 | 0.13 |
| Desiccation vs. photochemical parameters | Fv/Fm | 0.01 | 0.16 | 0.01 | 0.23 |
| YPSII | 0.15 | 0.02 | 0.23 | 0.18 | |
| Heat shock vs. photochemical parameters | Fv/Fm | 0.52 | 0.63 | 0.98 | 0.74 |
| YPSII | 0.61 | 0.71 | 0.8 | 0.05 | |
| p-Value Linear Model ANOVA | |||||
| Desiccation vs. photochemical parameters | Fv/Fm | 0.03 | 0.314 | 0.001 | 0.46 |
| YPSII | 0.03 | 0.28 | 0.001 | 0.054 | |
| Heat shock vs. photochemical parameters | Fv/Fm | 0.78 | 1.0 | 0.01 | 0.77 |
| YPSII | 0.69 | 0.13 | 0.51 | 0.16 | |
2.5. Elemental and Isotope Comparison
| Species | Treatment | δ15 N | δ13 C | %N | %C | C/N |
|---|---|---|---|---|---|---|
| Cladonia borealis | Control | 6.86 ± 1.31 | −29.0 ± 0.8 * | 0.70 ± 0.07 | 40.3 ± 0.2 | 57.8 ± 6.3 * |
| OTC | 8.11 ± 3.89 | −27.9 ± 0.3 * | 0.79 ± 0.05 | 40.0 ± 0.6 | 50.4 ± 2.4 * | |
| Himantormia lugubris | Control | −8.52 ± 0.85 * | −25.8 ± 1.3 | 0.56 ± 0.15 | 40.3 ± 2.0 | 74.9 ± 14.8 |
| OTC | −6.61 ± 1.45 * | −25.1 ± 0.8 | 0.62 ± 0.16 | 39.4 ± 1.5 | 67.0 ± 17.1 | |
| Usnea aurantiaco-atra | Control | −10.76 ± 1.85 | −20.9 ± 0.3 | 0.56 ± 0.07 | 41.4 ± 0.2 | 74.5 ± 5.8 |
| OTC | −10.14 ± 1.07 | −21.4 ± 2.2 | 0.62 ± 0.08 | 41.8 ± 1.8 | 68.1 ± 8.6 |
3. Discussion
3.1. Primary Photosyntethic Response to Desiccation and Heat Shock Experiments
3.2. Elemental and Isotopic Comparison
4. Materials and Methods
4.1. Study Site
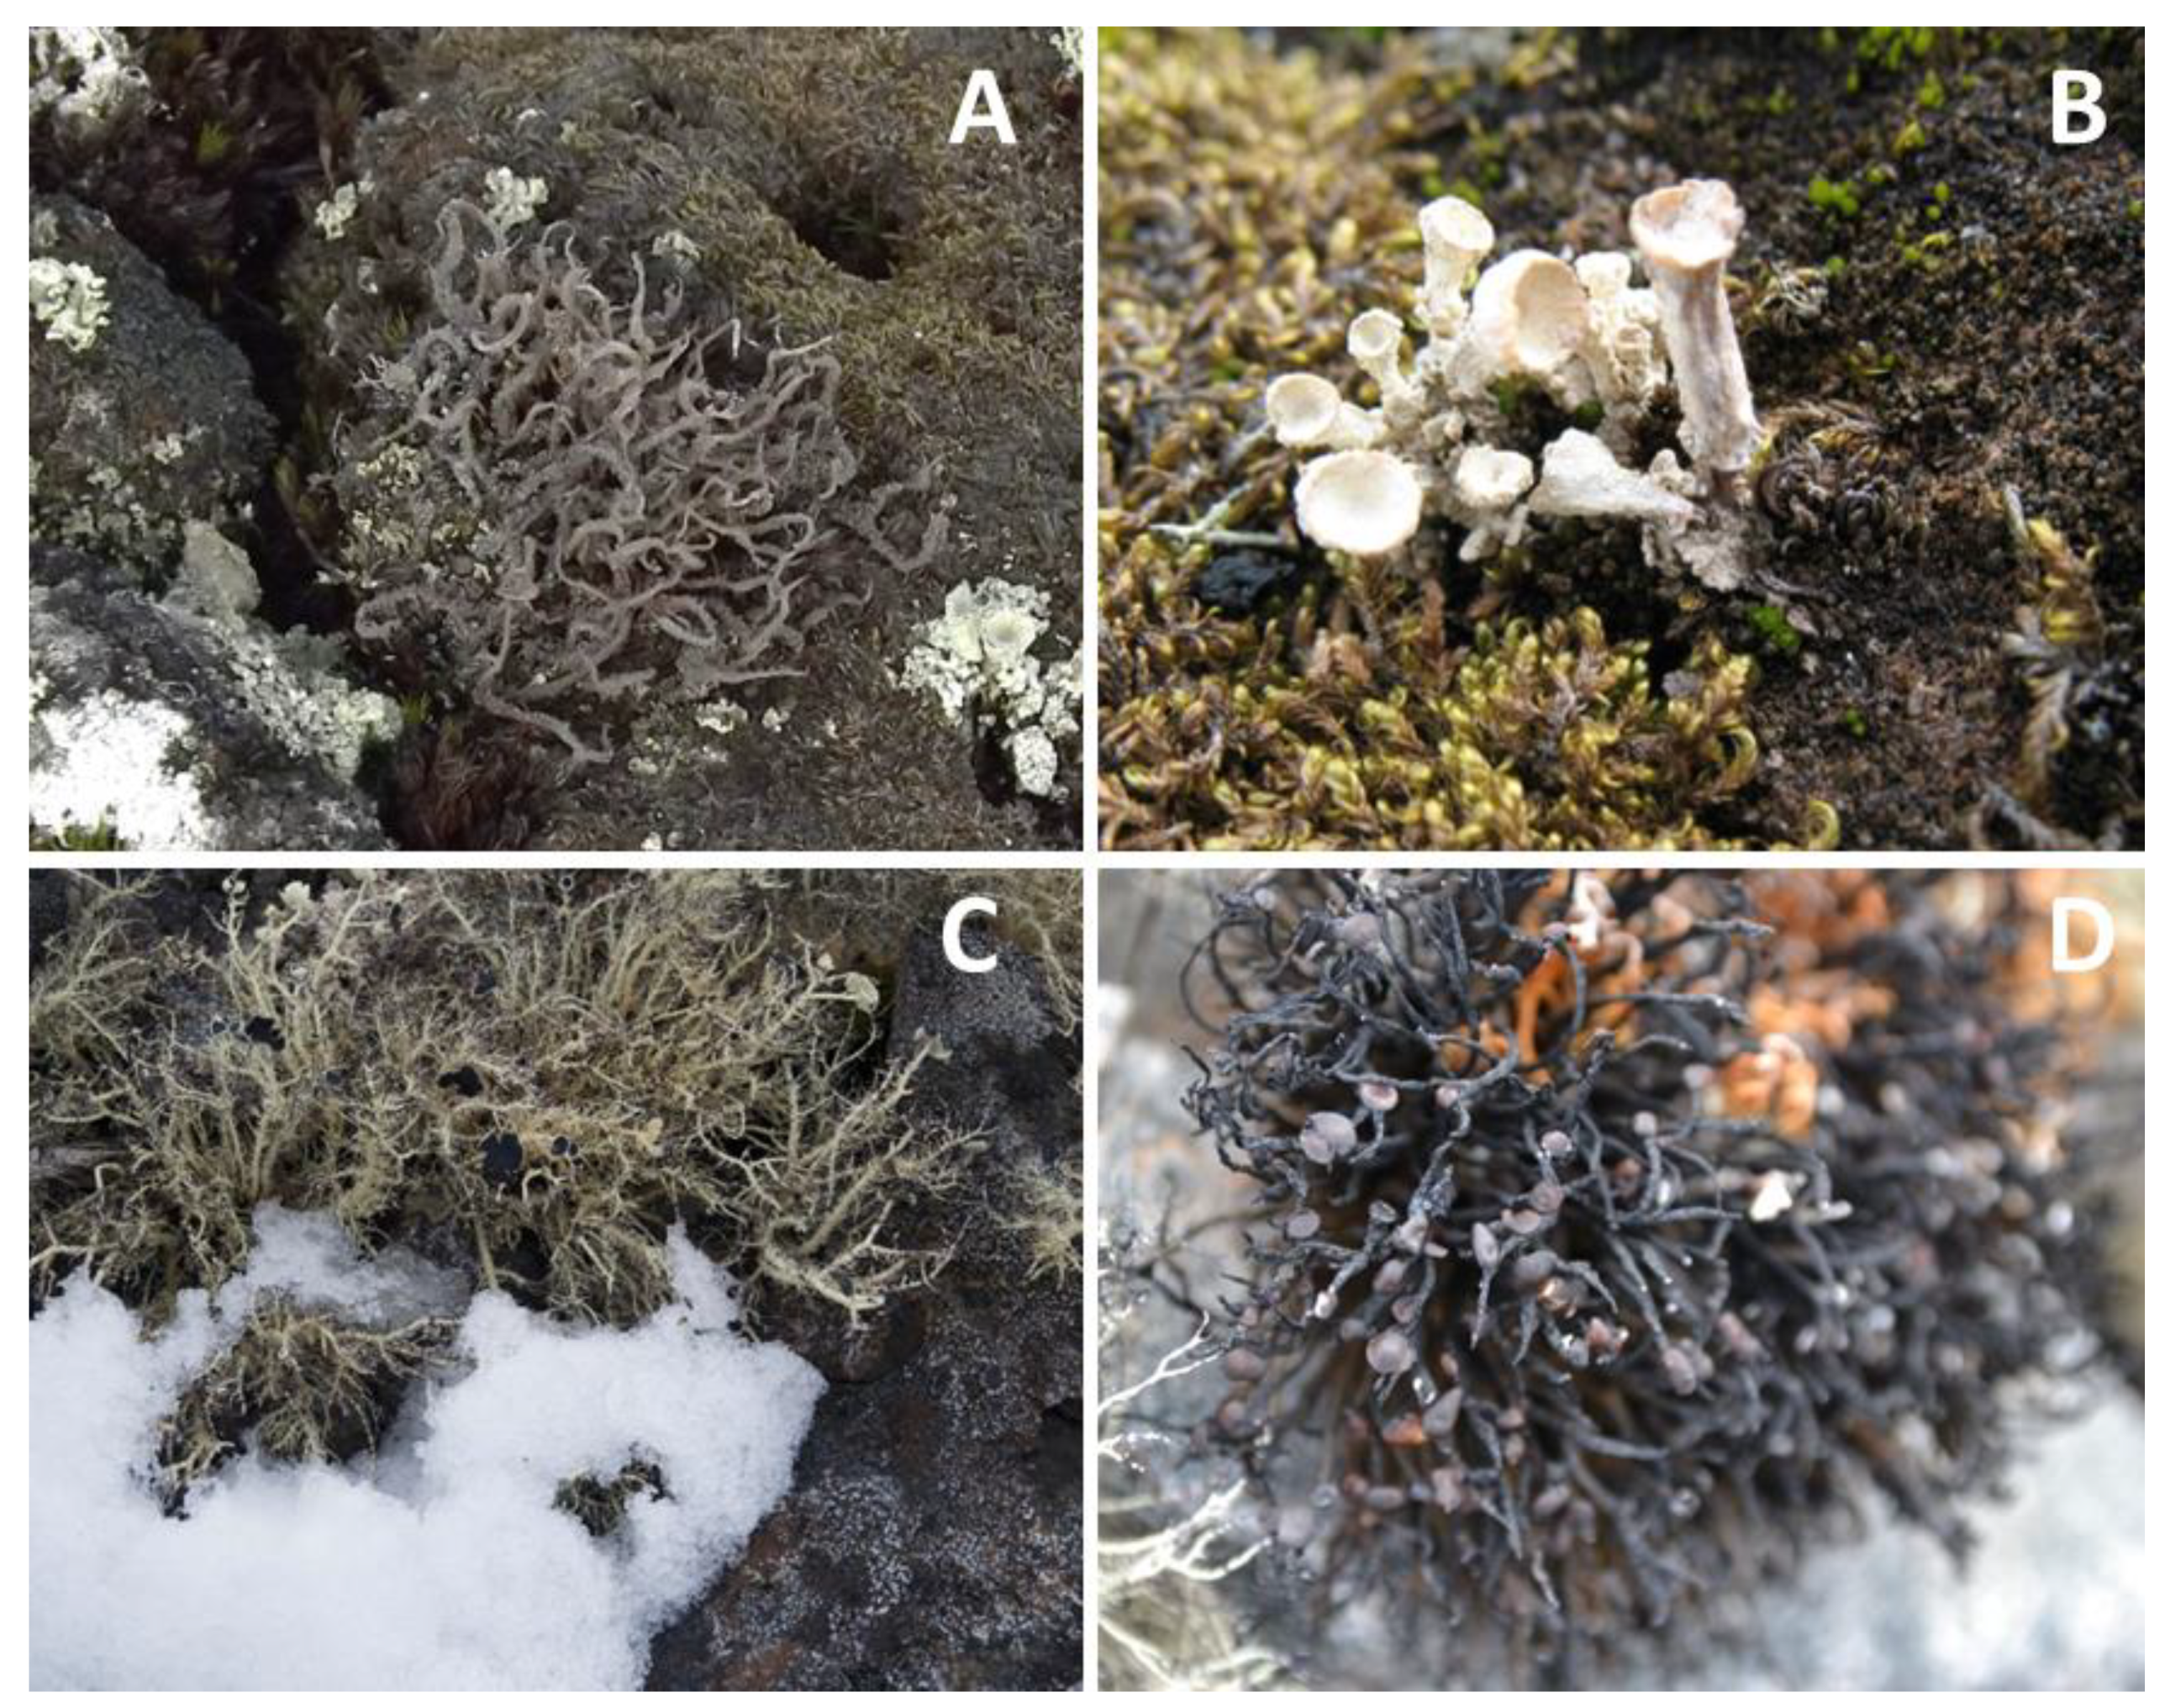
| Family | Species | Morphotype | Habit and Distribution | Measurements |
|---|---|---|---|---|
| Cladoniaceae | Cladonia aff. gracilis (L.) Willd. | Squamulose with podetia | On moss and soil. Cosmopolitan | Chlorophyll fluorescence |
| Cladonia borealis S. Stenroos | Squamulose with podetia | On moss. Antarctica, Asia, Europe, North America, South America | Elemental and isotopic analysis | |
| Parmeliaceae | Himantormia lugubris (Hue) I.M. Lamb | Fruticose with flattened branches | On moss and rocks. Endemic to the Antarctic Peninsula. | Chlorophyll fluorescence, Elemental and isotopic analysis |
| Parmeliaceae | Usnea aurantiaco-atra (Jacq.) Bory | Fruticose with cylindrical branches | On rocks. Southern Chile and Argentina to the Antarctic Peninsula. | Chlorophyll fluorescence, |
| Elemental and isotopic analysis |
4.2. Desiccation Kinetics
4.3. Determination of Photochemical Efficiency during Desiccation
4.4. Heat Shock Kinetics
4.5. Elemental and Isotope Analysis
4.6. Statistical Analysis
5. Conclusions
Author Contributions
Funding
Data Availability Statement
Acknowledgments
Conflicts of Interest
References
- Gutiérrez, J.M.; Jones, R.G.; Narisma, G.T.; Alves, L.M.; Amjad, M.; Gorodetskaya, I.V.; Grose, M.; Klutse, N.A.B.; Krakovska, S.; Li, J.; et al. Atlas. In Climate Change 2021: The Physical Science Basis. Contribution of Working Group I to the Sixth Assessment Report of the Intergovernmental Panel on Climate Change; IPCC WGI Interactive Atlas; Cambridge University Press: Cambridge, UK, 2011; In press; Available online: http://interactive-atlas.ipcc.ch/ (accessed on 5 March 2021).
- Robinson, S.A.; Klekociuk, A.R.; King, D.H.; Pizarro Rojas, M.; Zúñiga, G.E.; Bergstrom, D.M. The 2019/2020 summer of Antarctic heatwaves. Glob. Change Biol. 2020, 26, 3178–3180. [Google Scholar] [CrossRef] [PubMed]
- Turner, J.; Lu, H.; King, J.C.; Carpentier, S.; Lazzara, M.; Phillips, T.; Wille, J. An extreme high temperature event in coastal east antarctica associated with an atmospheric river and record summer downslope winds. Geophys. Res. Lett. 2022, 49, e2021GL097108. [Google Scholar] [CrossRef]
- Skansi, M.D.L.M.; Colwell, S.; Bromwich, D.H.; Jones, P.; King, J.C.; Lazzara, M.A.; Renwick, J.; Solomon, S.; Brunet, M.; Cerveny, R.S. WMO evaluation of two extreme high temperatures occurring in february 2020 for the Antarctic Peninsula Region. Bull. Am. Meteorol. Soc. 2021, 102, E2053–E2061. [Google Scholar] [CrossRef]
- González-Herrero, S.; Barriopedro, D.; Trigo, R.M.; López-Bustins, J.A.; Oliva, M. Climate warming amplified the 2020 record-breaking heatwave in the Antarctic Peninsula. Commun. Earth Environ. 2022, 3, 122. [Google Scholar] [CrossRef]
- Lee, J.R.; Waterman, M.J.; Shaw, J.D.; Bergstrom, D.M.; Lynch, H.J.; Wall, D.H.; Robinson, S.A. Islands in the ice: Potential impacts of habitat transformation on Antarctic biodiversity. Glob. Chang. Biol. 2022, 28, 5865–5880. [Google Scholar] [CrossRef]
- Peat, H.J.; Clarke, A.; Convey, P. ORIGINAL ARTICLE: Diversity and biogeography of the Antarctic flora. J. Biogeogr. 2006, 34, 132–146. [Google Scholar] [CrossRef]
- Green, T.G.A.; Sancho, L.G.; Pintado, A.; Schroeter, B. Functional and spatial pressures on terrestrial vegetation in Antarctica forced by global warming. Polar Biol. 2011, 34, 1643–1656. [Google Scholar] [CrossRef]
- Seppelt, R.D.; Broady, P.A. Antarctic terrestrial ecosystems: The Vestfold Hills in context. Hydrobiologia 1988, 165, 177–184. [Google Scholar] [CrossRef]
- Convey, P.; Gibson, J.A.E.; Hillenbrand, C.-D.; Hodgson, D.; Pugh, P.A.; Smellie, J.L.; Stevens, M.I. Antarctic terrestrial life—Challenging the history of the frozen continent? Biol. Rev. 2008, 83, 103–117. [Google Scholar] [CrossRef]
- Tuner, J.; Bindschadler, R.; Convey, P.; Prisco, G.D.; Fahrbach, E.; Gutt, J.; Hodgson, D.; Mayewski, P.; Summerhayes, C. Summerhayes, C. Antarctic Climate Change and the Environment; Scientific Committee on Antarctic Research: Cambridge, UK, 2009. [Google Scholar]
- Armstrong, R.A. Adaptation of lichens to extreme conditions. In Plant Adaptation Strategies in Changing Environment; Springer: Singapore, 2017; pp. 1–17. [Google Scholar]
- Øvstedal, D.O.; Smith, R.L. Lichens of Antarctica and South Georgia: A Guide to Their Identification and Ecology; Cambridge University Press: Cambridge, UK, 2001. [Google Scholar]
- Nach, T. Lichen Biology; Cambridge University Press: Cambridge, UK; New York, NY, USA; Melbourne, Australia; Madrid, Spain; Cape Town, South Africa; Singapore; São Paulo, Brazil, 2008. [Google Scholar]
- Honegger, R. Water relations in lichen. Water Fungi Environ. Lichen Biol. 2006, 185–200. [Google Scholar] [CrossRef]
- Hájek, J.; Barták, M.; Hazdrová, J.; Forbelská, M. Sensitivity of photosynthetic processes to freezing temperature in extremo- philic lichens evaluated by linear cooling and chlorophyll fluo- rescence. Cryobiology 2016, 73, 329–334. [Google Scholar] [CrossRef] [PubMed]
- Kappen, L.; Schroeter, B. Activity of lichens under the influence of snow and ice. Proc. NIPR Symp. Polar Biol. 1997, 10, 163–168. [Google Scholar]
- Barták, M.; Váczi, P.; Hájek, J.; Smykla, J. Low-temperature limitation of primary photosynthetic processes in Antarctic lichens Umbilicaria antarctica and Xanthoria elegans. Polar Biol. 2007, 31, 47–51. [Google Scholar] [CrossRef]
- Colesie, C.; Büdel, B.; Hurry, V.; Green, T.G.A. Can Antarctic lichens acclimatize to changes in temperature? Glob. Change Biol. 2017, 24, 1123–1135. [Google Scholar] [CrossRef]
- Sancho, L.; Ríos, A.D.L.; Pintado, A.; Colesie, C.; Raggio, J.; Ascaso, C.; Green, A. Himantormia lugubris, an Antarctic endemic on the edge of the lichen symbiosis. Symbiosis 2020, 82, 49–58. [Google Scholar] [CrossRef]
- Green, T.G.A.; Sancho, L.G.; Pintado, A. Ecophysiology of desiccation/rehydration cycles in mosses and lichens. In Plant Desiccation Tolerance; Luttge, U., Beck, E., Bartels, D., Eds.; Springer: Berlin/Heidelberg, Germany, 2011; Volume 215, pp. 89–120. [Google Scholar]
- Green, T.G.A.; Schroeter, B.; Sancho, L.G. Plant life in Antarctica. In Handbook of Functional Plant Ecology; Pugnaire, F.I., Valladares, F., Eds.; Marcel Dekker Inc.: New York, NY, USA, 2007. [Google Scholar]
- Barták, M.; Hájek, J.; Morkusová, J.; Skácelová, K.; Košuthová, A. Dehydration-induced changes in spectral reflectance indices and chlorophyll fluorescence of Antarctic lichens with different thallus color, and intrathalline photobiont. Acta Physiol. Plant. 2018, 40, 177. [Google Scholar]
- Cho, S.M.; Lee, H.; Hong, S.G.; Lee, J. Study of ecophysiological responses of the Antarctic Fruticose Lichen Cladonia borealis using the PAM fluorescence system under natural and laboratory conditions. Plants 2020, 9, 85. [Google Scholar] [CrossRef]
- Barták, M.; Hájek, J.; Orekhova, A.; Villagra, J.; Marín, C.; Palfner, G.; Casanova-Katny, A. Inhibition of primary photosynthesis in dissicating antarctic lichens differing in their photobionts, thallus morphology, and spectral properties. Microorganisms 2021, 9, 818. [Google Scholar] [CrossRef]
- Lange, O.L.; Green, T.G.A.; Heber, U. Hydration-dependent photosynthetic production of lichens: What do laboratory studies tell us about field performance? J. Exp. Bot. 2001, 52, 2033–2042. [Google Scholar] [CrossRef]
- Casanova-Katny, A.; Barták, M.; Gutierrez, C. Open top chamber microclimate may limit photosynthetic processes in Antarctic lichen: Case study from King George Island, Antarctica. Czech Polar Rep. 2019, 9, 61–77. [Google Scholar] [CrossRef]
- Xu, S.Y.; Huang, H.; Song, W.; Liu, X.Y. Lichen nitrogen concentrations and isotopes for indicating nitrogen deposition levels and source changes. Sci. Total Environ. 2021, 787, 147616. [Google Scholar] [CrossRef]
- Bokhorst, S.; Convey, P.; Aerts, R. Nitrogen inputs by marine vertebrates drive abundance and richness in Antarctic terrestrial ecosystems. Curr. Biol. 2019, 29, 1721–1727. [Google Scholar] [CrossRef] [PubMed]
- Munzi, S.; Pisani, T.; Paoli, L.; Renzi, M.; Loppi, S. Variation and evolution of C: N ratio among different organs enable plants to adapt to N-limited environments. Glob. Change Biol. 2020, 26, 2534–2543. [Google Scholar]
- Munzi, S.; Pisani, T.; Paoli, L.; Renzi, M.; Loppi, S. Effect of nitrogen supply on the C/N balance in the lichen Evernia prunastri (L.) Ach. Turk. J. Biol. 2013, 37, 165–170. [Google Scholar] [CrossRef]
- Greenfield, L. Retention of precipitation nitrogen by Antarctic mosses, lichens and fellfield soils. Antarct. Sci. 1992, 4, 205–206. [Google Scholar] [CrossRef]
- Hovenden, M.J. Seasonal trends in nitrogen status of Antarctic Lichens. Ann. Bot. 2000, 86, 717–721. [Google Scholar] [CrossRef]
- Walker, M.D.; Wahren, C.H.; Hollister, R.D.; Henry, G.H.R.; Ahlquist, L.E.; Alatalo, J.M.; Bret-Harte, M.S.; Calef, M.P.; Callaghan, T.V.; Carroll, A.B.; et al. Plant community responses to experimental warming across the tundra biome. Proc. Natl. Acad. Sci. USA 2006, 103, 1342–1346. [Google Scholar] [CrossRef]
- Shortlidge, E.E.; Eppley, S.M.; Kohler, H.; Rosenstiel, T.N.; Zúñiga, G.E.; Casanova-Katny, A. Passive warming reduces stress and shifts reproductive effort in the Antarctic moss, Polytrichastrum alpinum. Ann. Bot. 2017, 119, 27–38. [Google Scholar] [CrossRef]
- Prather, H.M.; Casanova-Katny, A.; Clements, A.F.; Chmielewski, M.W.; Balkan, M.; Shortlidge, E.E.; Rosenstiel, T.N.; Eppley, S.M. Species-specific effects of passive warming in an Antarctic moss system. R. Soc. Open Sci. 2019, 6, 190744. [Google Scholar] [CrossRef]
- Nayaka, S.; Rai, H. Antarctic Lichen Response to Climate Change: Evidence from Natural Gradients and Temperature Enchantment Experiments. In Assessing the Antarctic Environment from a Climate Change Perspective; Earth and Environmental Sciences Library; Springer: Cham, Switzerland, 2022; pp. 235–253. [Google Scholar]
- Sancho, L.G.; Pintado, A.; Navarro, F.; Ramos, M.; de Pablo, M.; Blanquer, J.M.; Raggio, J.; Valladares, F.; Green, T.G.A. Recent warming and cooling in the Antarctic Peninsula region has rapid and large effects on lichen vegetation. Sci. Rep. 2017, 7, 5689. [Google Scholar] [CrossRef]
- Bokhorst, S.; Convey, P.; Huiskes, A.; Aerts, R. Usnea antarctica, an important Antarctic lichen, is vulnerable to aspects of regional environmental change. Polar Biol. 2016, 39, 511–521. [Google Scholar] [CrossRef]
- Kennedy, A.D. Simulated climate change: Are passive greenhouses a valid microcosm for testing the biological effects of environmental perturbations? Glob. Chang. Biol. 1995, 1, 29–42. [Google Scholar] [CrossRef]
- Schroeter, B.; Green, T.G.A.; Pintado, A.; Türk, R.; Sancho, L.G. Summer activity patterns for a moss and lichen in the maritime Antarctic with respect to altitude. Polar Biol. 2021, 44, 2117–2137. [Google Scholar] [CrossRef]
- Olech, M. Lichens of King George Island, Antartica; The Institute of Botany of the Jagiellonian University: Kraków, Poland, 2004. [Google Scholar]
- Ochyra, R.; Lewis Smith, R.I.; Bednarek-Ochyra, H. The Illustrated Moss Flora of Antarctica; Cambridge University Press: Cambridge, UK, 2008; p. 704. [Google Scholar]
- Puhovkin, A.; Bezsmertna, O.; Parnikoza, I. Interspecific differences in desiccation tolerance of selected Antarctic lichens: Analysis of photosystem II effectivity and quenching mechanisms. Czech Polar Rep. 2022, 12, 31–43. [Google Scholar] [CrossRef]
- Kappen, L.; Kappen, L. Water relations and net photosynthesis of Usnea. A comparison between Usnea fasciata (maritime Antarctic) and Usnea sulphurea (continental Antarctic). In Lichen Physiology and Cell Biology; Springer: Boston, MA, USA, 1985; pp. 41–56. [Google Scholar]
- Harrisson, P.; Rothery, P. Net CO2 exchange in relation to thallus moisture and temperature in two fruticose lichens Usnea antarctica and Usnea aurantiaco-atra from the maritime Antarctic. Polarforschung 1988, 58, 171–179. [Google Scholar]
- Perera-Castro, A.V.; Waterman, M.J.; Turnbull, J.D.; Ashcroft, M.B.; McKinley, E.; Watling, J.R.; Bramley-Alves, J.; Casanova-Katny, A.; Zuniga, G.; Flexas, J.; et al. It is hot in the sun: Antarctic mosses have high temperature optima for photosynthesis despite cold climate. Front. Plant Sci. 2020, 11, 1178. [Google Scholar] [CrossRef]
- Bednaříková, M.; Folgar-Cameán, Y.; Kučerová, Z.; Lazár, D.; Špundová, M.; Hájek, J.; Barták, M. Analysis of K-and L-band appearance in OJIPs in Antarctic lichens in low and high temperature. Photosynthetica 2020, 58, 646–656. [Google Scholar] [CrossRef]
- Kappen, L.; Redon, J. Photosynthesis and Water Relations of Three Maritime Antarctic Lichen Species. Flora-Morphol. Distrib. Funct. Ecol. Plants 1987, 179, 215–229. [Google Scholar] [CrossRef]
- Gauslaa, Y.; Mikulec, M.M.; Solhaug, K.A. Short-term growth experiments–A tool for quantifying lichen fitness across different mineral settings. Flora-Morphol. Distrib. Funct. Ecol. Plants 2021, 282, 151900. [Google Scholar] [CrossRef]
- Palmqvist, K. Tansley review No. 117 carbon economy in lichens. New Phytol. 2000, 148, 11–36. [Google Scholar] [CrossRef]
- Palmqvist, K.; Campbell, D.; Ekblad, A.; Johansson, H. Photosynthetic capacity in relation to nitrogen content and its partitioning in lichens with different photobionts. Plant Cell Environ. 1998, 21, 361–372. [Google Scholar] [CrossRef]
- Palmqvist, K.; Dahlman, L.; Valladares, F.; Tehler, A.; Sancho, L.; Mattsson, J.-E. CO2 exchange and thallus nitrogen across 75 contrasting lichen associations from different climate zones. Oecologia 2002, 133, 295–306. [Google Scholar] [CrossRef] [PubMed]
- Beck, A.; Mayr, C. Nitrogen and carbon isotope variability in the green-algal lichen Xanthoria parietina and their implications on mycobiont—Photobiont interactions. Ecol. Evol. 2012, 2, 3132–3144. [Google Scholar] [CrossRef] [PubMed]
- Skrzypek, G.; Wojtuń, B.; Richter, D.; Jakubas, D.; Wojczulanis-Jakubas, K.; Samecka-Cymerman, A. Diversification of nitrogen sources in various tundra vegetation types in the high arctic. PLoS ONE 2015, 10, e0136536. [Google Scholar] [CrossRef]
- Casanova-Katny, A.; Pizarro, M.; Caballero, M.M.; Cordero, R.; Zúiga, G.E. Non-structural carbohydrate content in cryptogamic Antarctic species after two years of passive warming on the Fildes Peninsula. Czech Polar Rep. 2015, 5, 88–98. [Google Scholar] [CrossRef]
- Casanova-Katny, A.; Torres-Mellado, G.A.; Eppley, S.M. Reproductive output of mosses under experimental warming on Fildes Peninsula, King George Island, maritime Antarctica. Rev. Chil. Hist. Nat. 2016, 89, 42. [Google Scholar] [CrossRef]
- Bokhorst, S.; Huiskes, A.; Convey, P.; Sinclair, B.J.; Lebouvier, M.; Van de Vijver, B.; Wall, D.H. Microclimate impacts of passive warming methods in Antarctica: Implications for climate change studies. Polar Biol. 2011, 34, 1421–1435. [Google Scholar] [CrossRef]
- Gerrish, L.; Fretwell, P.; Cooper, P. High Resolution Vector Polygons of the Antarctic coastline (7.3) [Data Set]. UK Polar Data Centre, Natural Environment Research Council, UK Research & Innovation. Available online: https://www.bas.ac.uk/data/uk-pdc/ (accessed on 15 April 2020).
- Maxwell, K.; Johnson, G.N. Chlorophyll fluorescence—A practical guide. J. Exp. Bot. 2000, 51, 659–668. [Google Scholar] [CrossRef]
- Davinson, A.; Hinkley, D. Bootstrap Methods and their Application (Cambridge Series in Statistical and Probabilistic Mathematics); Cambridge University Press: Cambridge, UK, 1997. [Google Scholar]
- R Core Team. R: A Language and Environment for Statistical Computing; R Foundation for Statistical Computing: Vienna, Austria, 2013; Available online: https://www.R-project.org/ (accessed on 1 January 2019).
- Mangiafico, S. Rcompanion: Functions to Support Extension Education Program Evaluation. R Package Version 2.4.6. 2021. Available online: https://CRAN.R_project.org/package=rcompanion (accessed on 1 January 2021).
- Wickham, H. ggplot2: Elegant Graphics for Data Analysis. Springer: New York, NY, USA, 2016. Available online: https://ggplot2.tidyverse.org (accessed on 1 January 2019).
Publisher’s Note: MDPI stays neutral with regard to jurisdictional claims in published maps and institutional affiliations. |
© 2022 by the authors. Licensee MDPI, Basel, Switzerland. This article is an open access article distributed under the terms and conditions of the Creative Commons Attribution (CC BY) license (https://creativecommons.org/licenses/by/4.0/).
Share and Cite
Marín, C.; Barták, M.; Palfner, G.; Vergara-Barros, P.; Fernandoy, F.; Hájek, J.; Casanova-Katny, A. Antarctic Lichens under Long-Term Passive Warming: Species-Specific Photochemical Responses to Desiccation and Heat Shock Treatments. Plants 2022, 11, 2463. https://doi.org/10.3390/plants11192463
Marín C, Barták M, Palfner G, Vergara-Barros P, Fernandoy F, Hájek J, Casanova-Katny A. Antarctic Lichens under Long-Term Passive Warming: Species-Specific Photochemical Responses to Desiccation and Heat Shock Treatments. Plants. 2022; 11(19):2463. https://doi.org/10.3390/plants11192463
Chicago/Turabian StyleMarín, Catalina, Miloš Barták, Götz Palfner, Pablo Vergara-Barros, Francisco Fernandoy, Josef Hájek, and Angélica Casanova-Katny. 2022. "Antarctic Lichens under Long-Term Passive Warming: Species-Specific Photochemical Responses to Desiccation and Heat Shock Treatments" Plants 11, no. 19: 2463. https://doi.org/10.3390/plants11192463
APA StyleMarín, C., Barták, M., Palfner, G., Vergara-Barros, P., Fernandoy, F., Hájek, J., & Casanova-Katny, A. (2022). Antarctic Lichens under Long-Term Passive Warming: Species-Specific Photochemical Responses to Desiccation and Heat Shock Treatments. Plants, 11(19), 2463. https://doi.org/10.3390/plants11192463