Article

Hydrogen Peroxide Mediates Premature Senescence Caused by Darkness and Inorganic Nitrogen Starvation in Physcomitrium patens

1
Graduate School of Science and Engineering, Saitama University, Saitama 338-8570, Japan
2
Department of Horticulture, Bangabandhu Sheikh Mujibur Rahman Agricultural University, Gazipur 1706, Bangladesh
3
Department of Biochemistry and Molecular Biology, Bangladesh Agricultural University, Mymensingh 2202, Bangladesh
4
Department of Agronomy, Hajee Mohammad Danesh Science and Technology University, Dinajpur 5200, Bangladesh
5
School of Humanities, Tokai University, Shizuoka 424-8610, Japan
6
Research Institute for Clinical Oncology, Saitama Cancer Center, Saitama 362-0806, Japan
*
Author to whom correspondence should be addressed.
Plants 2022, 11(17), 2280; https://doi.org/10.3390/plants11172280
Submission received: 15 July 2022 / Revised: 22 August 2022 / Accepted: 25 August 2022 / Published: 31 August 2022
(This article belongs to the Section Plant Cell Biology)

Abstract

:
Leaf senescence accompanied by yellowing and Rubisco degradation occurs prematurely in response to various stresses. However, signaling pathways between stress perception and senescence responses are not understood fully, although previous studies suggest the involvement of reactive oxygen species (ROS). While investigating the physiological functions of autophagy in Physcomitrium patens using wild-type (WT) and autophagy-deficient atg5 strains, we found that Physcomitrium colonies senesce prematurely under dark or nitrogen-deficient conditions, with atg5 senescing earlier than WT. In the present study, we measured cellular H2O2, and examined whether H2O2 mediates premature senescence in Physcomitrium colonies. Methyl viologen, an ROS generator, increased cellular H2O2 levels and caused senescence-like symptoms. H2O2 levels were also elevated to the same plateau levels in WT and atg5 under dark or nitrogen-deficient conditions. The ROS scavenger N-acetylcysteine and the ROS source inhibitor carbonyl cyanide m-chlorophenylhydrazone inhibited the increase in H2O2 levels as well as senescence. Upon transfer to a nitrogen-deficient medium, H2O2 levels increased earlier in atg5 than in WT by ~18 h, whereas atg5 yellowed earlier by >2 days. We conclude that the increased H2O2 levels under dark or nitrogen-deficient conditions mediate premature senescence in Physcomitrium but do not explain the different senescence responses of WT and atg5 cells.

1. Introduction

Leaf senescence is a degenerative process in which leaf cells and tissues are degraded. During senescence, cellular components, including chlorophyll and the Rubisco protein, are degraded, and the degradation products, including amino acids and sugars, are transported from the senescing leaf to adjacent or distant organs. Leaves typically senesce after reaching maturity; however, leaf senescence can be induced prematurely by a variety of stresses, such as darkness, nutrient starvation, drought, and salinity.
Autophagy is one of the pathways in which cells degrade their own components. During autophagy, a portion of the cytoplasm is transported to lysosomes and/or vacuoles, where it is degraded [1]. The various autophagy types include macroautophagy, microautophagy, and chaperon-mediated autophagy, of which macroautophagy is widely characterized. In macroautophagy (hereafter referred to as autophagy), cytoplasmic components are enclosed in an autophagosome, which fuses with a lysosome or vacuole and is degraded into amino acids and nucleotides. The amino acids are reused in protein synthesis or energy production through oxidation. Autophagy is executed and controlled by various autophagy-related (Atg) proteins [2].
The signaling pathways in premature senescence from stress perception to senescence responses are not fully elucidated. However, previous studies have suggested that reactive oxygen species (ROS) are involved in these pathways. First, it has been reported that increased ROS levels mediate the premature senescence of leaves in plants under drought stress [3]. Specifically, the cellular H2O2 level increases and premature senescence occurs in Arabidopsis leaves under drought stress; however, in Arabidopsis mutants deficient in the expression of ROS-generating enzymes, H2O2 levels are reduced and senescence is delayed [3]. In addition, increased H2O2 levels increase during NaCl-induced senescence in sweet potato have been reported [4]. The study also found that a calmodulin inhibitor decreased H2O2 levels and inhibited premature senescence [4]. Second, cellular H2O2 levels are shown to increase during natural senescence in Arabidopsis and oilseed rape, and senescence is delayed by reducing H2O2 levels through the overexpression of exogenous proteins that scavenge H2O2 [5,6]. Third, increased H2O2 levels are observed in Arabidopsis autophagy-deficient mutants that exhibit earlier senescence [7,8]. In addition, several studies have indicated that cellular ROS levels are elevated in response to abiotic and biotic stress [9,10]. Collectively, these results suggest that ROS, especially H2O2, are mediators between stress perception and senescence responses.
We have been investigating the physiological significance of autophagy in plants using the moss Physcomitrium patens. This moss has the property of undergoing homologous recombination with DNA introduced into cells with high efficiency, and techniques for disrupting specific genes have been developed [11]. We also reasoned that the simple cellular structure and few cell types of Physcomitrium protonema colonies would facilitate physiological analysis at the cellular level. In a previous study, we constructed ATG5 gene knockout (atg5) mutants and found that Physcomitrium protonema colonies show stress-induced senescence symptoms similar to those in green leaves and that atg5 mutants senesce earlier than the wild-type (WT) under dark or nitrogen starvation conditions [12].
In the present study, we investigated whether H2O2 is a mediator between the perception of stress, i.e., darkness and inorganic nitrogen starvation, and senescence responses, including yellowing and Rubisco degradation, in WT and atg5 mutants of Physcomitrium. As we found that H2O2 acts as a mediator of premature senescence, we further investigated whether increased H2O2 levels account for the difference in senescence responses between WT and atg5 cells. However, we found that increased H2O2 did not explain the earlier premature senescence phenotype of atg5 mutants that occurred under dark or nitrogen starvation conditions.

2. Results

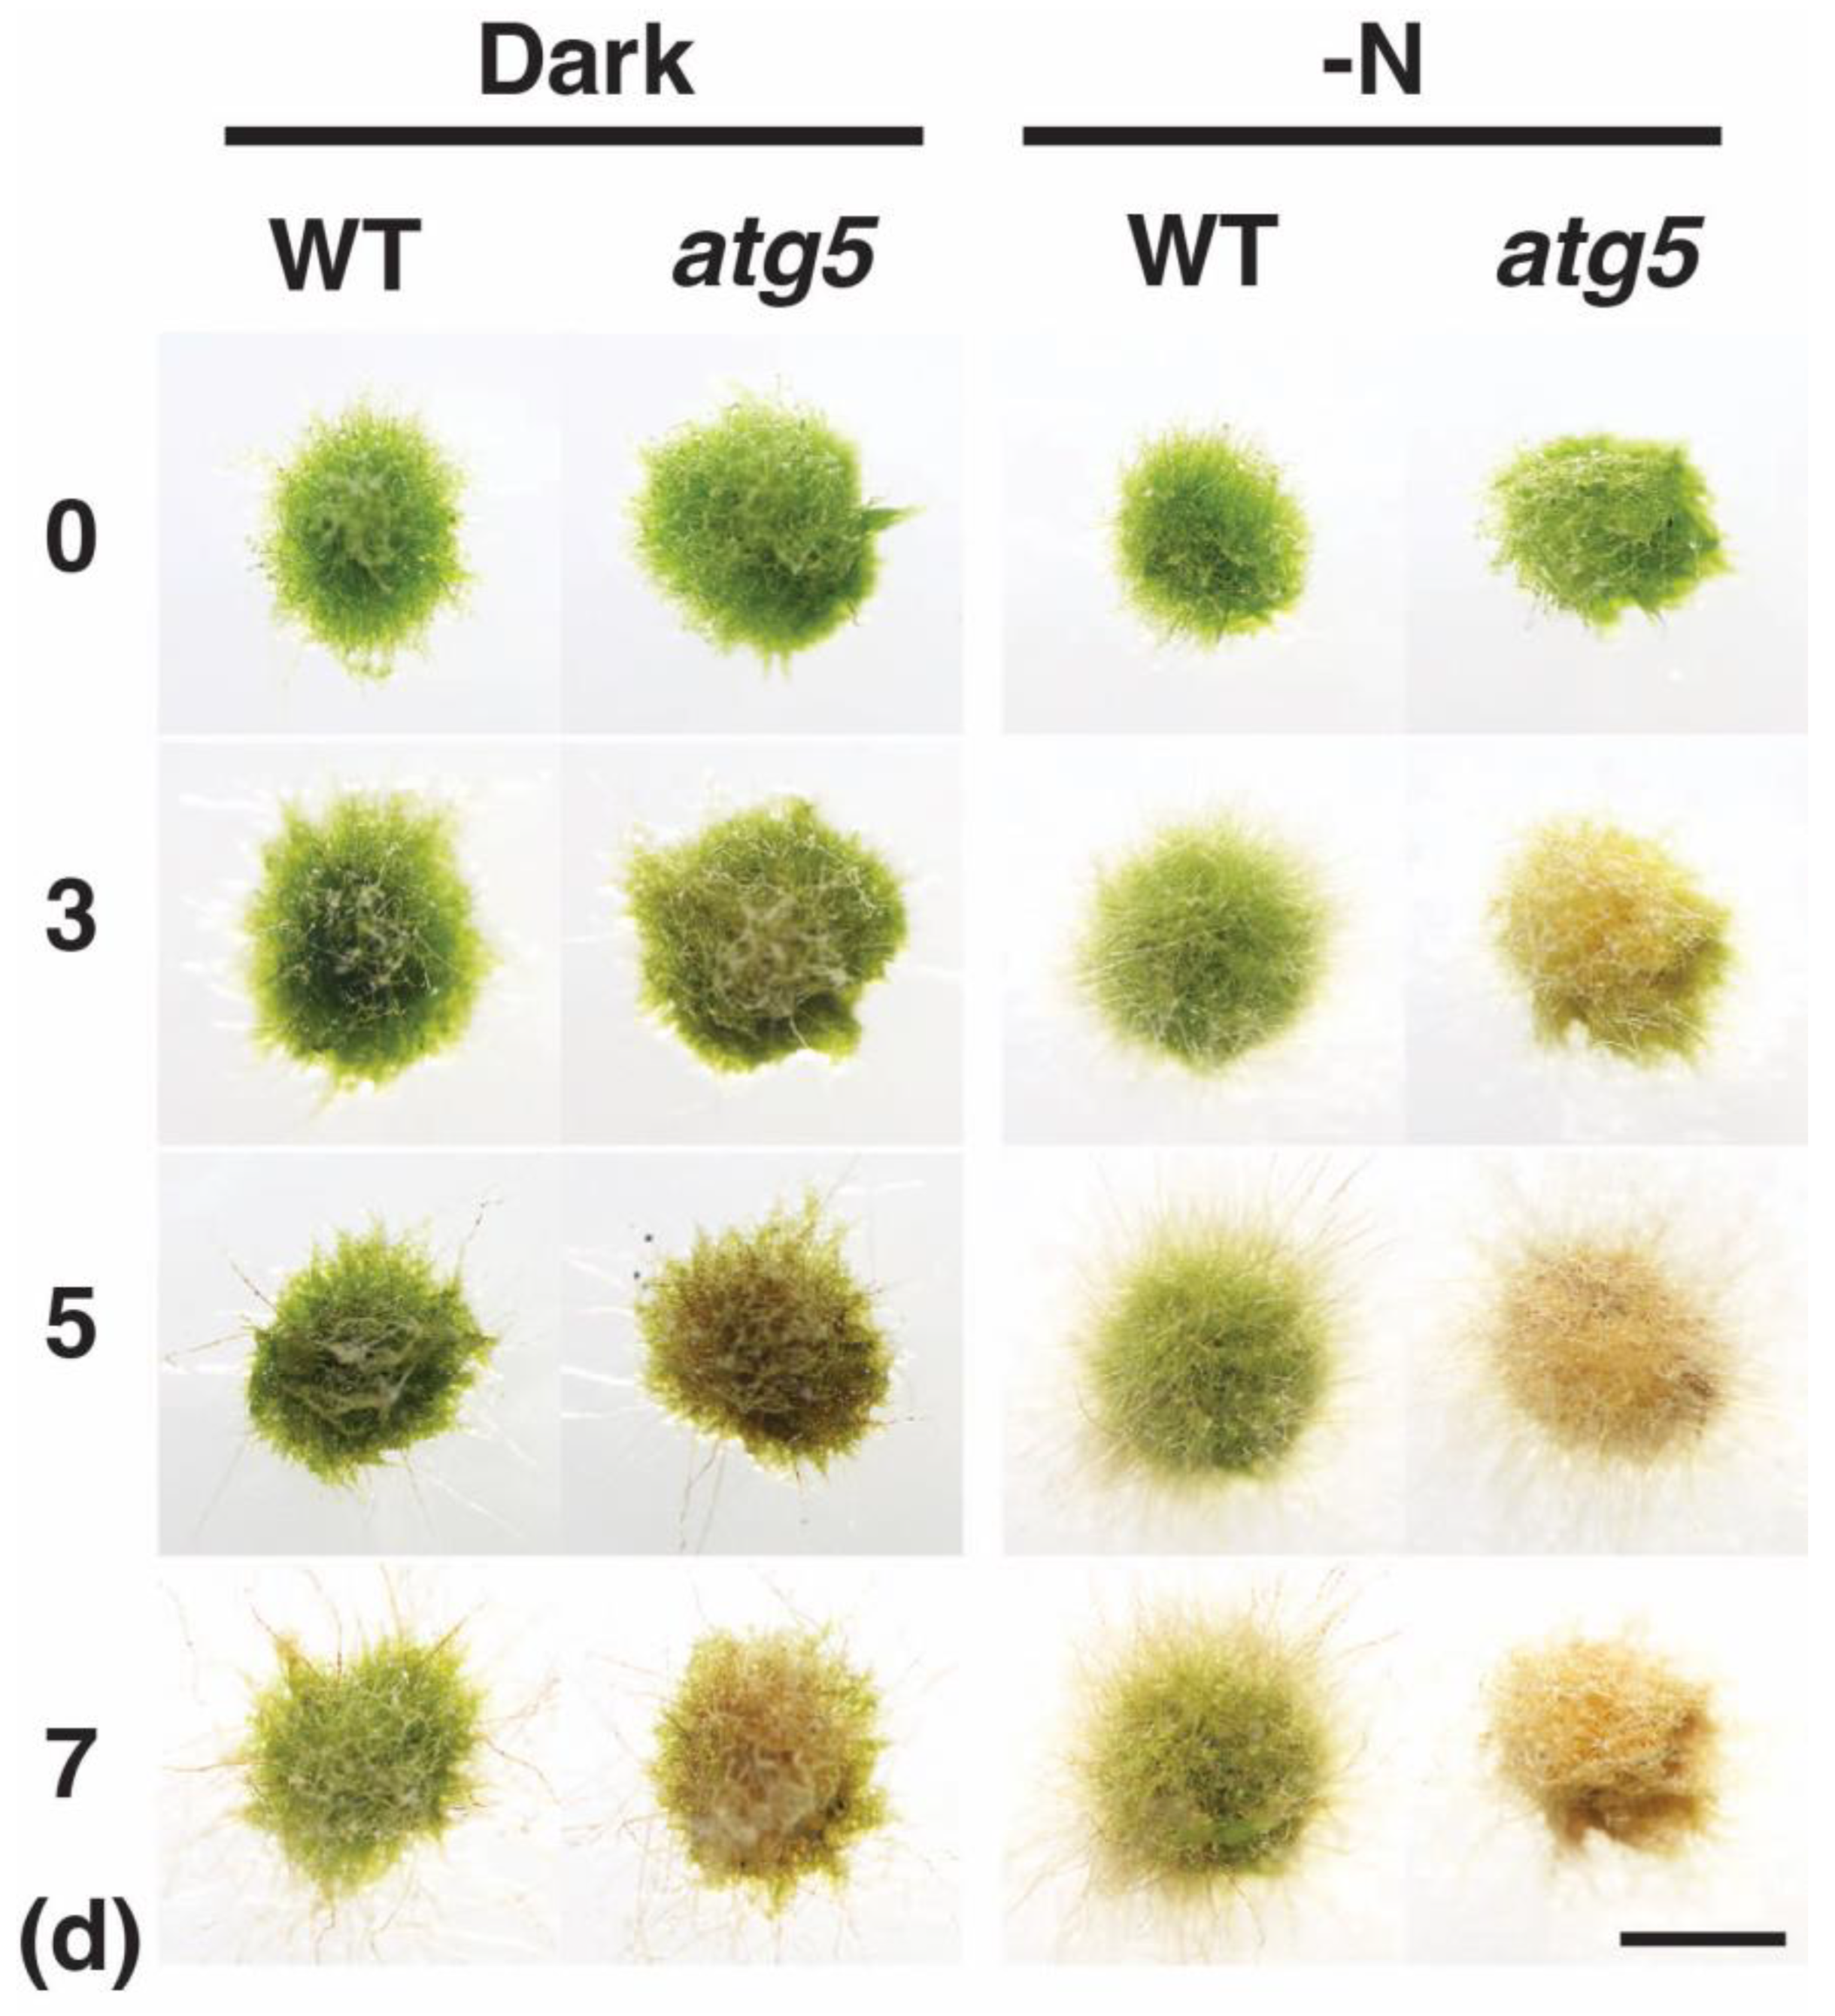
2.1. Premature Senescence Is Induced by Either Darkness or Inorganic Nitrogen Starvation in Physcomitrium

Physcomitrium colonies consisting of protonemal cells senesce prematurely when they are placed under dark conditions, and autophagy-deficient atg5 mutants senesce earlier than the WT strain [12]. The transfer of these colonies to a medium lacking an inorganic nitrogen source also induces premature senescence, which again occurs earlier in the atg5 strain than in the WT strain. Here we compared darkness- and nitrogen-starvation-induced premature senescence in these strains (Figure 1). When kept in the dark, WT colonies became yellowish on day 7, whereas atg5 colonies became yellowish on day 3–5 and brown on day 7 (Figure 1, Dark). When kept on inorganic nitrogen-deprived agar medium under light conditions, WT colonies became yellowish on day 5–7, whereas atg5 colonies became yellowish on day 3 and brown on day 5–7 (Figure 1, -N). Thus, nitrogen-starvation-induced senescence proceeded earlier than dark-induced senescence, and the atg5 mutant senesced earlier than the WT strain in each senescence process.

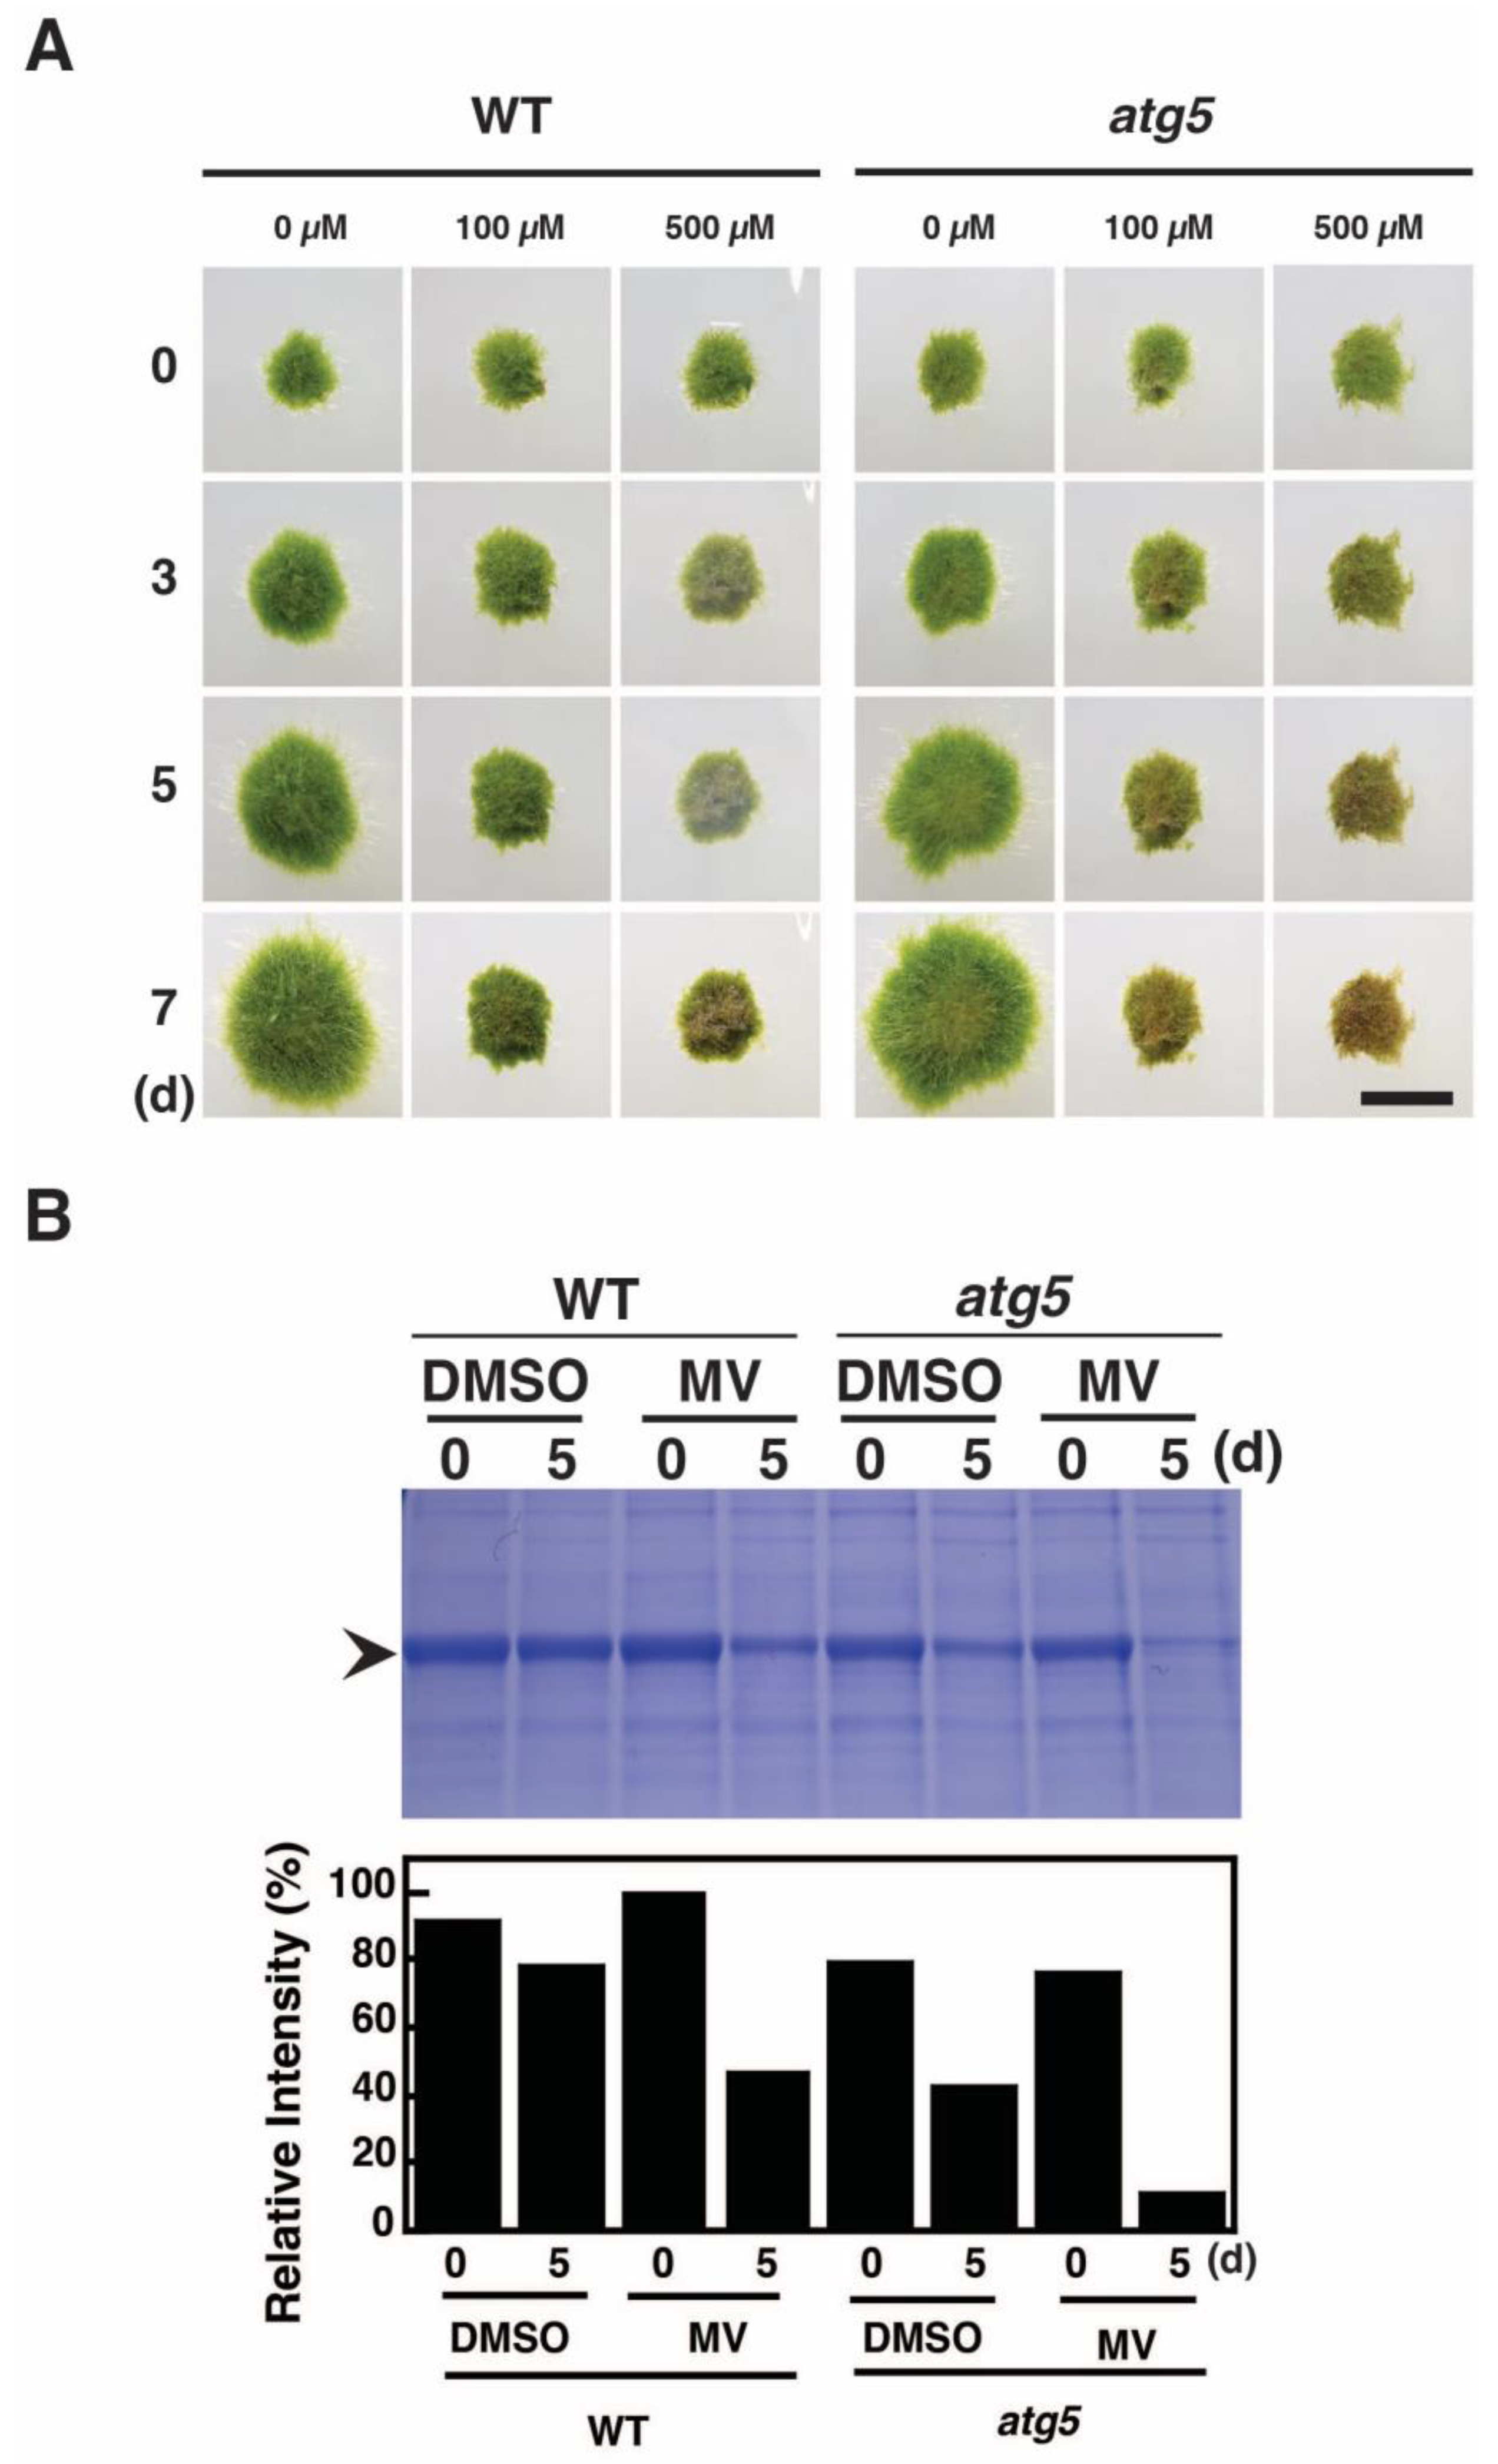
2.2. Methyl Viologen Induces Senescence-Like Symptoms

Methyl viologen (MV) is thought to produce toxic effects in plants by generating ROS that are converted into H2O2 in cells [13]. To examine the effects of H2O2 on Physcomitrium colonies, 7-d-old WT and atg5 colonies were placed on nutrient-sufficient agar medium containing MV and cultured under light conditions. MV at 100 μM inhibited the growth of atg5 colonies and caused yellowing on day 5 (Figure 2A), which progressed until day 7. WT colonies also stopped growing on the medium containing MV at 100 μM, but they remained green until day 7 with only a small yellow portion observed on this day. When the MV concentration was increased to 500 μM, the yellowing occurred more rapidly in atg5 colonies, and the WT colonies showed yellowing on day 3 that proceeded until day 7. Thus, MV causes yellowing in Physcomitrium colonies, and this effect is more pronounced in atg5 colonies compared with that in WT colonies at the same MV concentration.
Additional experiments revealed that atg3 and atg7 mutants showed a similar MV-induced yellowing response to that of atg5 mutants (Supplemental Figure S1). In contrast, ATG5 mutants, in which the Phycomitrium ATG5 gene was introduced into the atg5-3 mutant, exhibited a similar response to that observed in the WT strain (Supplemental Figure S1).
When the colonies were treated with MV in liquid medium under light, the yellowing response was the same as that exhibited on agar medium (Supplemental Figure S2, Light), whereas colonies placed in the dark exhibited dark-induced senescence (Supplemental Figure S2, Dark) and MV treatment had little effect on the progression of this senescence. This result is consistent with the notions that (i) the MV target site is the chloroplast electron transport chain (ETC) and (ii) light is required for the MV-induced production of ROS. Conversely, the result also supports the notion that yellowing is caused by MV-produced ROS under light conditions.
Premature senescence induced by darkness or nitrogen starvation is accompanied by a decrease in Rubisco content [12]. Thus, we also examined the effect of MV treatment on Rubisco content. WT and atg5 colonies were transferred into liquid BCDATG medium containing MV and cultured under light conditions. Rubisco levels per fresh weight (FW) decreased significantly 5 d after MV treatment in both WT and atg5 strains (Figure 2B, MV), although these levels were also reduced by the control treatment (DMSO) due to the increase in water content in the colonies upon initiation of liquid culture. Notably, the MV-induced decrement in Rubisco content was higher in atg5 colonies than that in WT colonies, indicating that MV facilitates the net degradation of Rubisco and does so more drastically in the atg5 mutant relative to the WT strain.
Taken together, these results show that MV treatment induces senescence symptoms, yellowing, and net Rubisco degradation in Physcomitrium.

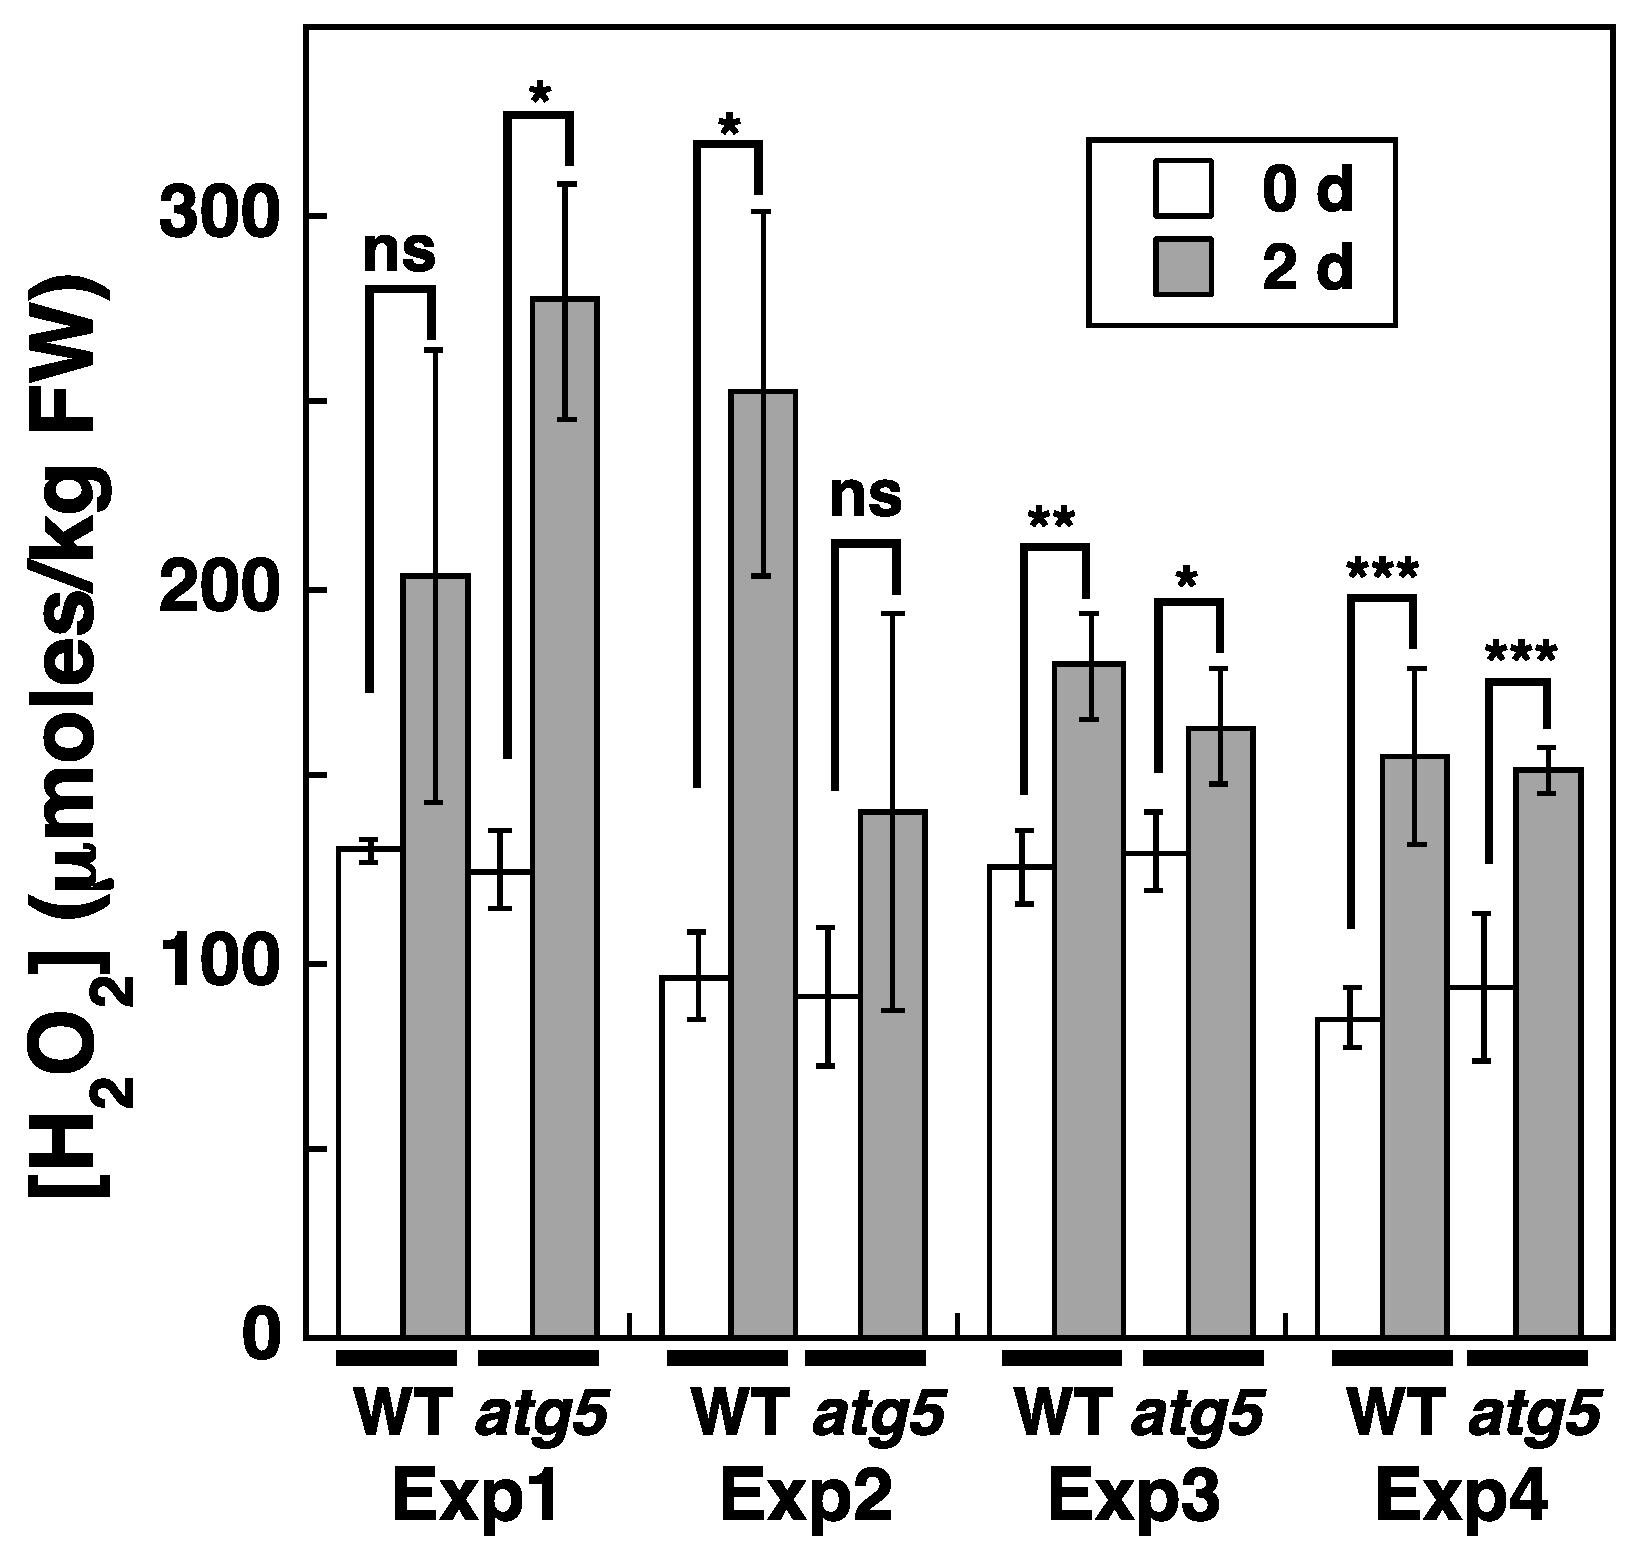
2.3. MV Treatment Increases Cellular H2O2 Levels

To determine whether MV treatment increases cellular H2O2 levels, WT and atg5 colonies were transferred onto BCDATG agar medium containing MV at 0–500 μM, and the subsequent changes in cellular H2O2 levels were measured. When WT and atg5 colonies grown on nutrient-sufficient medium for 7 d were homogenized, the measured H2O2 level was 75–100 μmoles/kg FW, with no significant difference detected between the WT strain and atg5 mutant (Figure 3, 0 d). H2O2 levels tended to increase slightly in both strains after their transfer to fresh BCDATG agar medium lacking MV (Figure 3, 0 µM MV); however, when MV was present in the medium, the H2O2 levels increased up to 200 μmoles/kg FW in both strains after 1 d and remained at similarly high levels after 2 d (Figure 3; 100 μM MV, 500 μM MV). Therefore, MV treatment increases cellular H2O2 levels in both the WT strain and atg5 mutant. Notably, the H2O2 levels 1–2 d after MV treatment did not differ significantly between the two strains, although the yellowing phenotype in the atg5 mutant was more pronounced than that in the WT strain.

2.4. Cellular H2O2 Levels Increase under Dark Conditions

We also investigated whether cellular H2O2 levels change during dark-induced senescence. To measure H2O2 concentrations, WT and atg5 colonies were homogenized 2 d after being placed under dark conditions, i.e., 1 d before the appearance of the yellowing phenotype in the atg5 mutant (Figure 4). Cellular H2O2 levels increased from 75–100 to ~150–250 μmoles/kg FW after 2 d under dark conditions. However, the H2O2 level reached after 2 d varied significantly among our experiments. This variability was thought to be caused mainly by the exposure of the colonies to laboratory light for 10–20 min to measure their FW before homogenization. Here, we show the results of four independent experiments (Figure 4), all of which indicate that cellular H2O2 levels increase under dark conditions in both WT and atg5 colonies.

2.5. Cellular H2O2 Levels Increase Due to Inorganic Nitrogen Starvation

Intracellular H2O2 levels also increased when colonies were placed on a nitrogen-starvation medium. Specifically, cellular H2O2 levels increased from around 100 to ~200 μmoles/kg FW after 1 d, and the increased levels lasted for at least 2 d (Figure 5). No significant difference in H2O2 levels was detected between WT and atg5 colonies.

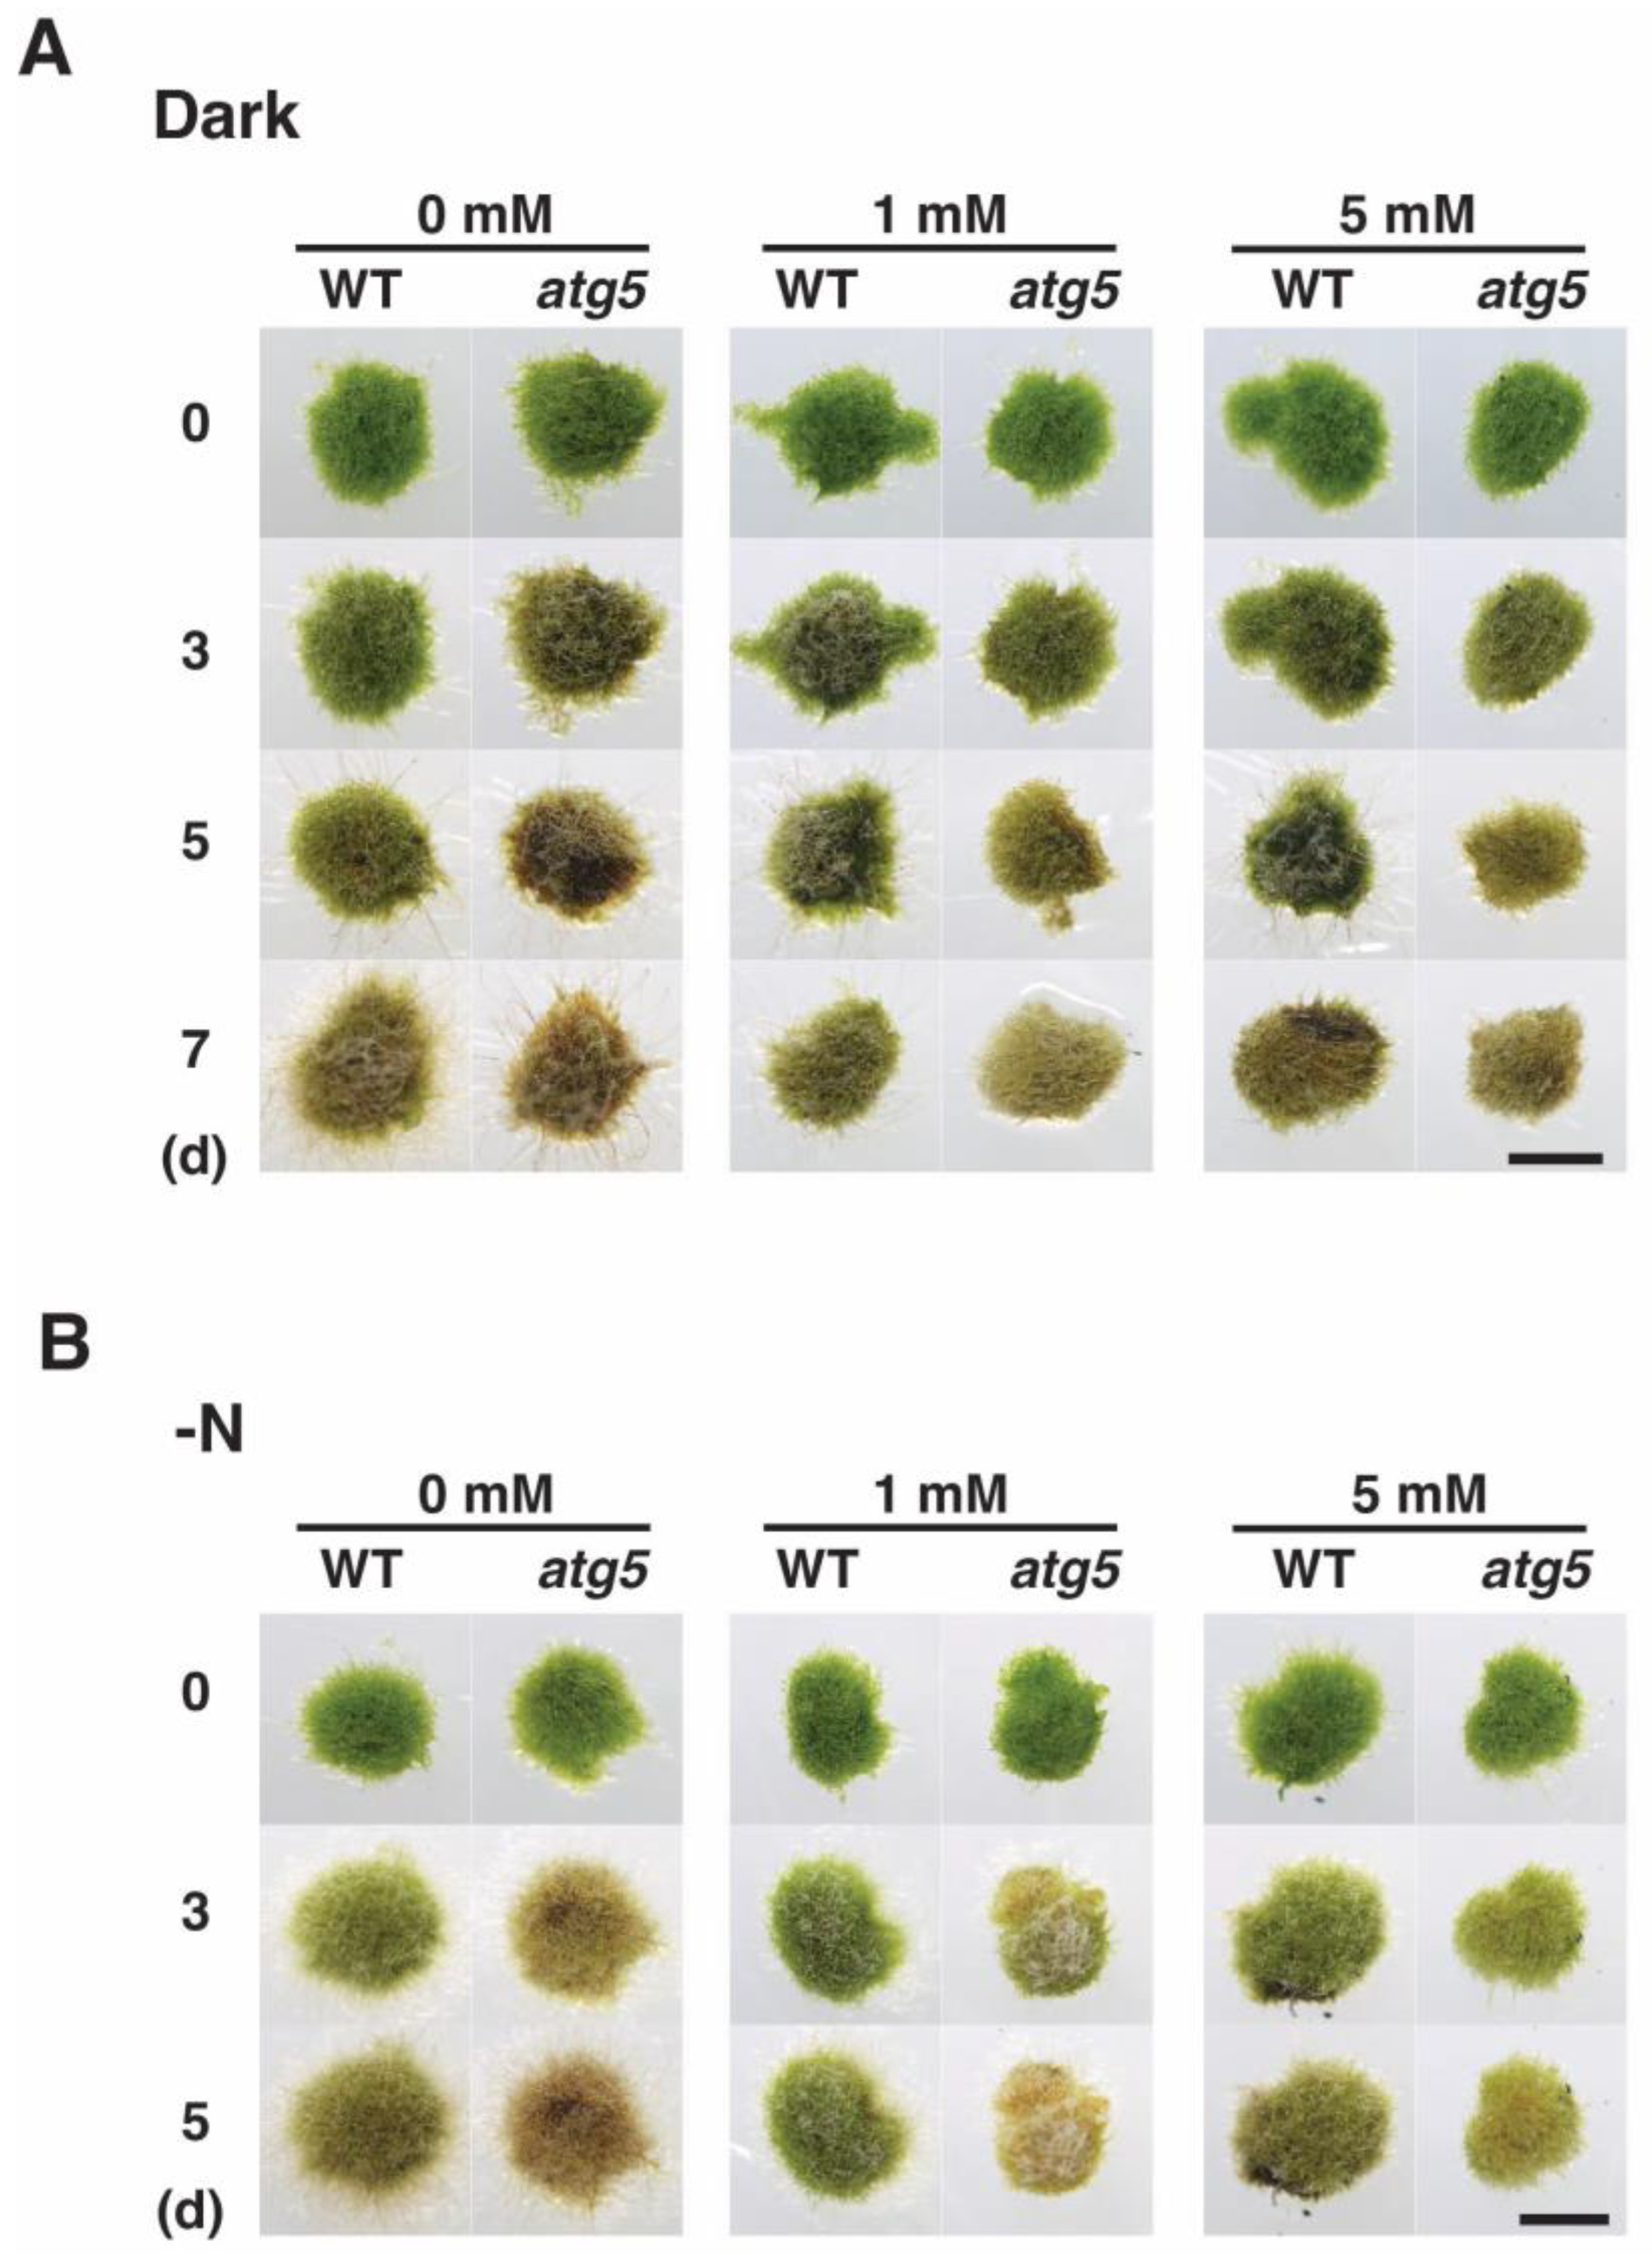
2.6. N-Acetylcysteine, an ROS Scavenger, Decelerates Yellowing

As our results suggested that darkness- and inorganic nitrogen deprivation-induced premature senescence is mediated by increased intracellular H2O2 levels, we investigated whether senescence is prevented or delayed by decreasing these levels. Specifically, we assessed the effects of the ROS scavenger N-acetylcysteine (NAC), which is thought to lower cellular ROS levels, on senescence. NAC treatment inhibited the progression of dark-induced senescence. In the absence of NAC, atg5 colonies underwent yellowing after 3–5 d, whereas atg5 colonies on a culture medium containing NAC at 1 mM or 5 mM remained visibly greener (Figure 6). WT colonies showed signs of yellowing on day 5 and browning on day 7 in the absence of NAC, but these effects were inhibited in WT colonies on culture medium containing NAC at 1 and 5 mM.
NAC also inhibited nitrogen-starvation-induced premature senescence. Treatment with NAC at 5 mM inhibited the yellowing of atg5 colonies that typically manifested on days 3–5, whereas treatment with NAC at 1 mM only partially inhibited the yellowing of atg5 colonies on days 3–5. The slight yellowing of WT colonies on days 3 and 5 was also inhibited by treatment with NAC at 1–5 mM. These results suggest that reducing H2O2 levels inhibits the progression of both darkness- and nitrogen-starvation-induced senescence, and they support the notion that increased ROS levels mediate the induction and/or progression of premature senescence in Physcomitrium.

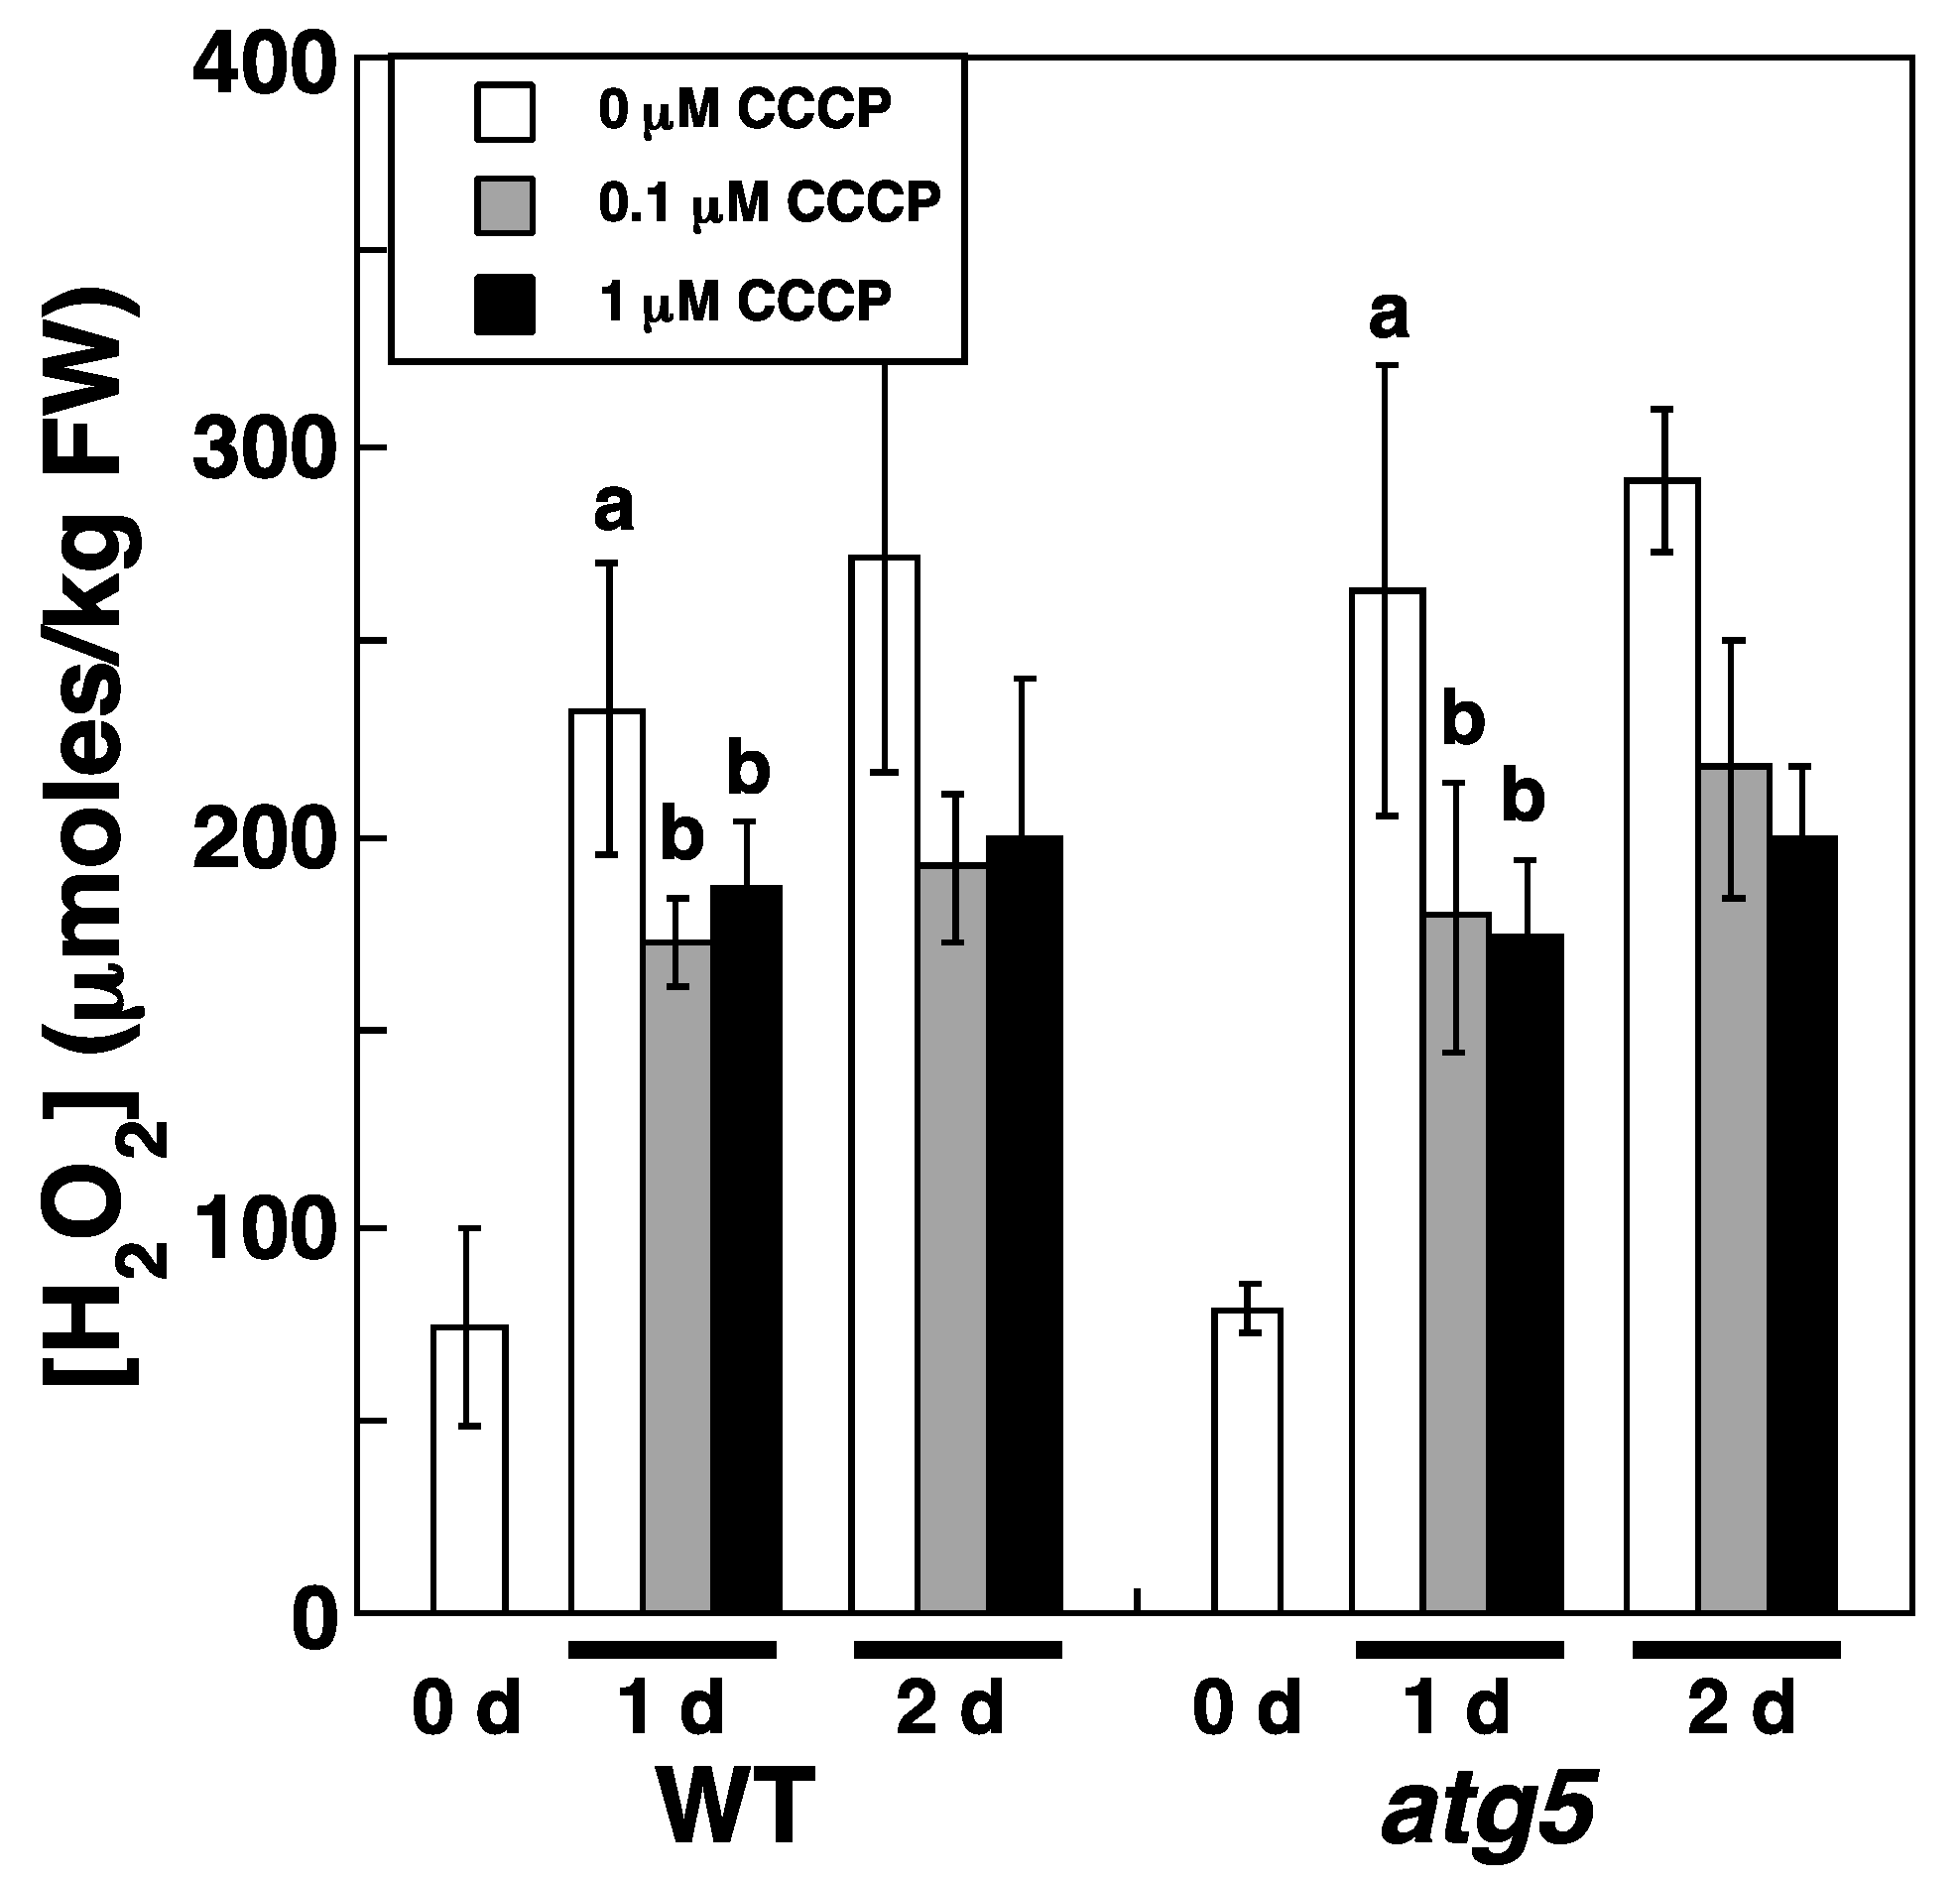
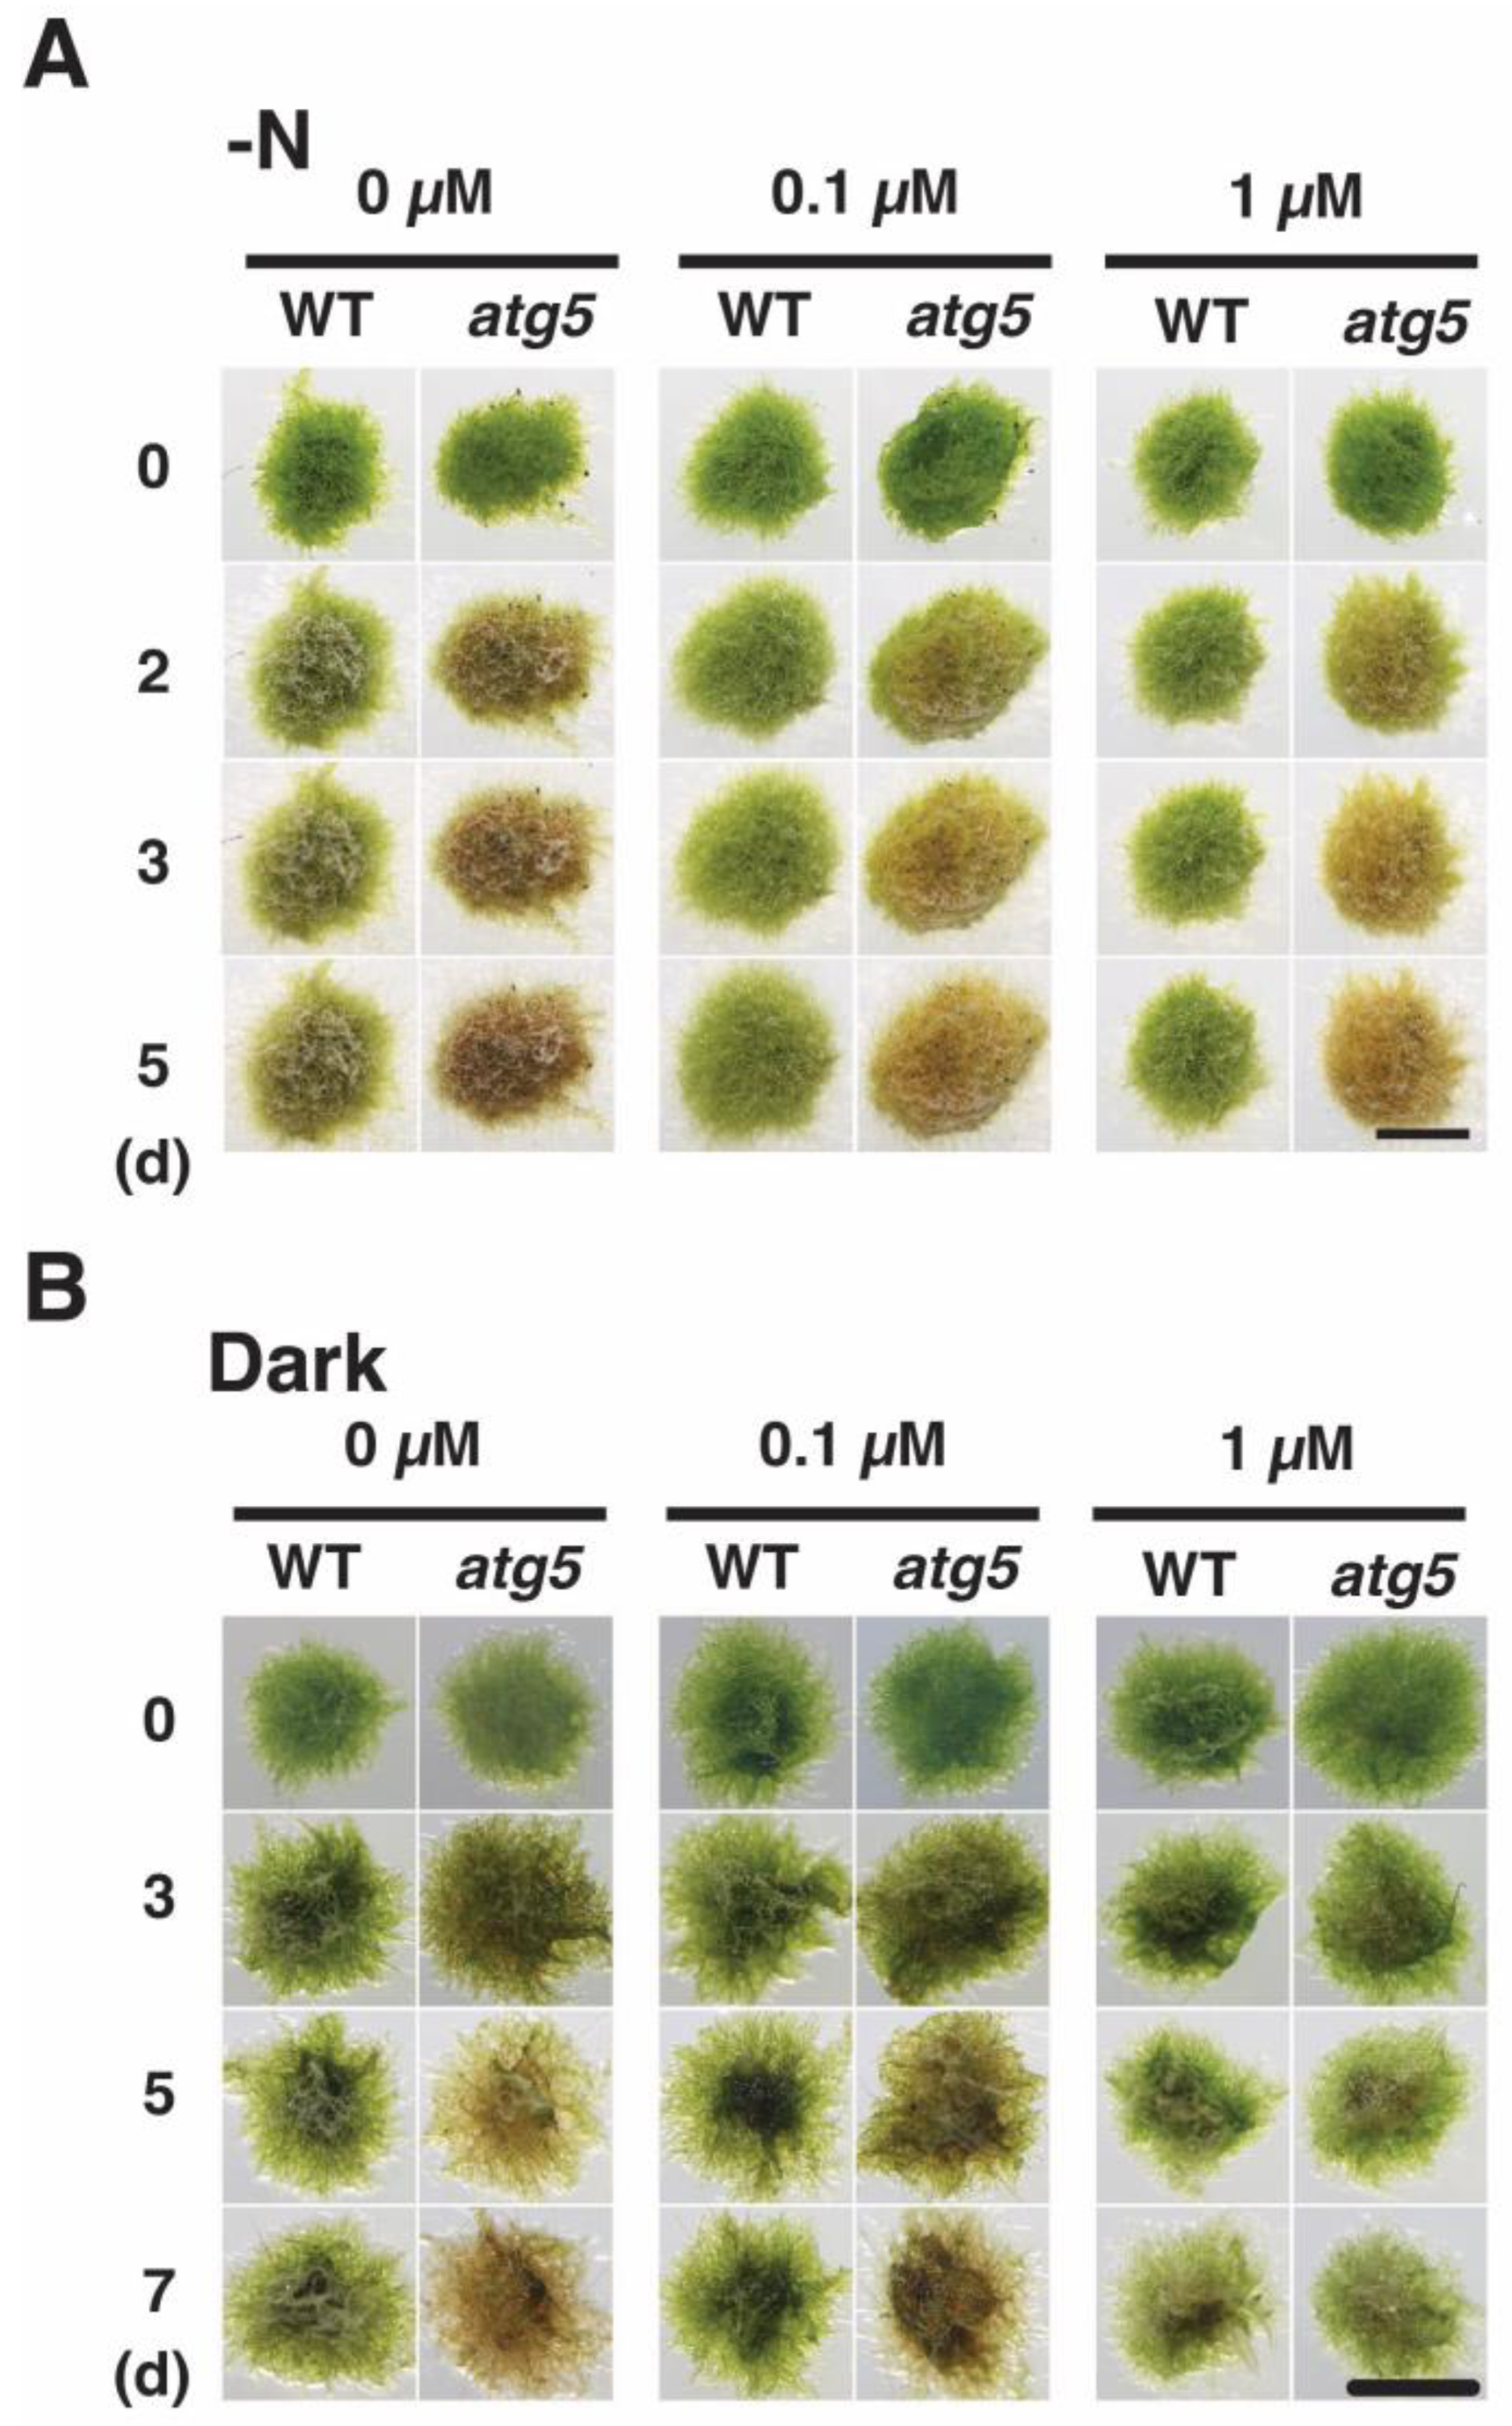
2.7. Carbonyl Cyanide m-Chlorophenylhydrazone Lowers H2O2 Levels and Decelerates Senescence under Nitrogen Starvation Conditions

We attributed the increase in H2O2 levels under dark and nitrogen starvation conditions to an increase in ROS production. If ROS production is caused by ETC activity in mitochondria and/or chloroplasts, an uncoupler of the ETC, carbonyl cyanide m-chlorophenylhydrazone (CCCP), should reduce ROS generation, which would in turn reduce H2O2 levels. Therefore, we investigated whether CCCP affects the increase in cellular H2O2 levels under inorganic nitrogen starvation conditions. We chose not to investigate the effect of CCCP on H2O2 levels under dark conditions because H2O2 levels varied markedly under such conditions (Figure 4). CCCP inhibited the increase in H2O2 levels that occurs under nitrogen starvation conditions. Specifically, the transfer of WT and atg5 colonies to an inorganic nitrogen-deprived medium increased H2O2 levels in both strains from 75–100 to >200 μmoles/kg FW; however, the addition of CCCP (0.1 and 1.0 μM) to the medium reduced this increase in H2O2 levels in both strains to <200 μmoles/kg FW (Figure 7). This result suggests that ROS production via the ETC in mitochondria and/or chloroplasts is increased in Physcomitrium under nitrogen starvation conditions, leading to increased H2O2 levels.
We also investigated the effect of CCCP on yellowing by placing the colonies on inorganic nitrogen-deprived agar medium containing CCCP. In the absence of CCCP, WT colonies yellowed on day 2–5; however, yellowing was inhibited in the presence of CCCP at 0.1 and 1.0 μM (Figure 8A). When CCCP was absent, atg5 colonies browned on day 2–5, whereas such browning was partially inhibited on the medium containing CCCP at 0.1 and 1.0 μM. CCCP treatment also inhibited darkness-induced yellowing. Specifically, atg5 colonies became yellow to brown on day 3–5 in the absence of CCCP, but such yellowing was inhibited on the medium containing CCCP at 0.1 and 1.0 μM (Figure 8B). In the absence of CCCP treatment, WT colonies underwent slight yellowing under 7 d of darkness, whereas treatment with CCCP at 0.1 and 1.0 μM maintained the bright green color of the colonies.
These results indicate that CCCP inhibits the progression of darkness- and nitrogen-starvation-induced premature senescence. Thus, we assume that CCCP suppressed the increase in H2O2 levels and thereby inhibited the progression of senescence.

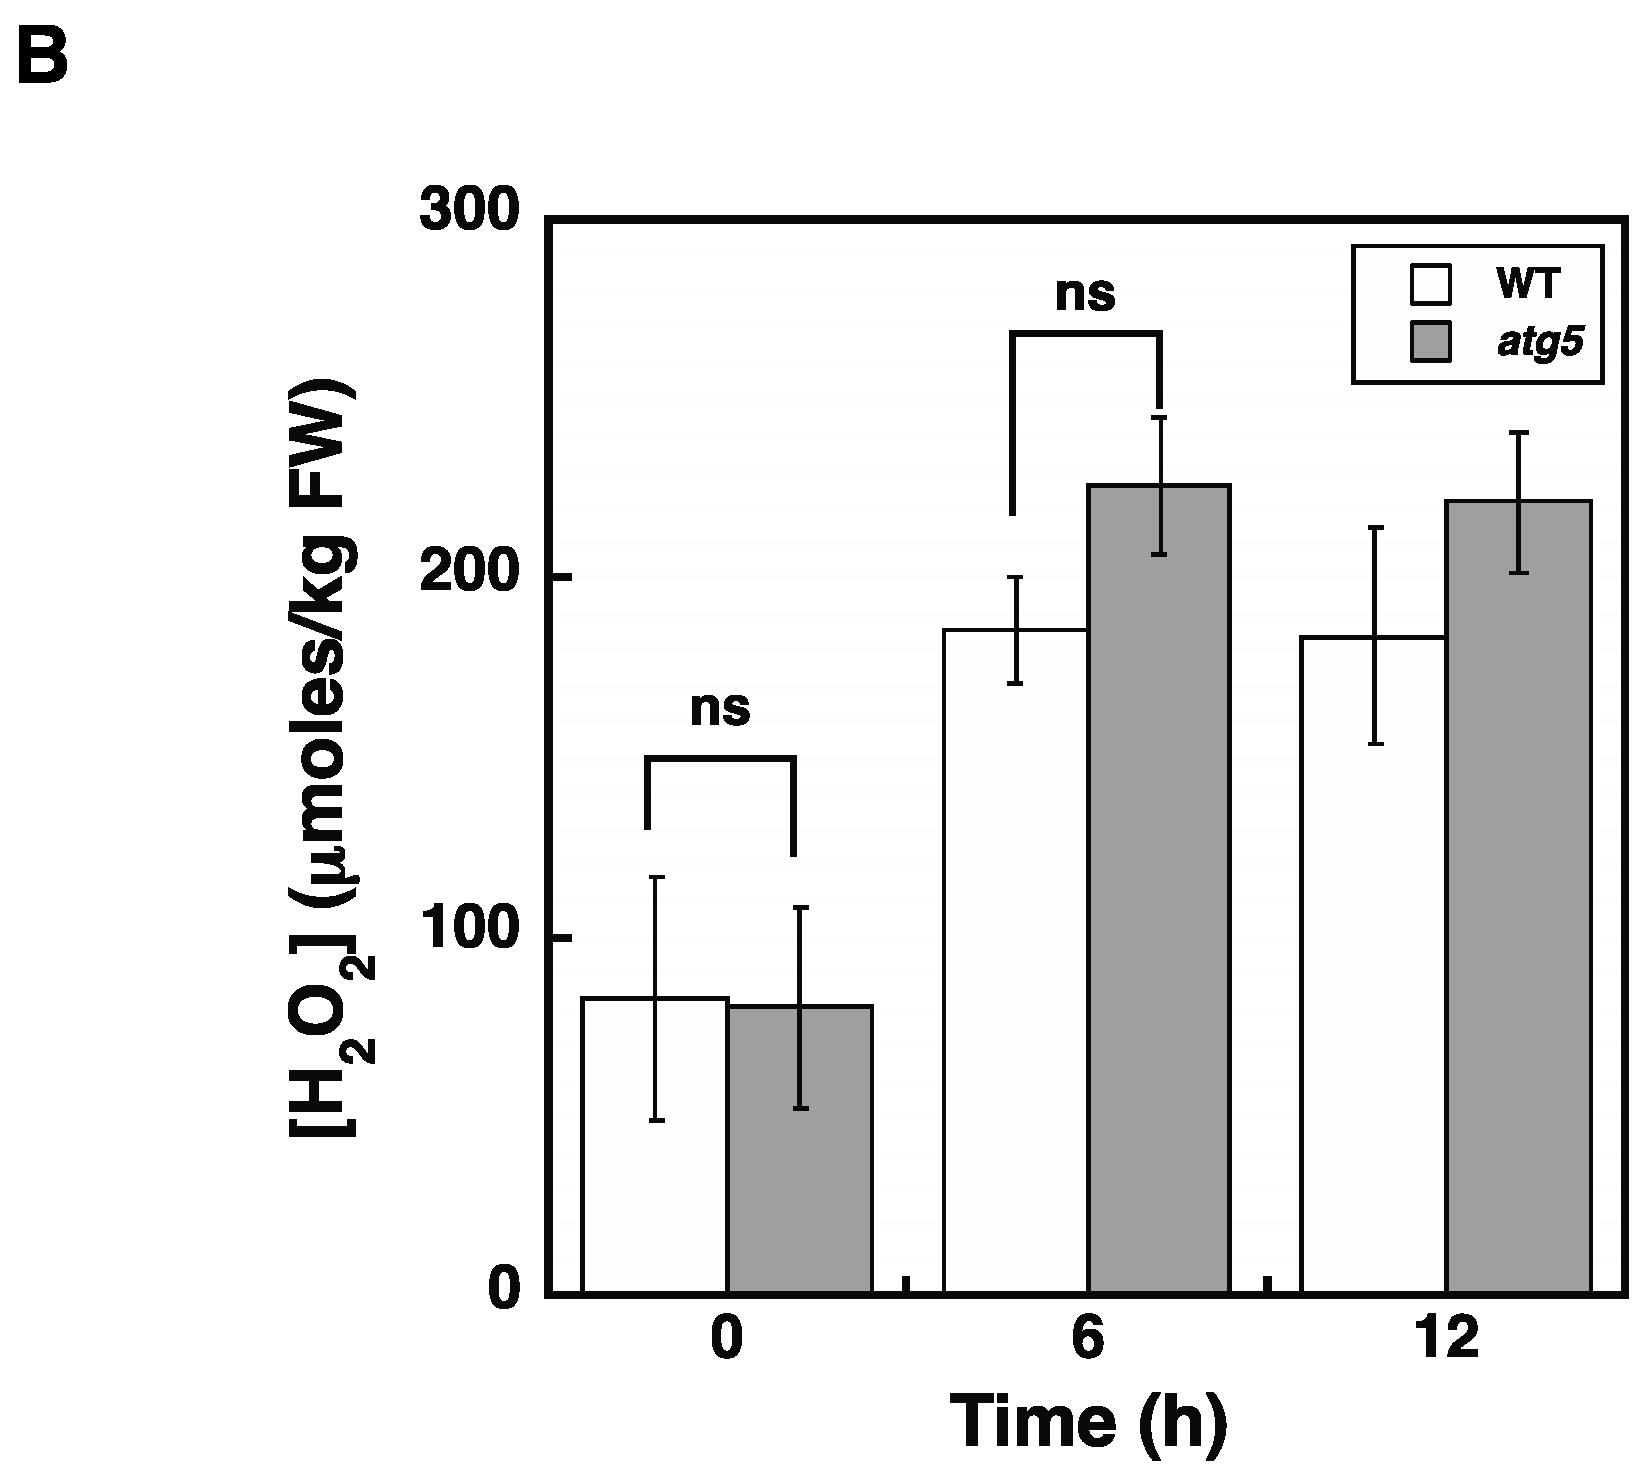
2.8. Elevated H2O2 Levels Alone Cannot Explain the Difference in the Senescence Responses of WT and atg5 Colonies

The results so far strongly suggest that premature senescence induced in the dark and under nitrogen starvation conditions is mediated by elevated levels of H2O2. However, the onset of both darkness- and nitrogen-starvation-induced senescence occurs earlier and/or the extent of this senescence is higher in the atg5 mutant relative to the WT strain. In contrast, H2O2 levels did not differ between atg5 and WT colonies after 2–3 d following their transfer to the dark or after 1–2 d following their transfer to nitrogen-starvation medium, and these times correspond to the time immediately before yellowing occurred in atg5 colonies. Therefore, differences in the speed and/or extent of senescence cannot be explained only by differences in H2O2 levels. However, it remains possible that the timings of the H2O2 level increase differ between the WT and atg5 cells. Therefore, we examined a time course of H2O2 increase after nitrogen starvation treatment. WT and atg5 colonies were transferred onto nitrogen starvation agar medium, after which they were homogenized at 6 h intervals to measure cellular H2O2 levels (Figure 9A). We found that the H2O2 levels in atg5 cells increased as compared to those in WT cells after 6 h from the transfer to starvation medium and then plateaued. In contrast, the cellular H2O2 levels in WT cells increased later than in atg5 cells and reached the same plateau level as in atg5 cells after 18 h. Therefore, when the supply of inorganic nitrogen from the medium is removed and the nitrogen assimilation pathway is immobilized, the intracellular H2O2 levels in WT and atg5 cells increase to reach the same plateau, but atg5 cells reach this plateau around 12–18 h earlier than it is reached by WT cells. This result shows that differences in the timing and/or degree of progression of nitrogen-starvation-induced senescence between WT and atg5 can only be partially explained by differences in the timing of the H2O2 increase. Thus, other factors must be considered when attempting to explain the different senescence responses of WT and atg5 Physcomitrium.
We also examined a time course of H2O2 levels following MV treatment. H2O2 levels increased in both Physcomitrium strains in a similar manner and reached a plateau of around 200 µmoles/kg FW within 6 h (Figure 9B). Considering that senescence symptoms were more severe in atg5 cells than those in WT cells under nitrogen starvation conditions (Figure 1, -N), this result indicates that H2O2 acts as a trigger rather than as an amplifier, and senescence symptoms, such as yellowing, are somehow attenuated in WT cells.

3. Discussion

In this study, we found that MV, an H2O2 generator, increased cellular H2O2 levels and reproduced senescence-like symptoms, e.g., yellowing and Rubisco degradation (Figure 2A and Figure 3), in Physcomitrium colonies. Furthermore, we showed that cellular H2O2 levels increased under conditions of darkness and inorganic nitrogen starvation, both of which induced premature senescence. Moreover, we showed that reducing cellular H2O2 levels using NAC and CCCP treatments decelerates premature senescence. Based on these results, we conclude that H2O2 is a mediator between senescence-inducing stress, such as darkness and inorganic nitrogen starvation, and the symptoms of senescence, such as yellowing and Rubisco degradation, in Physcomitrium cells. We also investigated whether increased H2O2 levels explain the different senescence responses of the WT strain and atg5 mutant and concluded that factors other than higher H2O2 levels should be considered when attempting to explain these differences.
H2O2 levels increased from 70–100 to 150–200 µmoles/kg FW in Physcomitrium cells upon darkness or nitrogen starvation treatment (Figure 4 and Figure 5). Cellular H2O2 levels are generally thought to be maintained by H2O2-producing and degrading reactions. Specifically, ROS are produced as byproducts of several metabolic pathways in mitochondria, chloroplasts, and peroxisomes or produced directly by NADPH oxidase, after which they converge with H2O2, which is decomposed by cellular H2O2-scavenging enzymes, such as catalase, peroxidase, ascorbate peroxidase, superoxide dismutase and antioxidants including glutathione and ascorbic acid. During natural senescence in Arabidopsis and rapeseed, elevated H2O2 levels are due to decreased levels of catalase and ascorbate peroxidase [5]. Activation of NADPH oxidase also contributes to H2O2 production in response to osmotic stress in Arabidopsis [14]. In our study, increased H2O2 levels during stress treatment were reduced by CCCP treatment, which is thought to inhibit ROS production via the ETC of mitochondria and chloroplasts, suggesting that the ETCs of these organelles contribute to H2O2 production under our experimental settings. However, even in the presence of CCCP, H2O2 levels were higher than those detected before stress treatment (Figure 7), indicating that H2O2-producing and/or -scavenging reactions other than those that occur via ETCs, including those involving NADPH oxidase, catalase, and ascorbate peroxidase, might also contribute to H2O2 production.
H2O2 levels increased and reached the same plateau levels in WT and atg5 cells under both dark (Figure 4) and inorganic nitrogen starvation conditions (Figure 5), although senescence in atg5 cells occurred earlier than that in WT cells under both conditions (Figure 1). Therefore, the difference in senescence responses between WT and atg5 cells, such as the rate and extent of senescence, cannot be explained by differences in H2O2 plateau levels. The time course of H2O2 levels after the start of nitrogen starvation treatment varied significantly between WT and atg5 cells over 18 h (Figure 9A). Specifically, H2O2 levels were elevated earlier or accelerated in atg5 cells than in WT cells; however, the difference in the time lag required for H2O2 levels to reach a plateau was no more than 18 h (Figure 9A), which is not sufficient to explain the time lag in the yellowing response, which is longer than 2–3 d (Figure 1). Similarly, treatment with MV elevated H2O2 levels in a similar manner to the same plateau levels in WT and atg5 cells (Figure 3) although the senescence response did differ between the two cell types (Figure 2; Supplemental Figure S1). These results suggest that higher H2O2 levels act as a trigger of senescence but not as an amplifier of senescence and that the rate and/or extent of senescence is predetermined before the colonies are treated with MV or placed on nutrient-starvation medium. The symptoms of senescence in WT cells are probably alleviated by the constitutive autophagy that occurs in the cells before stress is applied. This notion is supported by the findings in Physcomitrium [12], showing that expression of the senescence marker genes PpSEN1 and PpSAG12 is higher in atg5 cells than that in WT cells before dark treatment. Therefore, it is likely that the atg mutants were preparing for senescence during culture on nutrient-sufficient medium under light conditions.
It has been shown that accelerated natural senescence in Arabidopsis atg mutants is attributable to the higher accumulation of salicylic acid and the consequent activation of salicylic acid signaling; however, even when salicylic acid levels are maintained low by expressing bacterial salicylic acid oxidase in atg mutants, dark-induced senescence remains accelerated [7]. In Physcomitrium cells cultured on nutrient-sufficient medium under light, salicylic acid levels do not differ significantly between WT and atg5 cells (personal communication, Dr. Seo). Thus, we still need to determine the factors that are responsible for the difference of premature senescence responses between WT and atg5 cells.

4. Materials and Methods

4.1. Biological Materials

The WT and atg5 strains of Physcomitrium patens were cultured on BCDATG agar medium overlaid with cellophane [12,15]. Once per week, colonies consisting of protonemal cells were collected and transferred onto fresh BCDATG agar medium. Seven-day-old colonies maintained at 25 °C on the medium under continuous illumination from fluorescent lights (5–7 w/m2) were used in this study. For the nitrogen starvation treatment, we used an inorganic nitrogen-depleted BCDATG medium, in which KNO3 was removed and ammonium tartrate was replaced with potassium tartrate in the BCDATG medium.

4.2. H2O2 Measurement

H2O2 content was measured using the ferrous ammonium sulfate/xylenol orange (FOX) method with a few modifications [16]. Approximately 0.05 g fresh weight of colonies was homogenized with 1 mL 25 mM H2SO4. The homogenate was centrifuged at 15,000× g for 5 min. Subsequently, 100 µL of the resulting supernatant was mixed with 1 mL of FOX solution consisting of 150 µM ammonium ferrous sulfate (Nacalai Tesque, Inc., Kyoto, Japan), 150 µM xylenol orange (398187, Sigma-Aldrich, Burlington, MA, USA) and 100 mM sorbitol (Nacalai Tesque, Inc., Kyoto, Japan) in 25 mM H2SO4. The mixture was incubated in the dark for 20 min, after which A560 was measured. Commercially available H2O2 (084-07441, Fujifilm Wako Pure Chemical Corporation, Osaka, Japan) was used as a standard.

4.3. SDS-PAGE

Around 0.05 g fresh weight of colonies was homogenized with a solution containing 0.1 M HEPES-Na (pH 7.5), 1 mM EDTA, 10 µM antipain, 1 mM 4-(2-Aminoethyl) benzenesulfonyl fluoride hydrochloride (AEBSF; Nacalai Tesque, Inc., Kyoto, Japan), and 14 mM 2-mercaptoethanol in a mortar and pestle on ice. The homogenates were centrifuged at 15,000× g and 4 °C for 10 min. The resulting supernatant was collected and mixed with the same volume of 2-fold-concentrated SDS sample buffer (Cosmo Bio Corporation, Tokyo, Japan), and the mixture was boiled at 100 °C for 2 min. The proteins were then loaded into each lane on the basis of FW and separated on SDS-polyacrylamine gels (10%, Ready Gel model E-T10L e-PAGEL, Atto Corporation, Tokyo, Japan), after which they were stained using Coomassie brilliant blue R-250 (Merck, Rahway, NJ, USA). Relative intensities of the Rubisco band were quantitated using Image J (im-agej.nih.gov/ij/download/). The highest value of the band was set as 100%.

4.4. Statistical Analysis

Statistical analysis was performed using KaleidaGraph (Synergy, Stroudsburg, PA, USA). Two groups were compared using Student’s t-test, whereas multiple group comparisons were performed using ANOVA with Tukey’s test. Differences were considered statistically significant at * p < 0.05, ** p < 0.01 or *** p < 0.005.

5. Conclusions

During premature senescence under dark or nitrogen starvation conditions in Physcomitrium cells, increased intracellular H2O2 mediates between stress perception and senescence responses. However, increased H2O2 levels do not explain the earlier senescence phenotype in autophagy-deficient mutants.

Supplementary Materials

The following supporting information can be downloaded at: https://www.mdpi.com/article/10.3390/plants11172280/s1, Supplemental Figure S1. Senescence-like symptoms in atg3, atg7, and ATG5 (in which the Phycomitrium ATG5 gene was introduced into the atg5-3 mutant) mutant Physcomitrium colonies were induced by methyl viologen (MV) treatment under light conditions. Colonies of atg3, atg7, and ATG5 mutants were transferred onto and cultured on a BCDATG agar medium containing MV (0, 100, and 500 µM) under light conditions. Individual colonies in each treatment group were photographed successively immediately (0 d), 3, 5, and 7 d after the transfer. Scale bar: 2 mm; Supplemental Figure S2. Senescence-like symptoms in WT and atg5 mutant Physcomitrium colonies cultured in liquid culture medium were induced by methyl viologen (MV) under light and dark conditions. WT and atg5 colonies were transferred onto and cultured in a BCDATG liquid medium containing MV (0 and 100 µM) under light (left) and dark (right) conditions. Individual colonies in each treatment group were photographed immediately (0 d), 3, 5, and 7 d after the transfer. Scale bar: 2 mm.

Author Contributions

Conceptualization, Y.M., M.A.S. and M.S.R.; Resources, Y.M.; Investigation, M.S.R., M.A.S., M.M.A. and K.M.; Formal analysis, M.S.R. and M.A.S.; Writing—original draft, M.S.R., M.A.S., Y.M., K.M. and Y.I.-A.; Writing—review and editing, M.A.S., Y.M., C.T., K.M. and Y.I.-A.; Supervision, Y.M.; Funding acquisition, Y.M. and C.T. All authors have read and agreed to the published version of the manuscript.

Funding

This research was supported by grants from the Japan Society for the Promotion of Science (JSPS) KAKENHI Grant Number JP23120504, JP25120704, and JP20K02420.

Institutional Review Board Statement

Not applicable.

Informed Consent Statement

Not applicable.

Data Availability Statement

All datasets generated for this study are included in the article/Supplementary Materials and further inquiries can be directed to the corresponding author.

Conflicts of Interest

The authors declare that the research was conducted in the absence of any commercial or financial relationships that could be construed as a potential conflict of interest.

References

  1. Klionsky, D.J.; Ohsumi, Y. Vacuolar import of proteins and organelles from the cytoplasm. Annu. Rev. Cell Dev. Biol. 1999, 15, 1. [Google Scholar] [CrossRef] [PubMed]
  2. Levine, B.; Klionsky, D.J. Development by self-digestion: Molecular mechanisms and biological functions of autophagy. Dev. Cell 2004, 6, 463–477. [Google Scholar] [CrossRef]
  3. Lee, S.; Seo, P.J.; Lee, H.J.; Park, C.M. A NAC transcription factor NTL4 promotes reactive oxygen species production during drought-induced leaf senescence in Arabidopsis. Plant J. 2012, 70, 831–844. [Google Scholar] [CrossRef] [PubMed]
  4. Chen, H.-J.; Lin, Z.-W.; Huang, G.-J.; Lin, Y.-H. Sweet potato calmodulin SPCAM is involved in salt stress-mediated leaf senescence, H2O2 elevation and senescence-associated gene expression. J. Plant Physiol. 2012, 169, 1892–1902. [Google Scholar] [CrossRef] [PubMed]
  5. Bieker, S.; Riester, L.; Stahl, M.; Franzaring, J.; Zentgraf, U. Senescence-specific Alteration of Hydrogen Peroxide Levels in Arabidopsis thaliana and Oilseed Rape Spring Variety Brassica napus L. cv. MozartF. J. Integr. Plant Biol. 2012, 54, 540–554. [Google Scholar] [CrossRef] [PubMed]
  6. Zentgraf, U.; Andrade-Galan, A.G.; Bieker, S. Specificity of H2O2 signaling in leaf senescence: Is the ratio of H2O2 contents in different cellular compartments sensed in Arabidopsis plants? Cell Mol. Biol. Lett. 2022, 27, 4. [Google Scholar] [CrossRef] [PubMed]
  7. Yoshimoto, K.; Jikumaru, Y.; Kamiya, Y.; Kusano, M.; Consonni, C.; Panstruga, R.; Ohsumi, Y.; Shirasu, K. Autophagy negatively regulates cell death by controlling NPR1-dependent salicylic acid signaling during senescence and the innate immune response in Arabidopsis. Plant Cell 2009, 21, 2914–2927. [Google Scholar] [CrossRef] [PubMed]
  8. Lenz, H.D.; Haller, E.; Melzer, E.; Kober, K.; Wurster, K.; Stahl, M.; Bassham, D.C.; Vierstra, R.D.; Parker, J.E.; Bautor, J. Autophagy differentially controls plant basal immunity to biotrophic and necrotrophic pathogens. Plant J. 2011, 66, 818–830. [Google Scholar] [CrossRef] [PubMed]
  9. Huang, H.; Ullah, F.; Zhou, D.-X.; Yi, M.; Zhao, Y. Mechanisms of ROS regulation of plant development and stress responses. Front. Plant Sci. 2019, 10, 800. [Google Scholar] [CrossRef] [PubMed]
  10. Nxele, X.; Klein, A.; Ndimba, B. Drought and salinity stress alters ROS accumulation, water retention, and osmolyte content in sorghum plants. S. Afr. J. Bot. 2017, 108, 261–266. [Google Scholar] [CrossRef]
  11. Rensing, S.A.; Goffinet, B.; Meyberg, R.; Wu, S.Z.; Bezanilla, M. The moss Physcomitrium (Physcomitrella) patens: A model organism for non-seed plants. Plant Cell 2020, 32, 1361–1376. [Google Scholar] [CrossRef] [PubMed]
  12. Mukae, K.; Inoue, Y.; Moriyasu, Y. ATG5-knockout mutants of Physcomitrella provide a platform for analyzing the involvement of autophagy in senescence processes in plant cells. Plant Signal. Behav. 2015, 10, e1086859. [Google Scholar] [CrossRef] [PubMed]
  13. Cui, F.; Brosché, M.; Shapiguzov, A.; He, X.-Q.; Vainonen, J.P.; Leppälä, J.; Trotta, A.; Kangasjärvi, S.; Salojärvi, J.; Kangasjärvi, J. Interaction of methyl viologen-induced chloroplast and mitochondrial signaling in Arabidopsis. Free Radic. Biol. Med. 2019, 134, 555–566. [Google Scholar] [CrossRef] [PubMed]
  14. Ben Rejeb, K.; Lefebvre-De Vos, D.; Le Disquet, I.; Leprince, A.S.; Bordenave, M.; Maldiney, R.; Jdey, A.; Abdelly, C.; Savouré, A. Hydrogen peroxide produced by NADPH oxidases increases proline accumulation during salt or mannitol stress in Arabidopsis thaliana. New Phytol. 2015, 208, 1138–1148. [Google Scholar] [CrossRef] [PubMed]
  15. Nishiyama, T.; Hiwatashi, Y.; Sakakibara, K.; Kato, M.; Hasebe, M. Tagged mutagenesis and gene-trap in the moss, Physcomitrella patens by shuttle mutagenesis. DNA Res. 2000, 7, 9–17. [Google Scholar] [CrossRef] [PubMed]
  16. Gay, C.; Collins, J.; Gebicki, J.M. Determination of hydroperoxides by the ferric-xylenol orange method. Redox Rep. 1999, 4, 327–328. [Google Scholar] [CrossRef] [PubMed]
Figure 1. Senescence of wild-type (WT) and atg5 mutant Physcomitrium colonies under dark and nitrogen starvation conditions. WT and atg5 colonies were transferred onto and cultured on a nutrient-sufficient BCDATG agar medium in the dark (Dark) or on inorganic nitrogen-depleted BCDATG agar medium under light conditions (-N) for 7 d. Individual colonies in each treatment group were photographed immediately (0 d) and 3, 5, and 7 d after transfer. In–N, the same colonies were photographed successively for 7 d. Scale bar: 2 mm.
Plants 11 02280 g001
Figure 2. Methyl viologen (MV) treatment causes senescence-like symptoms in WT and atg5 mutant Physcomitrium colonies cultured on a nutrient-sufficient agar medium. (A) WT and atg5 colonies were transferred onto and cultured on a BCDATG agar medium containing methyl viologen (MV; 0, 100, or 500 µM) for 7 d under light conditions. Individual colonies in each treatment group were successively photographed immediately (0 d) and 3, 5, and 7 d after transfer. Scale bar: 2 mm. (B) (Top) Water-soluble proteins were extracted from WT and atg5 colonies immediately (0 d) and 5 d after the transfer onto BCDATG agar medium containing MV (100 µM) or DMSO (as a solvent control) and analyzed using SDS-PAGE. The gel was stained with Coomassie brilliant blue. Proteins were loaded into each lane based on fresh weight. Arrowhead, Rubisco large subunit. (Bottom) Rubisco large subunit levels were estimated using densitometry and Image J (imagej.nih.gov/ij/download/).
Plants 11 02280 g002
Figure 3. Effects of MV on changes in intracellular H2O2 levels in WT and atg5 mutant Physcomitrium colonies cultured on a nutrient-sufficient agar medium. WT and atg5 colonies were transferred onto and cultured on a BCDATG agar medium containing MV (0, 100, and 500 µM) under light conditions. Intracellular H2O2 levels were measured immediately (0 d) as well as 1 d, and 2 d after transfer. The data are represented as the means ± standard deviation (SD) (n = 3, *** p < 0.005, * p < 0.05).
Plants 11 02280 g003
Figure 4. Changes in intracellular H2O2 levels in WT and atg5 Physcomitrium colonies cultured on a nutrient-sufficient medium in the dark. WT and atg5 colonies were transferred onto and cultured on a fresh BCDATG agar medium under dark conditions. Intracellular H2O2 levels were measured immediately (0 d) and 2 d after transfer. The results were obtained from four independent experiments. The data are represented as the means ± SD (n = 3, * p < 0.05, ** p < 0.01, *** p < 0.005). ns, not significant.
Plants 11 02280 g004
Figure 5. Changes in intracellular H2O2 levels in WT and atg5 Physcomitrium colonies cultured on an inorganic nitrogen-starvation medium. WT and atg5 colonies were transferred onto and cultured on an inorganic nitrogen-depleted agar medium under light conditions. Intracellular H2O2 levels were measured immediately (0 d) as well as 1 d, and 2 d after the transfer. The data are represented as the means ± SD (n = 3, * p < 0.05).
Plants 11 02280 g005
Figure 6. Effects of N-acetylcysteine (NAC) treatment on darkness- and nitrogen-starvation-induced senescence in WT and atg5 Physcomitrium colonies. (A) WT and atg5 colonies were transferred onto and cultured on a BCDATG agar medium containing NAC (0, 1, and 5 mM) under dark conditions. Individual colonies in each treatment group were photographed immediately (0 d), 3, 5, and 7 d after the transfer. (B) WT and atg5 colonies were transferred onto and cultured on an inorganic nitrogen starvation agar medium containing NAC (0, 1, or 5 mM) under light conditions. Individual colonies in each treatment group were successively photographed immediately (0 d), 3, 5, and 7 d after the transfer. Scale bars: 2 mm.
Plants 11 02280 g006
Figure 7. An uncoupler, carbonyl m-chlorophenylhydrazone (CCCP), inhibits the inorganic nitrogen-starvation-induced increase in intracellular H2O2 levels in WT and atg5 mutant Physcomitrium colonies. WT and atg5 colonies were transferred onto and cultured on a BCDATG agar medium containing CCCP (0, 0.1, and 1.0 µM) under light conditions. Intracellular H2O2 levels were measured immediately (0 d), 1 d, and 2 d after the transfer. The data are represented as the means ± SD (n = 3). A two-way ANOVA was performed to analyze the effects of WT or atg5 and 0, 0.1, or 1 µM CCCP on H2O2 levels at 1 d and found no significant difference in the interaction between the two strains and the three CCCP concentrations or in H2O2 levels between WT and atg5 strains. Therefore, the values obtained in WT and atg5 strains were pooled to compare the effects of the three CCCP concentrations on H2O2 levels by one-way ANOVA. Different letters denote significant differences from each other, p < 0.005.
Plants 11 02280 g007
Figure 8. CCCP inhibits inorganic nitrogen-starvation- and dark-induced senescence in WT and atg5 mutant Physcomitrium colonies. (A) WT and atg5 colonies were transferred onto and cultured on an inorganic nitrogen-depleted agar medium containing CCCP (0, 0.1, and 1.0 µM) under light conditions. Individual colonies in each treatment group were successively photographed immediately (0 d), 3, 5, and 7 d after the transfer. (B) WT and atg5 colonies were transferred onto and cultured on a BCDATG agar medium containing CCCP (0, 0.1, and 1.0 µM) under dark conditions. Individual colonies in each treatment group were photographed immediately (0 d), 3, 5, and 7 d after the transfer. Scale bar: 2 mm.
Plants 11 02280 g008
Figure 9. Intracellular H2O2 levels are increased in atg5 colonies earlier than those in WT colonies in response to nitrogen starvation. (A) WT and atg5 colonies were transferred onto and cultured on an inorganic nitrogen-depleted agar medium under light conditions. Intracellular H2O2 levels were measured for 24 h. The data are represented as the means ± SD (n = 3). (B) WT and atg5 colonies were transferred onto and cultured on a BCDATG agar medium containing methyl viologen (0 and 100 µM) under light conditions. Intracellular H2O2 levels were measured for 12 h. The data are represented as the means ± SD (n = 3, *** p < 0.005). ns, not significant.
Plants 11 02280 g009aPlants 11 02280 g009b
Publisher’s Note: MDPI stays neutral with regard to jurisdictional claims in published maps and institutional affiliations.

