Article

Expression and Functional Analyses of the WIP Gene Family in Arabidopsis

by
David Diaz-Ramirez
1,
Ury Sarai Diaz-Garcia
1,
Guadalupe Magdaleno-Garcia
1,
Gunnar Huep
2,
Ingo Appelhagen
2,
Martin Sagasser
2 and
Nayelli Marsch-Martinez
1,*
1
Department of Biotechnology and Biochemistry, Center for Research and Advanced Studies of the National Polytechnic Institute, Irapuato 36824, Mexico
2
Genetics and Genomics of Plants, Faculty of Biology, Bielefeld University, Universitätsstraße 27, 33615 Bielefeld, Germany
*
Author to whom correspondence should be addressed.
Plants 2022, 11(15), 2010; https://doi.org/10.3390/plants11152010
Submission received: 30 June 2022 / Revised: 28 July 2022 / Accepted: 28 July 2022 / Published: 1 August 2022

Abstract

:
The WIP family of transcription factors comprises the A1d subgroup of C2H2 zinc finger proteins. This family has six members in Arabidopsis thaliana and most of the known functions have been described by analyzing single knockout mutants. However, it has been shown that WIP2 and its closest paralogs WIP4 and WIP5 have a redundant and essential function in root meristems. It is likely that these and other WIP genes perform more, still unknown, functions. To obtain hints about these other functions, the expression of the six WIP genes was explored. Moreover, phenotypic ana-lyses of overexpressors and wip mutants revealed functions in modulating organ and cell size, stomatal density, and vasculature development.

1. Introduction

WIP proteins are plant transcription factors that contain four zinc finger domains. They show nuclear localization and belong to the A1d subgroup of C2H2 zinc finger proteins [1,2]. WIP genes have been found in all available plant genomes, and mutants have been studied in Arabidopsis thaliana, Cucumis melo, Gerbera hybrida, and the ancestral plant Marchantia polymorpha [1,3,4,5,6]. Marchantia polymorpha, a nonvascular plant, has a single MpWIP representative in its genome. In this plant, MpWIP is required for the development of the air pore complex, a multicellular gas exchange structure [6]. In melon, it has been reported that the expression of the CmWIP1 gene leads to carpel abortion, producing male flowers, while plants that produce only female or hermaphroditic flowers are the result of epigenetic modifications in the promoter of the CmWIP1 gene [4].
Arabidopsis has six members of the WIP family (WIP1 to 6). Altered phenotypes of single mutants have been characterized and described for only three of them (wip1, wip2, and wip6). In Arabidopsis, the founder member of the family WIP1/TRANSPARENT TESTA 1 (WIP1/TT1) is expressed in endothelial cells during seed development. The loss of its function causes a yellow seed phenotype that contrasts with the wild-type (wt) brown seed. Due to this phenotype, the mutant received the name of transparent testa 1 (tt1). The yellow seed color of these mutants is due to the lack of proanthocyanidins [3]. WIP6 is also known as DEFECTIVELY ORGANIZED TRIBUTARIES 5 (DOT5) [7]. Loss-of-function wip6 mutants were reported to present alterations in the venation pattern of the leaves, a delay in leaf and root development, and sometimes alterations in phyllotaxy. It has been suggested that DOT5 is required for normal stem and root development [7].
WIP2 is the member of the WIP gene family that has been most intensively studied, and for which close homologs have been studied in other species. It plays an important role in the development of the transmitting tract, a tissue in the pistil, in which the pollen tubes grow from the stigma to the ovules. The loss of its function affects this tissue and the mutant is, therefore, also referred to as no transmitting tract (ntt) [8]. Moreover, the WIP2 promoter is active during the development of the replum and the overexpression of this gene increases its size, while mutants with loss-of-function have the opposite effect with a reduction in the number of cell rows [9]. Its overexpression also affects lignification, causing fruit indehiscence [10]. Protein–protein interaction assays have revealed that WIP2/NTT interacts with different transcription factors [9]. SEEDSTICK (STK) is one of these interactors, and the stk ntt double mutant has defective septum fusion [11].
Interestingly, while WIP2/NTT is also expressed in more tissues other than the transmitting tract [9,10] including the root meristem [12], the single loss-of-function mutant does not present an evident, severe phenotypic difference to the wild-type. This may be due to redundancy. Indeed, the combination of the mutations in the triple wip2/ntt wip4 wip5 mutant results in plants that do not develop a root [12], revealing an essential, though redundant, function of these genes. This suggests that there are still other unknown functions, and a global exploration of expression and effects of these genes can provide more information about these functions.
In this work, we aimed to explore the function of the members of the Arabidopsis WIP family. We analyzed their expression and the effects of overexpression and loss-of-function in Arabidopsis.

2. Results

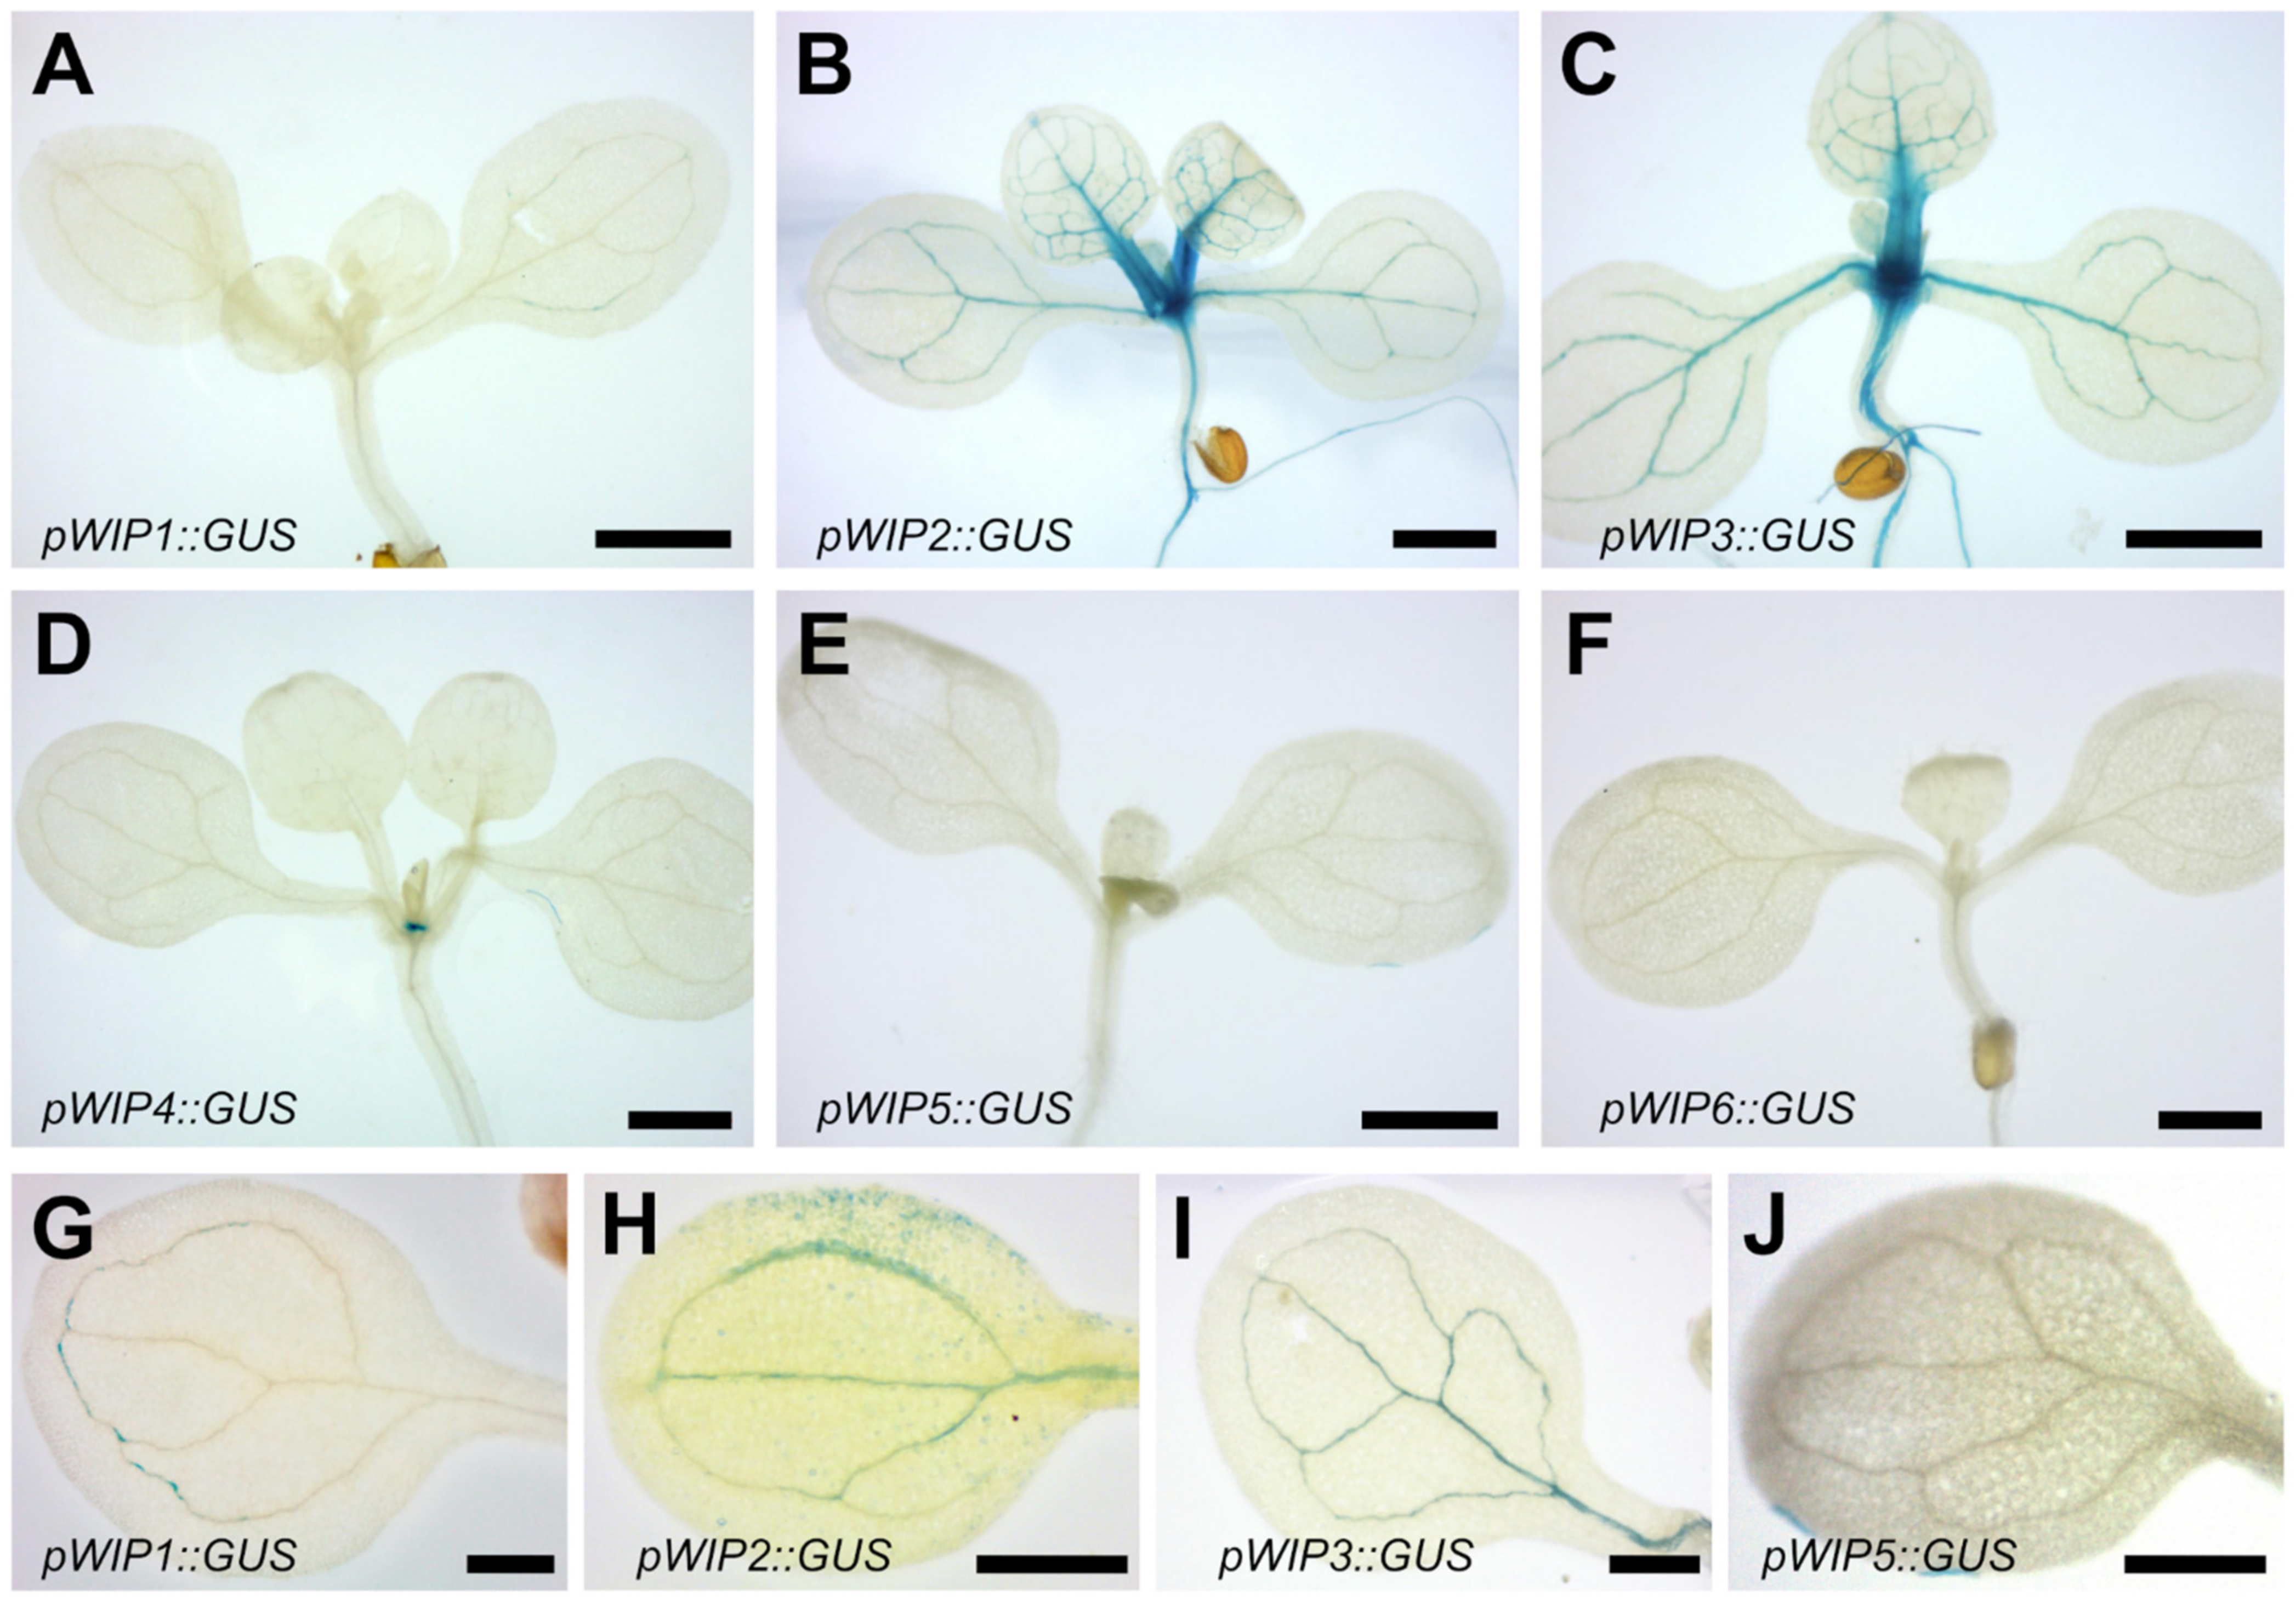
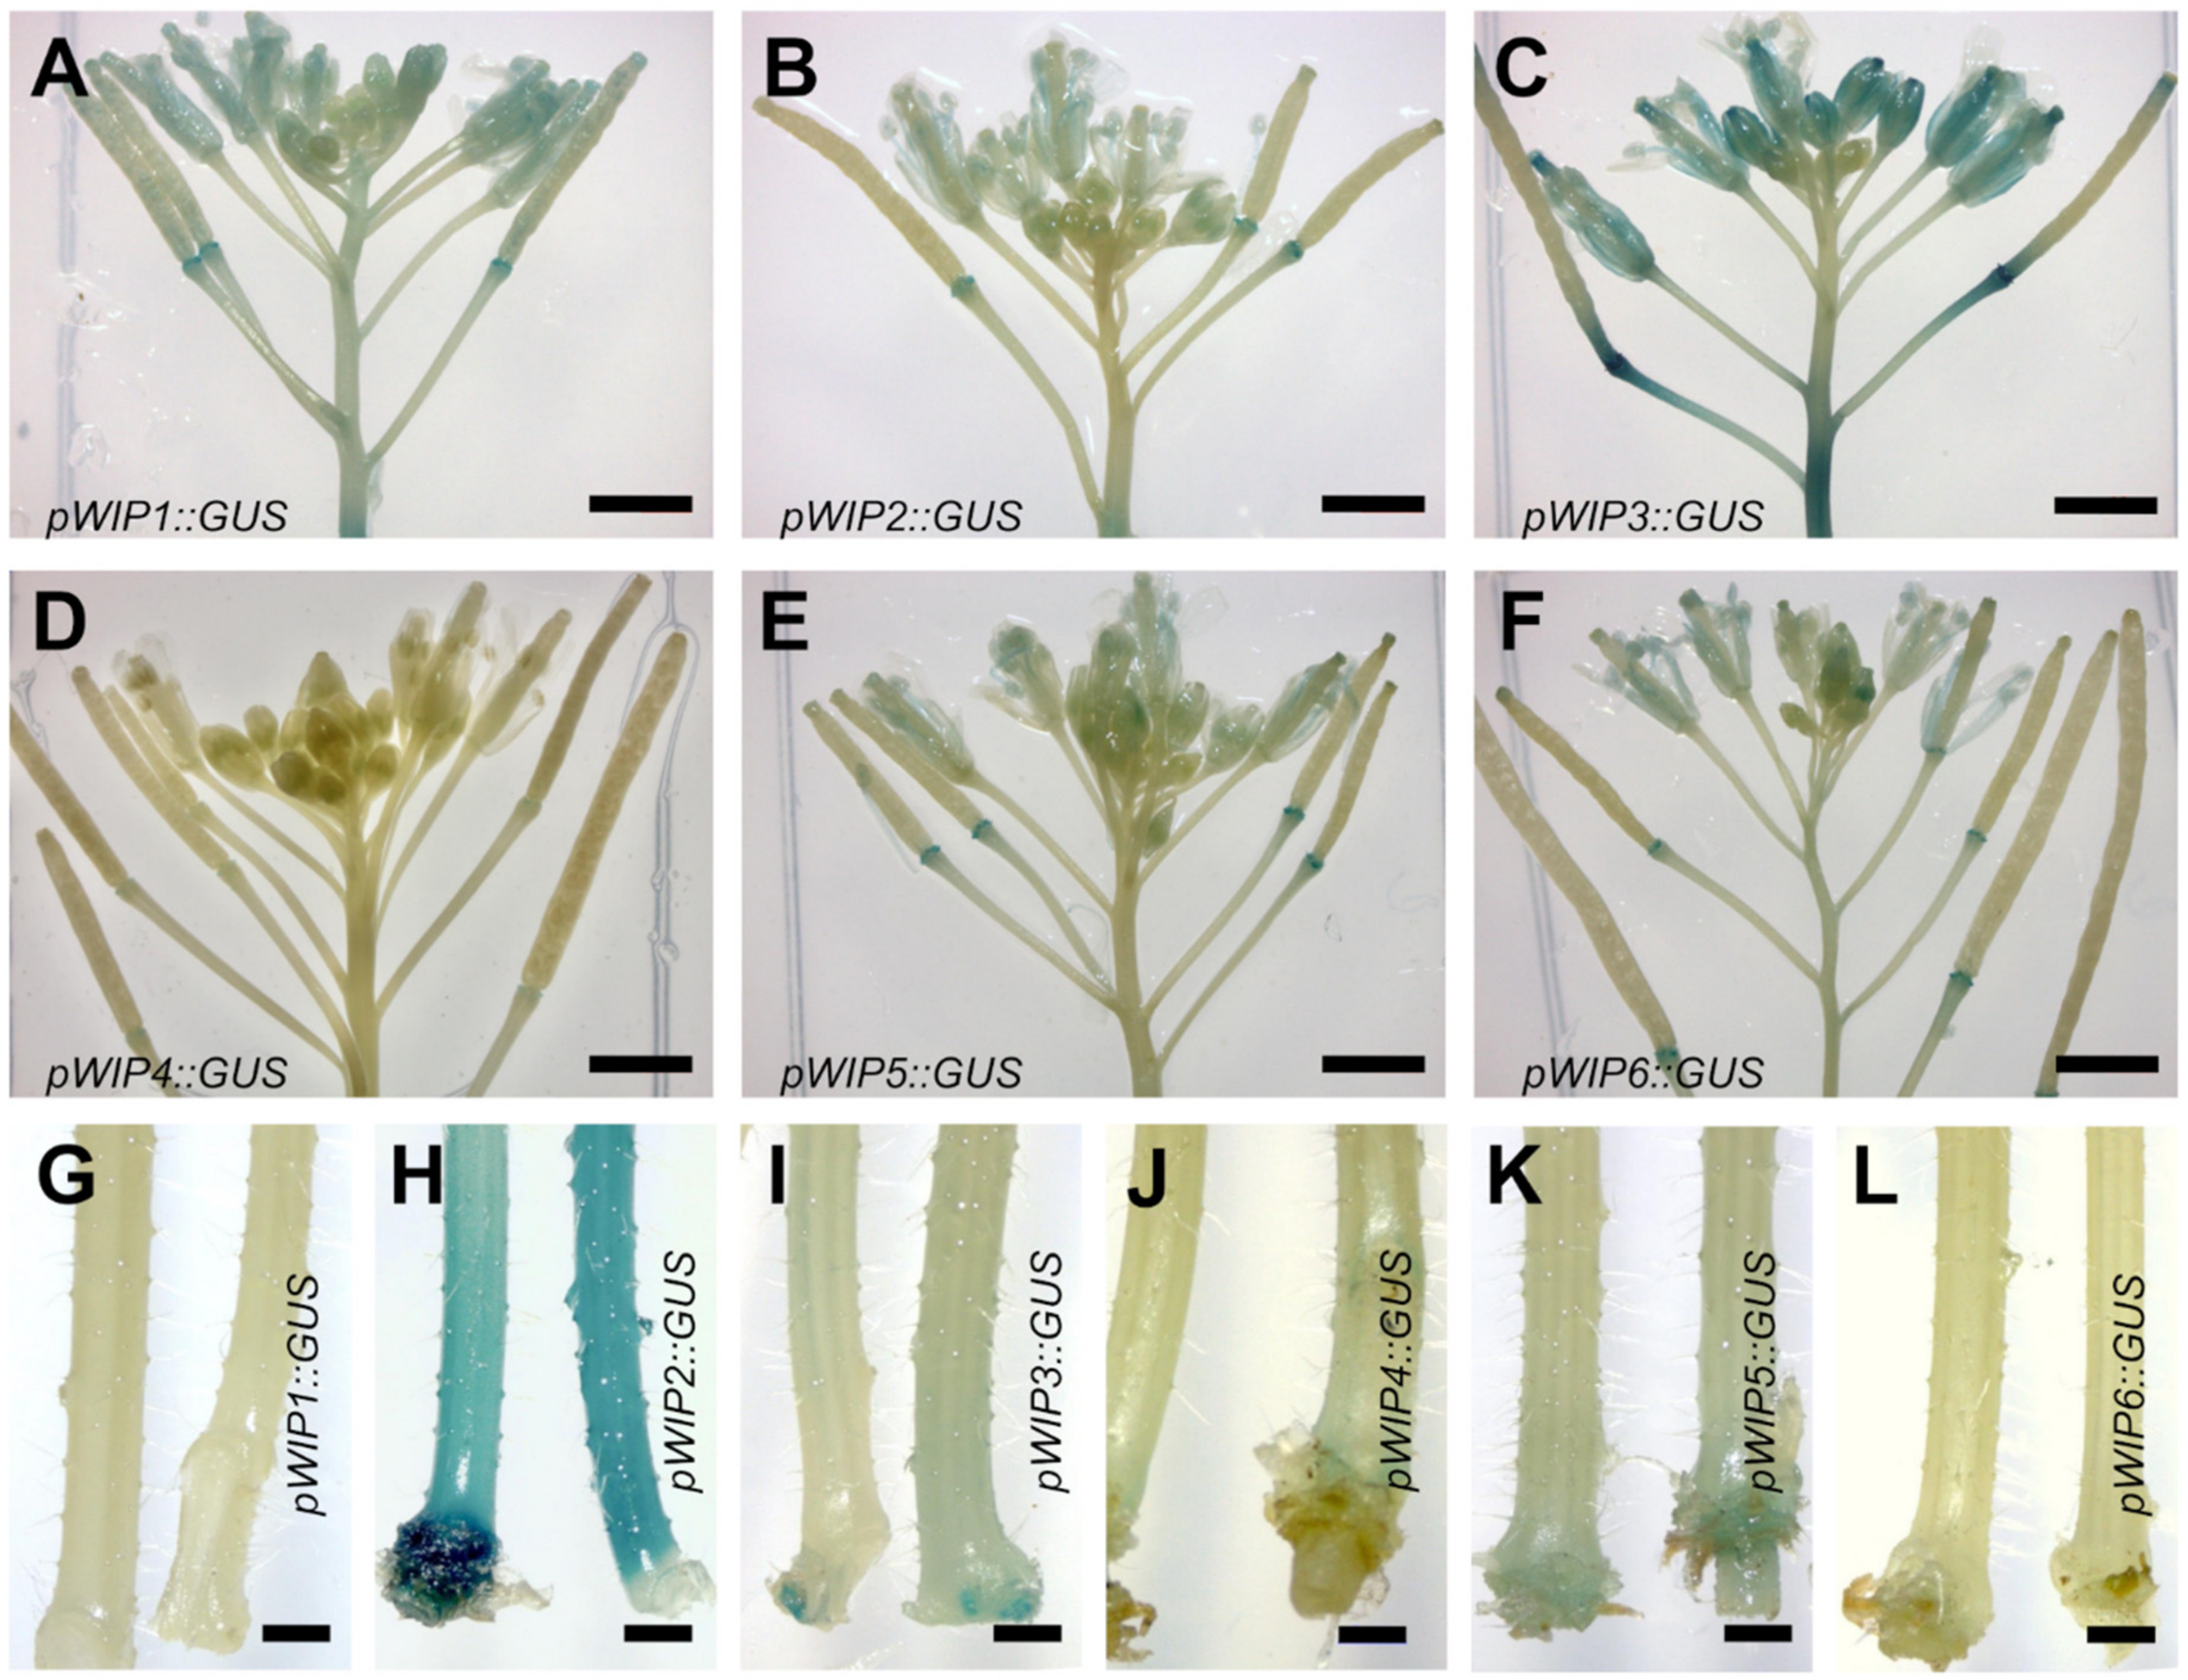
2.1. Expression Pattern of the WIP Gene Family

To visualize the expression patterns of the six different Arabidopsis WIP genes, representative independent GUS reporter lines for each of the promoters of the family members were evaluated (Figure 1). Aerial organs at different developmental stages were analyzed. First, the pattern of GUS expression in seedlings was followed each day, for the first 9 days after germination (dag). Staining in the different lines showed a constant pattern during these first days for the different reporter lines, and Figure 1A–F show stained 9 dag seedlings. Expression was observed in the SAM for pWIP2, pWIP3, and pWIP4, and in the hypocotyl vasculature for pWIP2 and pWIP3. There was also expression of pWIP2 and pWIP3 and faint expression in pWIP1 in the cotyledon vasculature (Figure 1G–I), and expression of pWIP2 and pWIP3 in the leaf vasculature (Figure 1B,C). We also observed expression in the root for pWIP2, pWIP3, pWIP4, and pWIP5. Figure S1 presents expression of pWIP2 and pWIP4 in the main and lateral roots. This coincides with data from publicly available databases (Figure S2). For other tissues, there were also coincidences, especially for those where there is strong GUS staining, though RNA-seq counts were low or very low for those tissues where GUS staining was faint.
Next, expression in inflorescences was evaluated (Figure 2A–F). This evaluation included the stem (Figure 2G–L). Expression was observed in diverse tissues in the inflorescences. pWIP1, pWIP2, pWIP3, pWIP5, and pWIP6 were expressed in different floral organs, such as petals, sepals, and stamens.
Interestingly, all 6 WIP reporter lines showed expression at the top of the pedicels to which developing fruits, or siliques, were attached, and the abscission zone (Figure 2A–F), though it was faint for some lines. For some genes, the lower part of the valves also showed expression. Similarly, the base of the stem of the 6 WIP reporter lines showed staining, although it was very faint in pWIP1 and pWIP6 (Figure 2G–L). pWIP2 presented very strong staining in this tissue (Figure 2H). A stem section of the pWIP2 reporter line is shown in Figure S1, where blue staining is observed in the internal tissues of the stem, associated to the vasculature.
The expression in the analyzed tissues is summarized in Table S1. There were different tissues where the expression of 2 or more WIP genes appeared to overlap, for example, in the shoot apical meristem region for pWIP2, pWIP3, and pWIP4 or cotyledon vasculature for pWIP1, pWIP2, and pWIP3. A coincidence of expression in young aerial tissues was found for pWIP2 and pWIP3. Finally, staining was observed at the connection of the silique base and the top of the petiole, and the base of inflorescence stems for all family members. This suggests that there might be redundant functions in at least some of these tissues.

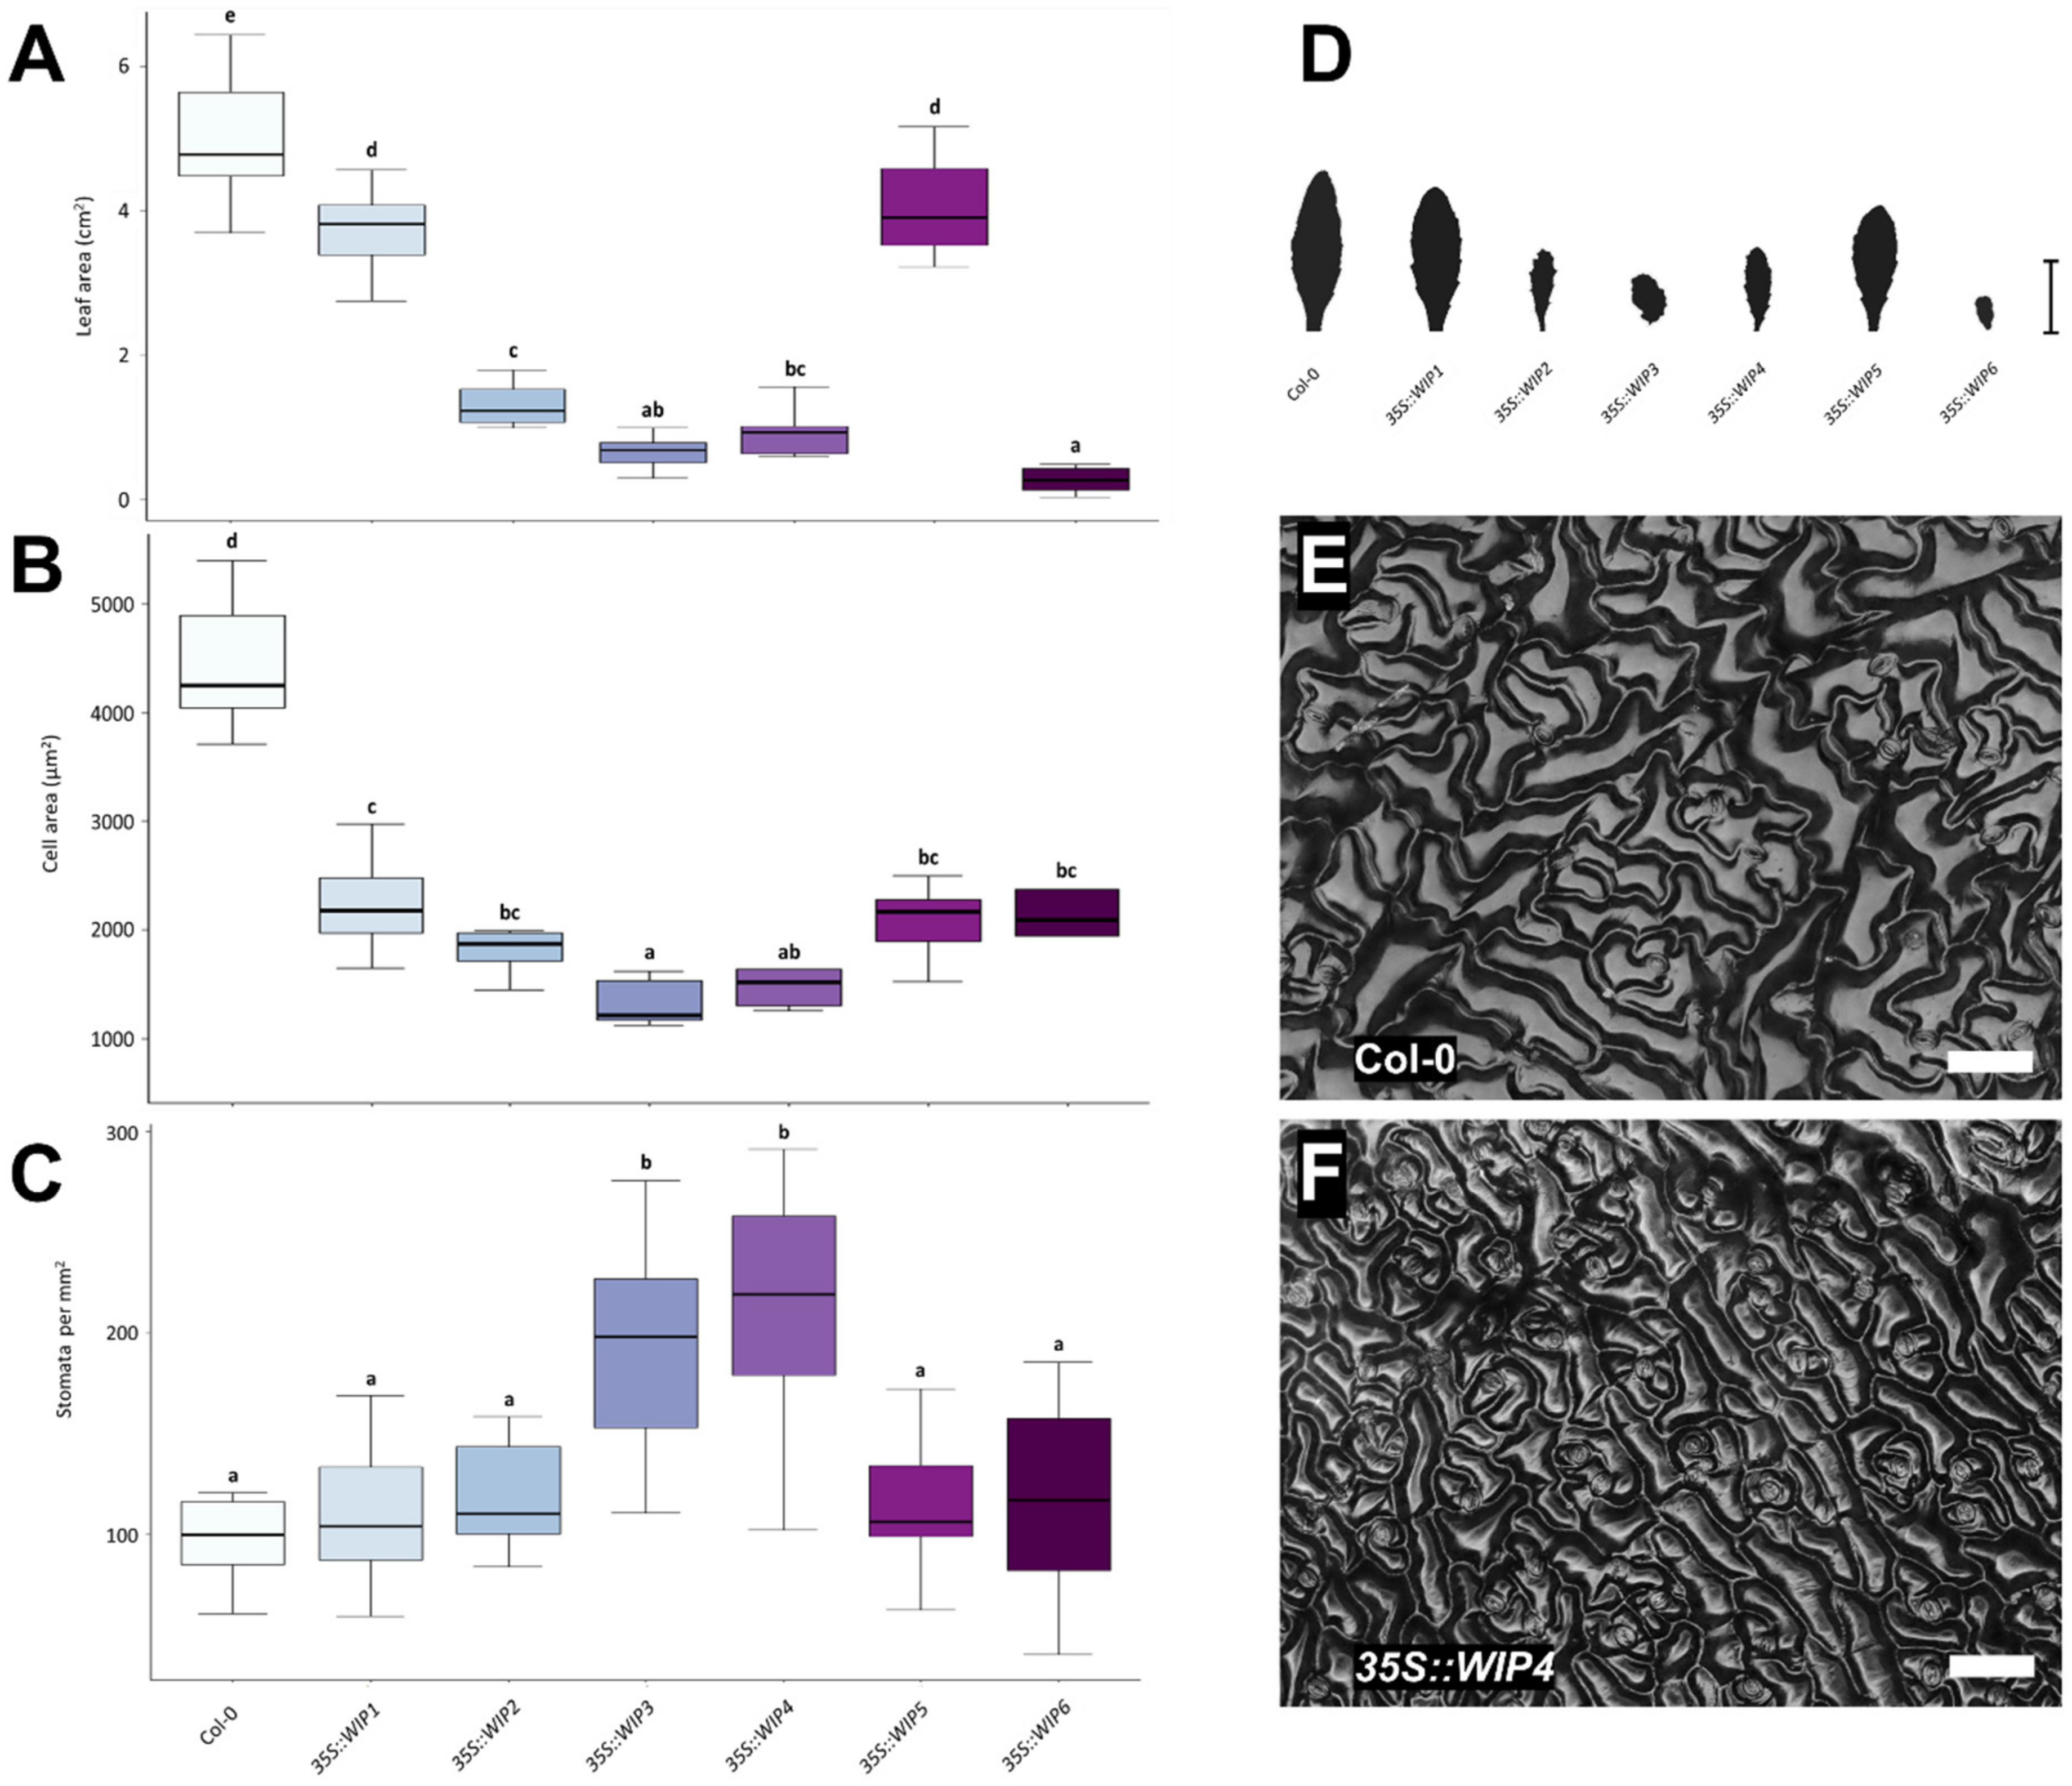
2.2. Overexpression of the WIP Gene Family Causes Leaf and Cell Size Reduction

Next, to further gather information about the function of WIP genes as a family, the effects of the overexpression of all 6 family members were evaluated (Figure 3). At first sight, it was evident that rosette leaves were affected in all overexpressors. They were different to wild-type leaves (Figure S3), and their edges showed irregularities such as serrations, undulations, indentations, or lobulations, depending on the gene that was overexpressed. Moreover, leaf size appeared to be affected. To evaluate this in more detail, total leaf area was measured. The leaf area of all overexpressors was smaller than the area of wild-type leaves (Figure 3A,D).
From the overexpressors, 35S::WIP2, 35S::WIP3, 35S::WIP4, and 35S::WIP6 were the smallest, while 35S::WIP1 and 35S::WIP5 had an intermediate total leaf area size. Next, the size of cells (cell area) in these leaves was analyzed, and they were also found to be smaller than wild-type cells (Figure 3B). This was the case for all overexpressors, with 35S::WIP3 and 35S::WIP4 presenting the smallest cells. As an example, Figure 3E,F show the comparison of leaf cells of wild-type plants, and plants overexpressing WIP4. While analyzing cell area, some differences were noticed in the spacing between stomata. Therefore, stomata were counted in the imaged area, and the stomatal density was calculated (Figure 3C). Most overexpressors did not show statistically significant differences. However, 35S::WIP3 and 35S::WIP4 leaves had a higher stomatal density than wild-type leaves (Figure 3C), which could indicate that they affect stomata or pavement cell development, which should be further studied.
Moreover, to further explore the possible cause of the size reduction in leaves, the total number of cells in the leaves was estimated using the leaf size and cell size data. Interestingly, the estimated number of cells differed in the overexpressors and wild-type leaves (Figure S4). The estimated number of cells was higher for WIP1 and WIP5 overexpressors, and lower for the rest of the WIP overexpressors, suggesting that the ectopic and constitutive expression can affect cell proliferation.
In summary, the overexpression of all WIP genes caused alterations in leaf shape, leaf size, and cell size, reducing them in comparison to wild-type leaves. It also affected cell numbers. Moreover, the overexpression of WIP3 and WIP4 also increased stomatal density.

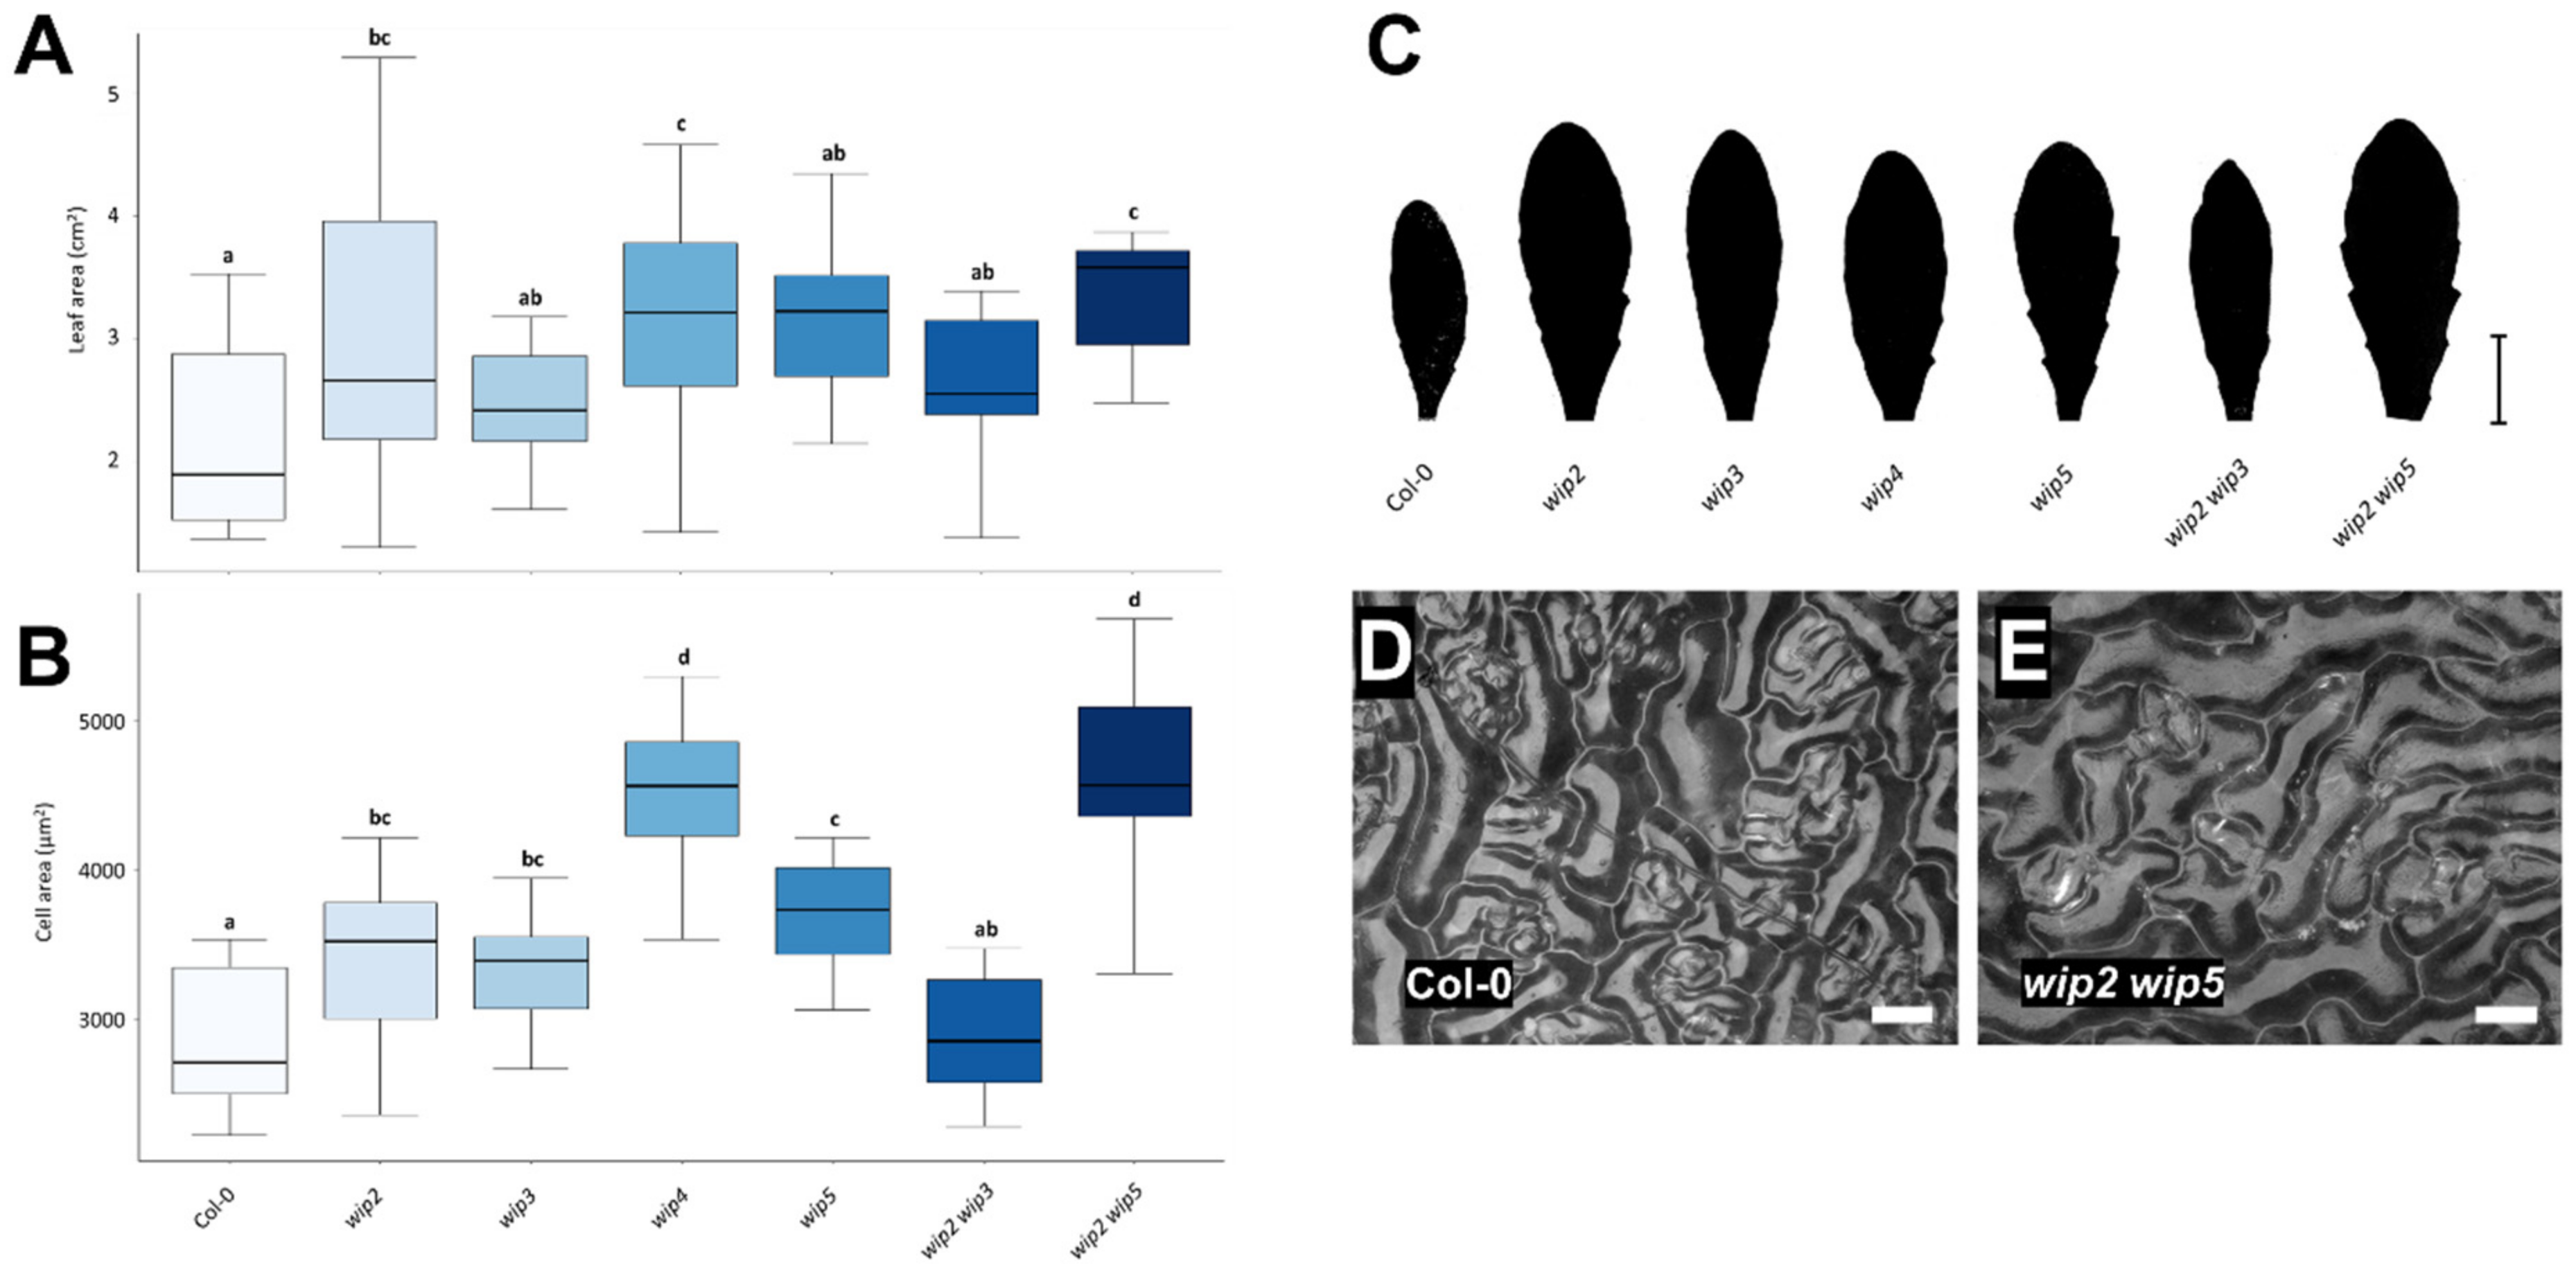
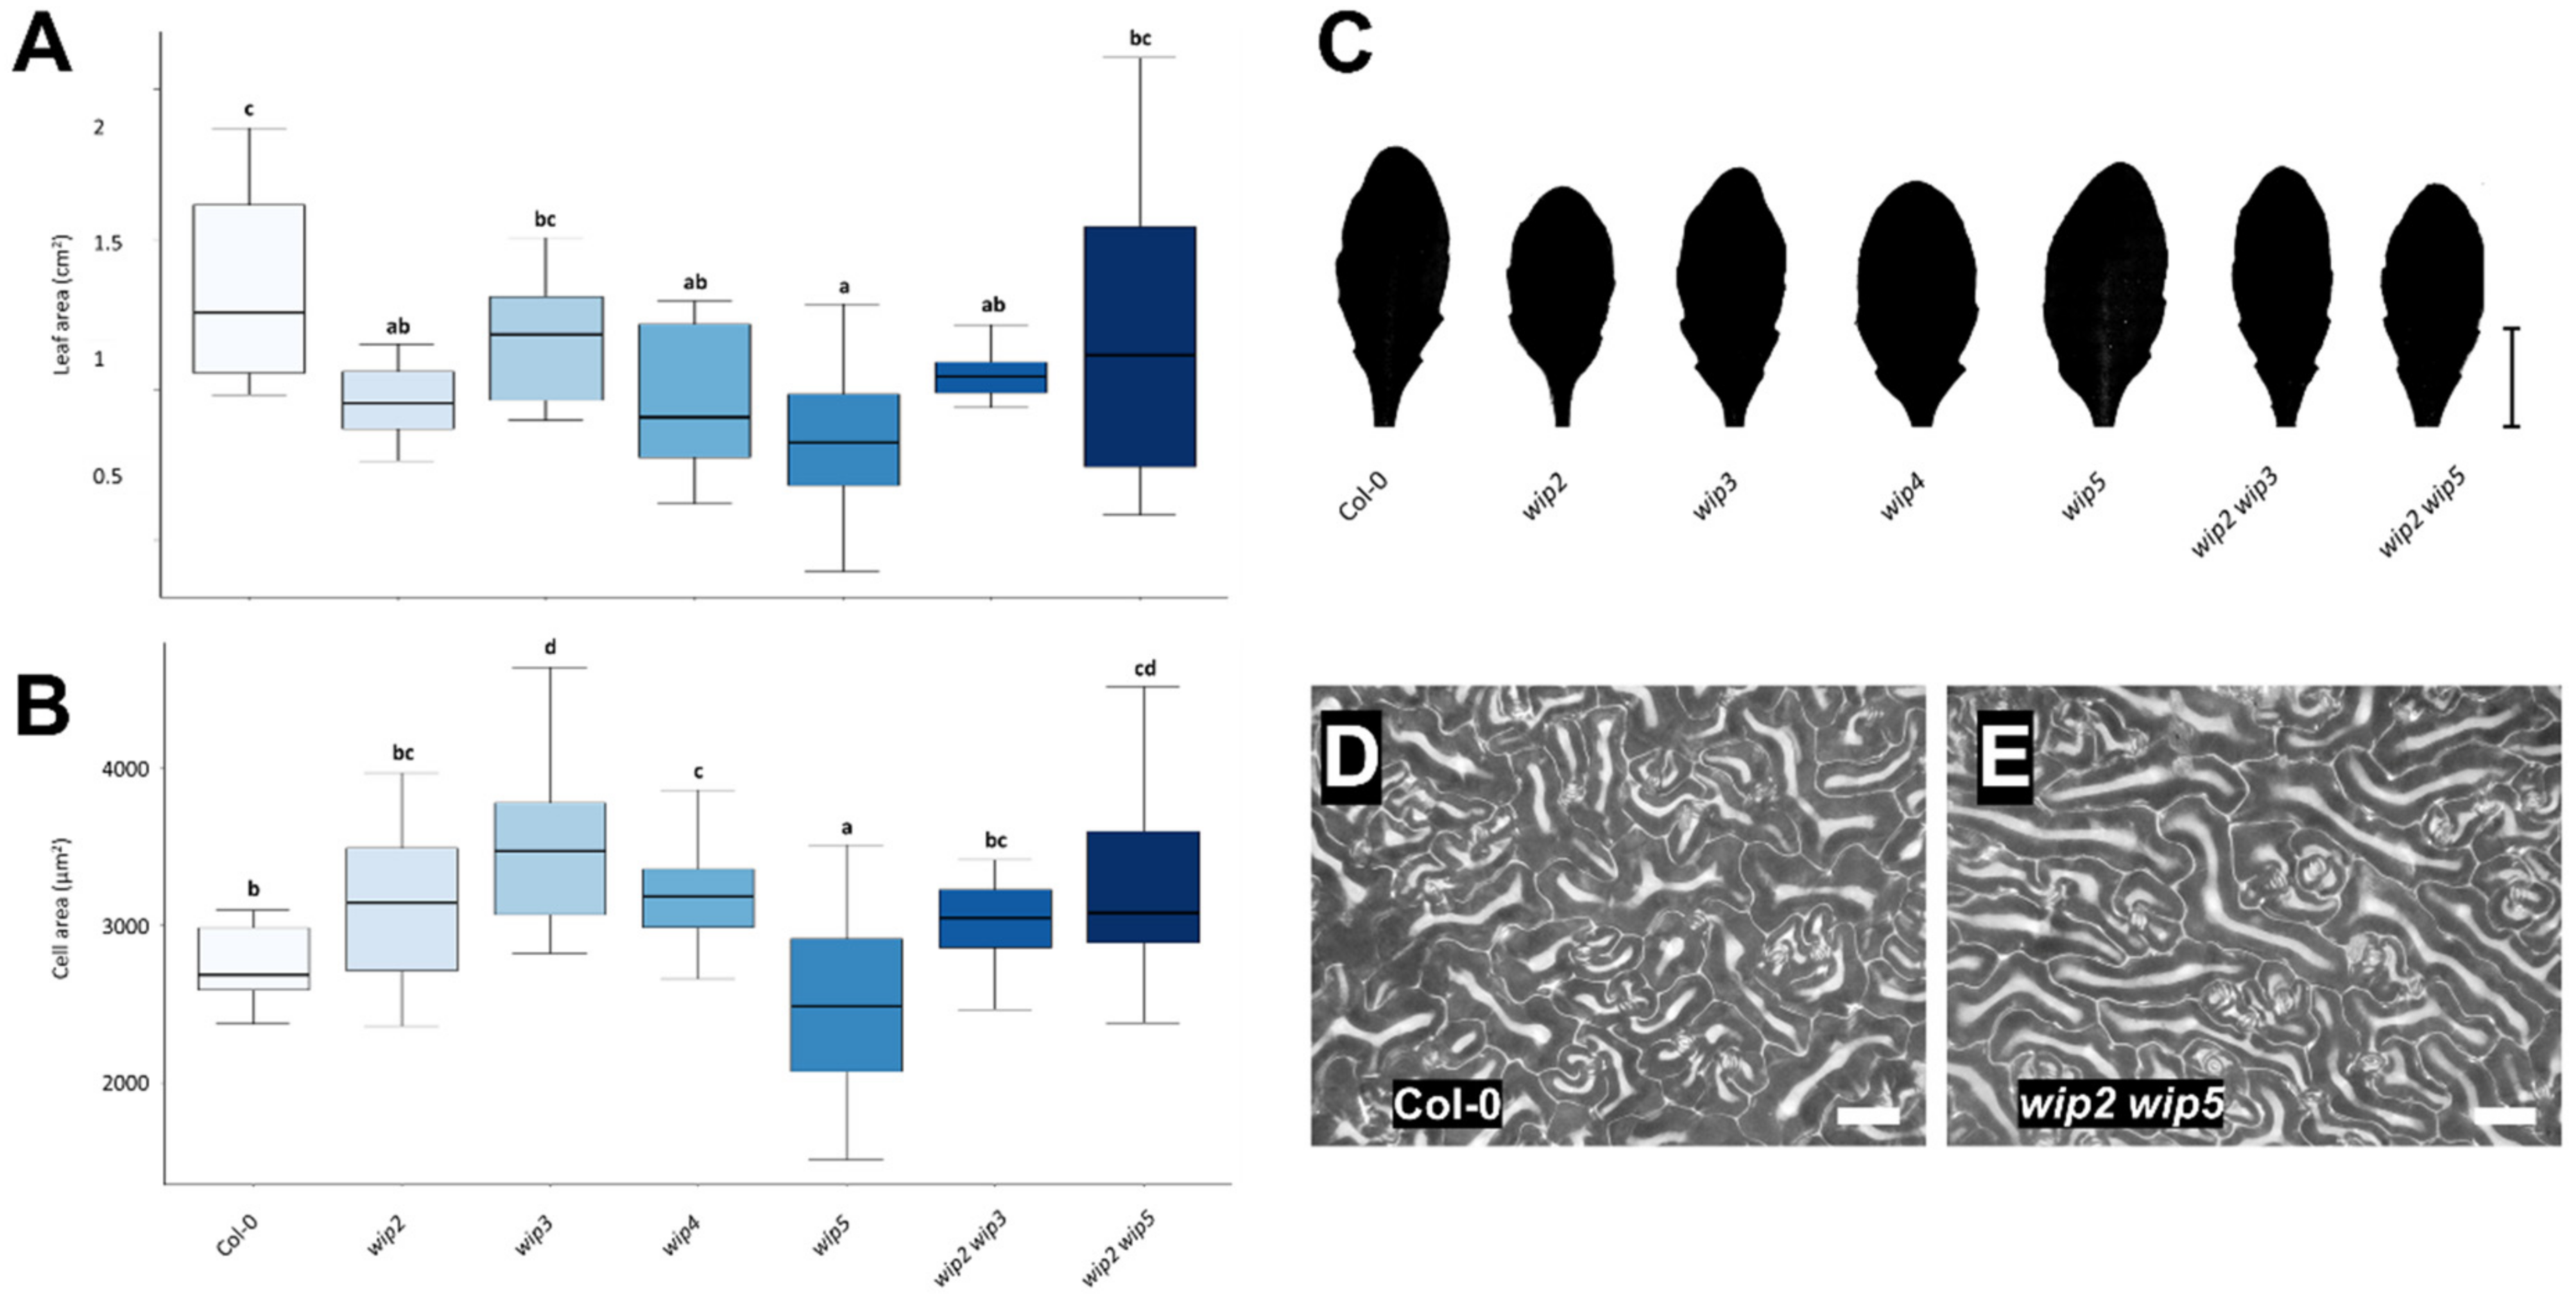
2.3. Loss of WIP Function Affects Leaf and Cell Size

Next, the leaves of WIP loss-of-function mutants were analyzed (wip2, wip3, wip4, and wip5 single, and wip2 wip3 and wip2 wip5 double mutants). Figure 4C–E show representative images used for the analyses. Two different time points, 30 and 60 days after germination (dag), were evaluated (Figure 4 and Figure 5).
At 30 days, the leaves of wip2, wip4, wip5, and wip2 wip3 mutants had a smaller size (Figure 4A,C). The rest of the mutants had leaves that were the same size or slightly smaller than that of the wild-type.
When cell size (cell area) was evaluated, the epidermal cell area in mutant wip3, wip4, and wip2 wip5 leaves was larger, while it was very variable in wip5 leaves (Figure 4B). The cell size of the rest of the wip mutants did not differ much from that of the wild-type, though there was a tendency for leaves to have a larger cell size in the wip2 and wip2 wip3 mutants (Figure 4B).
As some mutants had smaller leaves and larger cells than wild-type leaves, this could mean that cell number was also affected. The number of cells in the leaf was estimated from the number of cells in the evaluated leaf area. This is only an estimation because the size of the cells would differ in the whole leaf. Nevertheless, in this evaluation, there was a tendency for a reduced number of estimated cells in all the mutants in comparison to wild-type leaves (Figure S4). This reduction in the estimated number of cells per leaf was marked in the single wip2 and wip4 mutants (Figure S4).
The second leaf and cell size evaluations were performed using the same plants one month later, at 60 dag (Figure 5). At this time, wip2, wip4, and wip2 wip5 had larger leaves than wild-type plants, while wip3, wip5, and wip2 wip3 had a slightly larger but, in general, comparable size (Figure 5A,C).
When cell area was evaluated, all analyzed mutants had larger cells than wild-type leaves, except for the double wip2 wip3 mutant (Figure 5B). Representative images of wip2 wip5 and wild-type leaf cells are presented in Figure 5D,E, and a SEM micrograph of wip2 wip5 and wild-type cells where cells can be visualized with more detail is shown in Figure S5.
The number of cells in the leaves was again estimated (Figure S4). At this time, there were no statistically significant differences, though there were some mutant genotypes that appeared to have a tendency for an increased estimated number of cells than wild-type leaves (Figure S4).
Finally, because the overexpression lines of WIP3 and WIP4 presented a higher stomatal density than wild-type leaves, the stomatal density of the single wip3 and wip4 mutants was also evaluated (Figure S6). As a comparison, the double mutant wip2 wip5 was also included in this analysis. Interestingly, wip3 and wip4 had a lower stomatal density than wild-type leaves, while the stomatal density in wip2 wip5 was not different compared to in wild-type leaves. This indicates that the loss of WIP3 and WIP4 function affects stomatal density.
From these analyses, it appears that the loss-of-function of most WIP genes affects leaf and cell size in mature plants. Furthermore, the lack of certain WIP genes also alters cell number at an earlier stage. This indicates that WIP genes are involved in cell growth and some of them possibly in division processes that finally affect normal organ size. Moreover, WIP3 and WIP4 also appear to modulate stomatal density.

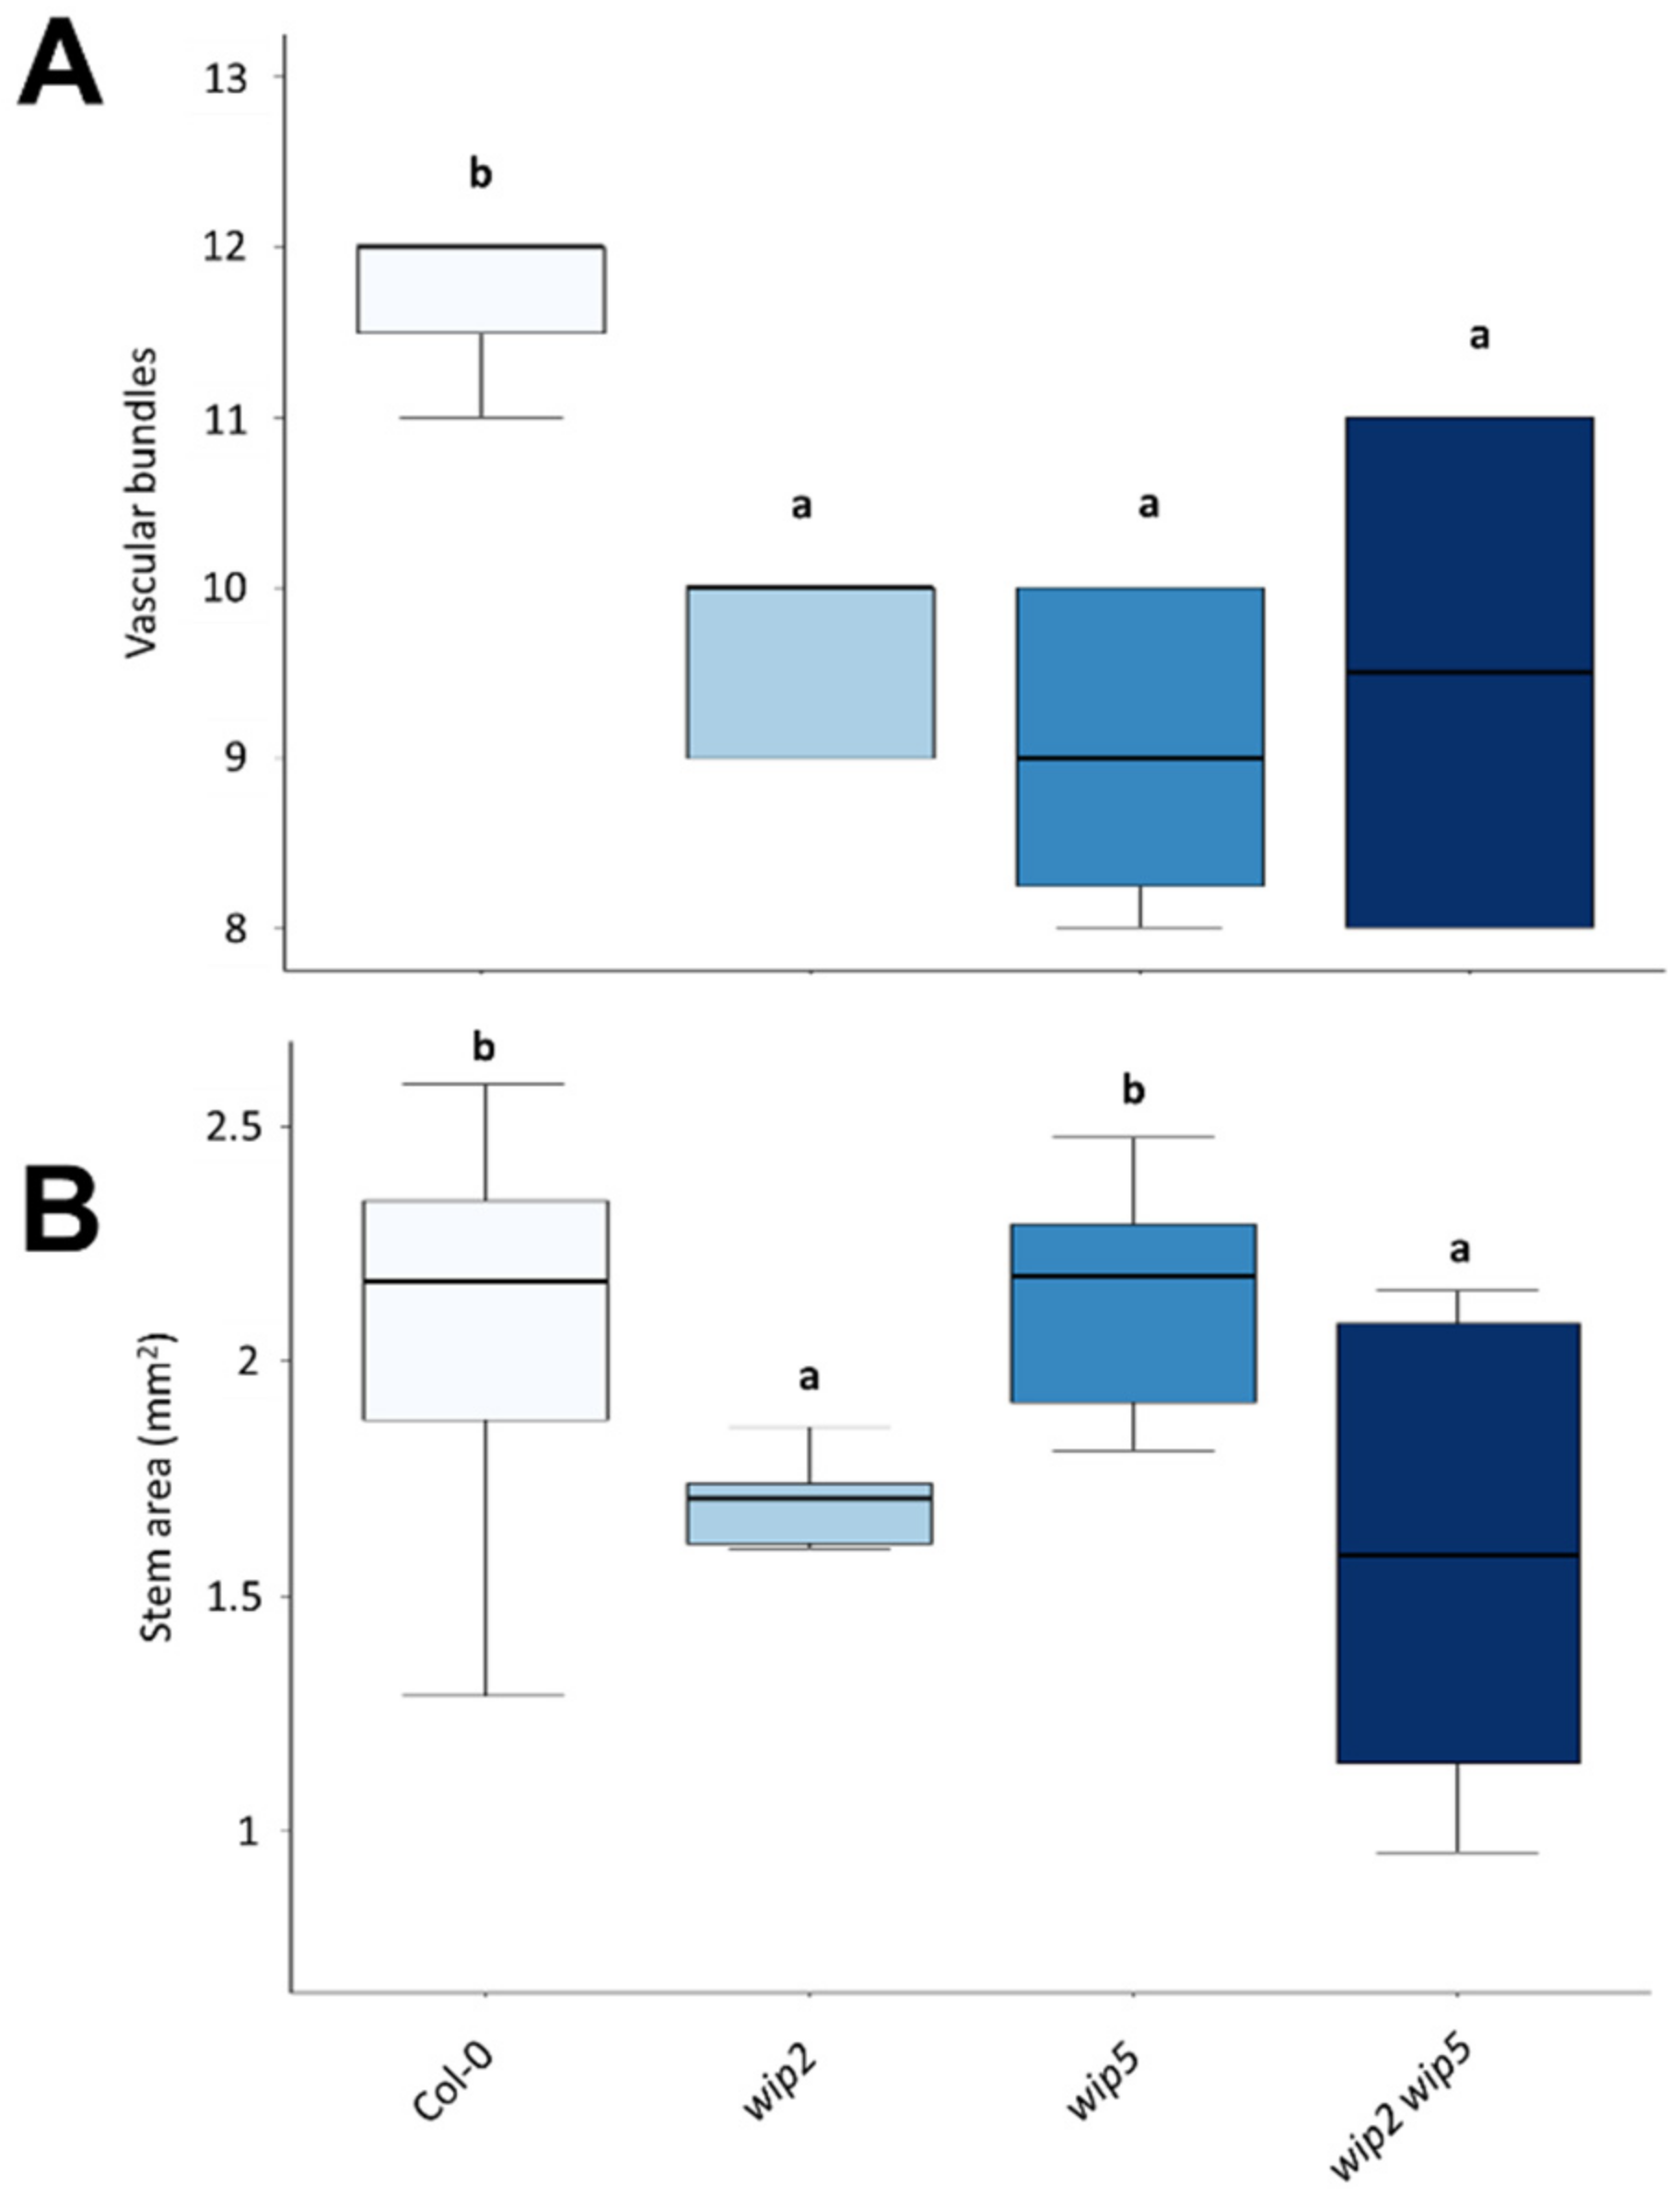
2.4. Wip Phenotype in Stems

As the expression analyses suggested that WIP genes could have a function in the stem and vasculature, the vasculature of mutant stems was compared to wild-type stems. For this, histological sections of 20 cm tall stems of wip2, wip5, wip2 wip5, and wild-type plants were evaluated (Figure 6). They were chosen because GUS staining in the stem was strongest in the pWIP2 lines, and because some redundancy had been observed in the leaf analyses between wip2 and wip5 mutants. Sections obtained 5 cm from the apex were stained with phloroglucinol to visualize lignin (Figure S7). wip mutant stems had fewer vascular bundles than wild-type plants (Figure 6A). On the other hand, stem area was different between wip2 and wip2 wip5 mutants with respect to wild-type and the wip5 mutant (Figure 6B). This indicates that these WIP genes are involved in the normal development of these tissues.
In summary, the expression of WIP genes, the effect of their overexpression and loss-of-function mutation in leaves, and the stem vasculature of two mutants and the combined mutations were analyzed. The conclusion of the obtained data is that WIP genes are expressed in different tissues throughout plant development, in some of which they may play a redundant function. Moreover, the results indicate that, depending on the gene, WIP genes have an effect on leaf and leaf cell size and number, stem development, and leaf stomatal density at specific stages.

3. Discussion

The goal of this work was to obtain insights about the function of the WIP family of transcription factors, by analyzing their expression and the effects of their overexpression and loss-of-function in Arabidopsis rosettes.

3.1. Expression Patterns of WIP Family Promoters

We explored the expression pattern of all six Arabidopsis WIP promoters in aerial tissues of seedlings, inflorescences, and stems using transcriptional fusion reporter lines. Interestingly, we observed some tissues where two or more genes were expressed, such as the shoot meristematic region or the vasculature of cotyledons or leaves. Moreover, there were tissues where all genes were expressed, as revealed by GUS staining with different intensities depending on the gene. Interestingly, these tissues are regions where two different organs are connected, such as the pedicel to developing siliques, and the base of the stem that connects to the roots. This suggests that WIP genes could have yet undiscovered redundant functions in these and other tissues, particularly the vasculature. These functions may be essential, as it was previously reported for the redundant role of WIP2, WIP4, and WIP5 in root development [12].

3.2. WIPs Alter Leaf Shape and Size, and Leaf Cell Size

As a strategy to obtain more information about the function of WIP genes, the rosette leaf phenotype of overexpressors of the 6 WIP genes was evaluated. Interestingly, they all affected leaf size and shape, especially leaf margins. This again suggests that they might perform functions in the regulation of similar processes. In an earlier study [1], the function of WIP1 could be partially recovered by expressing the other WIPs under the WIP1 promoter. Still, the complementation was not total. Similarly, though all WIPs affect leaf size and edges when overexpressed, the phenotypes are not identical, suggesting the existence of shared as well as specific functions for them. For example, an effect in stomata density was observed, but only in the overexpressors of WIP3 and WIP4. This might be a particular effect that could reflect a specific, different function, and should be studied in more detail in the future.
On the other hand, the effects on organ size and cell size appear to be a function shared by all members of the family. They all affected leaf and cell size, as the analyzed leaves of all overexpressors were smaller and had cells that were also smaller than those of wild-type leaves. Interestingly, the overexpression of a WIP gene from Gerbera hybrida, GhWIP2, with the highest sequence homology to AtWIP2, also caused a reduction in organ size [5]. The leaves and floral organs of GhWIP2 overexpressors were smaller than wild-type organs. Moreover, as noted in this work for Arabidopsis WIP overexpressors, cell size was also reduced in GhWIP2 overexpressor organs. Therefore, as the overexpression of all Arabidopsis WIPs has a similar effect on organ and cell size, cell growth modulation might be a common WIP function, at least for the six Arabidopsis WIPs and Gerbera GbWIP2. The same negative effect on cell growth was also reported recently by [13] for the Arabidopsis WIP members WIP1 and WIP2. In global expression analyses of overexpression lines, the authors found gene categories related to stress and cell growth repression and they observed a reduction in plant size in these lines [13].
Interestingly, WIPs may have a different effect depending on specific cell types while still affecting cell growth. The overexpression of WIP2 has the opposite effect in replum cells, as they become very large [9]. This different effect in specific cells or tissues may depend on the presence of other genes, hormones, or factors that modulate WIP activity or effects. For example, in the ovary context, WIP2, together with the transcription factor STK, delays entry of septum cells to their normal degradation program [11].
Finally, the estimated number of cells in the leaves of the overexpressors of WIP genes is different (higher or lower) from wild-type leaves (Figure S4A), suggesting that these genes can affect cell proliferation, most likely also depending on the context. In the replum, the overexpression of WIP2, in addition to causing a clear enlargement of cell size, reduces the number of cells in this region [9]. This could be due to the presence of other transcription factors or hormonal contexts that modulate the activity and effect of WIP transcription factors.

3.3. Loss of WIP Function Affects Leaf and Cell Size

After analyzing the effect of the overexpression of WIP genes, the effect of their loss-of-function was evaluated. The genotypes included for this evaluation were wip2, wip3, wip4, wip5, wip2 wip3, and wip2 wip5. Notably, when the phenotype of wip single and double loss-of-function mutants was analyzed, some of them presented differences in leaf size that were opposite to the phenotypes presented by the overexpressors.
The results of the analyses of leaves at 30 and 60 days suggest that WIPs affect leaf cell division and growth. At 30 days, four wip mutants had smaller leaves but a similar cell size, suggesting that these leaves had fewer cells. The single mutants with small leaves were wip2, wip4, and wip5. Interestingly, the single mutant wip3 had larger cells but a wild-type leaf size. These leaf and cell size relations suggested that these leaves contained fewer cells. When the cell number was estimated, there was indeed a tendency for having a reduced estimated number of cells. This could mean that these WIP genes affect processes such as cell division and growth. At 30 days, the loss of WIP3 function had the strongest effect on cell expansion among all the mutants. The effect in cell division and growth might be a nonautonomous effect, as some of these WIPs were expressed at the SAM and leaf or cotyledon vasculature, but not in the whole leaf lamina.
Interestingly, at 60 days, the wip2, wip4, and wip2 wip5 mutants had larger cells than wild-type plants, and the rest had wild-type-sized leaves. All evaluated mutants had larger cells, except wip2 wip3 that had a comparable size to wild-type cells. When cell numbers were calculated, they were not statistically significantly different to the estimated cell numbers in wild-type leaves. Possible explanations for the estimated leaf cell numbers at 60 days could be that cell division was not affected in the analyzed leaves or that cell division continued in the cells that were analyzed at 60 days, reaching a similar number. Nevertheless, it would be very interesting to analyze cell division processes in detail in this or other organs.
In summary, the processes of cell division and growth in leaves at 30 days and cell growth in leaves of mature plants appear to be affected by the lack of WIP genes, especially WIP4 and the combination of WIP2 and WIP5, most likely in a nonautonomous fashion. These three genes are the most closely related and have been found to perform redundant functions in the root [12].
The relation of total leaf area and cell size and estimated number at 30 days resulting from the lack of WIP function could also mean that a compensation or overcompensation mechanism is activated in some of the mutants, in which cell size increases to compensate for a smaller number of cells or vice versa [14]. The observation that increased expression of WIP genes caused a reduction in cell size in leaves, while the loss of their function caused an increase in cell size in mature plant leaves, suggests that they negatively influence leaf cell size. In some mutants, leaf cell numbers were also altered, so the affected genes might also play a role in cell division, and maybe the timing, duration, or window of active cell division. Interestingly, estimated cell numbers were also affected in plants that overexpress WIP genes. This indicates that imbalances in the expression of these genes, either too much or too little expression, can affect cell proliferation. Most likely, this effect is different depending on the context (tissue or developmental stage).
Another interesting observation was the increased stomatal density in the 35S::WIP3 and 35S::WIP4 lines, which contrasted with the decreased stomatal density in the wip3 and wip4 mutants. These effects suggest that WIP3 and WIP4 may also play a role in normal stomatal density and should be further studied. Regarding possible redundancy, wip2 and wip5 appear to share some redundant functions in leaf development, as observed in mature 60-day-old plants, because the phenotypes were stronger in the double wip2 wip5 mutant than in the single mutants at this stage. At 30 days, this was not the case. Moreover, wip2 and wip3 seemed to counteract each other, as the double wip2 wip3 mutant appeared to have a milder phenotype than the most affected wip2 or wip3 single mutants. Furthermore, the effect of the mutations in the size of leaves and cells was different depending on the age of the plant at which the leaf phenotype was analyzed. It would be interesting to evaluate whether environmental conditions can also affect the influence of these mutations on the leaf and other organ’s size and number. Moreover, it would be very informative to further analyze the nonautonomous effect of these genes in leaves and other organs and tissues, by exploring possible mobile signals.
Very recently, the role of the WIP family genes in early root development was reported [15]. Interestingly, even when this work was performed using very young roots, some of the observations are in accordance with those of the work presented here, such as nonautonomous effects, and aspects of their expression (such as pWIP3 and pWIP6 in siliques). Moreover, the authors report that the combination of wip1 wip3 and wip6 mutations recovers the affected root phenotype of the triple nww (ntt wip4 wip5) mutant, indicating both redundant and opposing roles among the family members [15]. Interestingly, the authors found that, for the case of the developing root, the opposite roles are related to the different expression pattern of the genes, and not to the intrinsic activity of the protein [15]. It would be very interesting to explore if this is also the case for the effects observed in the present work. Finally, the vasculature phenotype of the double wip2 wip5 mutant suggests that these genes may play a redundant role in vasculature development. It is highly likely that wip4 also plays a redundant role in this tissue, considering the redundant roles they play in embryo development [12]. Considering the observation of the opposing effect of wip3 in this work, and of WIP1, WIP3, and WIP6 in [15], it is possible that these three genes could have an opposite effect. These functions should be studied in more detail to understand the roles that these genes play in vasculature development.

4. Materials and Methods

4.1. Plant Material and Constructs

The TT1/WIP1 promoter::GUS line was described in [3] and the NTT/WIP2 promoter::GUS line was described in [11]. Promoter::GUS lines for WIP3-6 were prepared accordingly using the primers and restriction endonucleases listed in Table S2. The promoter::GUS constructs were transformed into A. thaliana plants of the ecotype Columbia, transgenic plants were selected, and corresponding T2 plants were subjected to GUS staining. For each pWIP construct, 3 to 6 independent T2 lines were selected and 10 to 20 individuals from each line were stained for the different developmental stages. Whole seedlings 5 and 11 days after germination, inflorescences, stems of adult plants, and immature seeds were analyzed. Expression that occurred consistently in all independent lines was assumed to be construct-specific. In most cases, however, the GUS staining differed only in intensity. For the analyses presented in this work, 2 independent lines that showed the representative staining pattern were used for the assays and 1 was selected for the detailed observations.
Construction of the 35S::TT1/WIP1 and WIP2, 3, 4, and 6 fusions was described in [1]. 35S::WIP5 was prepared accordingly using the primers listed in Table S2. The resulting 35::WIP cassettes were subcloned via ClaI/SacI into the binary vector pGPTV [16] in the case of WIP2, WIP4, WIP5, and WIP6. For WIP3, NcoI and Asp718 were used to subclone the CDS behind the 35S promoter in pJAN (a derivative of pPAM (GenBank AY027531)). A. thaliana Col-0 was transformed by floral dip [17]. For the transgenic overexpression plants (35S::WIP cDNA constructs), the presence of the transgene in T1 plants was additionally confirmed by polymerase chain reaction. The T2 seeds resulting from the selection were used for phenotypic analysis of the plants The mutant lines that were used in this study are indicated in Table S3 and the primers used for their molecular confirmation are listed in Table S2.

4.2. Growth Conditions

Plants were grown under greenhouse or growth chamber conditions (22 °C, 16 h of light) in soil or in vitro, in ½ MS medium supplemented with 0.5% sugar and 1% agar. All lines were in Columbia (Col-0) background.

4.3. Leaf and Cell Analyses

The analyses were carried at one time point for overexpressors, and at two time points for loss-of-function mutants, using the same plants for both time points. First, rosette leaves were numbered (Figure S8, the leaf selected was the same leaf number in all the samples). For 30 dag, leaf number 8 was used, and for 60 dag, leaf number 10 was used. Leaves were cut and placed fresh in the KEYENCE VHX 5000 digital microscope, Keyence, Osaka, Japan [18]. Two micrographs were obtained, one from the right side and another from the left side of the midvein of the leaf for each genotype, and 10 leaves per genotype were sampled (Figure S8). Leaf epidermal cell area (i.e., cell size) was obtained using ImageJ software (http://imagej.nih.gov/ij/) (accessed on 02 June, 2022) [19]. For this, the number of cells in the micrograph was counted and divided by the total area of the micrograph. The electron microscope micrographs shown in Figure S5 were obtained using a Zeiss EVO 40 SEM microscope, Carl Zeiss, Oberkochen, Germany.

4.4. Expression Analyses

Samples were collected and left in GUS staining solution (0.5% triton, 2.5 mM potassium ferricyanide, 2.5 mM potassium ferrocyanide, 1 M EDTA, and 2 mM X-Gluc in 50 mM NaPO4) at 37 °C overnight. Afterward, plants were cleared in 70% ethanol to remove chlorophyll and distinguish the stained regions, and then observed in a Zeiss stereo microscope.
In silico expression analyses were conducted using the publicly available Arabidopsis RNA-seq library database (Figure S2) [20]. http://ipf.sustech.edu.cn/pub/athrna/ (accessed on 13 July 2022).

4.5. Statistical Analyses

Statistical analyses and graphs were produced in RStudio (Version 4.2.0, RStudio team, Boston, MA, USA) [21]. ANOVA was applied to parametric variables, and a Kruskal–Wallis test was applied in the case of nonparametric variables; LSD and Dunn’s post hoc tests were applied when significant.

5. Conclusions

In conclusion, the family of WIP genes modulates leaf growth and affects cell expansion and division processes. Some of these genes also participate in vascular development and stomatal density modulation. WIP2 and WIP5 perform redundant functions, at least at specific stages, and WIP2 and WIP3 perform opposite functions in at least some tissues. Finally, it is likely that other functions, some of them crucial, are masked by redundancy.

Supplementary Materials

The following supporting information can be downloaded at: https://www.mdpi.com/article/10.3390/plants11152010/s1, Figure S1: pWIP::GUS expression in roots and stem; Figure S2: RNA expression levels of WIP genes in different tissues [20]; Figure S3: Leaf edge phenotypes of WIP overexpressors; Figure S4: Estimated cell number in wip mutants; Figure S5: Representative SEM micrographs of leaf pavement cells; Figure S6: Stomatal density in wip3, wip4 and wip2 wip5 mutants. Figure S7: Representative image of stem transverse sections; Figure S8: Leaf imaging experiments workflow. Table S1: pWIP:: GUS expression; Table S2: Primers used for GUS and OE constructs and mutant analyses; Table S3: Mutant wip lines used in this study [22,23,24]. References [21,22,23,24] are cited in Supplementary Materials.

Author Contributions

Conceptualization, N.M.-M., M.S. and D.D.-R.; methodology, D.D.-R., U.S.D.-G., G.M.-G., G.H. and I.A.; formal analysis, D.D.-R. and N.M.-M.; investigation, D.D.-R., U.S.D.-G., G.M.-G., G.H. and I.A.; resources, N.M.-M. and M.S.; data curation, D.D.-R. and U.S.D.-G.; writing—original draft preparation, D.D.-R., U.S.D.-G. and N.M.-M.; writing—review and editing, N.M.-M., M.S. and D.D.-R.; visualization, D.D.-R., U.S.D.-G. and G.M.-G.; supervision, N.M.-M. and M.S.; project administration, N.M.-M. and M.S.; funding acquisition, N.M.-M. and M.S. All authors have read and agreed to the published version of the manuscript.

Funding

This research was funded by Consejo Nacional de Ciencia y Tecnología (CONACYT) Mexico, grant number CB-255069 (N.M.-M.), and postgraduate fellowships to D.D.-R. (254467) and U.S.D.-G.

Institutional Review Board Statement

Not applicable.

Informed Consent Statement

Not applicable.

Data Availability Statement

Not applicable.

Acknowledgments

The authors thank Lino Sánchez Segura (Plantecc), Irepan Reyes-Olalde, and Hugo Lazcano for help in leaf imaging, Juan Carlos Ochoa for laboratory management, and Daniela Ramos for initial observations.

Conflicts of Interest

The authors declare no conflict of interest.

References

  1. Appelhagen, I.; Huep, G.; Lu, G.H.; Strompen, G.; Weisshaar, B.; Sagasser, M. Weird fingers: Functional analysis of WIP domain proteins. FEBS Lett. 2010, 584, 3116–3122. [Google Scholar] [CrossRef] [PubMed] [Green Version]
  2. Englbrecht, C.C.; Schoof, H.; Böhm, S. Conservation, diversification and expansion of C2H2 zinc finger proteins in the Arabidopsis thaliana genome. BMC Genom. 2004, 5, 39. [Google Scholar] [CrossRef] [PubMed] [Green Version]
  3. Sagasser, M.; Lu, G.H.; Hahlbrock, K.; Weisshaar, B. A. thaliana Transparent testa 1 is involved in seed coat development and defines the WIP subfamily of plant zinc finger proteins. Genes Dev. 2002, 16, 138–149. [Google Scholar] [CrossRef] [PubMed] [Green Version]
  4. Martin, A.; Troadec, C.; Boualem, A.; Rajab, M.; Fernandez, R.; Morin, H.; Pitrat, M.; Dogimont, C.; Bendahmane, A. A transposon-induced epigenetic change leads to sex determination in melon. Nature 2009, 461, 1135–1138. [Google Scholar] [CrossRef]
  5. Ren, G.; Li, L.; Huang, Y.; Wang, Y.; Zhang, W.; Zheng, R.; Zhong, C.; Wang, X. GhWIP2, a WIP zinc finger protein, suppresses cell expansion in Gerbera hybrida by mediating crosstalk between gibberellin, abscisic acid, and auxin. New Phytol. 2018, 219, 728–742. [Google Scholar] [CrossRef] [Green Version]
  6. Jones, V.A.S.; Dolan, L. MpWIP regulates air pore complex development in the liverwort Marchantia polymorpha. Development 2017, 144, 1472–1476. [Google Scholar] [CrossRef] [Green Version]
  7. Petricka, J.J.; Clay, N.K.; Nelson, T.M. Vein patterning screens and the defectively organized tributaries mutants in Arabidopsis thaliana. Plant J. 2008, 56, 251–263. [Google Scholar] [CrossRef]
  8. Crawford, B.C.W.; Ditta, G.; Yanofsky, M.F. The NTT Gene Is Required for Transmitting-Tract Development in Carpels of Arabidopsis thaliana. Curr. Biol. 2007, 17, 1101–1108. [Google Scholar] [CrossRef] [Green Version]
  9. Marsch-Martínez, N.; Zúñiga-Mayo, M.V.; Herrera-Ubaldo, H.; Ouwerkerk, B.P.; Pablo-Villa, J.; Lozano-Sotomayor, P.; Greco, R.; Ballester, P.; Balanzá, V.; Kuijt, J.S.; et al. The NTT transcription factor promotes replum development in Arabidopsis fruits. Plant J. 2014, 80, 69–81. [Google Scholar] [CrossRef]
  10. Chung, K.S.; Lee, J.H.; Lee, J.S.; Ahn, J.H. Fruit indehiscence caused by enhanced expression of NO TRANSMITTING TRACT in Arabidopsis thaliana. Mol. Cells 2013, 35, 519–525. [Google Scholar] [CrossRef] [Green Version]
  11. Herrera-Ubaldo, H.; Lozano-Sotomayor, P.; Ezquer, I.; Di Marzo, M.; Montes, R.A.C.; Gómez-Felipe, A.; Pablo-Villa, J.; Diaz-Ramirez, D.; Ballester, P.; Ferrándiz, C.; et al. New roles of NO TRANSMITTING TRACT and SEEDSTICK during medial domain development in Arabidopsis fruits. Development 2019, 146, dev172395. [Google Scholar] [CrossRef] [Green Version]
  12. Crawford, B.C.W.; Sewell, J.; Golembeski, G.; Roshan, C.; Long, J.A.; Yanofsky, M.F. Genetic control of distal stem cell fate within root and embryonic meristems. Science 2015, 347, 655–659. [Google Scholar] [CrossRef] [Green Version]
  13. Roldan, M.V.G.; Izhaq, F.; Verdenaud, M.; Eleblu, J.; Haraghi, A.; Sommard, V.; Chambrier, P.; Latrasse, D.; Jégu, T.; Benhamed, M.; et al. Integrative genome-wide analysis reveals the role of WIP proteins in inhibition of growth and development. Commun. Biol. 2020, 3, 239. [Google Scholar] [CrossRef]
  14. Horiguchi, G.; Tsukaya, H. Organ size regulation in plants: Insights from compensation. Front. Plant Sci. 2011, 2, 24. [Google Scholar] [CrossRef] [Green Version]
  15. Du, Y.; Roldan, M.V.G.; Haraghi, A.; Haili, N.; Izhaq, F.; Verdenaud, M.; Boualem, A.; Bendahmane, A. Spatially expressed WIP genes control Arabidopsis embryonic root development. Nat. Plants 2022, 8, 635–645. [Google Scholar] [CrossRef]
  16. Becker, D.; Kemper, E.; Schell, J.; Masterson, R. New plant binary vectors with selectable markers located proximal to the left T-DNA border. Plant Mol. Biol. 1992, 20, 1195–1197. [Google Scholar] [CrossRef]
  17. Clough, S.J.; Bent, A.F. Floral dip: A simplified method for Agrobacterium-mediated transformation of Arabidopsis thaliana. Plant J. 1998, 16, 735–743. [Google Scholar] [CrossRef] [Green Version]
  18. Lazcano-Ramírez, H.G.; Gómez-Felipe, A.; Díaz-Ramírez, D.; Durán-Medina, Y.; Sánchez-Segura, L.; De Folter, S.; Marsch-Martínez, N. Non-destructive Plant Morphometric and Color Analyses Using an Optoelectronic 3D Color Microscope. Front. Plant Sci. 2018, 9, 1409. [Google Scholar] [CrossRef]
  19. Schneider, C.A.; Rasband, W.S.; Eliceiri, K.W. NIH Image to ImageJ: 25 years of image analysis. Nat. Methods 2012, 9, 671–675. [Google Scholar] [CrossRef]
  20. Zhang, H.; Zhang, F.; Yu, Y.; Feng, L.I.; Jia, J.; Liu, B.O.; Li, B.; Guo, H.; Zhai, J. A Comprehensive Online Database for Exploring ∼20,000 Public Arabidopsis RNA-Seq Libraries. Mol. Plant 2020, 13, 1231–1233. [Google Scholar] [CrossRef]
  21. Rstudio Team. RStudio: Integrated Development for R; Rstudio PBC: Boston, MA, USA, 2022. [Google Scholar]
  22. Tissier, A.F.; Marillonnet, S.; Klimyuk, V.; Patel, K.; Torres, M.A.; Murphy, G.; Jones, J.D. Multiple independent defective suppressor-mutator transposon insertions in Arabidopsis: A tool for functional genomics. Plant Cell 1999, 11, 1841–1852. [Google Scholar] [CrossRef] [PubMed] [Green Version]
  23. Alonso, J.M.; Stepanova, A.N.; Leisse, T.J.; Kim, C.J.; Chen, H.; Shinn, P.; Stevenson, D.K.; Zimmerman, J.; Barajas, P.; Cheuk, R.; et al. Genome-wide insertional mutagenesis of Arabidopsis thaliana. Science 2003, 301, 653–657. [Google Scholar] [CrossRef] [PubMed] [Green Version]
  24. Kleinboelting, N.; Huep, G.; Kloetgen, A.; Viehoever, P.; Weisshaar, B. GABI-Kat SimpleSearch: New features of the Arabidopsis thaliana T-DNA mutant database. Nucleic Acids Res. 2012, 40, D1211–D1215. [Google Scholar] [CrossRef] [PubMed] [Green Version]
Figure 1. pWIP::GUS expression in 9 dag seedlings. Scale bars represent 1 mm in (AF) and 0.5 mm in (GJ).
Plants 11 02010 g001
Figure 2. pWIP::GUS expression in inflorescences and the base of inflorescence stems. (AF) Inflorescences; (GL) base of the inflorescence stem. Scale bars represent 1 mm.
Plants 11 02010 g002
Figure 3. Leaf phenotypic analyses of WIP overexpressors (OE). (A) Leaf area of WIP OE. (B) Leaf cell area of WIP OE. (C) Stomatal density in WIP OE leaves. (D) Representative leaf shape and average size of WIP OE. (E) Representative micrograph of leaf pavement cells in wt (Col-0) (E) and 35S::WIP4 (F) leaves. Scale bars represent 1 cm in (D) and 40 µm in (E) and (F). In (AC), ANOVA p-value < 0.0001. Letters represent different statistical groups (LSD test).
Plants 11 02010 g003
Figure 4. Leaf phenotypic analyses of wip mutants at 30 dag. (A) Leaf area of wip mutants. (B) Leaf cell area of wip mutants. (C) Representative leaf shape and average size of wip mutants. (D) Representative micrograph of leaf pavement cells in wt (Col-0) and (E) wip2 wip5 leaves. Scale bars represent 1 cm in (C) and 40 µm in (D) and (E). ANOVA p-value = 0.0113 in (A) and 0.0008 in (B). Letters represent different statistical groups (LSD test).
Plants 11 02010 g004
Figure 5. Leaf phenotypic analyses of wip mutants at 60 dag. (A) Leaf area of wip mutants. (B) Cell area of wip mutants. (C) Representative leaf shape and average size of wip mutants. (D) Representative micrograph of leaf pavement cells in wt (Col-0) and (E) wip2 wip5 leaves. Scale bars represent 1 cm in (C), and in (D) and (E) 40 µm. ANOVA p-value= 0.0141 in (A) and 0.0001. in (B). Letters represent different statistical groups (LSD test).
Plants 11 02010 g005
Figure 6. Stem phenotypic analyses of wip mutants. (A) Number of vascular bundles in wip mutants. K.W. test p-value < 0.0001. (B) Stem transverse section area (reflecting stem thickness) of wip mutants. ANOVA p-value = 0.0013. Letters indicate different statistical groups ((A) Dunn’s; (B) LSD).
Plants 11 02010 g006
Publisher’s Note: MDPI stays neutral with regard to jurisdictional claims in published maps and institutional affiliations.

