Article

Genetic Diversity and Population Structure of Jubaea chilensis, an Endemic and Monotype Gender from Chile, Based on SNP Markers

by
Paola Jara-Arancio
1,2,3,*,
Carolina da Silva Carvalho
4,
Martín R. Carmona-Ortiz
5,
Ramiro O. Bustamante
1,2,6,
Priscilla M. Schmidt Villela
7,
Sónia C. da Silva Andrade
8,
Francisco T. Peña-Gómez
1,6,
Luís A. González
9 and
Marina Fleury
1,9,10
1
Instituto de Ecología y Biodiversidad (IEB), Victoria 631, Barrio Universitario, Concepción 4030000, Chile
2
Centro Internacional Cabo de Hornos (CHIC), Universidad de Magallanes, Teniente Muñoz 166, Puerto Williams 6350000, Chile
3
Departamento de Ciencias Biológicas y Departamento de Ecología y Biodiversidad, Facultad de Ciencias de la Vida, Universidad Andrés Bello, República 252, Santiago 8370134, Chile
4
Instituto Tecnológico Vale (ITV), Rua Boaventura da Silval, 955, Nazaré, Belém 66055-090, Brazil
5
Facultad de Ciencias Biológicas, Pontificia Universidad Católica de Chile, Santiago 8331150, Chile
6
Laboratorio de Ecología Geográfica, Departamento de Ciencias Ecológicas, Facultad de Ciencias, Universidad de Chile, Las Palmeras 3425, Ñuñoa, Santiago 7750000, Chile
7
EcoMol Consultoria e Projetos, Rua Ajudante Albano 847, Piracicaba 13416-030, Brazil
8
Departamento de Genética e Biologia Evolutiva, IB-USP, Rua do Matão 277, São Paulo 05508-090, Brazil
9
Facultad de Ciencias Forestales y de la Conservación de la Naturaleza, Universidad de Chile, Av. Santa Rosa 11315, La Pintana, Santiago 8820000, Chile
10
Projeto Origem, São Gonçalo do Amarante, São João del Rei 36300-970, Brazil
*
Author to whom correspondence should be addressed.
Plants 2022, 11(15), 1959; https://doi.org/10.3390/plants11151959
Submission received: 17 June 2022 / Revised: 12 July 2022 / Accepted: 19 July 2022 / Published: 28 July 2022
(This article belongs to the Special Issue Plant Evolutionary Ecology)

Abstract

:
Jubaea chilensis (Molina) Baill., also named Chilean palm, is an endemic species found in the coastal area of Mediterranean sclerophyllous forest in Chile. It has a highly restricted and fragmented distribution along the coast, being under intense exploitation and anthropogenic impact. Based on 1038 SNP markers, we evaluated the genetic diversity and population structure among six J. chilensis natural groups encompassing 96% of the species distribution. We observed low levels of genetic diversity, a deficit of heterozygotes (mean HE = 0.024; HO = 0.014), and high levels of inbreeding (mean FIS = 0.424). The fixation index (FST) and Nei’s genetic distance pairwise comparisons indicated low to moderate structuring among populations. There was no evidence of isolation by distance (r = −0.214, p = 0.799). In the cluster analysis, we observed a closer relationship among Culimo, Cocalán, and Candelaria populations. Migration rates among populations were low, except for some populations with moderate values. The K value that best represented the spatial distribution of genetic diversity was ∆K = 3. Habitat fragmentation, deterioration of the sclerophyllous forest, lack of long-distance dispersers, and a natural regeneration deficit may have driven inbreeding and low levels of genetic diversity in the palm groves of J. chilensis. Although extant populations are not at imminent risk of extinction, the rate of inbreeding could increase and migration could decrease if the effects of climate change and human impact become more acute.

1. Introduction

Understanding the extent to which human activities affect the distribution of the genetic diversity of plant species is mandatory for geneticists and ecologists interested in the conservation of biodiversity [1]. High genetic diversity is necessary for species to cope with environmental changes and the ongoing genetic erosion, together with demographic aspects, can increase the extinction risk of natural populations [2]. Therefore, in the context of global change, the knowledge of genetic patterns in natural populations is essential for more effective conservation management of species. Habitat loss and fragmentation are considered human-induced disturbances of major importance for the genetics of natural plant populations [3]. The cascade effects of such disturbances may lead to reduced seed dispersal; increased isolation of populations; reduced species abundance; and, consequently, to bottlenecks and inbreeding in plant populations. The ensuing effects of genetic drift and reduced gene flow may place some species at the edges of extinction [4]. Animal-dispersed plants can be particularly affected by habitat loss and fragmentation, because large seed disperser vertebrates are particularly prone to extinction [5]. As these vertebrates can move seeds over long distances [6], the extinction of frugivores may lead to an accumulation and concentration of seedlings of plants that depend on animals for seed dispersal near the parent plants. The reduction of long-distance seed dispersal may augment genetic structure within and between seedlings of plants that depend on anween populations and decrease the genetic diversity at the population level [7,8,9,10].
Palms (Arecaceae) were among the first plant groups to receive attention regarding the risks of becoming endangered [11], but despite this early attention, many palm species are heading toward population collapse (26). Today, the IUCN Red List of Threatened Species includes about 31% of the world’s 1150 palm species. The interest in palm conservation stems from both their economic [12,13] and ecological importance [14,15]. Palms have been regarded as ‘keystone resource species’ [14,15], as their disappearance may have a cascade effect on natural ecosystems, changing the competitive relationships and relative abundance of other species in the community [16,17]. From a socioeconomic perspective, palms are considered a prime non-timber forest product (NTFP) resource [12], as its fruits, leaves, stems, seeds, sap, and other parts are exploited, destructively or not, for numerous purposes [18,19,20].
The coastal sclerophyllous forest, located at the Chilean Mediterranean biome in Central Chile (31°52′–37°20′ S), is a diverse ecosystem with high levels of endemism [21,22,23]. The palmar, or palm forest, is an overlooked component of the sclerophyllous forest, which occurs in patches with individuals of the long-lived Jubaea chilensis (Molina) Baill., the Chilean palm, a tertiary-relict endemic species [24]. The rainforest contractions in Central Chile during the late Pleistocene and the extensive use of Chilean palm, combined with intense human activity for land change uses in Central Chile, have reduced the pre-Columbian populations of J. chilensis to 2.5% [25,26]. More recently, such changes are mostly driven by habitat loss and fragmentation, xylem sap extraction from decapitated palm trees, illegal seed overharvesting for human consumption, and recurrent wildfires. All of these synergic disturbances are thus expected to have detrimental consequences on the J. chilensis genetic diversity [3]. Jubaea chilensis is an arborescent, woody monocot species and is diclino-monoecious. The fruit is a drupe with an orange fleshy pulped-pericarp and a hard-lignified endocarp [27,28,29,30]. This palm species presents a low frequency of long-distance seed dispersal events, reduced survival of seedlings, and its habitat has high anthropogenic intervention [25,26] In the Pleistocene, seed dispersal was the product of endozoocoria by the extinct megafauna species belonging to the following families: Gomphotheriidae, Camelidae, Equidae, Notohippidae, Homalodotheriidae, Toxodontidae, Astrapotheriidae, Macraucheniidae, Mylodontidae, and Megatheriidae [26,31]. Currently, the seeds are mainly dispersed in territories close to the mother plant as a result of gravity, floods, and runoff [26,32,33]. Humans can transfer the seeds to different commercialization sites, and the Octodont degus Molina and Spalacopus cyanus Molina rodents hoard the seeds for later consumption [26]. The frequency of rodent–seed interaction is low (<25%) and the transport usually occurs over short distances (<6 m, or 6.2 m [34,35]), indicating that rodent-dependent dispersion may be insufficient for genetic exchange between existing palm groves, which leads to a lack of gene flow and isolation between patches [26]. This precariousness in dispersion is highly affected by the black rat Rattus rattus L. that predates the seeds. Cordero et al. [34] found that the germination rate was 6%, plant survival was 1.81%, and only 7.9% of surviving seedlings become infantile plants (4 years old). The recently introduced domestic species, such as cattle and horses, also have an important effect, considering that they remove, consume, and regurgitate the seeds, but leave them susceptible to competition and desiccation [26,35]. In spite of the fact that pollen dispersal can cover a greater distance than seeds [36,37,38], in this case, its movement is limited because of the abundant flowers produced by just one individual, which mean that pollinators visit contiguous flowers of the same individual, and visits to the flowers of other individuals are very infrequent events [26]. It has been described that, in systems with restricted pollen dispersal, the interruption of genetic connectivity can occur even in continuous populations [39,40,41].
To assess the magnitude of the loss of genetic diversity that J. chilensis populations present as a result of isolation and low population sizes, a genetic conservation study was carried out in remnant populations of the species under study. Specifically, we estimated parameters of genetic diversity and inbreeding and evaluated genetic structure and patterns of contemporary migration among populations. The information obtained will be crucial to understand the current genetic diversity as well as provide input for planning strategies for safeguarding sustainable management of the conservation of this emblematic species.

2. Results

2.1. Statistical Analysis and Genetic Diversity

The total number of reads was 226,279,541 with good average quality (Q-score ≥ 30), showing an optimal value (Q ≥ 30) throughout all of the sequences (101 bp, –read length sequenced by the Illumina HiSeq platform). A total of 1038 SNPs were selected for this study, according to our previously established parameters. The distribution of SNP minor allele frequencies (MAFs) is shown in Table S1. More than 96.92% of the SNPs for all sampled populations presented MAF values ≤ 0.1, varying from 0.994 in Culimo to 0.969 in Viña del Mar/Valparaíso, with MAF scores ranging up to MAF ≤ 0.4.
Expected heterozygosity values (HE) were higher than the observed values (HO) for all populations. The mean HO varied from 0.036 in Culimo to 0.108 in Petorca, and the mean HE varied from 0.086 in Culimo to 0.145 in Petorca, with an overall HO of 0.014 and an overall HE of 0.024, both suggesting a deficit of heterozygotes. Inbreeding coefficient values (FIS) for all populations were statistically significant (overall value of 0.424, with a 95% confidence interval not including zero), varying from 0.177 in Viña del Mar/Valparaíso to 0.586 in Culimo, which also indicates high levels of inbreeding with little or no random mating (Table 1). All FST comparisons between populations showed values above 0.049 and below 0.119, which indicates moderate genetic structuring (Table 2). Nei’s genetic distance values were lower than 0.003 in all populations, also indicating that the populations may be genetically similar (Table 2). In the PCO, the first two axes explained 61.4% of the variance (35.0% and 26.4%, respectively). There was relative proximity between the Culimo, Cocalán, and Candelaria group and the Petorca population, while the Ocoa and Viña del Mar/Valparaíso populations remained in opposite peripheries (Figure 1). Mantel test results indicated that Nei’s genetic distance matrix did not significantly correlate with the geographic distance matrix (r = −0.214, p = 0.799), i.e., the nearest populations did not have lower values of genetic differentiation. When observing the Mantel analyses between geographical distance and FST, similar results were observed, that is, there was no significant correlation (r = −0.125, p = 0.669). Low migration rates were observed (m = 0.010–0.022), except for the following populations (source receiver): Cocalán Candelaria (0.237 [0.181–0.293]), Cocalán Culimo (0.280 [0.238–0.322]), Cocalán Petorca (0.266 [0.215–0.317]), and Viña del mar-Valparaiso Ocoa (0.268 [0.222–0.314]) (Table 3). The log likelihood values were comparable between BA3-SNPs runs, as was the Bayesian deviance (Table S2).

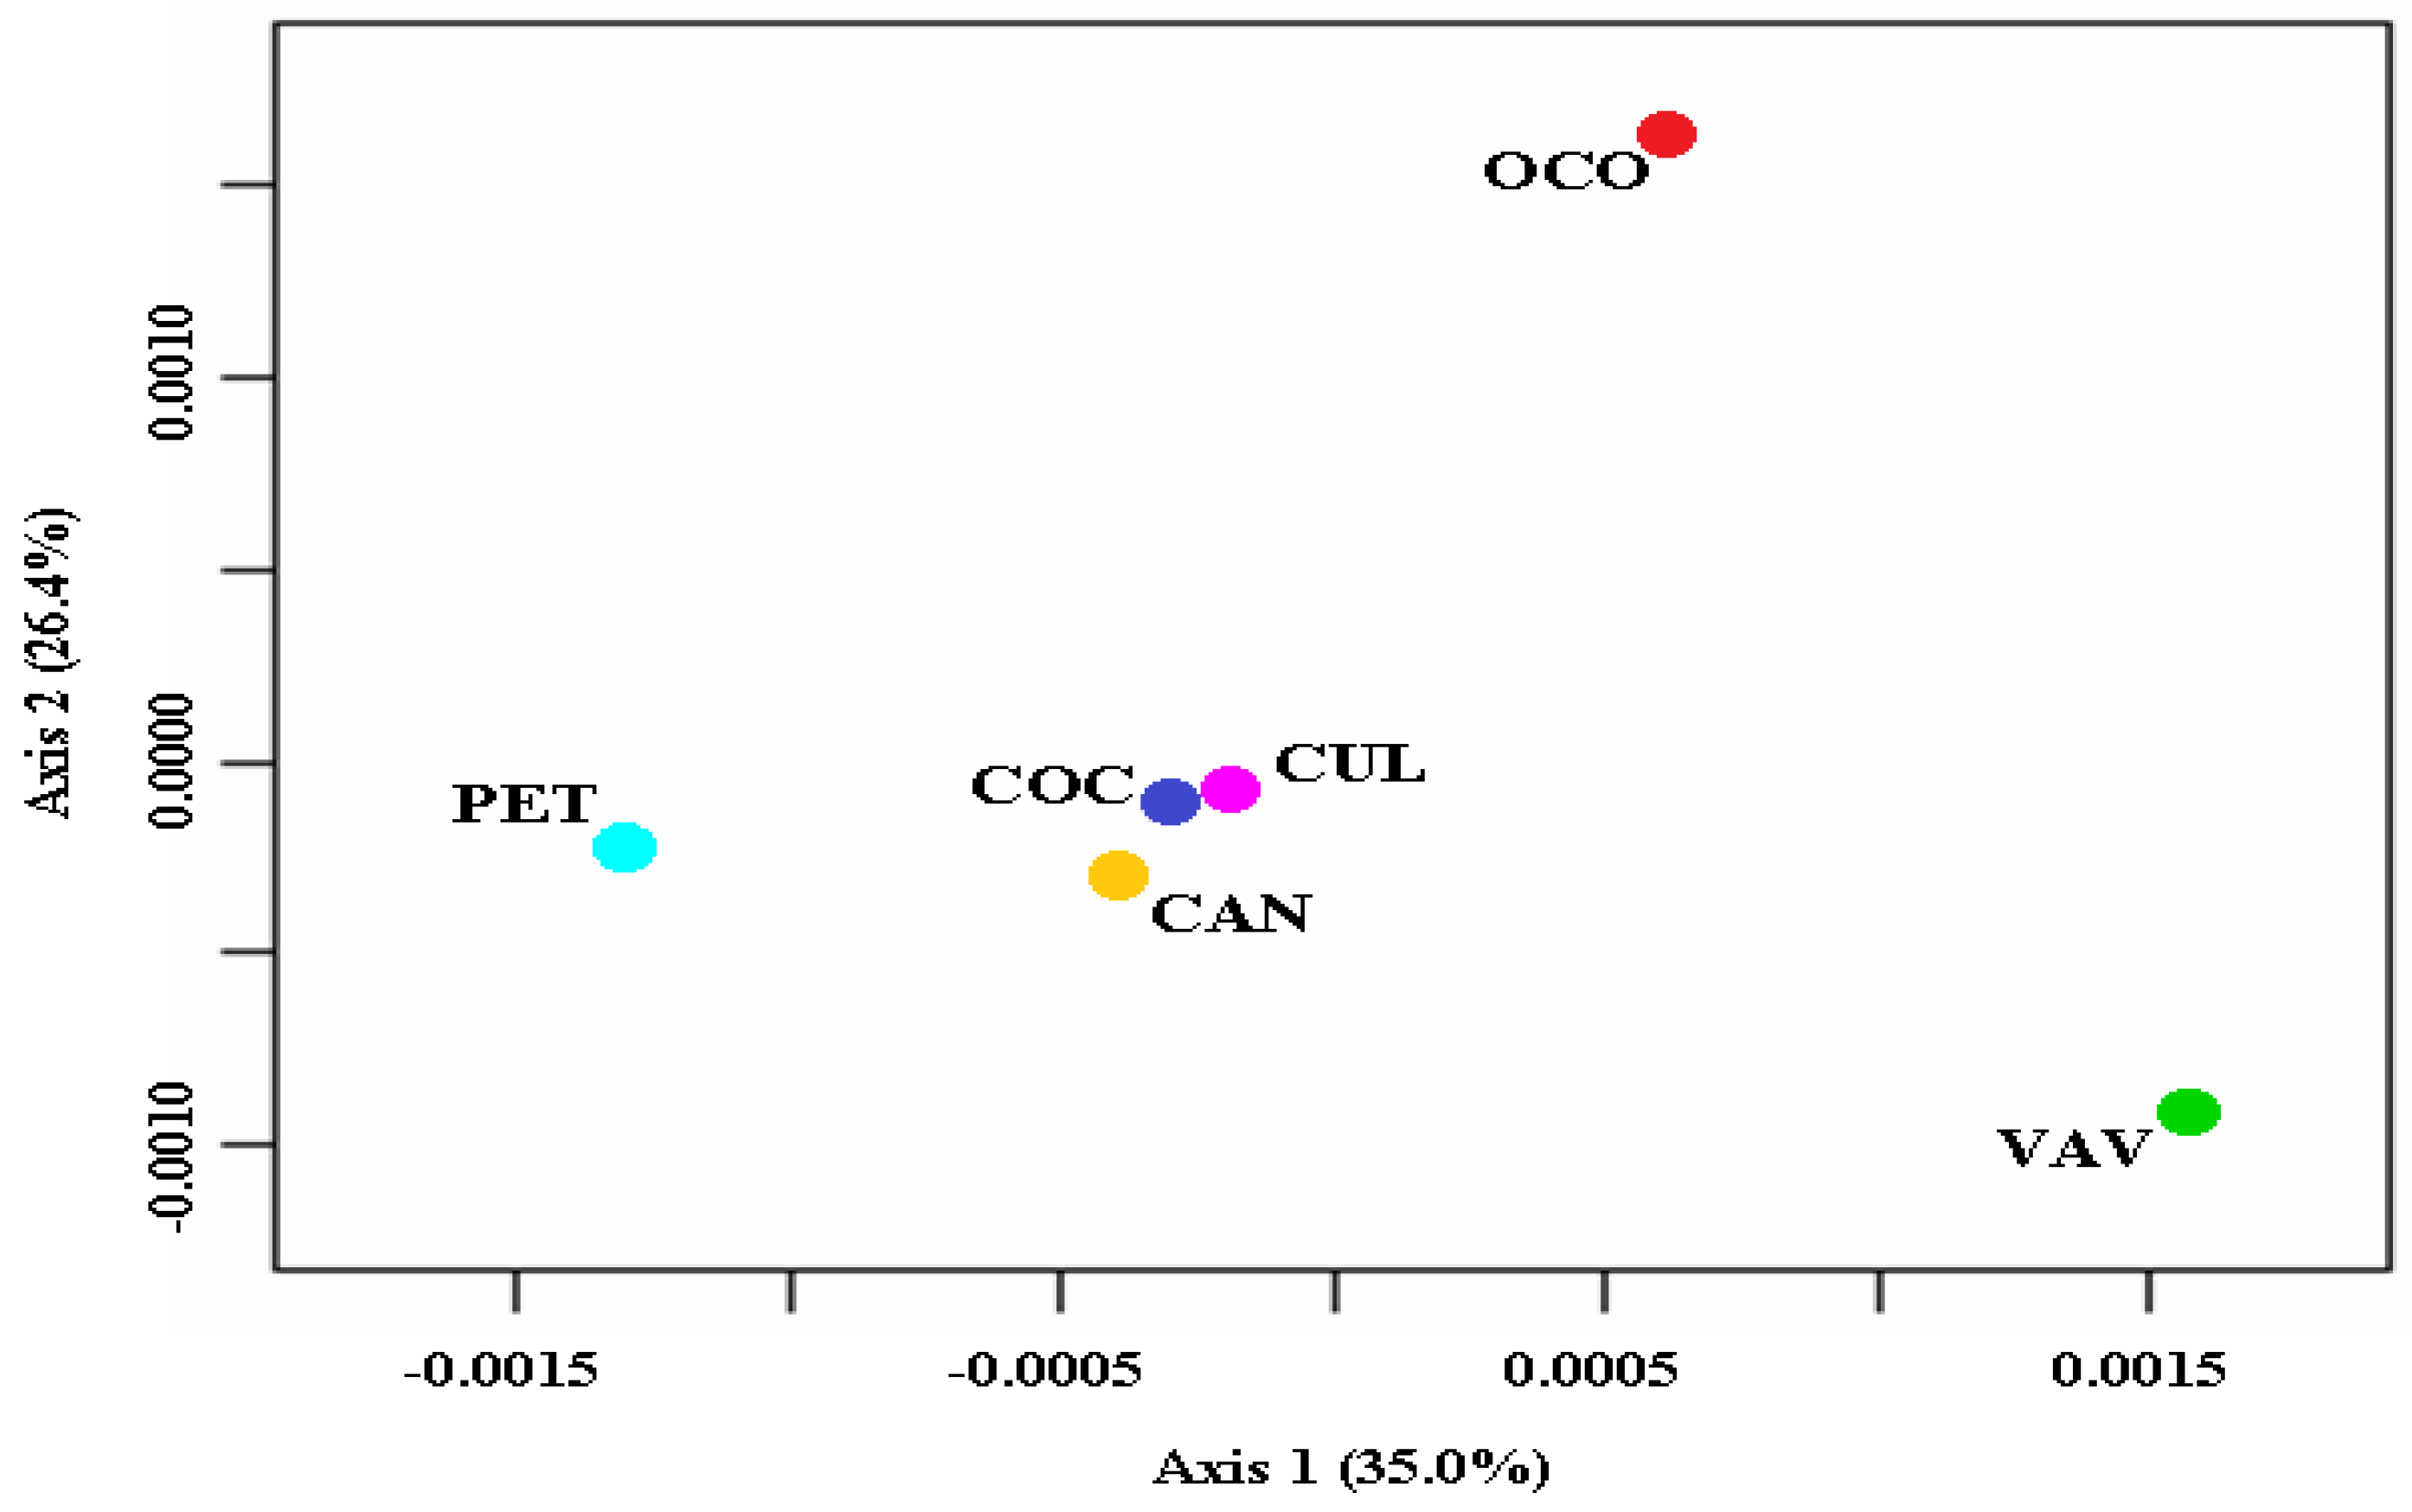
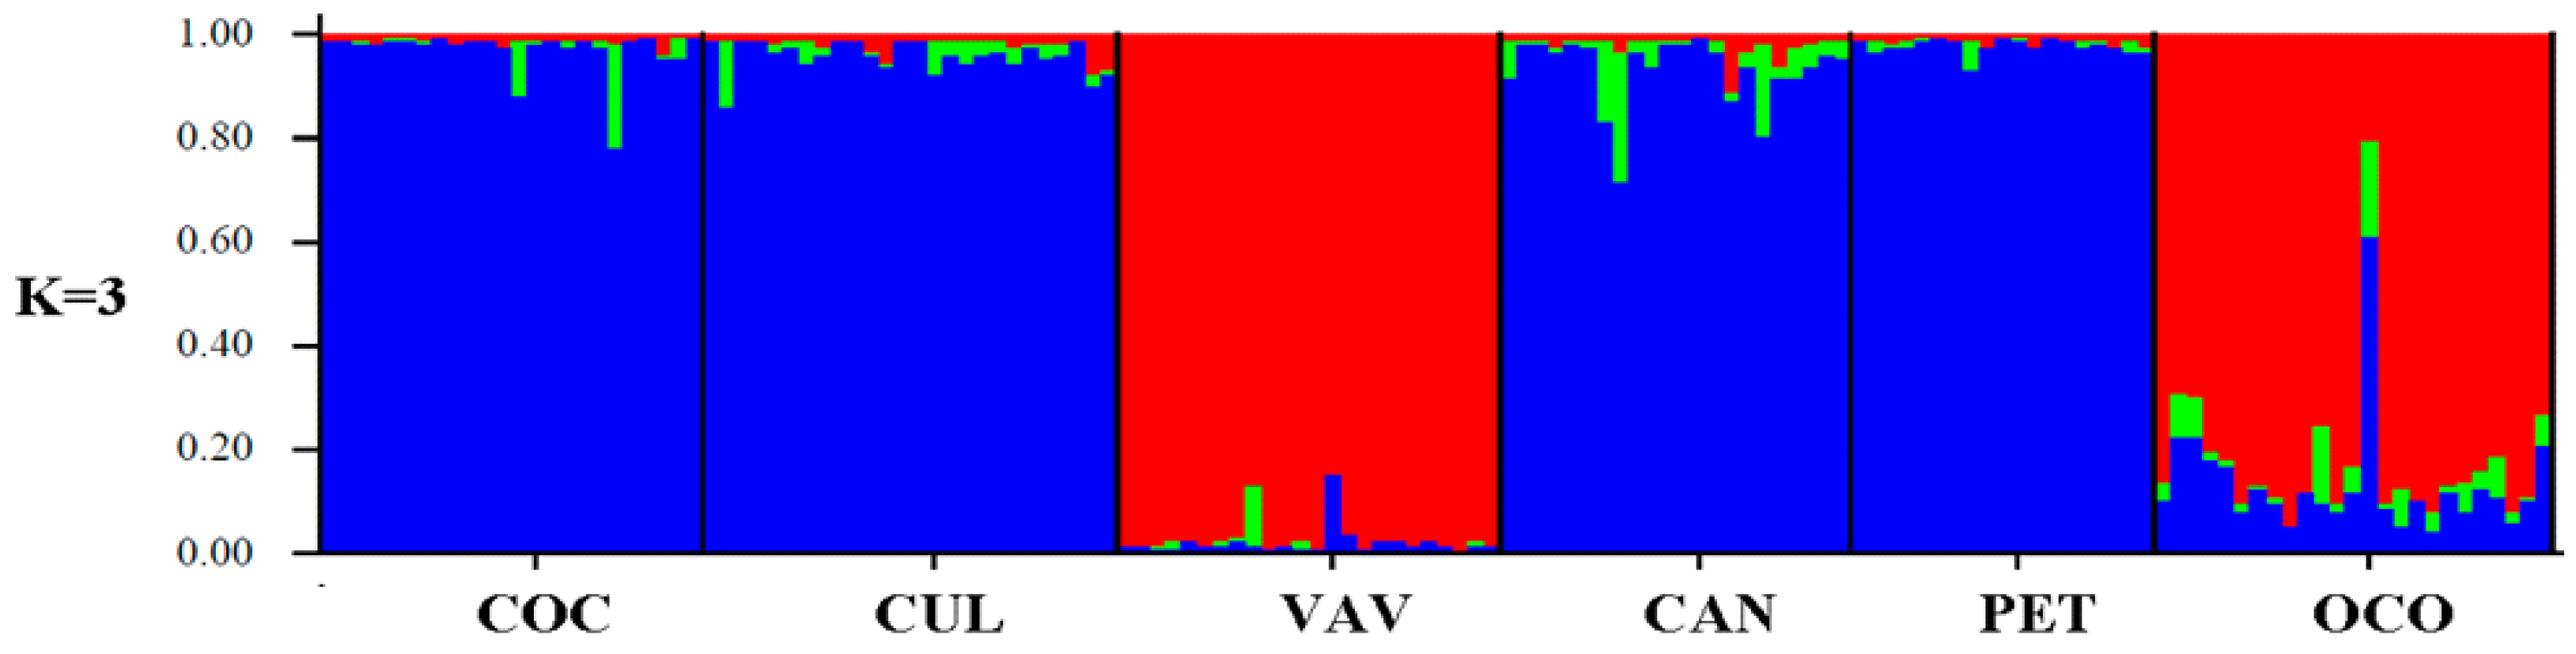
2.2. Genetic Structure and Admixture Levels

Based on the maximum value of ΔK, the estimated number of optimal groups was K = 3 (Figure 2 and Figure S1, Table S3). Individuals from the Cocalán, Culimo, Candelaria, and Petorca populations had very close genetic characteristics, while Viña del Mar/Valparaíso was characterized as a unique group for almost all K values. The Culimo and Petorca individuals remain together for all of the assigned K values (Figure 2). At K = 3, 99% of the individuals in each population are correctly assigned to the area from which they were sampled, and only one individual from OCOA (129) contains attributions higher than 50% from other areas of origin (Figure S2).

3. Discussion

Our results show that all studied populations of J. chilensis present low genetic diversity and high inbreeding. Given their biallelic heritage, the highest value of HE expected for SNPs is 0.5. However, the highest value observed for J. chilensis was less than a third of that value, indicating that these populations likely suffer from loss of genetic diversity. Null alleles are an issue for many marker types and could also result in a downward bias in estimated heterozygosity. Unfortunately, we are not able to estimate null alleles’ frequency and SNP null alleles have not been described in this species. The inbreeding coefficient was significant and high for all populations, even though the species is diclino-monoescious, which favored crossing [42]. Interestingly, the population with a small number of specimens (CUL) had the lowest value of HE and the highest value of FIS. All of these results are indicative that J. chilensis may be suffering from genetic erosion. Other palm species have also shown high levels of inbreeding, and it was usually associated with the mating system, anthropic effects, and low abundance of populations [43,44,45,46,47,48]. The levels of inbreeding found in this study are concordant with what has been found in other species of the Arecaceae family. For instance, Shapcott et al. [43] found high levels of inbreeding in populations of five species of the genus Pinanga. Cibrián-Jaramillo et al. [44] found high inbreeding in populations of Chamaedorea ernesti-augusti, and declare that the high inbreeding is a result of the anthropic effect. Santos et al. [45], using nine ISSR markers, showed high levels of inbreeding and low abundance levels of Attalea vitrivir individuals. Other studies using microsatellites confirmed the prevalence of inbreeding in Acrocomia aculeata populations, product of crosses between very close relatives, or even full siblings [46,47,48]. For Syagrus coronata, for example, the authors take into account the high-level of inbreeding to conduct conservation measures [49]. Given that the sclerophyllous forest inhabited by J. chilensis has been highly exploited and approximately only 121,284 specimens are found in Central Chile (2.5% of the original population of the 19th century), being distributed among highly fragmented populations [26,50,51], conservation measures for this species should consider the low level of genetic diversity and inbreeding found in our study.
Contrary to our expectation, we found low genetic structure, distant populations of J. chilensis being genetically similar, and no evidence of isolation by distance. These results are unlikely to reflect the current seed dispersal pattern of the species. Currently, seeds of J. chilensis are dispersed close to mother plants, as rodents (Octodont degus and Spalacopus cyanus) and introduced domestic species are the main seed dispersers. The frequency of rodent–seed interaction is low (<25%) and transport usually occurs over short distances (<6 m [35]), indicating that rodent-dependent dispersion may be insufficient for genetic exchange between existing palm groves [26]. Pollen dispersion is also unlikely to explain the low genetic structure among the populations found here, as the movement of pollen between individuals of J. chilensis seems to be limited owing to the high abundance of flowers produced per individual [26]. It has been described that, in systems with restricted pollen dispersal, the interruption of genetic connectivity can occur even in continuous populations [39,40,41].
Nowadays, the geographical distribution of palm groves is highly scattered in a series of small, isolated patches, consisting of small independent local populations at a geographic level, as depicted in Figure 1. As a consequence, the degree of inbreeding increased as a result of the crossing between relatives [52,53,54]. Studies on different taxa of the Arecaceae family suggest that fragmentation considerably affects the persistence of palm trees. In the south of the Brazilian Amazon, forest fragmentation has affected Bactris Jacq. ex Scop. genus (palm), leading to inbreeding depression and possibly leading to extinction of the local palm tree [55]. For the Astrocaryum aculetassimum (Schott) Burret, an endemic Atlantic Forest palm species, it has been reported that the species populations are highly affected by the loss of seed dispersers as a result of fragmentation and hunting [56]. Moreover, for the Astrocaryum mexicanum Liebm. ex Mart. species inhabiting Los Tuxtlas (State of Veracruz/México), the abundance of coleopterans and pollinating beetles varies according to the size of the fragment, making reproduction doubly susceptible to the effects of fragmentation [57]. In Ecuador, the seedlings of Ceroxylon echinulatum Galeano and Attalea colenda (O.F. Cook) Balslev and A.J. Hend. have failed to survive as a result of deforestation [37,58,59]. An extensive review of the literature of palms from Tropical America indicated that anthropic influences may cause changes in the genetic structure, increasing inbreeding, and genetic drift in fragmented populations [37]. Similarly to this study, the Phoenix dactylifera L. populations occurring in natural oases in Tunisia also presented HE values higher than HO values with low genetic structure [60].
It is important to highlight that genetic structure analysis may reflect both contemporary and historical processes such as past gene flow and population fluctuation [61], and that the contemporary migration rates estimated here usually correspond to the last three generations. Moreover, J. chilensis is a palm tree with a significantly long life expectancy, with 1000 years being the estimated age for the oldest individual [29,62]. Therefore, the low genetic structure detected for some populations and the moderate migration rates observed among some populations could be a result of high gene flow in the past. In the Pleistocene, seeds of J. chilensis were consumed and dispersed by the extinct megafauna species belonging to the following families: Gomphotheriidae, Camelidae, Equidae, Notohippidae, Homalodotheriidae, Toxodontidae, Astrapotheriidae, Macraucheniidae, Mylodontidae, and Megatheriidae [26,31]. Simulations suggest that extinct megafauna would frequently disperse large seeds over a long distance, and the events of long-distance seed dispersal by these animals would be up to ten times longer than long-distance dispersal by smaller-sized extant mammals [63]. Cocalán is the second largest population; this can be related to the fact that Cocalán presents an excellent habitat for the growth and development of Jubaea, where the soils are almost exclusively granitic [29] and highly resistant to drought and shade [64].
Germination and establishment studies of J. chilensis have been carried out [65,66,67,68] in the context of the National Plan for the Conservation of the Chilean Palm (Corporación Nacional Forestal, CONAF) in 2005. Unfortunately, the Plan does not have recommendations to evaluate the genetic structure of this palm as a fundamental requirement to propose viable and efficient actions for the conservation of this species [1]. As a result, active restoration of J. chilensis via sowing seedlings has been carried out without any consideration of genetic or biogeographic origin. Understanding the distribution of genetic variability can be especially important for species facing extinction risk, especially when translocations for restoration, genetic rescue, or assisted gene flow are fundamental aspects for the successful long-term population [69]. Currently, the Chilean palm is listed as endangered (EN) by IUCN. The lack of long-distance seed dispersal events, no capacity for vegetative propagation, and low seed regeneration, plus its severe seed harvest and demographic bottleneck, may increase the extinction risk of J. chilensis capacity [26,60,61]. Although at this moment there is no imminent risk, all these factors could promote genetic isolation, either within or between populations, which can intensify the loss of genetic diversity and inbreeding depression [41,54].

4. Conclusions

All populations of J. chilensis studied have low genetic diversity, high inbreeding, and no evidence of isolation by distance. Habitat fragmentation, deterioration of the sclerophyllous forest, lack of long-distance dispersers, and natural regeneration deficit may have driven inbreeding and low levels of genetic diversity in the palm groves of J. chilensis. Although extant populations are not at imminent risk of extinction, the rate of inbreeding could increase, and the migration effect might be overwhelmed by the effects of climate change and human impact. Thus, considering our findings plus the natural history and ecological context wherein J. chilensis lives, we suggest that this monospecific, relict, and endemic palm species should be considered as critically endangered by international conservation organizations.

5. Material and Methods

5.1. Study Organism

Jubaea chilensis is an arborescent and woody monocot, with a bare and cylindrical stipe narrower towards the top, reaching up to 30 m in height and from 0.80 to 1.10 m in diameter. It is a diclino-monoecious plant with cross pollination [42] and the fruit is a drupe with a single spherical seed of approximately 2–3 cm (0.79–1.18 pol.) in diameter. The fruit has an orange fleshy pulped-pericarp and a hard-lignified endocarp [26,27,28,29,30]. J. chilensis’ natural populations are distributed from La Serena (29°54′ S–71°15′ W) in the Coquimbo Region to Tapihue-Pencague (35°15′ S–71°47′ W) in the Maule Region. It inhabits warm climate areas with dry summers and coastal areas with coastal fog influence [29]. The species is found from sea level to approximately 1400 m [58], thus tolerating temperatures from 2.9 °C to 30.8 °C, with precipitations ranging from 127 to 879 mm [26,63]. The remaining populations are in an advanced stage of aging, with little or no appearance of natural regeneration and under a high anthropic impact due to the commercialization of their fruits and sap [26]. The dispersed seeds germinate for up to four years, forming persistent seed banks. Although the species adapts very well to its environment, the first stages of growth in which the seedlings must survive under the canopy are critical [62], especially in the understory of sclerophyllous and/or spiny species [63,64].

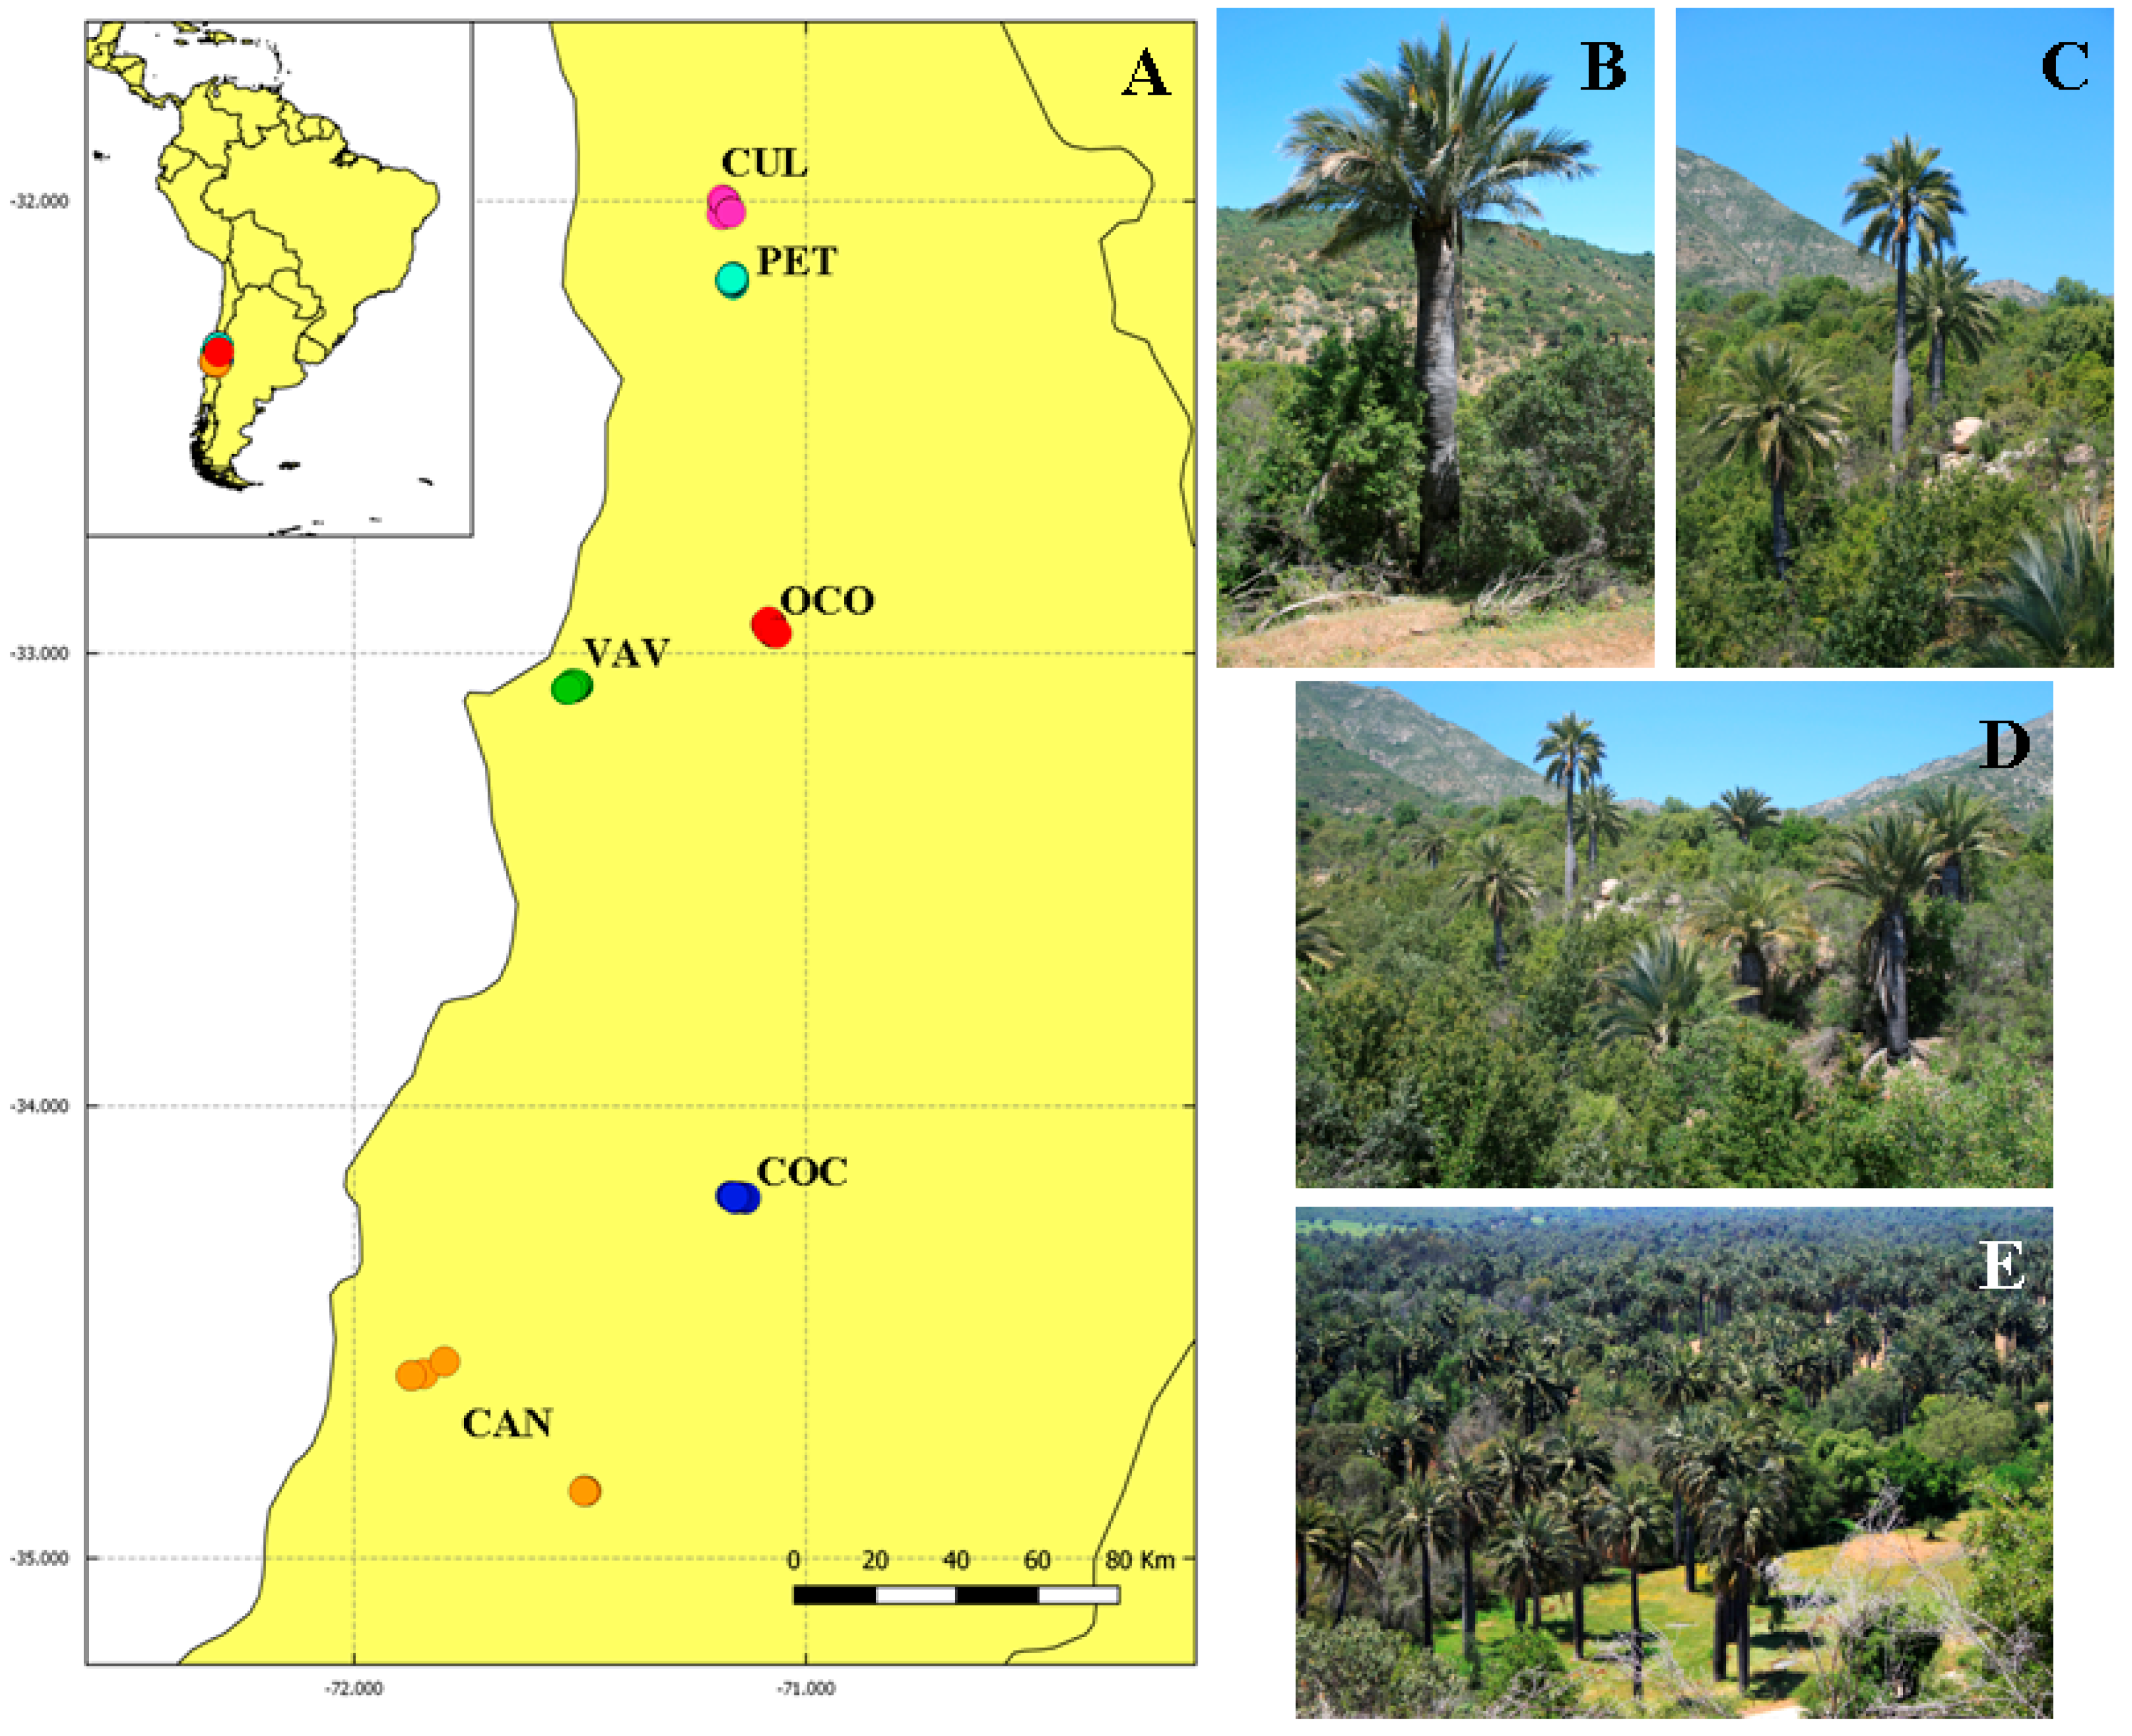
5.2. Study Area and Sampling

For the selection of population groups and individuals of J. chilensis to be sampled, we considered four parameters: (i) populations with more than 50 individuals; (ii) a sampling scheme that covers the entire species’ geographical range; (iii) the exclusion of specimens belonging to plantations; and (iv) a maximum of 30 individuals per population was analysed. We sampled the following populations groups: (a) Culimo (CUL), (b) Petorca (PET), (c) Ocoa (OCO), (d) Viña del Mar/Valparaíso (VAV), (e) Cocalán (COC), and (f) Candelaria (CAN) (Figure 1, Table 1). These groups of populations correspond to 95.98% of the total species abundance and are differentiated mainly by the orographic and edaphoclimatic characteristics (Figure 3, Table 4).

5.3. Genotyping-by-Sequencing Library and Single Nucleotide Polymorphisms’ Selection

We collected leaf tissue samples from 140 adult individuals of J. chilensis chosen at random, which included the entire distribution range and with a minimum separation between individuals of 150 m, between February and December 2015 (Table 4). Samples were stored in silica. For molecular analysis, DNA was extracted using the DNeasy Plant Mini Kit (Qiagen, EUA). DNA concentration was quantified using the Qubit High Sensitivity Assay kit (Invitrogen) and DNA integrity was assessed through visualization in a 1.2% agarose gel electrophoresis. Prior to library construction, DNA amount per sample was normalized at 100 ng/μL.
The Genotyping-by-Sequencing (GBS) library was constructed using the standard protocol described by Elshire et al. (2011, [70]) and employing the ApeKI restriction enzyme. Single-end 100-bp sequencing was conducted on the Illumina HiSeq 2500 platform. Samples were demultiplexed according to their respective barcodes. The generated sequences were filtered to remove low-quality sequences and contaminated reads using SeqyClean 1.9.9 (https://github.com/ibest/seqyclean, accessed on 1 January 2021); only high-quality paired-end sequences (with average PhredScore over 24 and over 65 bp) were used for further analysis. The single nucleotide polymorphisms’ (SNPs) prospection was performed using the software pipeline PyRAD v1.2 [71]. Reads with more than five Ns or shorter than 35 bp were discarded. The clustering threshold was set to 90% and the maximum number of SNPs per locus was set to 30. A locus had to be present in at least 50% of the samples to be retained in the final dataset. All other parameters were maintained at default values. To conduct population genetic analysis, we identified putative loci under selection using software BayeScan 2.1 [72] using the default values (Q-value < 0.05). The LOSITAN software was also used to identify loci under selection [73] and later removed from the SNPs dataset. The R package r2vcftools (https://github.com/nspope/r2vcftools, accessed on 1 January 2021)—a wrapper for VCFtools [74]—was used to perform final quality control on the genotype data. Filtering criteria included biallelic SNPs, linkage disequilibrium (r2 < 0.8) [75], Hardy–Weinberg equilibrium (HWE, p > 0.0001), and loci with less than 20% missing data.

5.4. Genetic Analysis

The fixation index coefficient (FIS) was calculated based on the variance found in the allelic frequencies [76], and the intra-population genetic diversity (expected and observed heterozygosities) was estimated under the Hardy–Weinberg equilibrium. Both analyses were performed using the ‘het’ option in VCFtools implemented in r2vcftools (https://github.com/rojaff/LanGen_pipeline, [74]—accessed on 1 January 2021). FST calculations between populations were performed using the dartR package v.183 [77] in R software (R Core, [78]). Genetic distance was estimated according to Nei (1972), where a constant and equal mutation rate is considered for all loci with equal population sizes for all generations and a mutation–drift balance, using the adegenet package in R [79]. Additionally, the geographical distance (in meters) between pairs of populations was calculated considering the Earth’s curvature (assuming the spherical model), using the geosphere package in R (R Core, [80]). Mantel test based on Spearman’s correlation with 9999 permutations was performed using geographical distance with FST, using the vegan package [81]. A principal coordinate analysis (PCO) based on Nei genetic distance was conducted using the pcoa command of the ape package [82,83]. We also calculated the migration rates (m) [84] of the studied populations. We used the BA3-SNPs v 3.0.4 [85] to determine the amount and direction of migration between populations. BA3-SNPs was run ten times using a different random seed across 10,000,000 iterations with a burn-in of 1,000,000 iterations and sampling every 1000 iterations. To compute the suitable allele frequency (a), inbreeding coefficient (f), and migration rate (m), we tested several values until we obtained the acceptance percentages recommended by BA3-SNPs authors (between 20 and 60%), being a—0.80, m—0.60, and f—0.60. We then assessed model convergence across all ten runs using Tracer v1.7.2 (http://beast.community/tracer, accessed on 1 January 2022). We used the Bayesian deviance as calculated by Meirmans (2014, [86]) to search for the best fitting model (the one with the lowest Bayesian deviance was selected for interpretation) [87]. A rough 95% confidence interval (CI) was constructed as mean ± 1.96 * sdev. All migration rates whose 95% confidence intervals did not include zero were reported as significant.

5.5. Genetic Structure and Admixture Levels

Populational structure and admixture degree were inferred using the Bayesian grouping method implemented in the STRUCTURE v 2.3.4 program [88,89,90]. Parameters were calculated for each K value (1 ≤ K ≤ 6) by means of an MCMC analysis of 100,000 replicates with a burn-in period of 20,000. The results were obtained based on 25 runs per population grouping, assuming both the Admixture model, which allows individuals to have multiple population origins, and the correlated allelic frequency model [88,89]. Finally, the posterior probability for each K value was determined by introducing the simulation results into STRUCTURE HARVESTER v 0.6.94 [91], where K values were evaluated using the logarithm of likelihood of the observed data (LnP [D]) as well as the second-order change rate of the data s log-likelihood in distinct runs of K (ΔK) [92].

Supplementary Materials

The following supporting information can be downloaded at https://www.mdpi.com/article/10.3390/plants11151959/s1. Figure S1: ΔK values for different numbers of populations assumed (K) in the STRUCTURE HARVESTER analysis v 0.6.94 for the six population groups of Jubaea chilensis, central Chile. Figure S2: Populational structure inferred for the six sampled groups of Jubaea chilensis, central Chile, based on the analysis of 1038 SNPs using the STRUCTURE v 2.3.4, assuming the Admixture model. Each individual is represented by a vertical bar, often partitioned into colored segments with the length of each segment representing the proportion of the individual’s genome from K = 3 ancestral populations. Cocalán: 1–24, Culimo: 25–50, Viña del Mar/Valparaíso: 51–74, Candelaria: 75–96, Petorca: 97–115, and Ocoa: 116–140. Table S1: Frequency of SNPs by minor allele frequencies (MAFs) within the six population groups of Jubaea chilensis. (CUL) Culimo, (PET) Petorca, (OCO) Ocoa, (VAV) Viña del Mar/Valparaíso, (COC) Cocalán, (CAN) Candelaria. Table S2: Evanno method results (Evanno et al., 2005) obtained using the STRUCTURE HARVESTER v 0.6.94 for the six population groups of Jubaea chilensis, central Chile. The highest value of delta K (in bold) indicates the number of established groups. Table S3: Log likelihood and Bayesian deviance for BA3-SNPs runs.

Author Contributions

Conceived and designed the work: M.F., R.O.B., P.M.S.V., P.J.-A. and L.A.G.; collected the data: F.T.P.-G.; bioinformatic analyses: P.M.S.V. and S.C.S.A.; analysed the data: P.J.-A., C.S.C., M.R.C.-O. and S.C.S.A.; wrote the manuscript: P.J.-A., C.S.C., M.R.C.-O., S.C.S.A., M.F. and R.O.B. All authors have read and agreed to the published version of the manuscript.

Funding

This research was funded by Antofagasta Minerals, ANID PIA APOYO CCTE AFB170008, Grant ANID PIA/BASAL FB210006, CHIC-ANID PIA/BASAL PFB210018, and CONICYT grant: 21161096.

Institutional Review Board Statement

Not applicable.

Informed Consent Statement

Not applicable.

Data Availability Statement

The SNPs will be deposited in Figshare and a url address will be provided upon the acceptance of this manuscript.

Acknowledgments

We thank ANID PIA APOYO CCTE AFB170008, Grant ANID PIA/BASAL FB210006 and Technological Centers of Excellence with Basal Financing ANID-Chile to the Cape Horn International Center (CHIC-ANID PIA/BASAL PFB210018). F.T.P. thanks CONICYT grant: 21161096.

Conflicts of Interest

The authors declare no conflict of interest.

References

  1. Gaston, K.J. Global patterns in biodiversity. Nature 2000, 405, 220–227. [Google Scholar] [CrossRef]
  2. Hughes, A.R.; Inouye, B.D.; Johnson, M.T.J.; Underwood, N.; Vellend, M. Ecological consequences of genetic diversity. Ecol. Lett. 2008, 11, 609–623. [Google Scholar] [CrossRef]
  3. Aguilar, R.; Quesada, M.; Ashworth, L.; Herrerias-Diego, Y.; Lobo, J. Genetic consequences of habitat fragmentation in plant populations: Susceptible signals in plant traits and methodological approaches. Mol. Ecol. 2008, 17, 5177–5188. [Google Scholar] [CrossRef]
  4. Fageria, M.S.; Rajora, O.P. Effects of harvesting of increasing intensities on genetic diversity and population structure of white spruce. Evol. Appl. 2013, 6, 778–794. [Google Scholar] [CrossRef]
  5. Dirzo, R.; Miranda, A. Altered patterns of herbivory and diversity in the forest understory: A case study of the possible consequences of contemporary defaunation. In Plant–Animal Interactions: Evolutionary Ecology in Tropical and Temperate Regions; Price, P.W., Ed.; Wiley: New York, NY, USA, 1991; pp. 273–287. [Google Scholar]
  6. Wright, S.J. The myriad consequences of hunting for vertebrates and plants in tropical forests. Perspect. Plant Ecol. Evol. Syst. 2003, 6, 73–86. [Google Scholar] [CrossRef] [Green Version]
  7. Pacheco, L.F.; Simonetti, J.A. Genetic structure of a mimosid tree deprived of it seed disperser, the spider monkey. Conserv. Biol. 2000, 14, 1766–1775. [Google Scholar] [CrossRef]
  8. Carvalho, C.S.; Galetti, M.; Colevatti, R.G.; Jordano, P. Defaunation leads tomicroevolutionary changes in a tropical palm. Sci. Rep. 2016, 6, 31957. [Google Scholar] [CrossRef] [Green Version]
  9. Giombini, M.I.; Bravo, S.P.; Sica, Y.V.; Tosto, D.S. Early genetic consequences of defaunation in a large-seeded vertebrate-dispersed palm (Syagrus romanzoffiana). Heredity 2017, 118, 568–577. [Google Scholar] [CrossRef] [Green Version]
  10. Pérez-Méndez, N.; Jordano, P.; Valido, A. Persisting in defaunated landscapes: Reduced plant population connectivity after seed dispersal collapse. J. Ecol. 2018, 106, 936–947. [Google Scholar] [CrossRef]
  11. Moore, H.E. Endangerment at the specific and generic level in palms. Principes 1979, 23, 47–64. [Google Scholar]
  12. Henderson, A.; Galeano, G.; Bernal, R. Field Guide to the Palms of the Americas; Princeton University Press: Princeton, NJ, USA, 1995; ISBN 9780691656120. [Google Scholar]
  13. Zambrana, N.Y.P.; Byg, A.; Svenning, J.C.; Moraes, M.; Grandez, C.; Balslev, H. Diversity of palm uses in the western Amazon. Biodivers. Conserv. 2007, 16, 2771–2787. [Google Scholar] [CrossRef]
  14. Terborgh, J. Keystone plant resources in the tropical forest. In Conservation Biology; Soulé, M.E., Ed.; Sinauer: Sunderland, MA, USA, 1989. [Google Scholar]
  15. Kinnaird, M.F. Competition for a forest palm: Use of Phoenix reclinata by human and non human primates. Conserv. Biol. 1992, 6, 101–107. [Google Scholar] [CrossRef]
  16. Howe, H.F.; Westley, L.C. Ecological Relationships of Plants and Animals; Oxford University Press: New York, NY, USA, 1988; ISBN 100195063147. [Google Scholar]
  17. Polis, G.A.; Sears, A.L.W.; Huxel, G.X.; Strong, D.R.; Maron, J. When is a trophic cascade a trophic cascade? Trends Ecol. Evol. 2000, 15, 473–475. [Google Scholar] [CrossRef]
  18. Macía, M.J. Multiplicity in palm uses by the Huaorani of Amazonian Ecuador. Bot. J. Linn. 2004, 144, 149–159. [Google Scholar] [CrossRef] [Green Version]
  19. Cayuela, L.; Golicher, D.J.; Benayas, J.M.R.; González-Espinoza, M.; Ramírez-Marcial, N. Fragmentation, disturbance and tree diversity in tropical montane forests. J. Appl. Ecol. 2006, 43, 1172–1181. [Google Scholar] [CrossRef]
  20. Zuidema, P.A.; De Kroon, H.; Werger, M.J. Testing sustainability by prospective and retrospective demographic analyses: Evaluation for palm leaf harvest. Ecol. Appl. 2007, 17, 118–128. [Google Scholar] [CrossRef] [Green Version]
  21. Villagrán, C.M. Quaternary History of the Mediterranean Vegetation of Chile. In Ecology and Biogeography of Mediterranean Ecosystems in Chile, California, and Australia; Arroyo, M.T.K., Zedler, P.H., Fox, M.D., Eds.; Ecological Studies (Analysis and Synthesis); Springer: New York, NY, USA, 1995; Volume 108. [Google Scholar]
  22. Luebert, F.; Pliscoff, P. Sinopsis Bioclimática y Vegetacional de Chile; Editorial Universitaria: Santiago, Chile, 2006; ISBN 9789561125759. [Google Scholar]
  23. Moreno-Chacón, M.; Mardones, D.; Viveros, N.; Madriaza, K.; Carrasco-Urra, F.; Marticorena, A.; Baeza, B.; Rodríguez, R.; Saldaña, A. Flora vascular de un remanente de bosque esclerófilo mediterráneo costero: Estación de Biología Terrestre de Hualpén, Región del Biobío, Chile. Gayana Bot. 2018, 75, 466–481. [Google Scholar] [CrossRef]
  24. Zuloaga, F.O.; Morrone, O.; Belgrado, M.L. Catálogo de las Plantas Vasculares del Cono Sur (Argentina, Sur de Brasil, Chile, Paraguay y Uruguay); Missouri Botanical Garden Press: St. Louis, MO, USA, 2008; ISBN 1930723768. [Google Scholar]
  25. González, L.A.; Bustamante, R.O.; Navarro, R.M.; Herrera, M.A.; Ibáñez, M.T. Ecology and management of the Chilean Palm (Jubaea chilensis): History, current situation and perspectives. Palms 2009, 53, 68–74. Available online: http://repositorio.uchile.cl/handle/2250/120359 (accessed on 16 June 2022).
  26. González, L.A.; Toral, M.A.; Navarro, R. Palma chilena: Una Especie Emblemática que Chile Necesita Recuperar; 2017; ISBN 9789563161908. Available online: https://www.aminerals.cl/media/5322/palma-chilena-una-especie-emblematica-que-chile-necesita-recuperar.pdf (accessed on 16 June 2022).
  27. Edwards, A. Ejemplares gigantescos de la Palma chilena (Jubaea chilensis (Molina) Baill.). Rev. Chil. Hist. Nat. 1903, 7, 254. [Google Scholar]
  28. Rodríguez, R.; Matthei, O.; Quezada, M. Flora Arbórea de Chile. Editorial de la Universidad de Concepción, Chile; Editorial de la Universidad de Concepción: Concepción, Chile, 1983. [Google Scholar]
  29. Angulo, J. La Palma chilena: Interesante Recurso Natural Renovable; Sociedad Agrícola y Forestal Hacienda Las Palmas de Cocalán Ltd.a. Impreso en Origo China: Santiago, Chile, 1985; ISBN 9789563161908. [Google Scholar]
  30. Fleury, M.; Marcelo, W.; Vásquez, R.A.; González, L.A.; Bustamante, R.O. Recruitment Dynamics of the Relict Palm, Jubaea chilensis: Intricate and Pervasive Effects of Invasive Herbivores and Nurse Shrubs in Central Chile. PLoS ONE 2015, 10, e0133559. [Google Scholar] [CrossRef]
  31. Carrasco, G. Mamíferos Fósiles de Chile; Auto Ediciones: Talcahuano, Chile, 2013; ISBN 9789563321616. [Google Scholar]
  32. Perez, H.E.; Shiels, A.B.; Zaleski, H.M.; Drake, D.R. Germination after simulated rat damage in seeds of two endemic Hawaiian palm species. J. Trop. Ecol. 2008, 24, 555–558. [Google Scholar] [CrossRef]
  33. Maron, J.L.; Pearson, D.E. Vertebrate predators have minimal cascading effects on plant production or seed predation in an intact grassland ecosystem. Ecol. Lett. 2011, 14, 661–669. [Google Scholar] [CrossRef] [PubMed]
  34. Cordero, S.; Gálvez, F.; Fontúrbel, F.E. Multiple anthropogenic pressures lead to seed dispersal collapse of the southernmost palm Jubaea chilensis. Front. Ecol. Evol. 2021, 9, 1–10. [Google Scholar] [CrossRef]
  35. Vander-Wall, S.B.; Longland, W.S. Diplochory: Are two seed dispersers better than one? Trends Ecol. Evol. 2004, 19, 155–161. [Google Scholar] [CrossRef]
  36. Sezen, U.U.; Chazdon, R.L.; Holsinger, K.E. Genetic consequences of tropical second-growth forest regeneration. Science 2005, 307, 891. [Google Scholar] [CrossRef] [Green Version]
  37. Montúfar, R.; Anthelme, F.; Pintaud, J.C.; Balslev, H. Disturbance and resilience in tropical american palm populations and communities. Bot. Rev. 2011, 77, 426–461. [Google Scholar] [CrossRef]
  38. Kremer, A.; Ronce, O.; Robledo-Arnuncio, J.J.; Guillaume, F.; Bohrer, G.; Nathan, R.; Bridle, J.R.; Gomulkiewicz, R.; Klein, E.K.; Ritland, K.; et al. Long-distance gene flow and adaptation of forest trees to rapid climate change. Ecol. Lett. 2012, 15, 378–392. [Google Scholar] [CrossRef] [Green Version]
  39. White, G.M.; Boshier, D.H.; Powell, W. Genetic variation within a fragmented population of Swietenia humilis Zucc. Mol. Ecol. 1999, 8, 1899–1909. [Google Scholar] [CrossRef]
  40. Lowe, A.J.; Boshier, D.; Ward, D.; Bacles, C.F.E.; Navarro, C. Genetic resource impacts of habitat loss and degradation; reconciling empirical evidence and predicted theory for neotropical trees. Heredity 2005, 95, 255–273. [Google Scholar] [CrossRef] [PubMed] [Green Version]
  41. Nora, S.; Albaladejo, R.; González-Martínez, S.; Robledo-Arnuncio, J.; Aparicio, A. Movimiento de genes (polen y semillas) en poblaciones fragmentadas de plantas. Rev. Ecosistemas. 2011, 20, 35–45. [Google Scholar] [CrossRef]
  42. Donoso, C. Monografía de la Palma chilena. Postítulo en Arquitectura y Manejo del Paisaje; Facultad de Arquitectura y Bellas Artes, Pontificia Universidad Católica de Chile: Santiago, Chile, 1992. [Google Scholar]
  43. Shapcott, A. Comparison of the population genetics and densities of five Pinanga palm species at Kuala Belalong, Brunei. Mol. Ecol. 2002, 8, 1641–1654. [Google Scholar] [CrossRef]
  44. Cibrián-Jaramillo, A.; Bacon, C.D.; Garwood, N.C.; Bateman, R.M.; Thomas, M.M.; Russell, S.; Bailey, D.; Hahn, W.J.; Bridgewater, S.G.M.; DeSalle, R. Population genetics of the understory fishtail palm Chamaedorea ernesti-augusti in Belize: High genetic connectivity with local differentiation. BMC Genet. 2009, 10, 65. [Google Scholar] [CrossRef] [PubMed] [Green Version]
  45. Santos, R.R.M.; Cavallari, M.M.; Pimenta, M.A.S.; Abreu, A.G.; Costa, M.R.; Guedes, M.L. Population genetic structure of Attalea vitrivir Zona (Arecaceae) in fragmented areas of southeast Brazil. Genet. Mol. 2014, 14, 6472–6481. [Google Scholar] [CrossRef]
  46. Lanes, E.C.M.; Motoike, S.Y.; Kuki, K.N.; Nick, C.; Freitas, R.D. Molecular Characterization and Population Structure of the Macaw Palm, Acrocomia aculeata (Arecaceae), Ex Situ Germplasm Collection Using Microsatellites Markers. J. Hered. 2015, 106, 102–112. [Google Scholar] [CrossRef] [PubMed] [Green Version]
  47. Lanes, E.C.M.; Motoike, S.Y.; Kuki, K.N.; Resende, M.D.V.; Caixeta, E.T. 2016 Mating System and Genetic Composition of the Macaw Palm (Acrocomia aculeata): Implications for Breeding and Genetic Conservation Programs. J. Hered. 2016, 107, 527–536. [Google Scholar] [CrossRef] [PubMed] [Green Version]
  48. Mengistu, F.G.; Motoike, S.Y.; Cruz, C.D. Molecular Characterization and Genetic Diversity of the Macaw Palm Ex Situ Germplasm Collection Revealed by Microsatellite Markers. Diversity 2016, 8, 20. [Google Scholar] [CrossRef] [Green Version]
  49. Barbosa, S.N.; Almeida, C. Genome survey and development of 15 microsatellite molecular markers in Syagrus coronata (Martius) Beccari (Arecaceae) by next-generation sequencing. Rev. Bras. Bot. 2019, 42, 195–200. [Google Scholar] [CrossRef]
  50. Rubinstein, A. Inventario y Estudio de Producción de un Rodal de Palma chilena, Jubaea chilensis (Mol.) Baillon. (Hacienda Ocoa, Provincia de Valparaíso). Tesis Ingeniería Forestal; Dpto. de Manejo de Recursos Forestales, Universidad de Chile. Fac. de Cs. Agrarias y Forestales: Santiago, Chile, 1969. [Google Scholar]
  51. Bascuñán, A. La palma, su cultivo y utilización en Chile. Bol. Soc. Nac. Agr. 1889, 20, 451–455, 489–492, 531–536, 570–574, 602–604. [Google Scholar]
  52. Crawley, M.J. Sex. In En Plant Ecology; Crawley, M.J., Ed.; Blackwell Science: Oxford, UK, 1997. [Google Scholar] [CrossRef]
  53. Young, A.G.; Clarke, G.M. Genetics, Demography and Viability of Fragmented Populations; Cambridge University Press: Cambridge, UK, 2000; ISBN 0521794218. [Google Scholar]
  54. Picó, F.; Quintana-Ascencio, P.F. Análisis de factores demográficos y genéticos para la conservación de poblaciones de plantas en un hábitat fragmentado. Ecosistemas 2005, 14, 108–115. [Google Scholar] [CrossRef]
  55. Clement, C.R.; Santos, R.P.; Desmouliere, S.J.M.; Ferreira, E.J.L.; Farias-Neto, J.T. Ecological Adaptation of Wild Peach Palm, Its In Situ Conservation and Deforestation-Mediated Extinction in Southern Brazilian Amazonia. PLoS ONE 2009, 4, e4564. [Google Scholar] [CrossRef] [Green Version]
  56. Galetti, M.; Donatti, C.I.; Pires, A.S.; Guimarães, P.R., Jr.; Jordano, P. Seed survival and dispersal of an endemic Atlantic forest palm: The combined effects of defaunation and forest fragmentation. Bot. J. Linn. 2006, 151, 141–149. [Google Scholar] [CrossRef] [Green Version]
  57. Aguirre, A.; Dirzo, R. Effects of fragmentation on pollinator abundance and fruit set of an abundant understory palm in a Mexican tropical forest. Biol. Conserv. 2008, 141, 375–384. [Google Scholar] [CrossRef]
  58. Borchsenius, F.; Borgtoft-Pedersen, H.; Balslev, H. Manual to the Palms of Ecuador; University of Aarhus: Aarhus, Denmark, 1998. [Google Scholar]
  59. Anthelme, F.; Lincango, J.; Gully, C.; Duarte, N.; Montúfar, R. How anthropogenic disturbances affect the resilience of a keystone palm tree in the threatened Andean cloud forest? Biol. Conserv. 2011, 144, 1059–1067. [Google Scholar] [CrossRef]
  60. Ben Abdallah, H.; Laajimi, A.; Guesmi, F.; Triki, T.; Ferchichi, A.; Hormaza, J.I.; Larranaga, N. Genetic diversity of endangered date palm (Phoenix dactylifera L.) in the oases of Nefzaoua, Tunisia, using SSR markers. Fruits 2020, 75, 84–91. [Google Scholar] [CrossRef]
  61. Zellmer, A.J.; Knowles, L.L. Disentangling the effects of historic vs contemporary landscape structure on population genetic divergence. Mol. Ecol. 2009, 18, 3593–3602. [Google Scholar] [CrossRef]
  62. Serra, M.T.; Gajardo, R.; Cabello, A. Jubaea chilensis (Mol.) Baillon. “Palma chilena” (Palmaceae). Especie Vulnerable. Santiago. Programa de Protección y Recuperación de la Flora Nativa de Chile; Depto. Silvicultura y Manejo. Ficha Técnica de Especies Amenazadas, Facultad de Ciencias Agrarias y Forestales, Corporación Nacional Forestal—Universidad de Chile: Santiago, Chile, 1986. [Google Scholar]
  63. Pires, M.M.; Guimarães, P.R.; Galetti, M.; Jordano, P. Pleistocene megafaunal extinctions and the functional loss of long-distance seed-dispersal services. Ecography 2018, 41, 153–163. [Google Scholar] [CrossRef] [Green Version]
  64. González, L.; Vita, A. Palma: Usos, regeneración y tratamientos. Rev. Campo. 1987, 11, 14–15. [Google Scholar]
  65. Infante, L. Estudio de la Germinación de la Palma chilena (Jubaea chilensis (Mol.) Baillón. Memoria de Esc; Ingeniería Forestal U. de Chile: Santiago, Chile, 1989. [Google Scholar]
  66. Saiz, F.; Antivilo, L.; Silva, I. Estudio sobra capacidad germinativa y viabilidad temporal de semillas de Jubaea chilensis. Bol. Cient. Mus. Hist. Nat. 1989, 21, 19–28. [Google Scholar]
  67. Cabello, A. Determinación del Contenido de Humedad y de la Germinación de Semillas de Jubaea chilensis en el Vivero y en el Laboratorio y de Embriones Extirpados Cultivados In Vitro. Notas del Centro Productor de Semillas de Árboles Forestales. 1999. Available online: www.uchile.cl/facultades/cs_forestales/publicaciones/cesaf/n11/2.html (accessed on 1 January 2021).
  68. Lewin, P. Ensayos de Fertilización para el Establecimiento de Palma chilena Jubaea chilensis (Mol.) Baillon. Tesis de Escuela de Ciencias Forestales; Universidad de Chile: Santiago, Chile, 2003. [Google Scholar]
  69. Flanagan, S.P.; Forester, F.R.; Latch, E.K.; Aitken, S.N.; Hoban, S. Guidelines for planning genomic assessment and monitoring of locally adaptive variation to inform species conservation. Evol. Appl. 2018, 11, 1035–1052. [Google Scholar] [CrossRef]
  70. Elshire, R.J.; Glaubitz, J.C.; Sun, Q.; Poland, J.A.; Kawamoto, K.; Buckler, E.S.; Mitchell, S.E. A Robust, Simple Genotyping-by-Sequencing (GBS) Approach for High Diversity Species. PLoS ONE 2011, 6, e19379. [Google Scholar] [CrossRef] [Green Version]
  71. Eaton, D.A.R. PyRAD: Assembly of de novo RADseq loci for phylogenetic analyses. Bioinformatics 2014, 30, 1844–1849. [Google Scholar] [CrossRef]
  72. Foll, M.; Gaggiotti, G. A Genome-Scan Method to Identify Selected Loci Appropriate for Both Dominant and Codominant Markers: A Bayesian Perspective. Genetics 2008, 180, 977–993. [Google Scholar] [CrossRef] [Green Version]
  73. Antao, T.; Lopes, A.; Lopes, R.J.; Beja-Pereira, A.; Luikart, G. LOSITAN: A workbench to detect molecular adaptation based on a F(st)-outlier method. BMC Bioinform. 2008, 9, 323. [Google Scholar] [CrossRef] [Green Version]
  74. Danecek, P.; Auton, A.; Abecasis, G.; Albers, C.A.; Banks, E.; DePristo, M.A.; Handsaker, R.E.; Lunter, G.; Marth, G.T.; Sherry, S.T.; et al. Group 1000 Genomes Project Analysis. The variant call format and VCFtools. Bioinformatics 2011, 27, 2156–2158. [Google Scholar] [CrossRef] [PubMed]
  75. Xuereb, A.; Kimber, C.M.; Curtis, J.M.R.; Bernatchez, L.; Fortin, M.J. Putatively adaptive genetic variation in the giant California sea cucumber (Parastichopus californicus) as revealed by environmental association analysis of restriction-site associated DNA sequencing data. Mol. Ecol. 2018, 27, 5035–5048. [Google Scholar] [CrossRef]
  76. Weir, B.S.; Cockerham, C.C. Estimating F-statistics for the analysis of population structure. Evolution 1984, 38, 1358–1370. [Google Scholar] [CrossRef]
  77. Gruber, B.; Unmack, P.J.; Berry, O.F.; Georges, A. DARTR: An r package to facilitate analysis of SNP data generated from reduced representation genome sequencing. Mol. Ecol. Resour. 2018, 18, 691–699. [Google Scholar] [CrossRef]
  78. Jombart, T. adegenet: A R package for the multivariate analysis of genetic markers. Bioinformatics 2008, 24, 1403–1405. [Google Scholar] [CrossRef] [Green Version]
  79. Jombart, T.; Ahmed, I. adegenet 1.3-1: New tools for the analysis of genome-wide SNP data. Bioinformatics 2011, 27, 3070–3071. [Google Scholar] [CrossRef] [Green Version]
  80. Hijmans, R.J. Geosphere: Spherical Trigonometry. R package version 1.5 10. 2009. Available online: https://CRAN.R-project.org/package=geosphere (accessed on 1 January 2021).
  81. Oksanen, J.; Blanchet, F.G.; Friendly, M.; Kindt, R.; Legendre, P.; McGlinn, D.; Wagner, H. Vegan: Community Ecology Package. R package version 2.5-6. 2019. Available online: https://CRAN.R-project.org/package=vegan (accessed on 1 January 2021).
  82. Nei, M. Genetic distance between populations. Am. Nat. 1972, 106, 283–292. [Google Scholar] [CrossRef]
  83. Paradis, E.; Schliep, K. ape 5.0: An environment for modern phylogenetics and evolutionary analyses in R. Bioinformatics 2019, 35, 526–528. [Google Scholar] [CrossRef] [PubMed]
  84. Dakin, E.; Avise, J. Microsatellite null alleles in parentage analysis. Heredity 2004, 93, 504–509. [Google Scholar] [CrossRef] [PubMed]
  85. Mussmann, S.M.; Douglas, M.R.; Chafin, T.K.; Douglas, M.E. BA3-SNPs: Contemporary migration reconfigured in BayesAss for next-generation sequence data. Methods Ecol. Evol. 2019, 10, 1808–1813. [Google Scholar] [CrossRef] [Green Version]
  86. Meirmans, P.G. Nonconvergence in B ayesian estimation of migration rates. Mol. Ecol. Resour. 2014, 14, 726–733. [Google Scholar] [CrossRef] [PubMed]
  87. Faubet, P.; Waples, R.S.; Gaggiotti, O.E. Evaluating the performance of a multilocus Bayesian method for the estimation of migration rates. Mol. Ecol. 2007, 6, 1149–1166. [Google Scholar] [CrossRef] [PubMed] [Green Version]
  88. Pritchard, J.K.; Stephens, M.; Donnelly, P. Inference of Population Structure Using Multilocus Genotype Data. Genetics 2000, 155, 945–959. [Google Scholar] [CrossRef]
  89. Falush, D.; Stephens, M.; Pritchard, J.K. Inference of population structure using multilocus genotype data: Linked loci and correlated allele frequencies. Genetics 2003, 164, 1567–1587. [Google Scholar] [CrossRef]
  90. Falush, D.; Stephens, M.; Pritchard, J.K. Inference of population structure using multilocus genotype data: Dominant markers and null alleles. Mol. Ecol Notes 2007, 7, 574–578. [Google Scholar] [CrossRef]
  91. Earl, D.A.; Vonholdt, B.M. STRUCTURE HARVESTER: A website and program for visualizing STRUCTURE output and implementing the Evanno method. Conserv. Genet. Resour. 2012, 4, 359–361. [Google Scholar] [CrossRef]
  92. Evanno, G.; Regnaut, S.; Goudetet, J. Detecting the number of clusters of individuals using the software structure: A simulation study. Mol. Ecol. 2005, 14, 2611–2620. [Google Scholar] [CrossRef] [Green Version]
Figure 1. Plot of the principal coordinate analysis based on Nei’s genetic distances for the six sampled Jubaea chilensis populations, using the pcoa command in the ape package (Paradis and Schliep, 2019). (CUL) Culimo, (PET) Petorca, (OCO) Ocoa, (VAV) Viña del Mar/Valparaíso, (COC) Cocalán, (CAN) Candelaria.
Plants 11 01959 g001
Figure 2. Inferred population structure for the Jubaea chilensis six population groups in central Chile based on an analysis of 1038 SNPs using STRUCTURE v 2.3.4, under the Admixture model. Each individual is represented by a vertical bar, often partitioned into coloured segments, with the length of each segment representing the proportion of the individual’s genome from K ancestral populations. (CUL) Culimo, (PET) Petorca, (OCO) Ocoa, (VAV) Viña del Mar/Valparaíso, (COC) Cocalán, (CAN) Candelaria.
Plants 11 01959 g002
Figure 3. Characterization of Jubaea chilensis populations and sampling sites. (A) Location of the six sampled population groups in central Chile. (B,C) Jubaea chilensis habitat. (D,E) Hillside and valleys habitats where palm groves are distributed. The acronyms of the population groups are as follows: Culimo (CUL), Petorca (PET), Ocoa (OCO), Viña del Mar/Valparaíso (VAV), Cocalán (COC), and Candelaria (CAN).
Plants 11 01959 g003
Table 1. Genetic diversity of the six population groups of Jubaea chilensis in Central Chile. (Sample no) number of sampled individuals, (HO) mean observed heterozygosity, (HE) mean expected heterozygosity, (FIS) mean inbreeding coefficient; (CUL) Culimo, (PET) Petorca, (OCO) Ocoa, (VAV) Viña del Mar/Valparaíso, (COC) Cocalán, (CAN) Candelaria. Values inside square brackets represent the 95% confidence interval.
Populational GroupingSample NoHO
[95% CI]
HE
[95% CI]
FIS
[95% CI]
CUL260.036 [0.027–0.045]0.086 [0.086–0.087]0.586 [0.484–0.689]
PET190.108 [0.090–0.127]0.145 [0.144–0.145]0.251 [0.123–0.379]
OCO250.065 [0.058–0.073]0.101 [0.100–0.101]0.351 [0.276–0.425]
VAV240.107 [0.098–0.116]0.130 [0.130–0.131]0.177 [0.109–0.244]
COC240.061 [0.051–0.070]0.105 [0.104–0.106]0.420 [0.330–0.510]
CAN220.045 [0.039–0.051]0.107 [0.106–0.107]0.581 [0.528–0.633]
Overall1400.014 [0.012–0.015]0.024 [0.023–0.024]0.424 [0.374–0.475]
Table 2. Weir and Cockerham fixation index (FST) and genetic distance (Nei 1972) pairwise among six population groups of Jubaea chilensis in Central Chile. FST values are below the diagonal and genetic distance of Nei (1972) values are over the diagonal. (CUL) Culimo, (PET) Petorca, (OCO) Ocoa, (VAV) Viña del Mar/Valparaíso, (COC) Cocalán, (CAN) Candelaria. * p < 0.05.
CULPETOCOVAVCOCCAN
CUL 0.00180.00200.00210.00150.0017
PET0.078 * 0.00280.00300.00230.0025
OCO0.054 *0.080 * 0.00270.00240.0026
VAV0.072 *0.113 *0.065 * 0.00260.0027
COC0.063 *0.119 *0.074 *0.100 * 0.0019
CAN0.049 *0.078 *0.059 *0.078 *0.068 *
Table 3. Mean migration rates estimated by BayesAss 3.0.4 with 95% confidence intervals in square brackets. The values above are estimated values and the values below are the confidence interval. (CUL) Culimo, (PET) Petorca, (OCO) Ocoa, (VAV) Viña del Mar/Valparaíso, (COC) Cocalán, (CAN) Candelaria.
Receiver/SourceCULPETOCOVAVCOCCAN
CUL0.677
[0.657–0.696]
0.010
[−0.009;0.030]
0.010
[−0.009;0.031]
0.010
[−0.009;0.030]
0.280
[0.238;0.322]
0.010
[−0.009;0.030]
PET0.013
[−0.011;0.037]
0.680
[0.654–0.705]
0.013
[−0.012;0.038]
0.013
[−0.011;0.038]
0.266
[0.215;0.317]
0.013
[−0.011;0.038]
OCO0.010
[−0.009;0.031]
0.010
[−0.009;0.030]
0.688
[0.659–0.716]
0.268
[0.222;0.314]
0.010
[−0.009;0.029]
0.010
[−0.009;0.030]
VAV0.011
[−0.009;0.031]
0.011
[−0.009;0.032]
0.011
[−0.009;0.031]
0.932
[0.884–0.981]
0.022
[−0.008;0.053]
0.011
[−0.010;0.032]
COC0.011
[−0.010;0.032]
0.011
[−0.009;0.032]
0.011
[−0.010;0.032]
0.010
[−0.009;0.031]
0.944
[0.900–0.987]
0.011
[−0.010;0.032]
CAN0.011
[−0.010;0.034]
0.012
[−0.010;0.034]
0.011
[−0.010;0.034]
0.011
[−0.010;0.034]
0.237
[0.181;0.293]
0.714
[0.672–0.757]
Table 4. Geographical characterization of the six populations of Jubaea chilensis sampled. (XO) Xeric Oceanic Mediterranean climate. (PO) Oceanic Pluviseasonal climate. (Lat/Long) Latitude/longitude. The registered coordinates correspond to the average of the sampled population groups (sensu [26]).
Population GroupsCodeLat/Long
Coordinates
ClimateNo. SpecimensNo. Sampled Individuals
Culimo. Monte Aranda, Culimo, and El NaranjoCUL32°00′–71°11′XO20426
Petorca. Túnel de Las Palmas and Las Palmas de PedéguaPET32°09′–71°09′XO130019
Ocoa. Parque La Campana, Hacienda Las Palmas del Ocoa, Oasis La Campana and Vichiculén-Llay LlayOCO32°57′–71°04′PO70,30825
Viña del Mar/Valparaíso. Palmar Hacienda las Siete Hermanas and Subida Santos OssasVAV33°04′–71°31′PO720024
Cocalán. Hacienda Las Palmas de Cocalán and La PalmeríaCOC34°12′–71°08′PO35,50024
Candelaria. Palmar de CandelariaCAN34°51′–71°29′PO190022
Publisher’s Note: MDPI stays neutral with regard to jurisdictional claims in published maps and institutional affiliations.

