
Leaf Economic and Hydraulic Traits Signal Disparate Climate Adaptation Patterns in Two Co-Occurring Woodland Eucalypts

 , ,
, ,  , ,
, ,
Abstract
1. Introduction
- (a)
- the two species will share similar patterns of trait (co)variation and trait–climate relationships owing to their co-occurrence in a common climate landscape;
- (b)
- (c)
- trends in leaf economic and hydraulic traits will reflect expectations for adaptations to climate.
2. Results
2.1. Climate Landscape
2.2. Species Trait Differences
2.3. Population Variation
2.4. Correlations among Traits
2.5. Comparisons of Molecular and Quantitative Differentiation among Populations
2.6. Discriminant Analysis and Projections of Home-Site Climate Vectors
2.7. Univariate Climate-Trait Associations
3. Discussion
3.1. Potential Drivers of Disparate Patterns between Species
3.2. Associations between Climate and Trait Variation
3.3. Conclusions and Implications
4. Materials and Methods
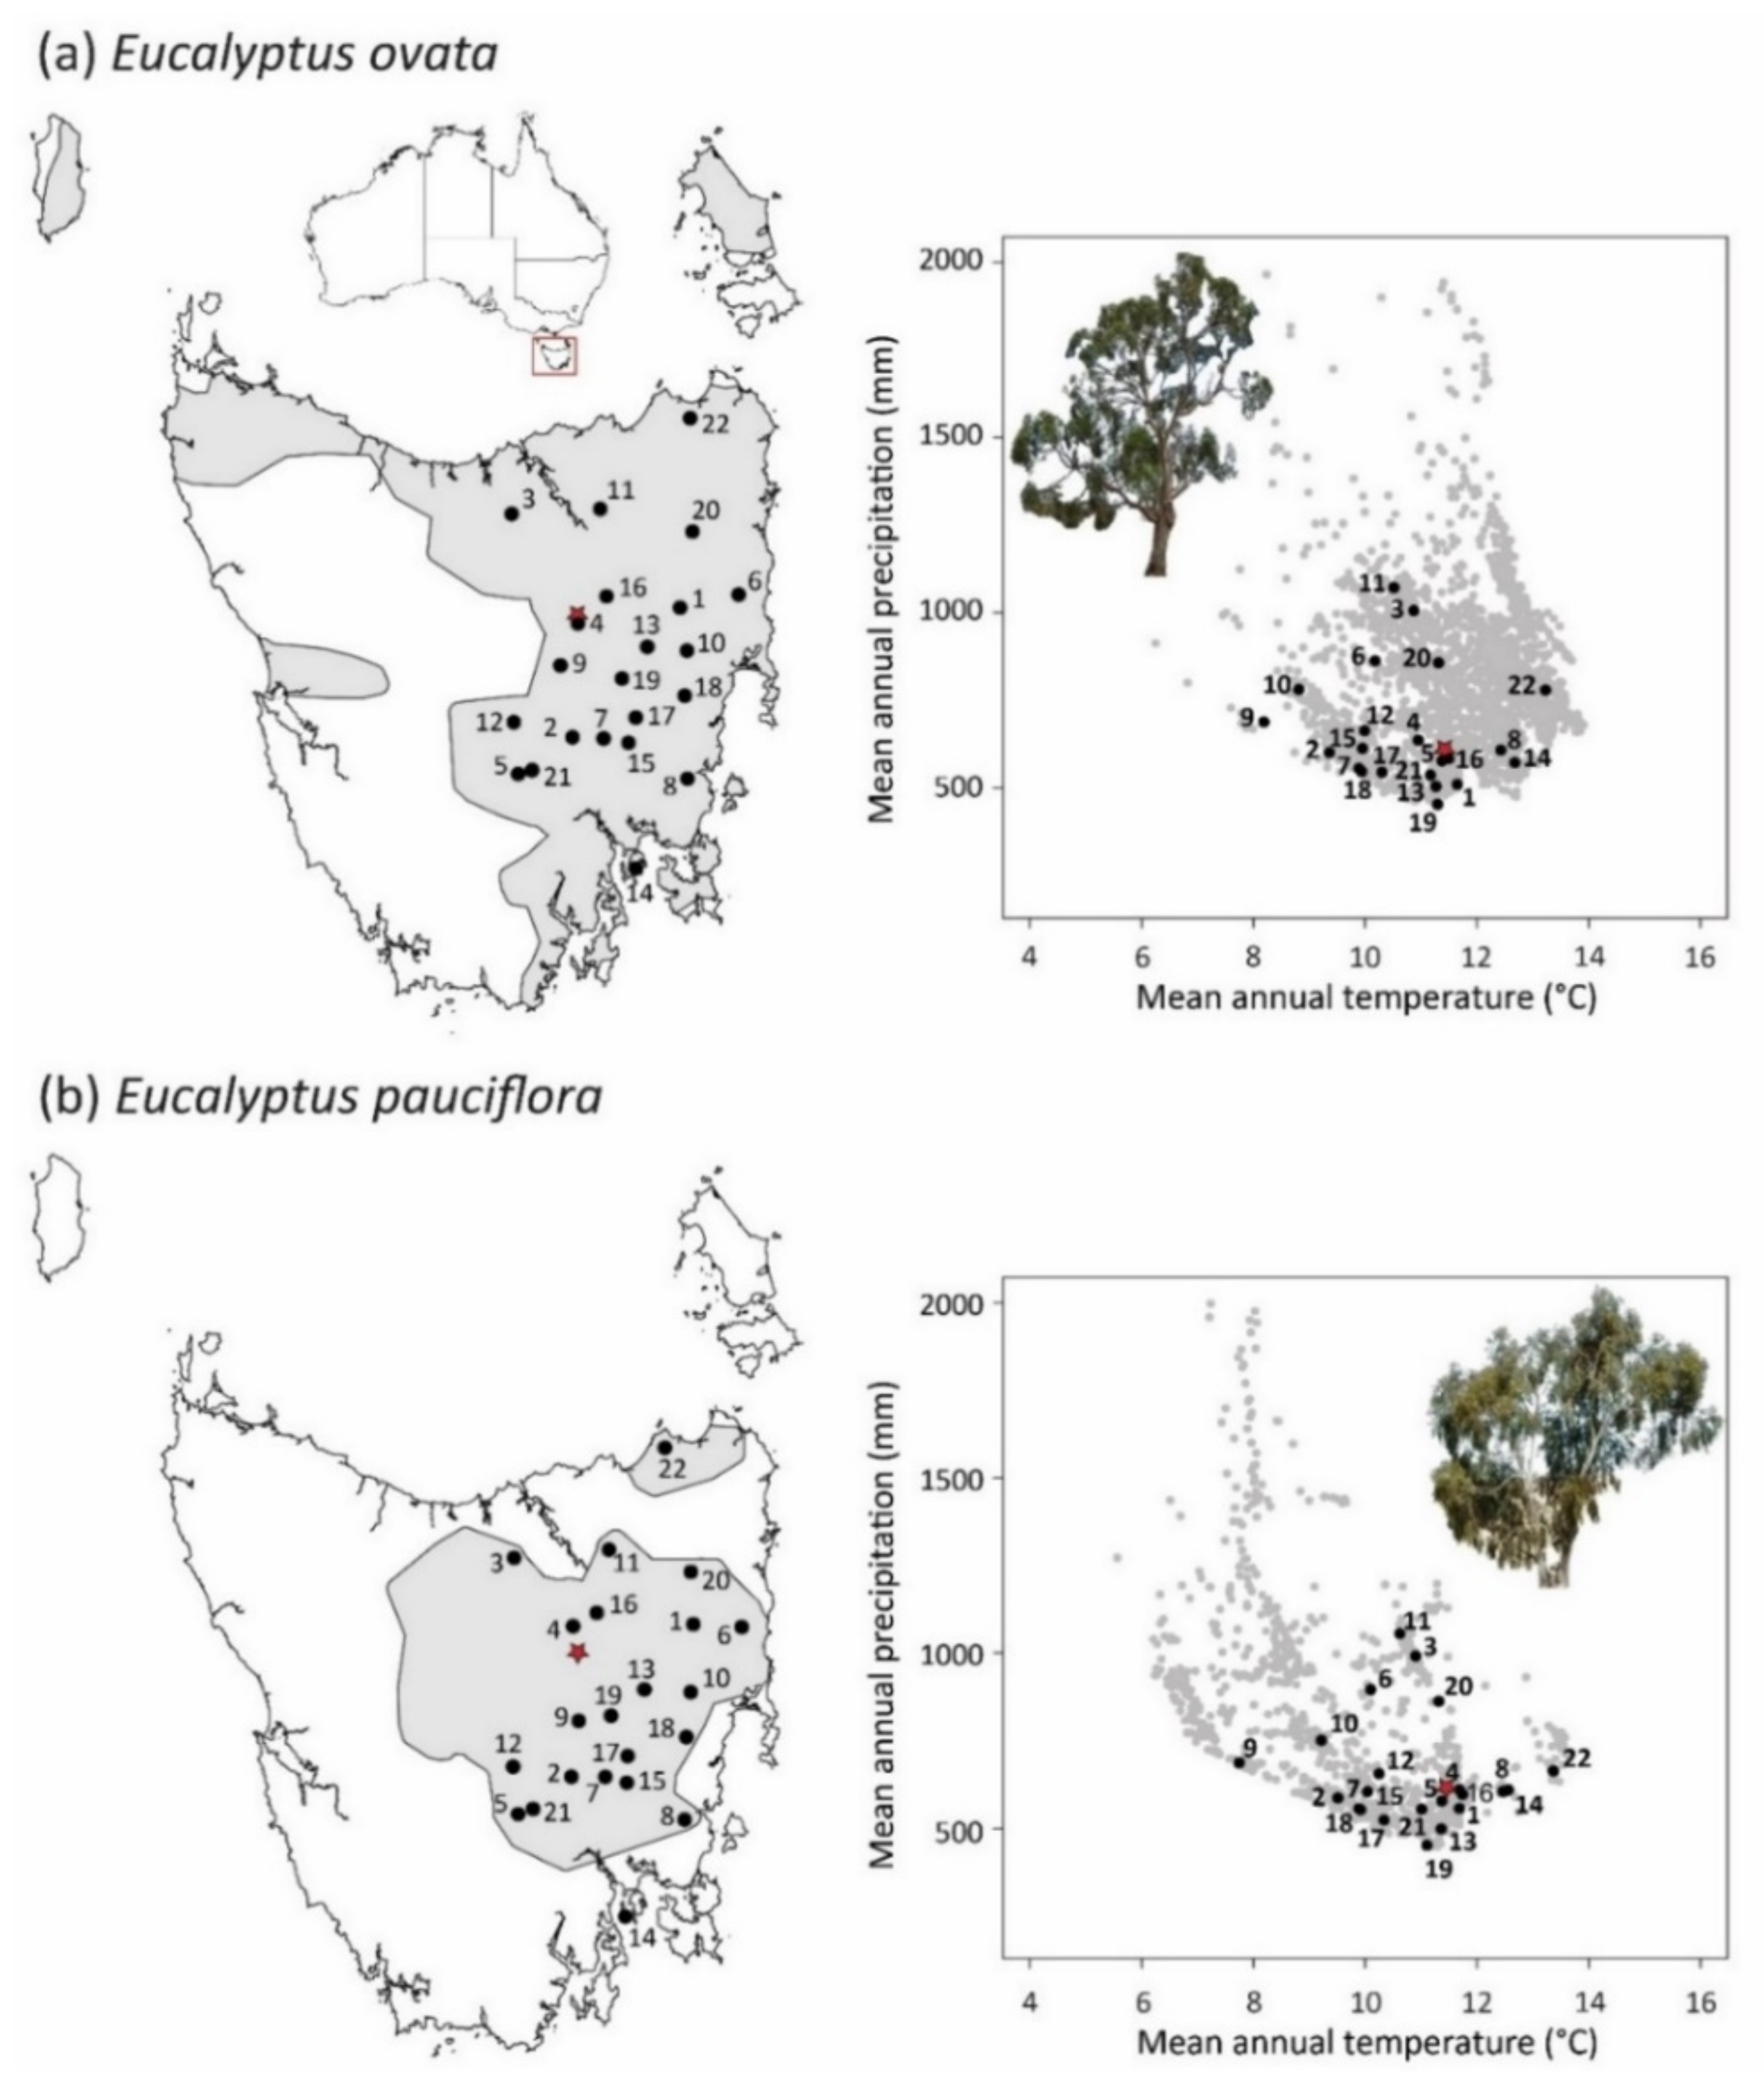
4.1. Study Species
4.2. Source Populations
4.3. Experimental Common Garden
4.4. Trait Measurements
4.4.1. Growth Performance Measures
4.4.2. Leaf Traits
4.5. Molecular Methods
4.6. Climate Data
4.7. Data Analysis
4.7.1. Species Differences and Within-Species Population Variance in Growth Performance and Leaf Traits
4.7.2. Correlation of Population Patterns between Species
4.7.3. Relationships between Traits and Climate
Supplementary Materials
Author Contributions
Funding
Institutional Review Board Statement
Informed Consent Statement
Data Availability Statement
Acknowledgments
Conflicts of Interest
References
- Aitken, S.N.; Yeaman, S.; Holliday, J.A.; Wang, T.; Curtis-McLane, S. Adaptation, migration or extirpation: Climate change outcomes for tree populations. Evol. Appl. 2008, 1, 95–111. [Google Scholar] [CrossRef] [PubMed]
- Anderson, J.T.; Song, B.-H. Plant adaptation to climate change—Where are we? J. Syst. Evol. 2020, 58, 533–545. [Google Scholar] [CrossRef] [PubMed]
- Prober, S.M.; Doerr, V.A.J.; Broadhurst, L.M.; Williams, K.J.; Dickson, F. Shifting the conservation paradigm: A synthesis of options for renovating nature under climate change. Ecol. Monogr. 2019, 89, e01333. [Google Scholar] [CrossRef]
- Aitken, S.N.; Bemmels, J.B. Time to get moving: Assisted gene flow of forest trees. Evol. Appl. 2016, 9, 271–290. [Google Scholar] [CrossRef]
- Alberto, F.J.; Aitken, S.N.; Alía, R.; González-Martínez, S.C.; Hänninen, H.; Kremer, A.; Lefèvre, F.; Lenormand, T.; Yeaman, S.; Whetten, R.; et al. Potential for evolutionary responses to climate change—Evidence from tree populations. Glob. Change Biol. 2013, 19, 1645–1661. [Google Scholar] [CrossRef]
- Franks, S.J.; Weber, J.J.; Aitken, S.N. Evolutionary and plastic responses to climate change in terrestrial plant populations. Evol. Appl. 2014, 7, 123–139. [Google Scholar] [CrossRef]
- Liepe, K.J.; Hamann, A.; Smets, P.; Fitzpatrick, C.R.; Aitken, S.N. Adaptation of lodgepole pine and interior spruce to climate: Implications for reforestation in a warming world. Evol. Appl. 2016, 9, 409–419. [Google Scholar] [CrossRef]
- Goudet, J.; Jombart, T. Hierfstat: Estimation and Tests of Hierarchical F-Statistics. 2015. Available online: http://github.com/jgx65/hierfstat (accessed on 10 December 2021).
- Hoffmann, A.A.; Miller, A.D.; Weeks, A.R. Genetic mixing for population management: From genetic rescue to provenancing. Evol. Appl. 2021, 14, 634–652. [Google Scholar] [CrossRef]
- Lopez, R.; Lopez de Heredia, U.; Collada, C.; Javier Cano, F.; Emerson, B.C.; Cochard, H.; Gil, L. Vulnerability to cavitation, hydraulic efficiency, growth and survival in an insular pine (Pinus canariensis). Ann. Bot. 2013, 111, 1167–1179. [Google Scholar] [CrossRef]
- Yeaman, S.; Hodgins, K.A.; Lotterhos, K.E.; Suren, H.; Nadeau, S.; Degner, J.C.; Nurkowski, K.A.; Smets, P.; Wang, T.; Gray, L.K. Convergent local adaptation to climate in distantly related conifers. Science 2016, 353, 1431–1433. [Google Scholar] [CrossRef]
- George, J.P.; Theroux-Rancourt, G.; Rungwattana, K.; Scheffknecht, S.; Momirovic, N.; Neuhauser, L.; Weißenbacher, L.; Watzinger, A.; Hietz, P. Assessing adaptive and plastic responses in growth and functional traits in a 10-year-old common garden experiment with pedunculate oak (Quercus robur L.) suggests that directional selection can drive climatic adaptation. Evol. Appl. 2020, 13, 2422–2438. [Google Scholar] [CrossRef]
- Endler, J.A. Natural Selection in the Wild; Princeton University Press: Princeton, NJ, USA, 1986; p. xiii. [Google Scholar]
- Schluter, D.; Clifford, E.A.; Nemethy, M.; McKinnon, J.S. Parallel evolution and inheritance of quantitative traits. Am. Nat. 2004, 163, 809–822. [Google Scholar] [CrossRef]
- Arendt, J.; Reznick, D. Convergence and parallelism reconsidered: What have we learned about the genetics of adaptation? Trends Ecol. Evol. 2008, 23, 26–32. [Google Scholar] [CrossRef]
- Bolnick, D.I.; Barrett, R.D.; Oke, K.B.; Rennison, D.J.; Stuart, Y.E. (Non) parallel evolution. Annu. Rev. Ecol. Evol. Syst. 2018, 49, 303–330. [Google Scholar] [CrossRef]
- Conte, G.L.; Arnegard, M.E.; Peichel, C.L.; Schluter, D. The probability of genetic parallelism and convergence in natural populations. Proc. R. Soc. B 2012, 279, 5039–5047. [Google Scholar] [CrossRef]
- Ólafsdóttir, G.Á.; Snorrason, S.S. Parallels, nonparallels, and plasticity in population differentiation of threespine stickleback within a lake. Biol. J. Linn. Soc. 2009, 98, 803–813. [Google Scholar] [CrossRef][Green Version]
- Kaeuffer, R.; Peichel, C.L.; Bolnick, D.I.; Hendry, A.P. Parallel and nonparallel aspects of ecological, phenotypic, and genetic divergence across replicate population pairs of lake and stream stickleback. Evolution 2012, 66, 402–418. [Google Scholar] [CrossRef]
- Torres-Ruiz, J.M.; Kremer, A.; Murphy, M.R.C.; Brodribb, T.; Lamarque, L.J.; Truffaut, L.; Bonne, F.; Ducousso, A.; Delzon, S. Genetic differentiation in functional traits among European sessile oak populations. Tree Physiol. 2019, 39, 1736–1749. [Google Scholar] [CrossRef]
- Armbruster, W.S.; Pélabon, C.; Bolstad Geir, H.; Hansen Thomas, F. Integrated phenotypes: Understanding trait covariation in plants and animals. Philos. Trans. R. Soc. B Biol. Sci. 2014, 369, 20130245. [Google Scholar] [CrossRef]
- Klingenberg, C.P. Studying morphological integration and modularity at multiple levels: Concepts and analysis. Philos. Trans. R. Soc. B Biol. Sci. 2014, 369, 20130249. [Google Scholar] [CrossRef]
- Costa e Silva, J.; Potts, B.; Harrison, P.A.; Bailey, T. Temperature and rainfall are separate agents of selection shaping population differentiation in a forest tree. Forests 2019, 10, 1145. [Google Scholar] [CrossRef]
- Langerhans, R.B. Predictability and parallelism of multitrait adaptation. J. Hered. 2018, 109, 59–70. [Google Scholar] [CrossRef]
- Endler, J.A. Multiple-trait coevolution and environmental gradients in guppies. Trends Ecol. Evol. 1995, 10, 22–29. [Google Scholar] [CrossRef]
- Blasini, D.E.; Koepke, D.F.; Grady, K.C.; Allan, G.J.; Gehring, C.A.; Whitham, T.G.; Cushman, S.A.; Hultine, K.R. Adaptive trait syndromes along multiple economic spectra define cold and warm adapted ecotypes in a widely distributed foundation tree species. J. Ecol. 2021, 109, 1298–1318. [Google Scholar] [CrossRef]
- Reich, P.B. The world-wide ’fast–slow’ plant economics spectrum: A traits manifesto. J. Ecol. 2014, 102, 275–301. [Google Scholar] [CrossRef]
- Agrawal, A.A.; Fishbein, M. Plant defense syndromes. Ecology 2006, 87, S132–S149. [Google Scholar] [CrossRef]
- Díaz, S.; Kattge, J.; Cornelissen, J.H.C.; Wright, I.J.; Lavorel, S.; Dray, S.; Reu, B.; Kleyer, M.; Wirth, C.; Prentice, I.C.; et al. The global spectrum of plant form and function. Nature 2016, 529, 167–171. [Google Scholar] [CrossRef]
- Butt, N.; Gallagher, R. Using species traits to guide conservation actions under climate change. Clim. Chang. 2018, 151, 317–332. [Google Scholar] [CrossRef]
- Wright, I.J.; Reich, P.B.; Westoby, M.; Ackerly, D.D.; Baruch, Z.; Bongers, F.; Cavender-Bares, J.; Chapin, T.; Cornelissen, J.H.C.; Diemer, M.; et al. The worldwide leaf economics spectrum. Nature 2004, 428, 821–827. [Google Scholar] [CrossRef]
- Ackerly, D.; Knight, C.; Weiss, S.; Barton, K.; Starmer, K. Leaf size, specific leaf area and microhabitat distribution of chaparral woody plants: Contrasting patterns in species level and community level analyses. Oecologia 2002, 130, 449–457. [Google Scholar] [CrossRef]
- Sack, L.; Scoffoni, C.; John, G.P.; Poorter, H.; Mason, C.M.; Mendez-Alonzo, R.; Donovan, L.A. How do leaf veins influence the worldwide leaf economic spectrum? Review and synthesis. J. Exp. Bot. 2013, 64, 4053–4080. [Google Scholar] [CrossRef] [PubMed]
- Brodribb, T.J.; Buckley, T.N. Leaf water transport: A core system in the evolution and physiology of photosynthesis. In The Leaf: A Platform for Performing Photosynthesis. Advances in Photosynthesis and Respiration (Including Bioenergy and Related Processes); Adams, I.W., Terashima, I., Eds.; Springer: Cham, Switzerland, 2018; Volume 44. [Google Scholar]
- Blackman, C.J.; Aspinwall, M.J.; Dios, V.R.d.; Smith, R.A.; Tissue, D.T. Leaf photosynthetic, economics and hydraulic traits are decoupled among genotypes of a widespread species of eucalypt grown under ambient and elevated CO2. Funct. Ecol. 2016, 30, 1491–1500. [Google Scholar] [CrossRef]
- Ramírez-Valiente, J.A.; Cavender-Bares, J. Evolutionary trade-offs between drought resistance mechanisms across a precipitation gradient in a seasonally dry tropical oak (Quercus oleoides). Tree Physiol. 2017, 37, 889–901. [Google Scholar] [CrossRef] [PubMed]
- Choat, B.; Brodribb, T.J.; Brodersen, C.R.; Duursma, R.A.; López, R.; Medlyn, B.E. Triggers of tree mortality under drought. Nature 2018, 558, 531–539. [Google Scholar] [CrossRef]
- Agrawal, A.A. A scale-dependent framework for trade-offs, syndromes, and specialization in organismal biology. Ecology 2020, 101, e02924. [Google Scholar] [CrossRef]
- Jordan, G.J.; Brodribb, T.J.; Blackman, C.J.; Weston, P.H. Climate drives vein anatomy in Proteaceae. Am. J. Bot. 2013, 100, 1483–1493. [Google Scholar] [CrossRef]
- Anderegg, L.D.; Berner, L.T.; Badgley, G.; Sethi, M.L.; Law, B.E.; HilleRisLambers, J. Within-species patterns challenge our understanding of the leaf economics spectrum. Ecol. Lett. 2018, 21, 734–744. [Google Scholar] [CrossRef]
- Anderegg, L.D.L.; Loy, X.; Markham, I.P.; Elmer, C.M.; Hovenden, M.J.; HilleRisLambers, J.; Mayfield, M.M. Aridity drives coordinated trait shifts but not decreased trait variance across the geographic range of eight Australian trees. New Phytol. 2021, 229, 1375–1387. [Google Scholar] [CrossRef]
- Ahrens, C.W.; Rymer, P.D.; Tissue, D.T. Intra-specific trait variation remains hidden in the environment. New Phytol. 2021, 229, 1183–1185. [Google Scholar] [CrossRef]
- Ahrens, C.W.; Andrew, M.E.; Mazanec, R.A.; Ruthrof, K.X.; Challis, A.; Hardy, G.; Byrne, M.; Tissue, D.T.; Rymer, P.D. Plant functional traits differ in adaptability and are predicted to be differentially affected by climate change. Ecol. Evol. 2020, 10, 232–248. [Google Scholar] [CrossRef]
- Arntz, M.A.; Delph, L.F. Pattern and process: Evidence for the evolution of photosynthetic traits in natural populations. Oecologia 2001, 127, 455–467. [Google Scholar] [CrossRef]
- Gauli, A.; Steane, D.A.; Vaillancourt, R.E.; Potts, B.M. Molecular genetic diversity and population structure in Eucalyptus pauciflora subsp pauciflora (Myrtaceae) on the island of Tasmania. Aust. J. Bot. 2014, 62, 175–188. [Google Scholar] [CrossRef]
- Oksanen, J.; Simpson, G.L.; Blanchet, F.G.; Kindt, R.; Legendre, P.; Minchin, P.R.; O’Hara, R.B.; Solymos, P.; Stevens, M.H.H.; Szoecs, E.; et al. Vegan: Community Ecology Package. R package Version 2.6. 2022. Available online: https://CRAN.R-project.org/package=vegan (accessed on 29 March 2022).
- Uhl, D.; Mosbrugger, V. Leaf venation density as a climate and environmental proxy: A critical review and new data. Palaeogeogr. Palaeoclimatol. Palaeoecol. 1999, 149, 15–26. [Google Scholar] [CrossRef]
- Jordan, G.J.; Carpenter, R.J.; Koutoulis, A.; Price, A.; Brodribb, T.J. Environmental adaptation in stomatal size independent of the effects of genome size. New Phytol. 2015, 205, 608–617. [Google Scholar] [CrossRef]
- Stojnić, S.; Orlović, S.; Miljković, D.; Galić, Z.; Kebert, M.; von Wuehlisch, G. Provenance plasticity of European beech leaf traits under differing environmental conditions at two Serbian common garden sites. Eur. J. For. Res. 2015, 134, 1109–1125. [Google Scholar] [CrossRef]
- Barber, H.N. Adaptive gene substitutions in Tasmanian eucalypts: I. genes controlling the development of glaucousness. Evolution 1955, 9, 1–15. [Google Scholar] [CrossRef]
- Warren, C.R.; Dreyer, E.; Tausz, M.; Adams, M.A. Ecotype adaptation and acclimation of leaf traits to rainfall in 29 species of 16-year-old Eucalyptus at two common gardens. Funct. Ecol. 2006, 20, 929–940. [Google Scholar] [CrossRef]
- Vitasse, Y.; Delzon, S.; Bresson, C.C.; Michalet, R.; Kremer, A. Altitudinal differentiation in growth and phenology among populations of temperate-zone tree species growing in a common garden. Can. J. For. Res. 2009, 39, 1259–1269. [Google Scholar] [CrossRef]
- Bresson, C.C.; Vitasse, Y.; Kremer, A.; Delzon, S. To what extent is altitudinal variation of functional traits driven by genetic adaptation in European oak and beech? Tree Physiol. 2011, 31, 1164–1174. [Google Scholar] [CrossRef]
- Salk, C. Interpreting common garden studies to understand cueing mechanisms of spring leafing phenology in temperate and boreal tree species. Silva Fenn. 2020, 54, 10381. [Google Scholar] [CrossRef]
- Pfennigwerth, A.A.; Bailey, J.K.; Schweitzer, J.A. Trait variation along elevation gradients in a dominant woody shrub is population-specific and driven by plasticity. AoB Plants 2017, 9, plx027. [Google Scholar] [CrossRef]
- Warren, C.R.; Aranda, I.; Cano, F.J. Metabolomics demonstrates divergent responses of two Eucalyptus species to water stress. Metabolomics 2012, 8, 186–200. [Google Scholar] [CrossRef]
- Cano, F.J.; López, R.; Warren, C.R. Implications of the mesophyll conductance to CO2 for photosynthesis and water-use efficiency during long-term water stress and recovery in two contrasting Eucalyptus species. Plant Cell Environ. 2014, 37, 2470–2490. [Google Scholar] [CrossRef]
- López, R.; Cano, F.J.; Martin-StPaul, N.K.; Cochard, H.; Choat, B. Coordination of stem and leaf traits define different strategies to regulate water loss and tolerance ranges to aridity. New Phytol. 2021, 230, 497–509. [Google Scholar] [CrossRef]
- McKinnon, G.E.; Jordan, G.J.; Vaillancourt, R.E.; Steane, D.A.; Potts, B.M. Glacial refugia and reticulate evolution: The case of the Tasmanian eucalypts. Philos. Trans. R. Soc. Lond. Ser. B Biol. Sci. 2004, 359, 275–284. [Google Scholar] [CrossRef]
- Leinonen, T.; McCairns, R.J.S.; O’Hara, R.B.; Merilä, J. QST–FST comparisons: Evolutionary and ecological insights from genomic heterogeneity. Nat. Rev. Genet 2013, 14, 179–190. [Google Scholar] [CrossRef]
- Broadhurst, L.; Breed, M.; Lowe, A.; Bragg, J.; Catullo, R.; Coates, D.; Encinas-Viso, F.; Gellie, N.; James, E.; Krauss, S.; et al. Genetic diversity and structure of the Australian flora. Divers. Distrib. 2017, 23, 41–52. [Google Scholar] [CrossRef]
- Filipe, J.C.; Rymer, P.D.; Byrne, M.; Hardy, G.; Mazanec, R.; Ahrens, C.W. Signatures of natural selection in a foundation tree along Mediterranean climatic gradients. Mol. Ecol. 2022, 31, 1735–1752. [Google Scholar] [CrossRef]
- Butler, J.; Freeman, J.; Potts, B.; Vaillancourt, R.; Kahrood, H.; Ades, P.; Rigault, P.; Tibbits, J. Patterns of genomic diversity and linkage disequilibrium across the disjunct range of the Australian forest tree Eucalyptus globulus. Tree Genet. Genom. 2022, 18, 28. [Google Scholar] [CrossRef]
- Leinonen, T.; Cano, J.M.; Mäkinen, H.; Merilä, J. Contrasting patterns of body shape and neutral genetic divergence in marine and lake populations of threespine sticklebacks. J. Evol. Biol. 2006, 19, 1803–1812. [Google Scholar] [CrossRef] [PubMed]
- Ramírez-Valiente, J.A.; Deacon, N.J.; Etterson, J.; Center, A.; Sparks, J.P.; Sparks, K.L.; Longwell, T.; Pilz, G.; Cavender-Bares, J. Natural selection and neutral evolutionary processes contribute to genetic divergence in leaf traits across a precipitation gradient in the tropical oak Quercus oleoides. Mol. Ecol. 2018, 27, 2176–2192. [Google Scholar] [CrossRef] [PubMed]
- Hangartner, S.; Laurila, A.; Räsänen, K. Adaptive divergence in moor frog (Rana arvalis) populations along an acidification gradient: Inferences from Qst–Fst correlations. Evolution 2012, 66, 867–881. [Google Scholar] [CrossRef] [PubMed]
- Reich, P.B.; Wright, I.J.; Cavender-Bares, J.; Craine, J.M.; Oleksyn, J.; Westoby, M.; Walters, M.B. The evolution of plant functional variation: Traits, spectra, and strategies. Int. J. Plant Sci. 2003, 164, S143–S164. [Google Scholar] [CrossRef]
- Schluter, D. Adaptive radiation along genetic lines of least resistance. Evolution 1996, 50, 1766–1774. [Google Scholar] [CrossRef] [PubMed]
- Chenoweth, S.F.; Rundle, H.D.; Blows, M.W. The contribution of selection and genetic constraints to phenotypic divergence. Am. Nat. 2010, 175, 186–196. [Google Scholar] [CrossRef]
- Costa e Silva, J.; Potts, B.M.; Harrison, P.A. Population divergence along a genetic line of least resistance in the tree species Eucalyptus globulus. Genes 2020, 11, 1095. [Google Scholar] [CrossRef]
- Arnold, S.J.; Bürger, R.; Hohenlohe, P.A.; Ajie, B.C.; Jones, A.G. Understanding the evolution and stability of the G-matrix. Evolution 2008, 62, 2451–2461. [Google Scholar] [CrossRef]
- McGlothlin, J.W.; Kobiela, M.E.; Wright, H.V.; Mahler, D.L.; Kolbe, J.J.; Losos, J.B.; Brodie, E.D., III. Adaptive radiation along a deeply conserved genetic line of least resistance in Anolis lizards. Evol. Lett. 2018, 2, 310–322. [Google Scholar] [CrossRef]
- Walter, G.M.; Aguirre, J.D.; Blows, M.W.; Ortiz-Barrientos, D. Evolution of genetic variance during adaptive radiation. Am. Nat. 2018, 191, E108–E128. [Google Scholar] [CrossRef]
- Costa e Silva, J.; Jordan, R.; Potts, B.M.; Pinkard, E.; Prober, S.M. Directional selection on tree seedling traits driven by experimental drought differs between mesic and dry populations. Front. Ecol. Evol. 2021, 9, 722964. [Google Scholar] [CrossRef]
- Alexandre, H.; Truffaut, L.; Klein, E.; Ducousso, A.; Chancerel, E.; Lesur, I.; Dencausse, B.; Louvet, J.-M.; Nepveu, G.; Torres-Ruiz, J.M.; et al. How does contemporary selection shape oak phenotypes? Evol. Appl. 2020, 13, 2772–2790. [Google Scholar] [CrossRef]
- Hendry, A.P. Key questions on the role of phenotypic plasticity in eco-evolutionary dynamics. J. Hered. 2016, 107, 25–41. [Google Scholar] [CrossRef]
- Li, C.Y.; Berninger, F.; Koskela, J.; Sonninen, E. Drought responses of Eucalyptus microtheca provenances depend on seasonality of rainfall in their place of origin. Aust. J. Plant Physiol. 2000, 27, 231–238. [Google Scholar] [CrossRef]
- Li, C.Y.; Wang, K.Y. Differences in drought responses of three contrasting Eucalyptus microtheca F. Muell. populations. For. Ecol. Manag. 2003, 179, 377–385. [Google Scholar] [CrossRef]
- McLean, E.H.; Prober, S.M.; Stock, W.D.; Steane, D.A.; Potts, B.M.; Vaillancourt, R.E.; Byrne, M. Plasticity of functional traits varies clinally along a rainfall gradient in Eucalyptus tricarpa. Plant Cell Environ. 2014, 37, 1440–1451. [Google Scholar] [CrossRef]
- Lopez, R.; Cano, F.J.; Choat, B.; Cochard, H.; Gil, L. Plasticity in vulnerability to cavitation of Pinus canariensis occurs only at the driest end of an aridity gradient. Front. Plant Sci. 2016, 7, 769. [Google Scholar] [CrossRef]
- Asao, S.; Hayes, L.; Aspinwall, M.J.; Rymer, P.D.; Blackman, C.; Bryant, C.J.; Cullerne, D.; Egerton, J.J.G.; Fan, Y.; Innes, P.; et al. Leaf trait variation is similar among genotypes of Eucalyptus camaldulensis from differing climates and arises in plastic responses to the seasons rather than water availability. New Phytol. 2020, 227, 780–793. [Google Scholar] [CrossRef]
- Mencuccini, M.; Minunno, F.; Salmon, Y.; Martínez-Vilalta, J.; Hölttä, T. Coordination of physiological traits involved in drought-induced mortality of woody plants. New Phytol. 2015, 208, 396–409. [Google Scholar] [CrossRef]
- Anderegg, L.D.L.; HilleRisLambers, J. Drought stress limits the geographic ranges of two tree species via different physiological mechanisms. Glob. Change Biol. 2016, 22, 1029–1045. [Google Scholar] [CrossRef]
- Jacobs, M.R. Growth Habits of the Eucalypts; Commonwealth of Australia Forestry and Timber Bureau: Canberra, Australia, 1955. [Google Scholar]
- Collins, L. Eucalypt forests dominated by epicormic resprouters are resilient to repeated canopy fires. J. Ecol. 2020, 108, 310–324. [Google Scholar] [CrossRef]
- Gauli, A.; Vaillancourt, R.E.; Bailey, T.G.; Steane, D.A.; Potts, B.M. Evidence for local climate adaptation in early-life traits of Tasmanian populations of Eucalyptus pauciflora. Tree Genet. Genom. 2015, 11, 104. [Google Scholar] [CrossRef]
- Harrison, P. Integrating Climate Change into Conservation and Restoration Strategies: The Case of the Tasmanian Eucalypts. Ph.D. Thesis, University of Tasmania, Hobart, Australia, 2017. Available online: https://eprints.utas.edu.au/27322/ (accessed on 14 April 2022).
- Castro-Diez, P.; Villar-Salvador, P.; Perez-Rontome, C.; Maestro-Martinez, M.; Montserrat-Marti, G. Leaf morphology, leaf chemical composition and stem xylem characteristics in two Pistacia (Anacardiaceae) species along a climatic gradient. Flora 1998, 193, 195–202. [Google Scholar] [CrossRef]
- Trugman, A.T.; Anderegg, L.D.L.; Anderegg, W.R.L.; Das, A.J.; Stephenson, N.L. Why is tree drought mortality so hard to predict? Trends Ecol. Evol. 2021, 36, 520–532. [Google Scholar] [CrossRef] [PubMed]
- Harper, R.J.; Smettem, K.R.J.; Carter, J.O.; McGrath, J.F. Drought deaths in Eucalyptus globulus (Labill.) plantations in relation to soils, geomorphology and climate. Plant Soil 2009, 324, 199–207. [Google Scholar] [CrossRef]
- Cochrane, P.; Slatyer, R. Water relations of Eucalyptus pauciflora near the alpine tree line in winter. Tree Physiol. 1988, 4, 45–52. [Google Scholar] [CrossRef] [PubMed]
- Maire, V.; Wright, I.J.; Prentice, I.C.; Batjes, N.H.; Bhaskar, R.; van Bodegom, P.M.; Cornwell, W.K.; Ellsworth, D.; Niinemets, Ü.; Ordonez, A.; et al. Global effects of soil and climate on leaf photosynthetic traits and rates. Glob. Ecol. Biogeogr. 2015, 24, 706–717. [Google Scholar] [CrossRef]
- Steckel, M.; del Río, M.; Heym, M.; Aldea, J.; Bielak, K.; Brazaitis, G.; Černý, J.; Coll, L.; Collet, C.; Ehbrecht, M.; et al. Species mixing reduces drought susceptibility of Scots pine (Pinus sylvestris L.) and oak (Quercus robur L., Quercus petraea (Matt.) Liebl.)—Site water supply and fertility modify the mixing effect. For. Ecol. Manag. 2020, 461, 117908. [Google Scholar] [CrossRef]
- Teshome, D.T.; Zharare, G.E.; Naidoo, S. The threat of the combined effect of biotic and abiotic stress factors in forestry under a changing climate. Front. Plant Sci. 2020, 11, 601009. [Google Scholar] [CrossRef]
- Britton, T.G.; Brodribb, T.J.; Richards, S.A.; Ridley, C.; Hovenden, M.J. Canopy damage during a natural drought depends on species identity, physiology and stand composition. New Phytol. 2022, 233, 2058–2070. [Google Scholar] [CrossRef]
- Petrík, P.; Petek, A.; Konôpková, A.; Bosela, M.; Fleischer, P.; Frýdl, J.; Kurjak, D. Stomatal and leaf morphology response of European Beech (Fagus sylvatica L.) provenances transferred to contrasting climatic conditions. Forests 2020, 11, 1359. [Google Scholar] [CrossRef]
- Marek, S.; Tomaszewski, D.; Żytkowiak, R.; Jasińska, A.; Zadworny, M.; Boratyńska, K.; Dering, M.; Danusevičius, D.; Oleksyn, J.; Wyka, T.P. Stomatal density in Pinus sylvestris as an indicator of temperature rather than CO2: Evidence from a pan-European transect. Plant Cell Environ. 2022, 45, 121–132. [Google Scholar] [CrossRef]
- Warren, C.R.; Tausz, M.; Adams, M.A. Does rainfall explain variation in leaf morphology and physiology among populations of red ironbark (Eucalyptus sideroxylon subsp. tricarpa) grown in a common garden? Tree Physiol. 2005, 25, 1369–1378. [Google Scholar] [CrossRef]
- Blackman, C.J.; Aspinwall, M.J.; Tissue, D.T.; Rymer, P.D. Genetic adaptation and phenotypic plasticity contribute to greater leaf hydraulic tolerance in response to drought in warmer climates. Tree Physiol 2017, 37, 583–592. [Google Scholar] [CrossRef]
- Hetherington, A.M.; Woodward, F.I. The role of stomata in sensing and driving environmental change. Nature 2003, 424, 901–908. [Google Scholar] [CrossRef]
- Brodribb, T.J.; Feild, T.S.; Jordan, G.J. Leaf maximum photosynthetic rate and venation are linked by hydraulics. Plant Physiol. 2007, 144, 1890–1898. [Google Scholar] [CrossRef]
- De Boer, H.J.; Drake, P.L.; Wendt, E.; Price, C.A.; Schulze, E.-D.; Turner, N.C.; Nicolle, D.; Veneklaas, E.J. Apparent overinvestment in leaf venation relaxes leaf morphological constraints on photosynthesis in arid habitats. Plant Physiol. 2016, 172, 2286–2299. [Google Scholar] [CrossRef]
- Carlson, J.E.; Adams, C.A.; Holsinger, K.E. Intraspecific variation in stomatal traits, leaf traits and physiology reflects adaptation along aridity gradients in a South African shrub. Ann. Bot. 2016, 117, 195–207. [Google Scholar] [CrossRef]
- Brodribb, T.J.; McAdam, S.A.; Carins Murphy, M.R. Xylem and stomata, coordinated through time and space. Plant Cell Environ. 2017, 40, 872–880. [Google Scholar] [CrossRef]
- Liu, C.; Muir, C.D.; Li, Y.; Xu, L.; Li, M.; Zhang, J.; de Boer, H.J.; Sack, L.; Han, X.; Yu, G.; et al. Scaling between stomatal size and density in forest plants. bioRxiv 2021, 2021.04.25.441252. [Google Scholar] [CrossRef]
- Blasini, D.E.; Koepke, D.F.; Bush, S.E.; Allan, G.J.; Gehring, C.A.; Whitham, T.G.; Day, T.A.; Hultine, K.R. Tradeoffs between leaf cooling and hydraulic safety in a dominant arid land riparian tree species. Plant Cell Environ. 2022, 45, 1664–1681. [Google Scholar] [CrossRef]
- Harrison, P.A. Climate change and the suitability of local and non-local species for ecosystem restoration. Ecol. Manag. Restor. 2021, 22, 75–91. [Google Scholar] [CrossRef]
- Marchin, R.M.; Backes, D.; Ossola, A.; Leishman, M.R.; Tjoelker, M.G.; Ellsworth, D.S. Extreme heat increases stomatal conductance and drought-induced mortality risk in vulnerable plant species. Glob. Change Biol. 2022, 28, 1133–1146. [Google Scholar] [CrossRef] [PubMed]
- Ramírez-Valiente, J.A.; Center, A.; Sparks, J.P.; Sparks, K.L.; Etterson, J.R.; Longwell, T.; Pilz, G.; Cavender-Bares, J. Population-level differentiation in growth rates and leaf traits in seedlings of the neotropical live oak Quercus oleoides grown under natural and manipulated precipitation regimes. Front. Plant Sci. 2017, 8, 585. [Google Scholar] [CrossRef] [PubMed]
- Niinemets, Ü. Global-scale climatic controls of leaf dry mass per area, density, and thickness in trees and shrubs. Ecology 2001, 82, 453–469. [Google Scholar] [CrossRef]
- Wright, I.J.; Reich, P.B.; Cornelissen, J.H.C.; Falster, D.S.; Groom, P.K.; Hikosaka, K.; Lee, W.; Lusk, C.H.; Niinemets, Ü.; Oleksyn, J.; et al. Modulation of leaf economic traits and trait relationships by climate. Glob. Ecol. Biogeogr. 2005, 14, 411–421. [Google Scholar] [CrossRef]
- Ramírez-Valiente, J.A.; Valladares, F.; Sanchéz-Goméz, D.; Delgado, A.; Aranda, I. Population variation and natural selection on leaf traits in cork oak throughout its distribution range. Acta Oecol. 2014, 58, 49–56. [Google Scholar] [CrossRef]
- Ramírez-Valiente, J.A.; Valladares, F.; Huertas, A.D.; Granados, S.; Aranda, I. Factors affecting cork oak growth under dry conditions: Local adaptation and contrasting additive genetic variance within populations. Tree Genet. Genom. 2011, 7, 285–295. [Google Scholar] [CrossRef]
- Jordan, R.; Prober, S.M.; Hoffmann, A.A.; Dillon, S.K. Combined aalyses of phenotype, genotype and climate implicate local adaptation as a driver of diversity in Eucalyptus microcarpa (Grey Box). Forests 2020, 11, 495. [Google Scholar] [CrossRef]
- Martorell, S.; Diaz-Espejo, A.; Medrano, H.; Ball, M.C.; Choat, B. Rapid hydraulic recovery in Eucalyptus pauciflora after drought: Linkages between stem hydraulics and leaf gas exchange. Plant Cell Environ. 2014, 37, 617–626. [Google Scholar] [CrossRef]
- Ball, M.C.; Wolfe, J.; Canny, M.; Hofmann, M.; Nicotra, A.B.; Hughes, D. Space and time dependence of temperature and freezing in evergreen leaves. Funct. Plant Biol. 2002, 29, 1259–1272. [Google Scholar] [CrossRef]
- Onoda, Y.; Wright, I.J.; Evans, J.R.; Hikosaka, K.; Kitajima, K.; Niinemets, Ü.; Poorter, H.; Tosens, T.; Westoby, M. Physiological and structural tradeoffs underlying the leaf economics spectrum. New Phytol. 2017, 214, 1447–1463. [Google Scholar] [CrossRef] [PubMed]
- Prober, S.M.; Potts, B.M.; Bailey, T.; Byrne, M.; Dillon, S.; Harrison, P.A.; Hoffmann, A.A.; Jordan, R.; Mclean, E.H.; Steane, D.A.; et al. Climate adaptation and ecological restoration in eucalypts. Proc. R. Soc. Vic. 2016, 128, 40–53. [Google Scholar] [CrossRef]
- Kremer, A.; Potts, B.M.; Delzon, S. Genetic divergence in forest trees: Understanding the consequences of climate change. Funct. Ecol. 2014, 28, 22–36. [Google Scholar] [CrossRef]
- Costa e Silva, J.; Harrison, P.A.; Wiltshire, R.; Potts, B.M. Evidence that divergent selection shapes a developmental cline in a forest tree species complex. Ann. Bot. 2018, 122, 181–194. [Google Scholar] [CrossRef]
- Prober, S.M.; Byrne, M.; McLean, E.H.; Steane, D.A.; Potts, B.M.; Vaillancourt, R.E.; Stock, W.D. Climate-adjusted provenancing: A strategy for climate-resilient ecological restoration. Front. Ecol. Evol. 2015, 3, 65. [Google Scholar] [CrossRef]
- Harrison, P.A.; Vaillancourt, R.E.; Harris, R.M.B.; Potts, B.M. Integrating climate change and habitat fragmentation to identify candidate seed sources for ecological restoration. Restor. Ecol. 2017, 25, 524–531. [Google Scholar] [CrossRef]
- Bailey, T.G.; Harrison, P.A.; Davidson, N.J.; Weller-Wong, A.; Tilyard, P.; Steane, D.A.; Vaillancourt, R.E.; Potts, B.M. Embedding genetics experiments in restoration to guide plant choice for a degraded landscape with a changing climate. Ecol. Manag. Restor. 2021, 22, 92–105. [Google Scholar] [CrossRef]
- Larcombe, M.J.; Holland, B.; Steane, D.A.; Jones, R.C.; Nicolle, D.; Vaillancourt, R.E.; Potts, B.M. Patterns of reproductive isolation in Eucalyptus—A phylogenetic perspective. Mol. Biol. Evol. 2015, 32, 1833–1846. [Google Scholar] [CrossRef]
- Williams, K.J.; Potts, B.M. The natural distribution of Eucalyptus species in Tasmania. Tasforests 1996, 8, 39–165. [Google Scholar]
- Gauli, A.; Vaillancourt, R.E.; Steane, D.A.; Bailey, T.G.; Potts, B.M. Effect of forest fragmentation and altitude on the mating system of Eucalyptus pauciflora (Myrtaceae). Aust. J. Bot. 2013, 61, 622–632. [Google Scholar] [CrossRef]
- Aranda, I.; Cano, F.J.; Gascó, A.; Cochard, H.; Nardini, A.; Mancha, J.A.; López, R.; Sánchez-Gómez, D. Variation in photosynthetic performance and hydraulic architecture across European beech (Fagus sylvatica L.) populations supports the case for local adaptation to water stress. Tree Physiol. 2015, 35, 34–46. [Google Scholar] [CrossRef]
- Davidson, N.J.; Potts, B.M.; Burgess, S.; Bailey, T.G. Dry biomass and carbon sequestration in environmental plantings in the Midlands of Tasmania. Ecol. Manag. Restor. 2021, 22, 61–64. [Google Scholar] [CrossRef]
- Cornelissen, J.H.C.; Cerabolini, B.; Castro-Díez, P.; Villar-Salvador, P.; Montserrat-Martí, G.; Puyravaud, J.P.; Maestro, M.; Werger, M.J.A.; Aerts, R. Functional traits of woody plants: Correspondence of species rankings between field adults and laboratory-grown seedlings? J. Veg. Sci. 2003, 14, 311–322. [Google Scholar] [CrossRef]
- Franks, P.J.; Drake, P.L.; Beerling, D.J. Plasticity in maximum stomatal conductance constrained by negative correlation between stomatal size and density: An analysis using Eucalyptus globulus. Plant Cell Environ. 2009, 32, 1737–1748. [Google Scholar] [CrossRef]
- Brodribb, T.J.; Jordan, G.J.; Carpenter, R.J. Unified changes in cell size permit coordinated leaf evolution. New Phytol. 2013, 199, 559–570. [Google Scholar] [CrossRef]
- Doyle, J.J.; Doyle, J.L. Isolation of plant DNA from fresh tissue. Focus 1990, 12, 13–15. [Google Scholar]
- McKinnon, G.E.; Vaillancourt, R.E.; Steane, D.A.; Potts, B.M. The rare silver gum, Eucalyptus cordata, is leaving its trace in the organellar gene pool of Eucalyptus globulus. Mol. Ecol. 2004, 13, 3751–3762. [Google Scholar] [CrossRef]
- Sansaloni, C.; Petroli, C.; Jaccoud, D.; Carling, J.; Detering, F.; Grattapaglia, D.; Kilian, A. Diversity Arrays Technology (DArT) and next-generation sequencing combined: Genome-wide, high throughput, highly informative genotyping for molecular breeding of Eucalyptus. BMC Proc. 2011, 5 (Suppl. S7), 54. [Google Scholar] [CrossRef]
- Ahrens, C.W.; Jordan, R.; Bragg, J.; Harrison, P.A.; Hopley, T.; Bothwell, H.; Murray, K.; Steane, D.A.; Whale, J.W.; Byrne, M. Regarding the F-word: The effects of data filtering on inferred genotype-environment associations. Mol. Ecol. Resour. 2021, 21, 1460–1474. [Google Scholar] [CrossRef]
- Weir, B.S.; Cockerham, C.C. Estimating F-statistics for the analysis of population structure. Evolution 1984, 38, 1358–1370. [Google Scholar]
- Xu, T.; Hutchinson, M. ANUCLIM Version 6.1 User Guide; Centre for Resource and Environmental Studies, Australian National University: Canberra, Australia, 2011. [Google Scholar]
- Westgate, M.; Newman, S.M.; Raymond, P.; Van Der Wal, B.; Belbin, J.L. ALA4R: Atlas of Living Australia (ALA) Data and Resources in R. Version 1.9.1. 2022. Available online: https://github.com/AtlasOfLivingAustralia/ALA4R (accessed on 13 April 2018).
- Costa e Silva, J.; Dutkowski, G.W.; Borralho, N.M.G. Across-site heterogeneity of genetic and environmental variances in the genetic evaluation of Eucalyptus globulus trials for height growth. Ann. For. Sci. 2005, 62, 183–191. [Google Scholar] [CrossRef]
- Patterson, H.D.; Thompson, R. Recovery of inter-block information when block sizes are unequal. Biometrika 1971, 58, 545–554. [Google Scholar] [CrossRef]
- Kenward, M.G.; Roger, J.H. An improved approximation to the precision of fixed effects from restricted maximum likelihood. Comput. Stat. Data Anal. 2009, 53, 2583–2595. [Google Scholar] [CrossRef]
- Kenward, M.G.; Roger, J.H. Small sample inference for fixed effects from restricted maximum likelihood. Biometrics 1997, 53, 983–997. [Google Scholar] [CrossRef]
- Self, S.G.; Liang, K.-Y. Asymptotic properties of maximum likelihood estimators and likelihood ratio tests under nonstandard conditions. J. Am. Stat. Assoc. 1987, 82, 605–610. [Google Scholar] [CrossRef]


| Trait | Least-Squares Means (±s.e.) | Species Effect | |
|---|---|---|---|
| E. ovata | E. pauciflora | F-Statistic | |
| Performance traits | |||
| Height (m) | 3.11 ± 0.07 | 2.38 ± 0.08 | 44.6 (<0.001) |
| Stem diameter (mm) | 56.5 ± 1.63 | 39.5 ± 1.75 | 50.8 (<0.001) |
| Leaf economic traits | |||
| Leaf area (cm2) | 20.8 ± 0.4 | 23.0 ± 0.8 | 5.70 (0.024) |
| Leaf thickness (mm) | 0. 400± 0.004 | 0.506 ± 0.007 | 166.9 (<0.001) |
| Leaf density (mg/mm3) | 0.419 ± 0.004 | 0.415 ± 0.004 | 0.6 (0.456) |
| SLA (mm2/mg) | 6.11 ± 0.09 | 4.90 ± 0.09 | 88.2 (<0.001) |
| Leaf hydraulic traits | |||
| Stomata density (N/mm2) | 165 ± 4 | 143 ± 3 | 23.4 (<0.001) |
| Stomata length (μ) | 30.2 ± 0.3 | 35.5 ± 0.4 | 130.6 (<0.001) |
| Stomata length per area (μ/mm2) | 4858 ± 101 | 5002 ± 89 | 0.1 (0.748) |
| Vein density (mm/mm2) | 13.6 ± 0.2 | 10.7 ± 0.2 | 89.9 (<0.001) |
| Trait | Intra-Class Correlation | Homogeneity of Population Variances χ2 Values | Pearson’s Correlation of Population Means between Species a | |
|---|---|---|---|---|
| E. ovata | E. pauciflora | |||
| Performance traits | ||||
| Height (m) | 0.00 (1.000) | 0.11 (0.069) | 2.2 (0.138) | 0.18 (0.432) |
| Stem diameter (mm) | 0.00 (1.000) | 0.01 (0.471) | 0.01 (0.942) | 0.18 (0.420) |
| Leaf economic traits | ||||
| Leaf area (cm2) | 0.00 (1.000) | 0.24 (0.001) | 8.7 (0.003) | 0.42 (0.052) |
| Leaf thickness (mm) | 0.05 (0.241) | 0.23 (0.003) | 4.3 (0.037) | −0.03 (0.889) |
| Leaf density (mg/mm3) | 0.11 (0.075) | 0.13 (0.042) | 0.0 (1.000) | 0.27 (0.222) |
| SLA (mm2/mg) | 0.21 (0.004) | 0.29 (<0.001) | 0.01 (0.903) | 0.12 (0.610) |
| Leaf hydraulic traits | ||||
| Stomata density (N/mm2) | 0.22 (0.003) | 0.08 (0.140) | 1.44 (0.231) | 0.11 (0.615) |
| Stomata length (μ) | 0.00 (1.000) | 0.00 (1.000) | 0 (1.000) | 0.01 (0.958) |
| Stomata length per area (μ /mm2) | 0.25 (0.001) | 0.19 (0.007) | 0.3 (0.612) | 0.06 (0.795) |
| Vein density (mm/mm2) | 0.06 (0.217) | 0.00 (1.000) | 0.4 (0.545) | −0.21 (0.347) |
| Leaf Trait Type | E. ovata | E. pauciflora | ||||
|---|---|---|---|---|---|---|
| Ʃλi | Wilks Lambda | p-Value | Ʃλi | Wilks Lambda | p-Value | |
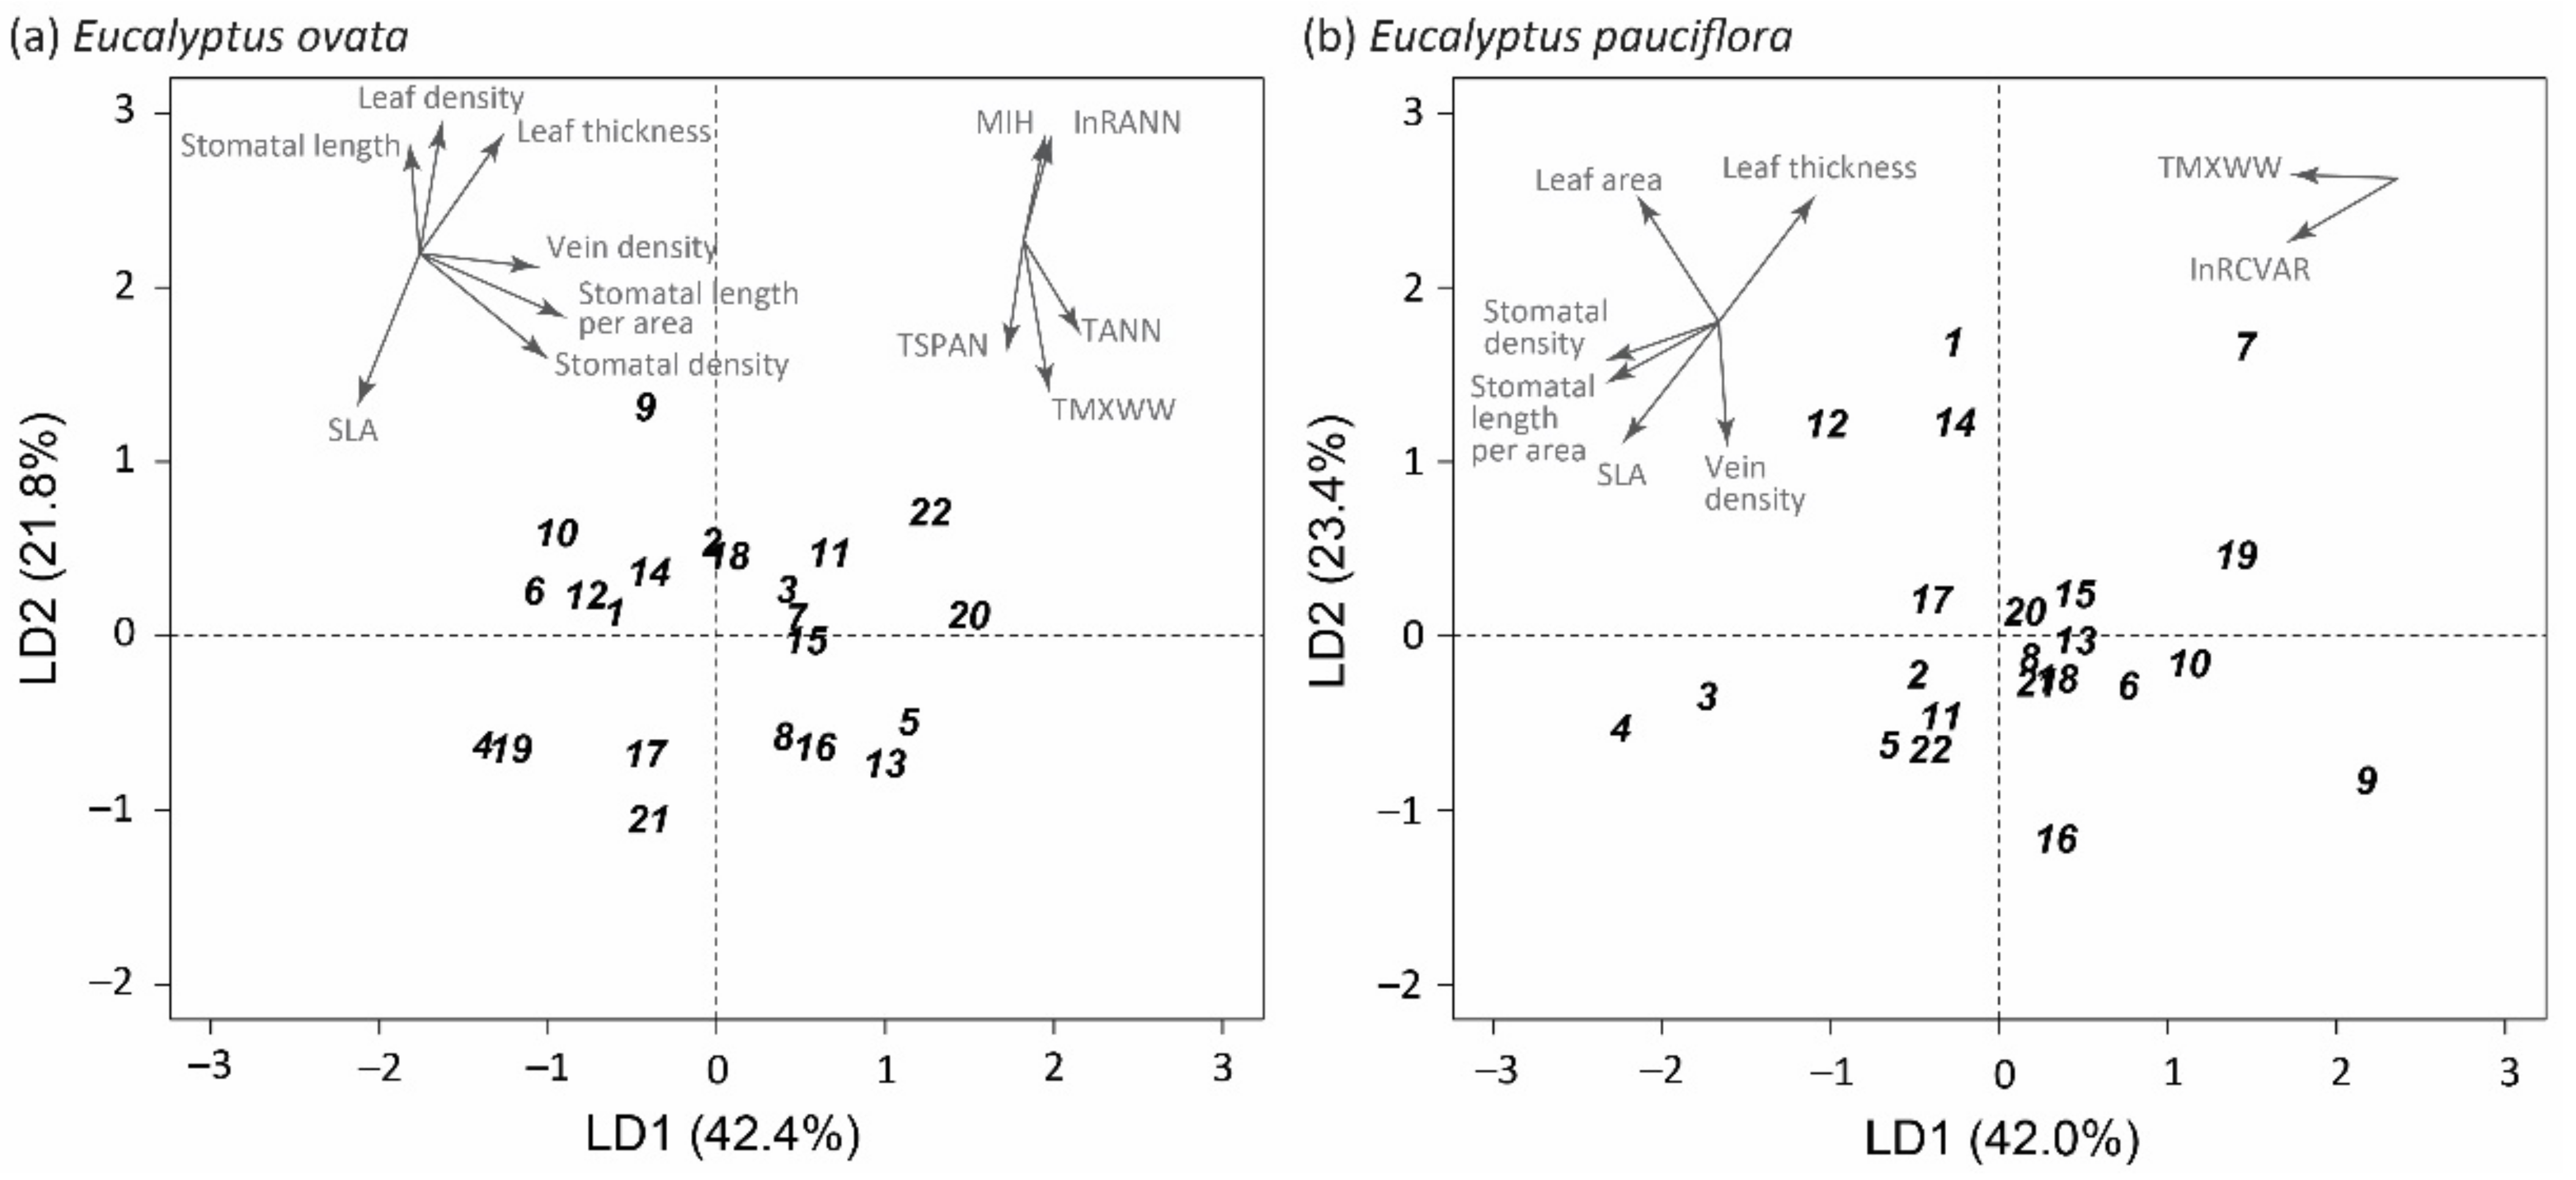
| Economic | 0.806 | 0.50 | 0.333 | 1.704 | 0.27 | <0.001 |
| Hydraulic | 1.158 | 0.39 | 0.021 | 0.951 | 0.45 | 0.152 |
| Economic & hydraulic | 1.590 | 0.20 | 0.081 | 2.423 | 0.11 | <0.001 |
| Height | Stem Diameter | Leaf Area | Leaf Thickness | Leaf Density | SLA | Stom. Density | Stom. Length | Stom. Length per Area | ||
|---|---|---|---|---|---|---|---|---|---|---|
| Stem diameter | E. ovata | 0.69 *** | ||||||||
| E. pauciflora | 0.90 *** | |||||||||
| Leaf area | E. ovata | −0.15 | 0.20 | |||||||
| E. pauciflora | 0.11 | 0.02 | ||||||||
| Leaf thickness | E. ovata | −0.52 * | −0.68 *** | 0.01 | ||||||
| E. pauciflora | −0.36 | −0.32 | −0.02 | |||||||
| Leaf density | E. ovata | 0.14 | −0.03 | 0.22 | 0.36 | |||||
| E. pauciflora | 0.42 | 0.30 | −0.16 | 0.23 | ||||||
| SLA | E. ovata | 0.23 | 0.46 * | −0.13 | −0.83 *** | −0.81 *** | ||||
| E. pauciflora | 0.15 | 0.15 | 0.07 | −0.87 *** | −0.60 *** | |||||
| Stomatal density | E. ovata | −0.11 | −0.15 | 0.07 | 0.26 | −0.20 | −0.05 | |||
| E. pauciflora | 0.02 | −0.11 | 0.07 | −0.36 | −0.11 | 0.45 * | ||||
| Stomatal length | E. ovata | −0.06 | −0.30 | −0.18 | 0.34 | 0.35 | −0.44 * | −0.42 | ||
| E. pauciflora | 0.21 | 0.24 | 0.10 | 0.22 | 0.20 | −0.31 | −0.35 | |||
| Stomatal length per area | E. ovata | −0.12 | −0.25 | 0.02 | 0.44 * | −0.07 | −0.23 | 0.93 *** | −0.07 | |
| E. pauciflora | 0.24 | 0.17 | 0.10 | −0.53 ** | −0.15 | 0.51 * | 0.72 *** | 0.18 | ||
| Vein density | E. ovata | −0.30 | −0.15 | 0.47 * | 0.26 | 0.10 | −0.22 | 0.55 ** | −0.32 | 0.48 * |
| E. pauciflora | −0.07 | 0.08 | −0.32 | −0.35 | −0.43 * | 0.42 | 0.16 | −0.19 | 0.29 |
| Matrix X | Matrix Y | Spearman | Null Hypothesis | |
|---|---|---|---|---|
| rho | p | |||
| Between species | ||||
| ova GD_all | pau GD_all | 0.02 | 0.428 | H0: Differentiation in primary leaf traits is not correlated |
| ova GD_hyd | pau GD_hyd | 0.00 | 0.466 | H0: Differentiation in primary hydraulic traits is not correlated |
| ova GD_eco | pau GD_eco | 0.01 | 0.459 | H0: Differentiation in primary economic traits is not correlated |
| ova GD_hyd | pau GD_eco | 0.02 | 0.418 | H0: Differentiation in E. ovata hydraulic traits is not correlated with that in economic traits in E. pauciflora * |
| ova GD_eco | pau GD_hyd | 0.00 | 0.493 | H0: Differentiation in E. ovata economic traits is not correlated with that in hydraulic traits in E. pauciflora * |
| ova FST | pau FST | −0.08 | 0.651 | H0: SNP molecular differentiation (pairwise FST) is not correlated |
| Within E. ovata | ||||
| ova GD_all | ova FST | 0.30 | 0.005 | H0: Differentiation in primary leaf traits and SNP differentiation is not correlated |
| ova GD_hyd | ova FST | 0.07 | 0.244 | H0: Differentiation in primary hydraulic traits and SNP differentiation is not correlated |
| ova GD_eco | ova FST | 0.44 | <0.001 | H0: Differentiation in primary economic traits and SNP differentiation is not correlated |
| ova_SLA | ova FST | 0.34 | 0.002 | H0: Differentiation in compound trait SLA and SNP differentiation is not correlated |
| ova_StL/A | ova FST | 0.04 | 0.335 | H0: Differentiation in compound trait stomata length per unit area and SNP differentiation is not correlated |
| Within E. pauciflora | ||||
| pau GD_all | pau FST | 0.06 | 0.351 | H0: Differentiation in primary leaf traits and SNP differentiation is not correlated |
| pau GD_hyd | pau FST | 0.04 | 0.356 | H0: Differentiation in primary hydraulic traits and SNP differentiation is not correlated |
| pau GD_eco | pau FST | 0.09 | 0.289 | H0: Differentiation in primary economic traits and SNP differentiation is not correlated |
| pau_SLA | pau FST | 0.13 | 0.166 | H0: Differentiation in compound trait SLA and SNP differentiation is not correlated |
| pau_StL/A | pau FST | −0.15 | 0.873 | H0: Differentiation in compound trait stomata length per unit area and SNP differentiation is not correlated |
| Trait | Eucalyptus ovata | Adj. R2 | BIC | p-Value | Eucalyptus pauciflora | Adj. R2 | BIC | p-Value |
|---|---|---|---|---|---|---|---|---|
| Performance | ||||||||
| Maximum height (m) | −lnRCVAR + TMXWW + lnRANN | 38.9 | 30.3 | 0.008 | +TANN | 11.3 | 26.6 | 0.086 |
| Stem diameter (mm) | −lnRCVAR + TMXWW + lnRANN | 41.7 | 33.8 | 0.005 | ns | |||
| Leaf economic | ||||||||
| Leaf area (cm2) | ns | +TANN | 11.3 | 26.6 | 0.069 | |||
| Leaf thickness (mm) | +lnRCVAR − TMXWW | 43.2 | 38.7 | 0.002 | −MIH − TMXWW | 42.6 | 26.1 | 0.002 |
| Leaf thickness (mm) | −lnRCVAR | 34.7 | 26.3 | 0.002 | ||||
| Leaf density (mg mm−3) | −TMXWW | 38.9 | 22.8 | 0.001 | ns | |||
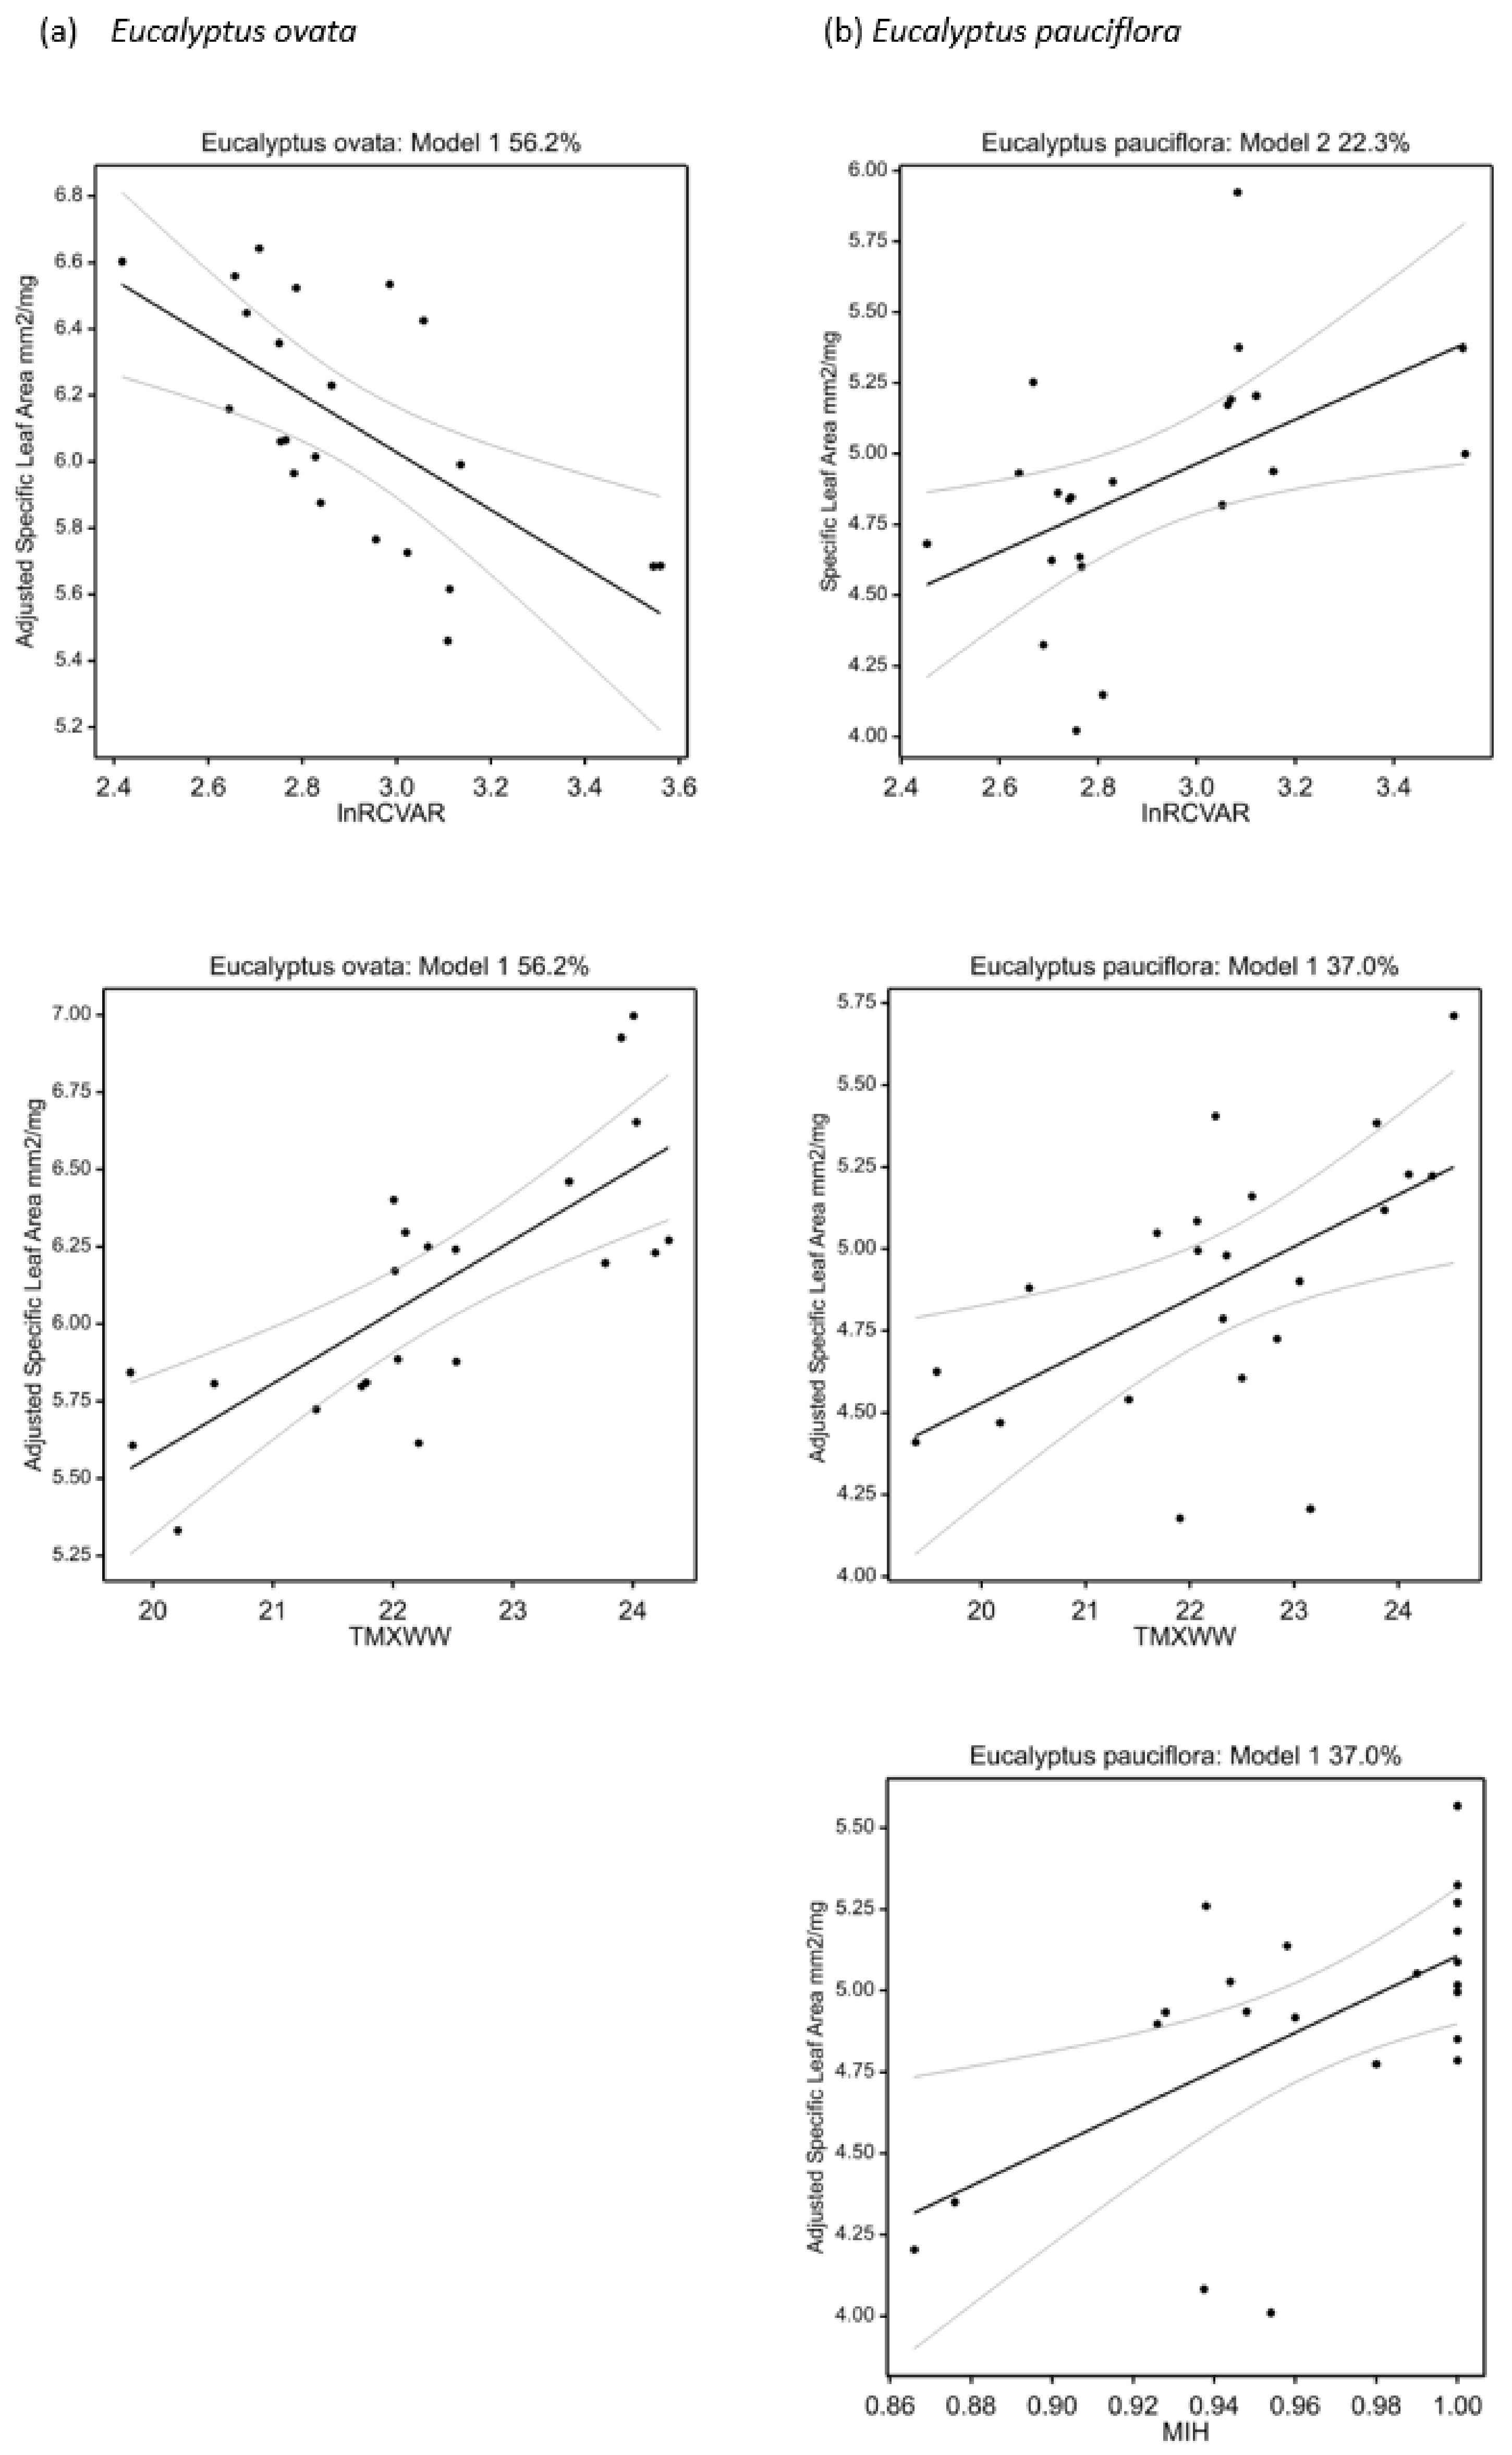
| Specific leaf area (mm2 mg−1) | +TMXWW − lnRCVAR | 56.2 | 26.6 | <0.001 | +MIH + TMXWW | 37.0 | 26.0 | 0.005 |
| Specific leaf area (mm2 mg−1) | +TANN − lnRCVAR + TSPAN | 57.9 | 28.1 | <0.001 | +lnRCVAR | 22.3 | 27.9 | 0.015 |
| Leaf hydraulic | ||||||||
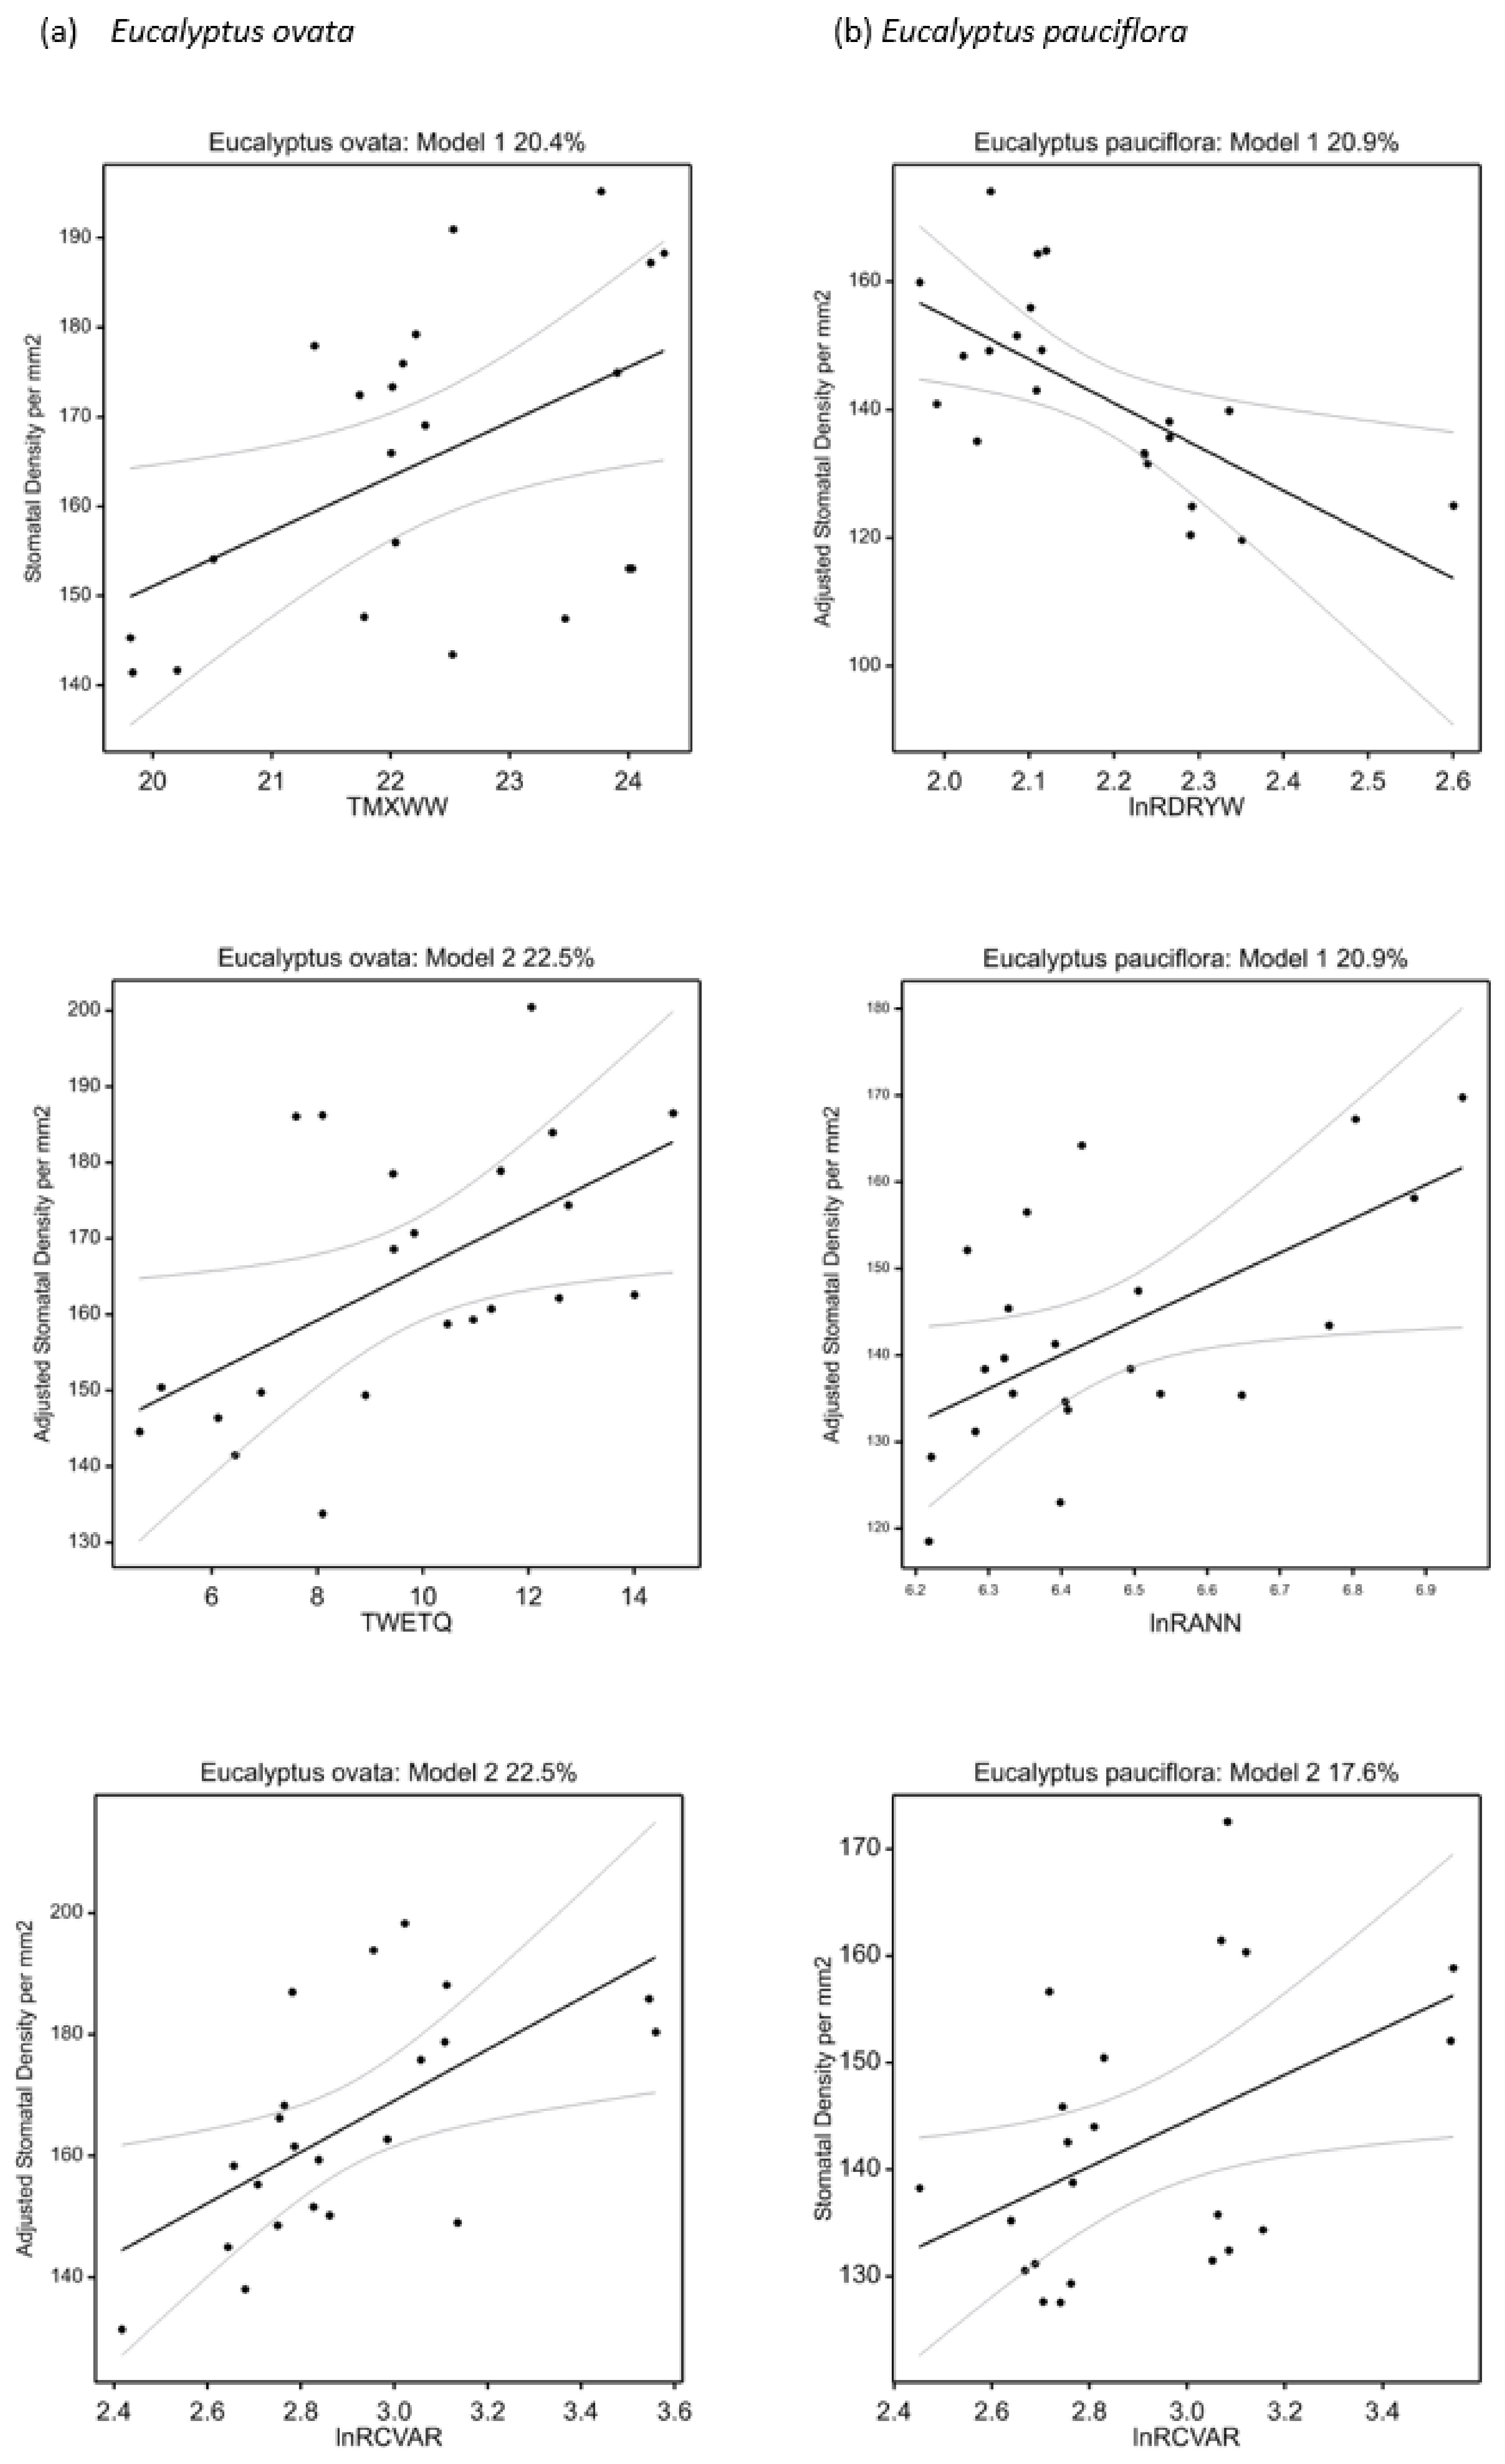
| Stomatal density (mm−2) | +TMXWW | 20.4 | 21.7 | 0.020 | +lnRCVAR | 17.6 | 21.6 | 0.030 |
| Stomatal density (mm−2) | +lnRCVAR + TWETQ | 22.5 | 23.6 | 0.034 | −lnRDRYW + lnRANN | 20.9 | 23.3 | 0.042 |
| Stomatal length (µ) | −TMXWW − lnRDRYW | 30.0 | 26.4 | 0.013 | −lnRANN | 12.9 | 19.0 | 0.056 |
| Stomatal length (µ) | −TMXWW + RRL + lnRCVAR | 33.8 | 27.7 | 0.015 | ||||
| Stomatal length per area (µ mm−2) | ns | +TDRYQ | 17.5 | 21.1 | 0.03 | |||
| Vein density (mm mm−2) | +TANN | 23.9 | 28.2 | 0.012 | ns |
| Variable Code | Description (Unit of Measurement) | Ecophysiological Relevance |
|---|---|---|
| lnRANN | Mean annual precipitation (mm) (ln X + 1) | Catch all for precipitation-related adaptations |
| lnRDRYW | Precipitation of driest week (mm) (ln X + 1) | Drought exposure |
| lnRCVAR | Precipitation seasonality (Coefficient of variation) (ln X + 1) | Exposure to extremes in water availability |
| TANN | Mean annual temperature (°C) | Catch all for temperature-related adaptations |
| TMXWW | Maximum temperature of warmest week (°C) | Extreme heat tolerance |
| TSPAN | Temperature annual range (°C) | Tolerance of temperature extremes |
| TWETQ | Mean temperature of wettest quarter (°C) | Concurrence of moisture and growing season |
| TDRYQ | Mean temperature of driest quarter (°C) | Aridity/drought exposure |
| RRL | Lowest weekly radiation (W m−2) | Light limitation in coolest season |
| MIH | Highest weekly moisture index | Soil water availability in wettest season |
Publisher’s Note: MDPI stays neutral with regard to jurisdictional claims in published maps and institutional affiliations. |
© 2022 by the authors. Licensee MDPI, Basel, Switzerland. This article is an open access article distributed under the terms and conditions of the Creative Commons Attribution (CC BY) license (https://creativecommons.org/licenses/by/4.0/).
Share and Cite
Prober, S.M.; Potts, B.M.; Harrison, P.A.; Wiehl, G.; Bailey, T.G.; Costa e Silva, J.; Price, M.R.; Speijers, J.; Steane, D.A.; Vaillancourt, R.E. Leaf Economic and Hydraulic Traits Signal Disparate Climate Adaptation Patterns in Two Co-Occurring Woodland Eucalypts. Plants 2022, 11, 1846. https://doi.org/10.3390/plants11141846
Prober SM, Potts BM, Harrison PA, Wiehl G, Bailey TG, Costa e Silva J, Price MR, Speijers J, Steane DA, Vaillancourt RE. Leaf Economic and Hydraulic Traits Signal Disparate Climate Adaptation Patterns in Two Co-Occurring Woodland Eucalypts. Plants. 2022; 11(14):1846. https://doi.org/10.3390/plants11141846
Chicago/Turabian StyleProber, Suzanne M., Brad M. Potts, Peter A. Harrison, Georg Wiehl, Tanya G. Bailey, João Costa e Silva, Meridy R. Price, Jane Speijers, Dorothy A. Steane, and René E. Vaillancourt. 2022. "Leaf Economic and Hydraulic Traits Signal Disparate Climate Adaptation Patterns in Two Co-Occurring Woodland Eucalypts" Plants 11, no. 14: 1846. https://doi.org/10.3390/plants11141846
APA StyleProber, S. M., Potts, B. M., Harrison, P. A., Wiehl, G., Bailey, T. G., Costa e Silva, J., Price, M. R., Speijers, J., Steane, D. A., & Vaillancourt, R. E. (2022). Leaf Economic and Hydraulic Traits Signal Disparate Climate Adaptation Patterns in Two Co-Occurring Woodland Eucalypts. Plants, 11(14), 1846. https://doi.org/10.3390/plants11141846