
Influence of Schumann Range Electromagnetic Fields on Components of Plant Redox Metabolism in Wheat and Peas

 ,
,
Abstract
:1. Introduction
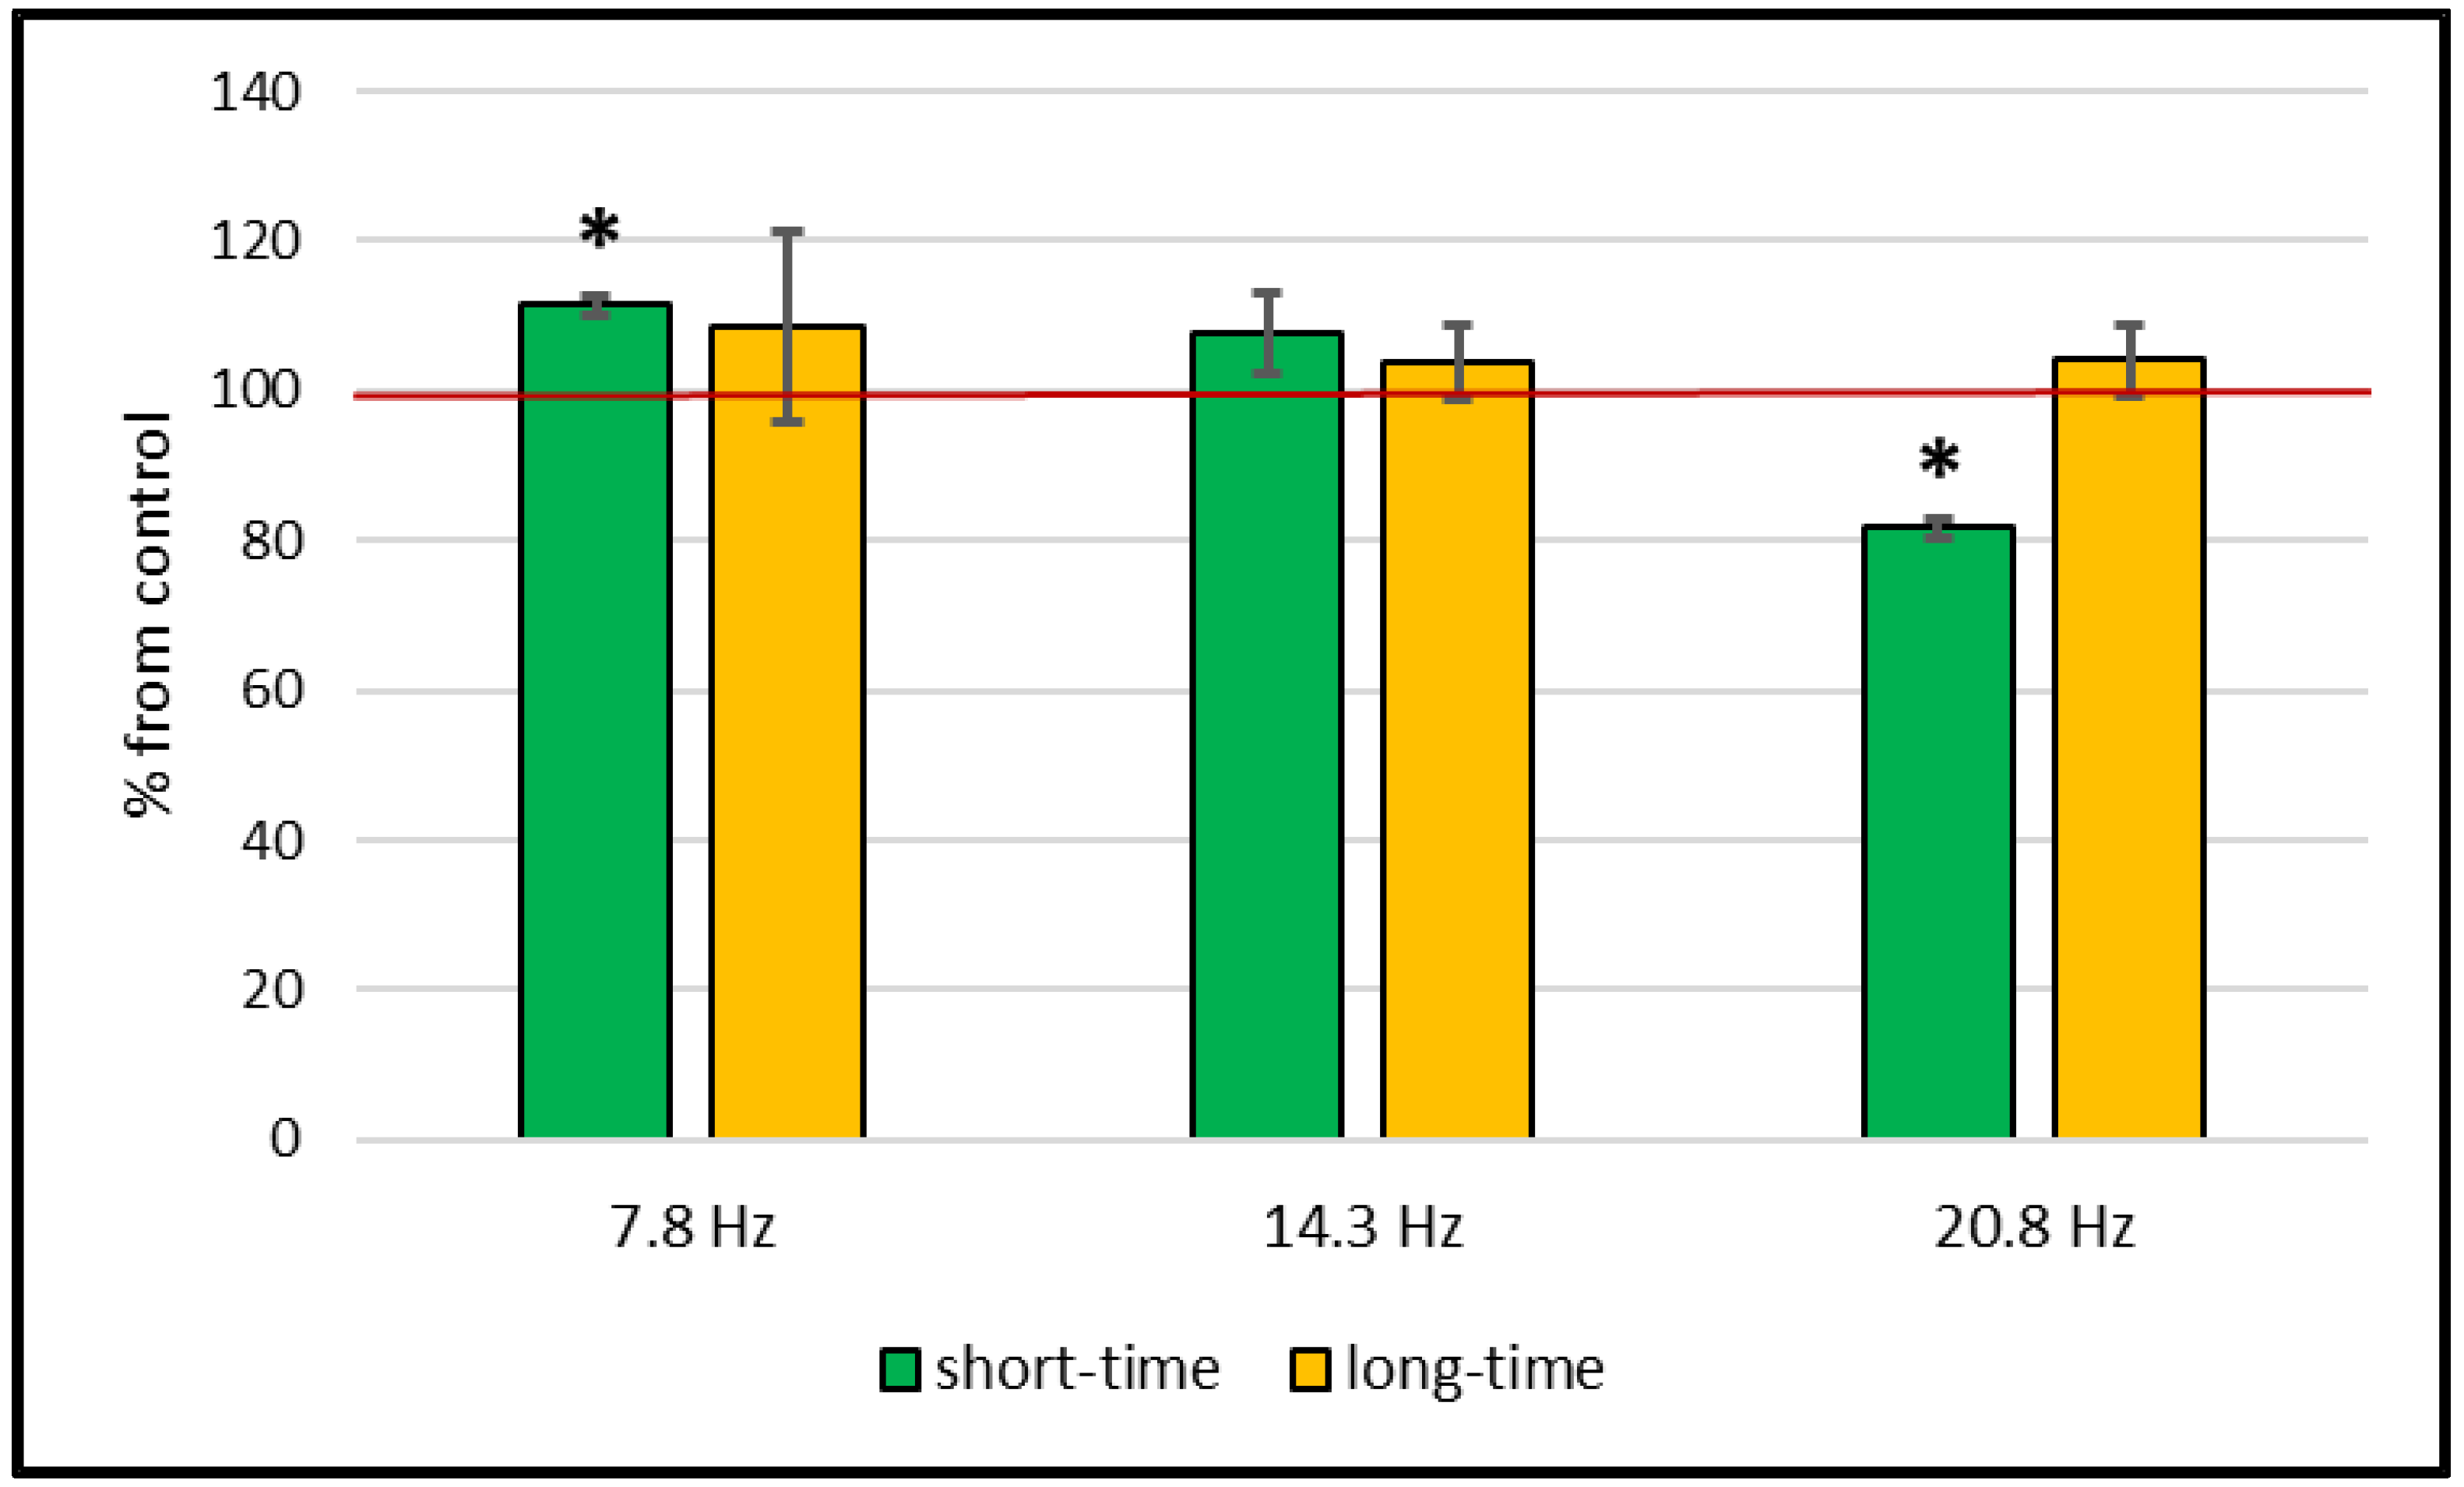
2. Results
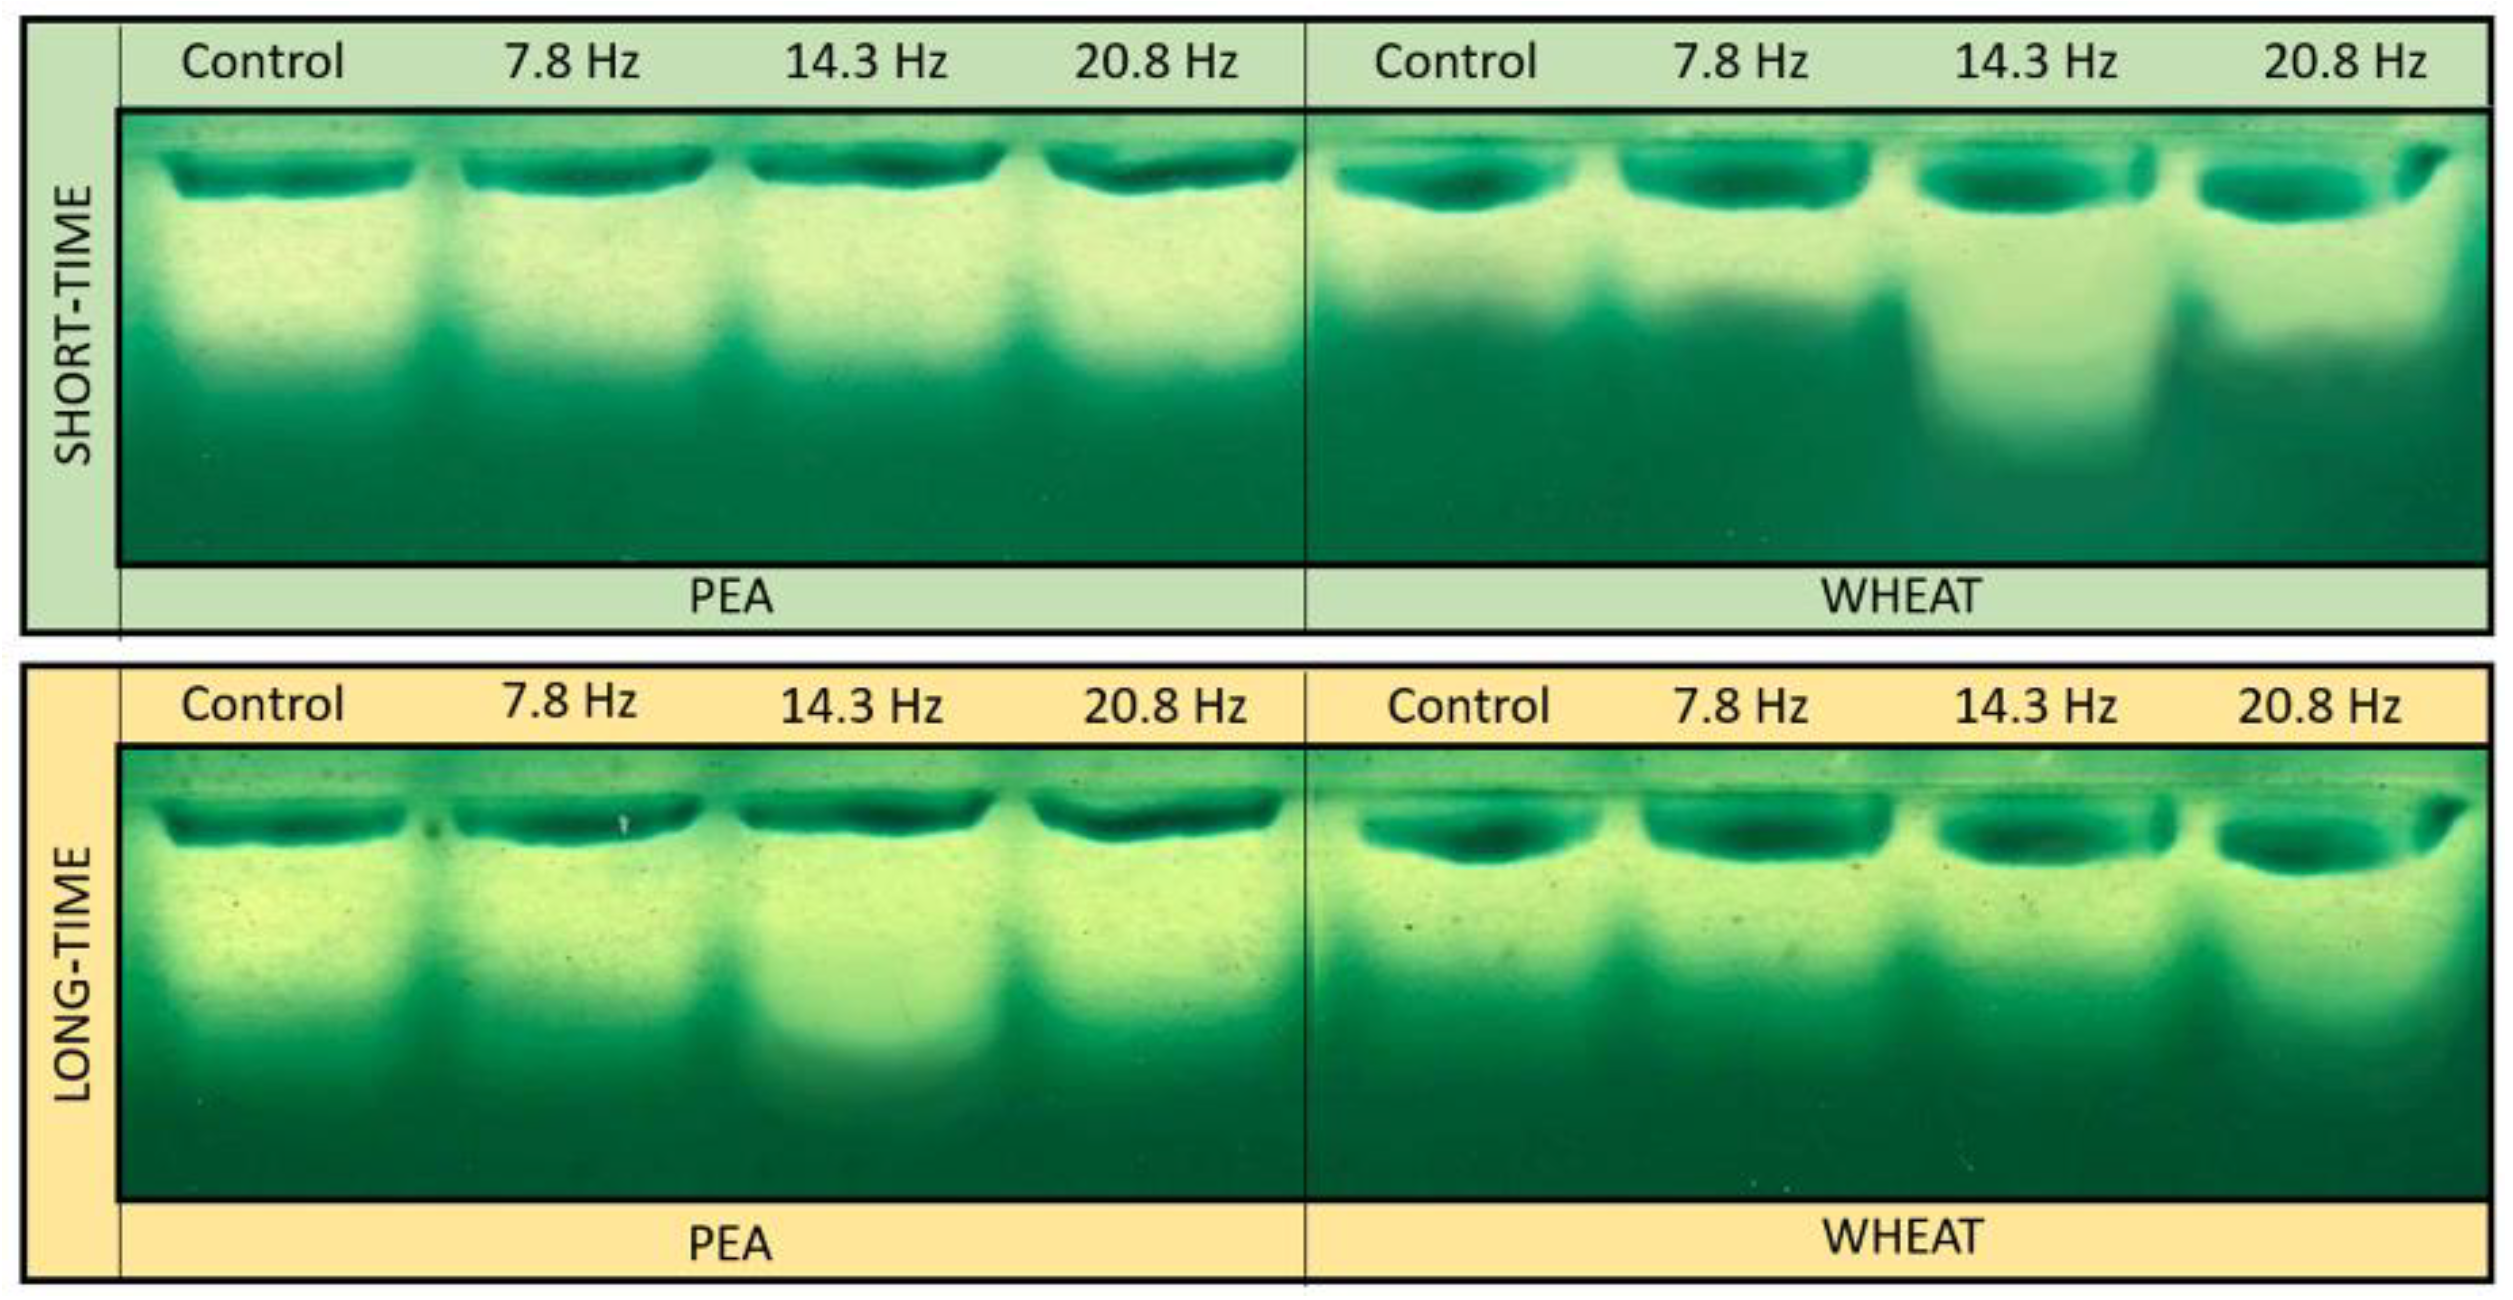
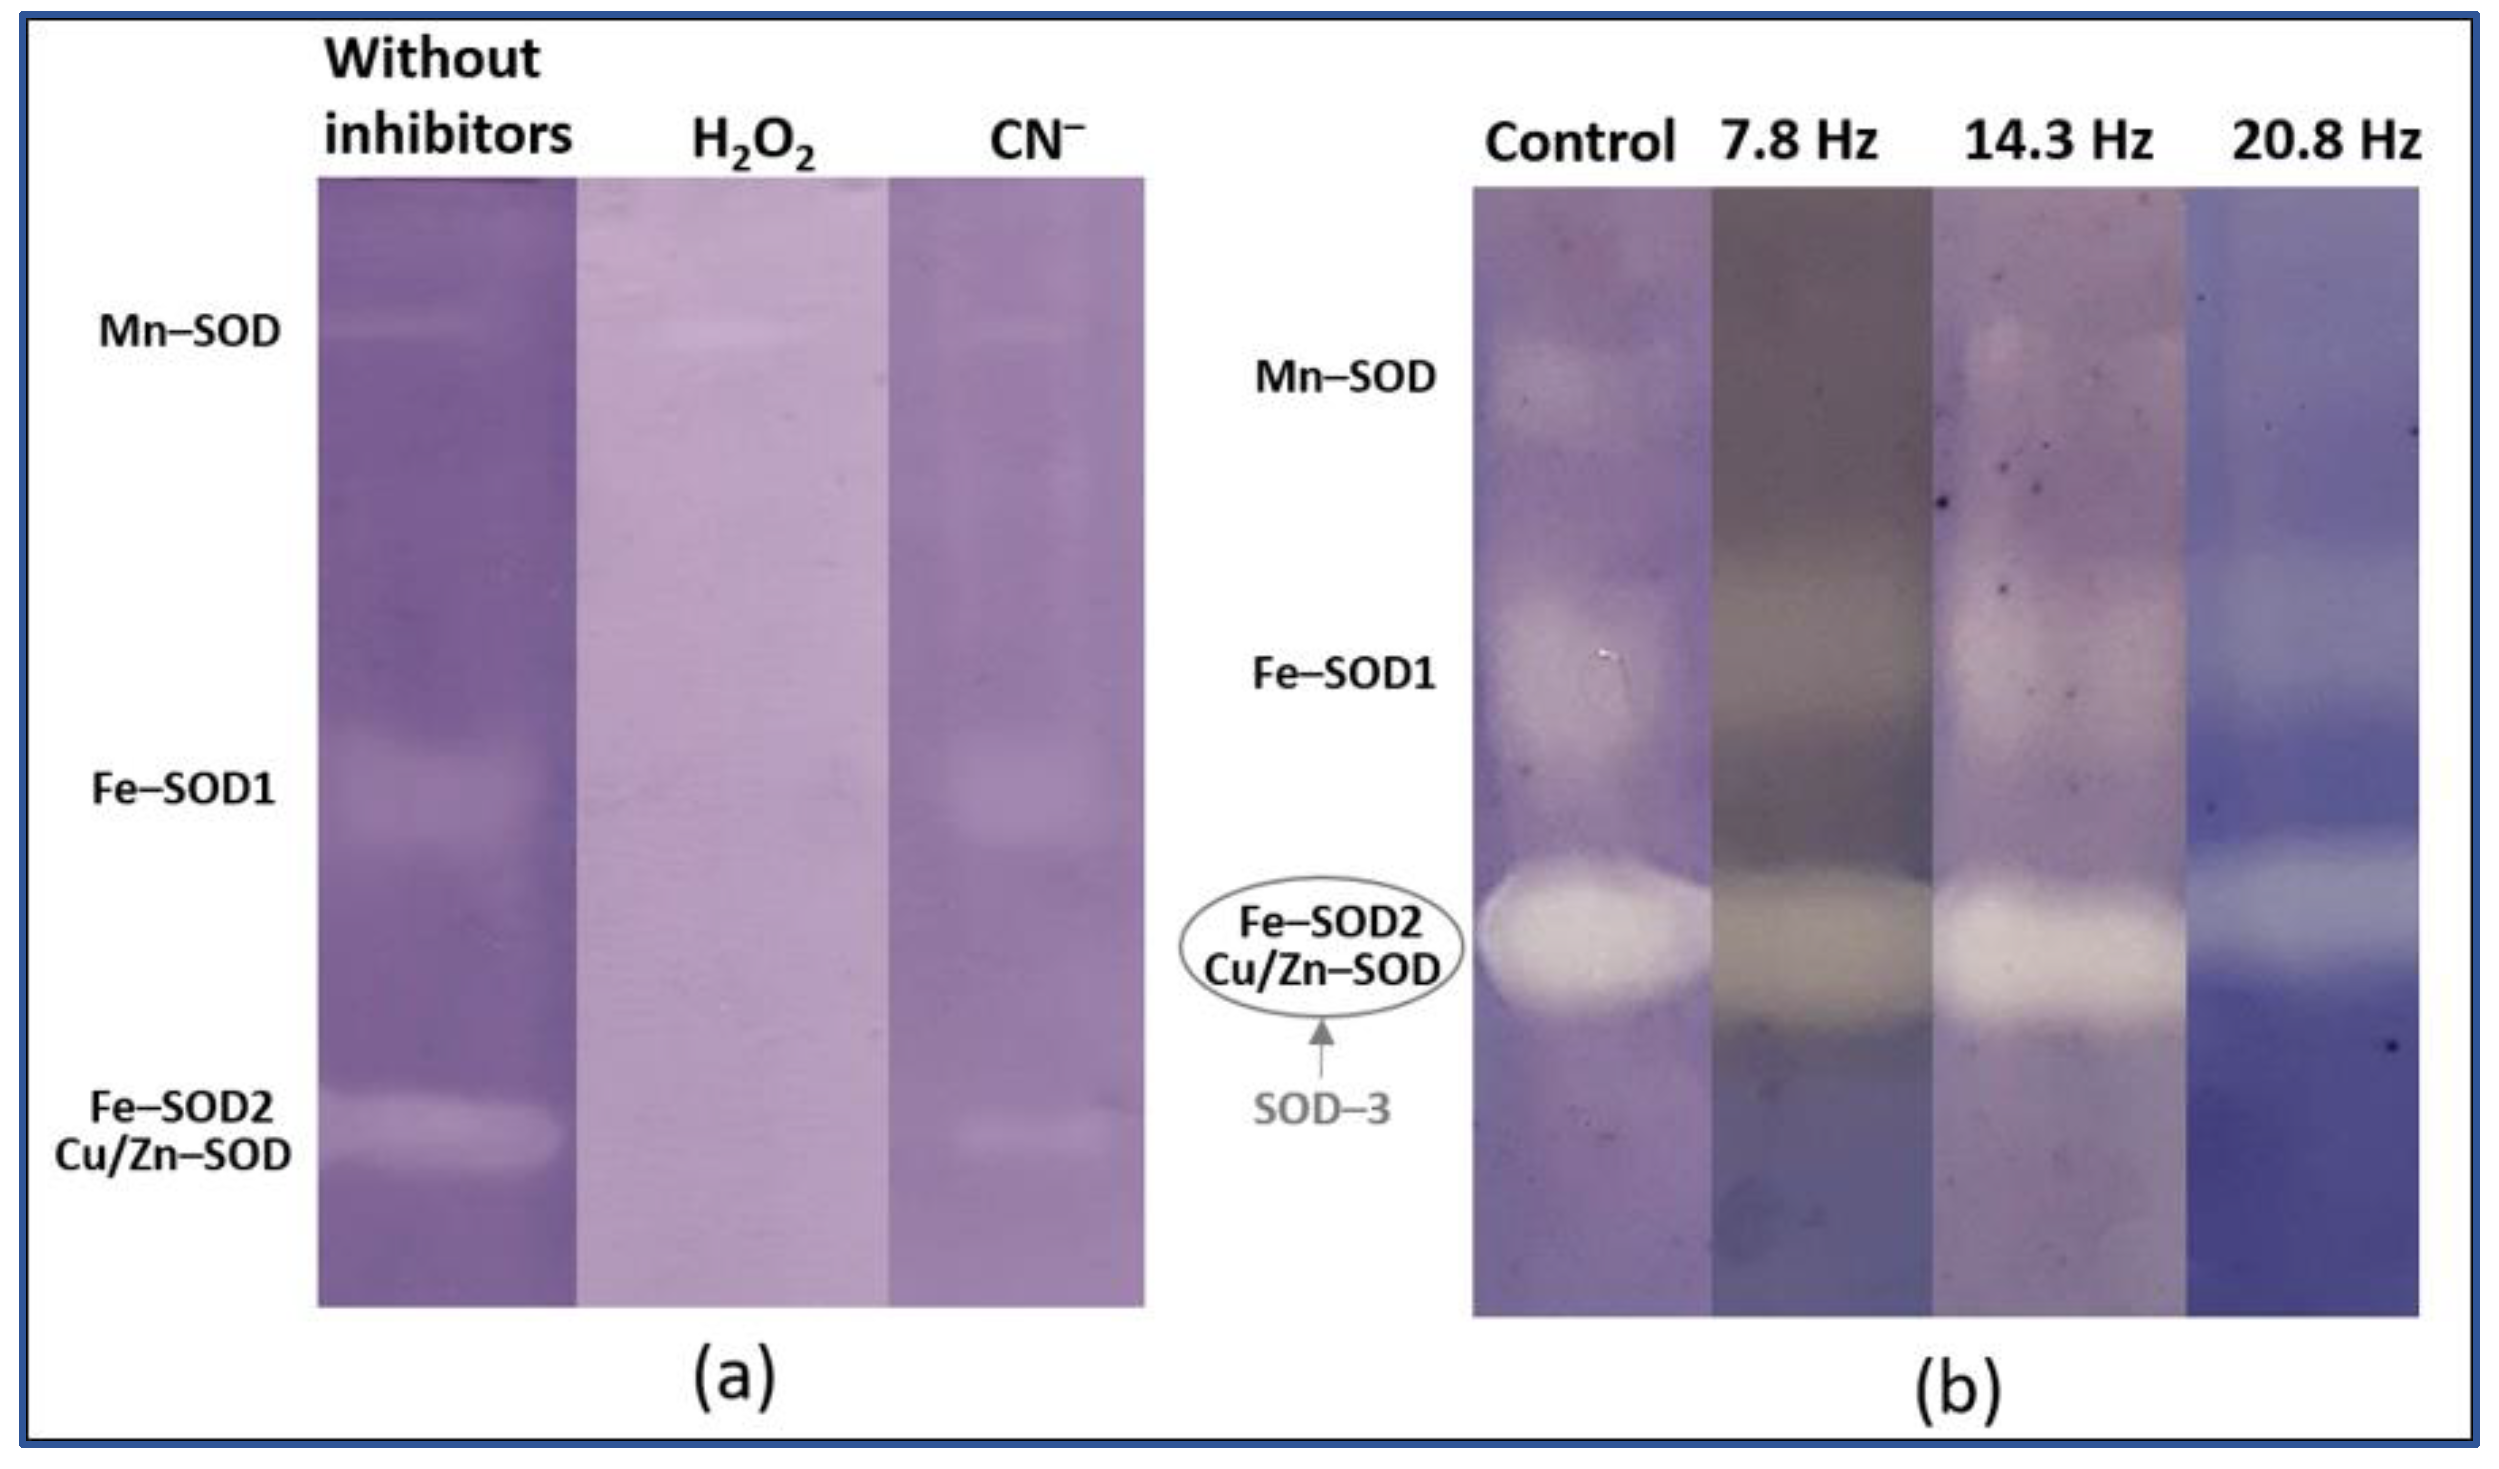
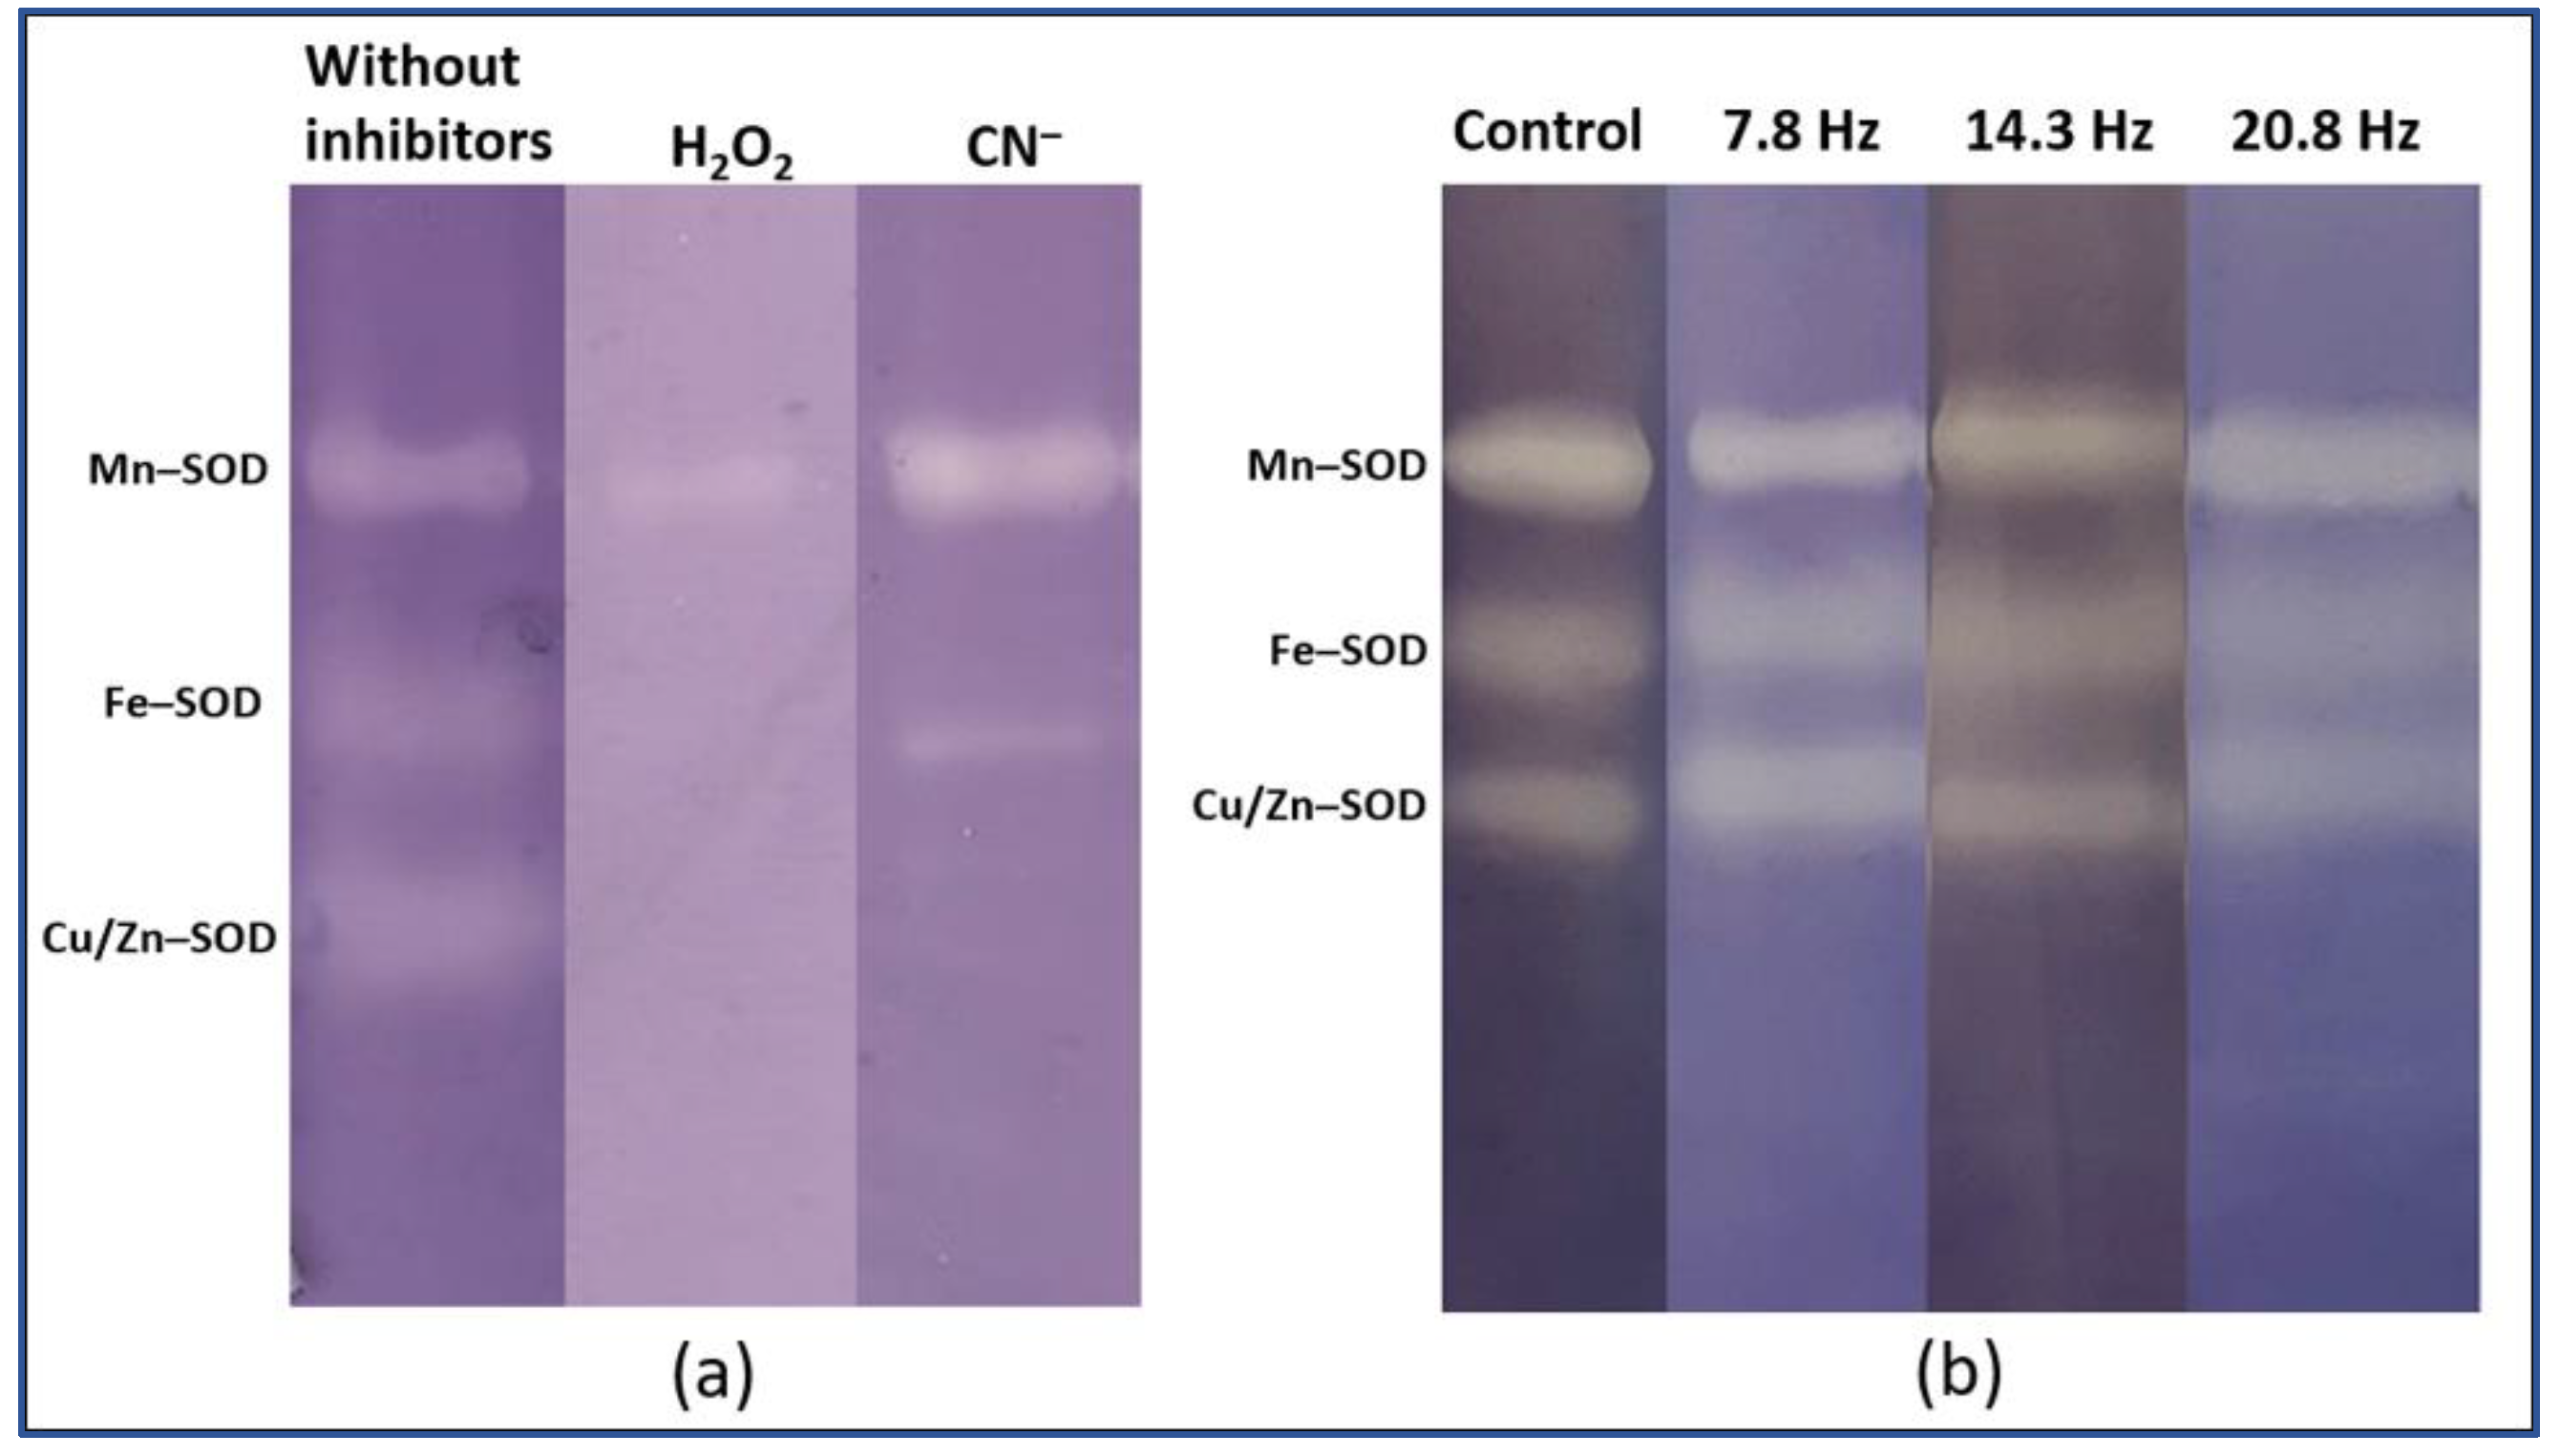
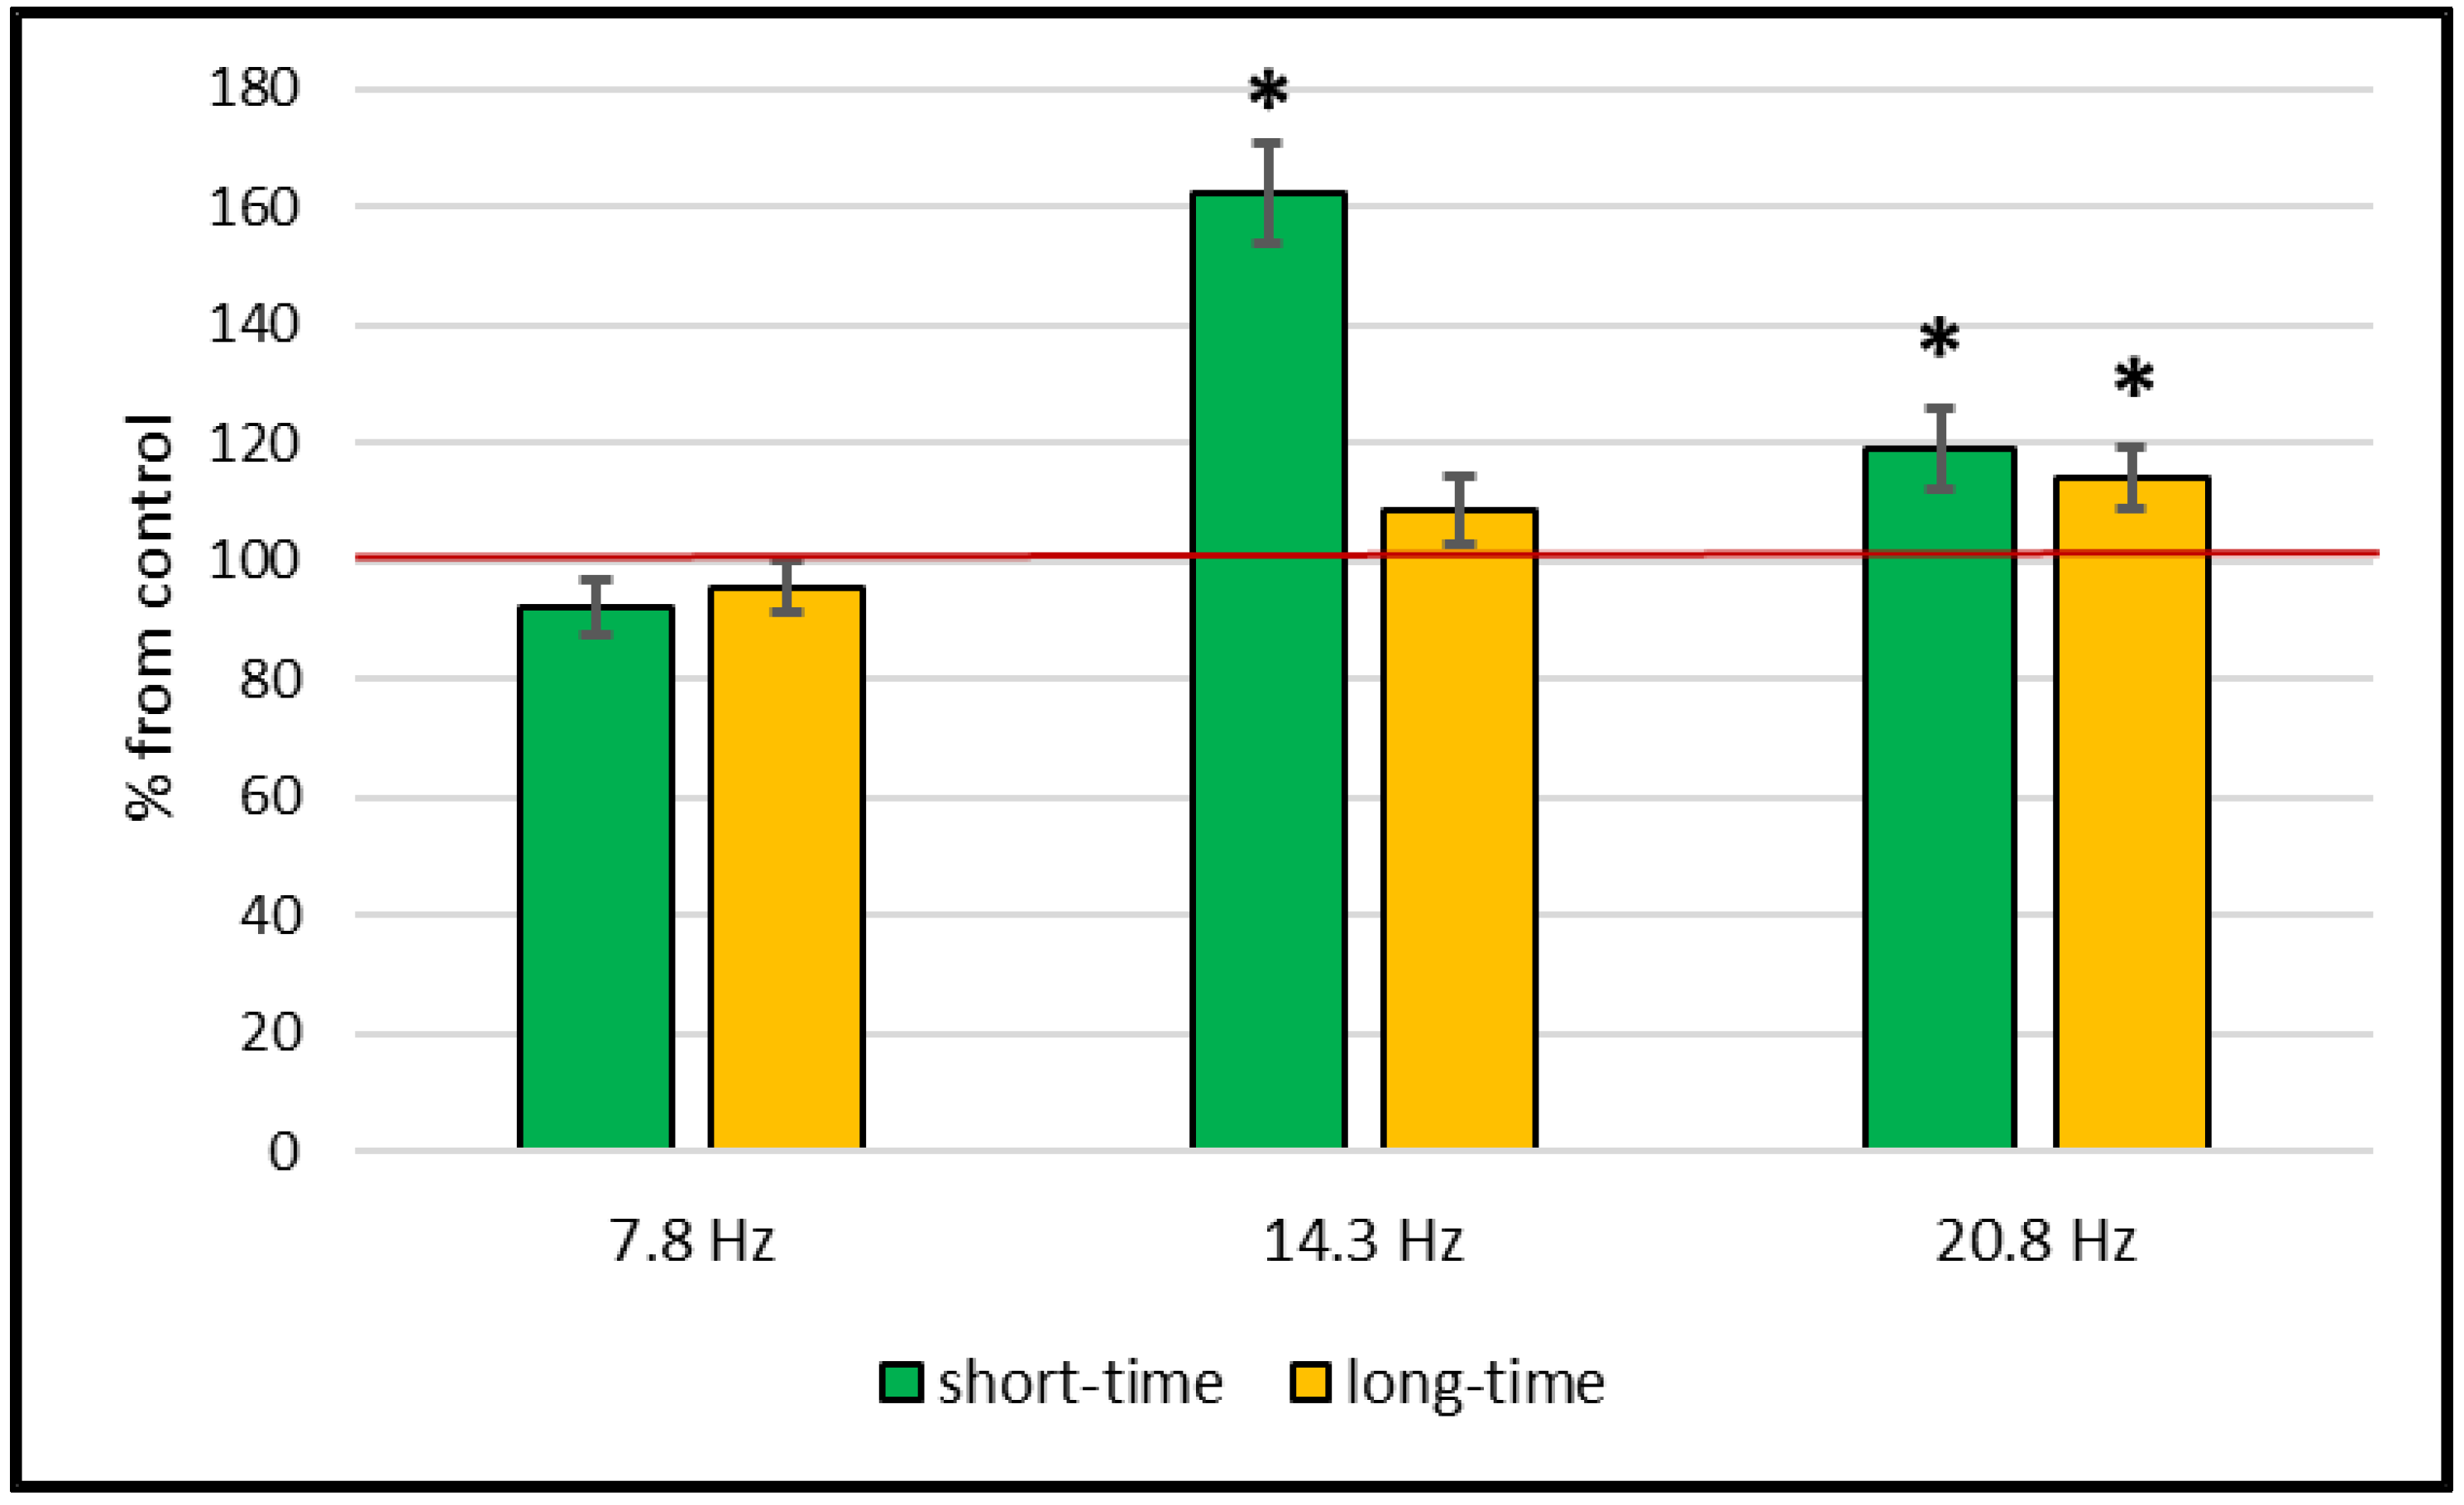
Catalase and Superoxide Dismutase Activity
3. Discussion
4. Materials and Methods
4.1. Plant Growth and Magnetic Field Condition
4.2. Determination of MDA Content
4.3. Determination of Antioxidant Enzyme Activity
4.4. Superoxide Dismutase Isoforms Analysis
4.5. Catalase Isoforms Analysis
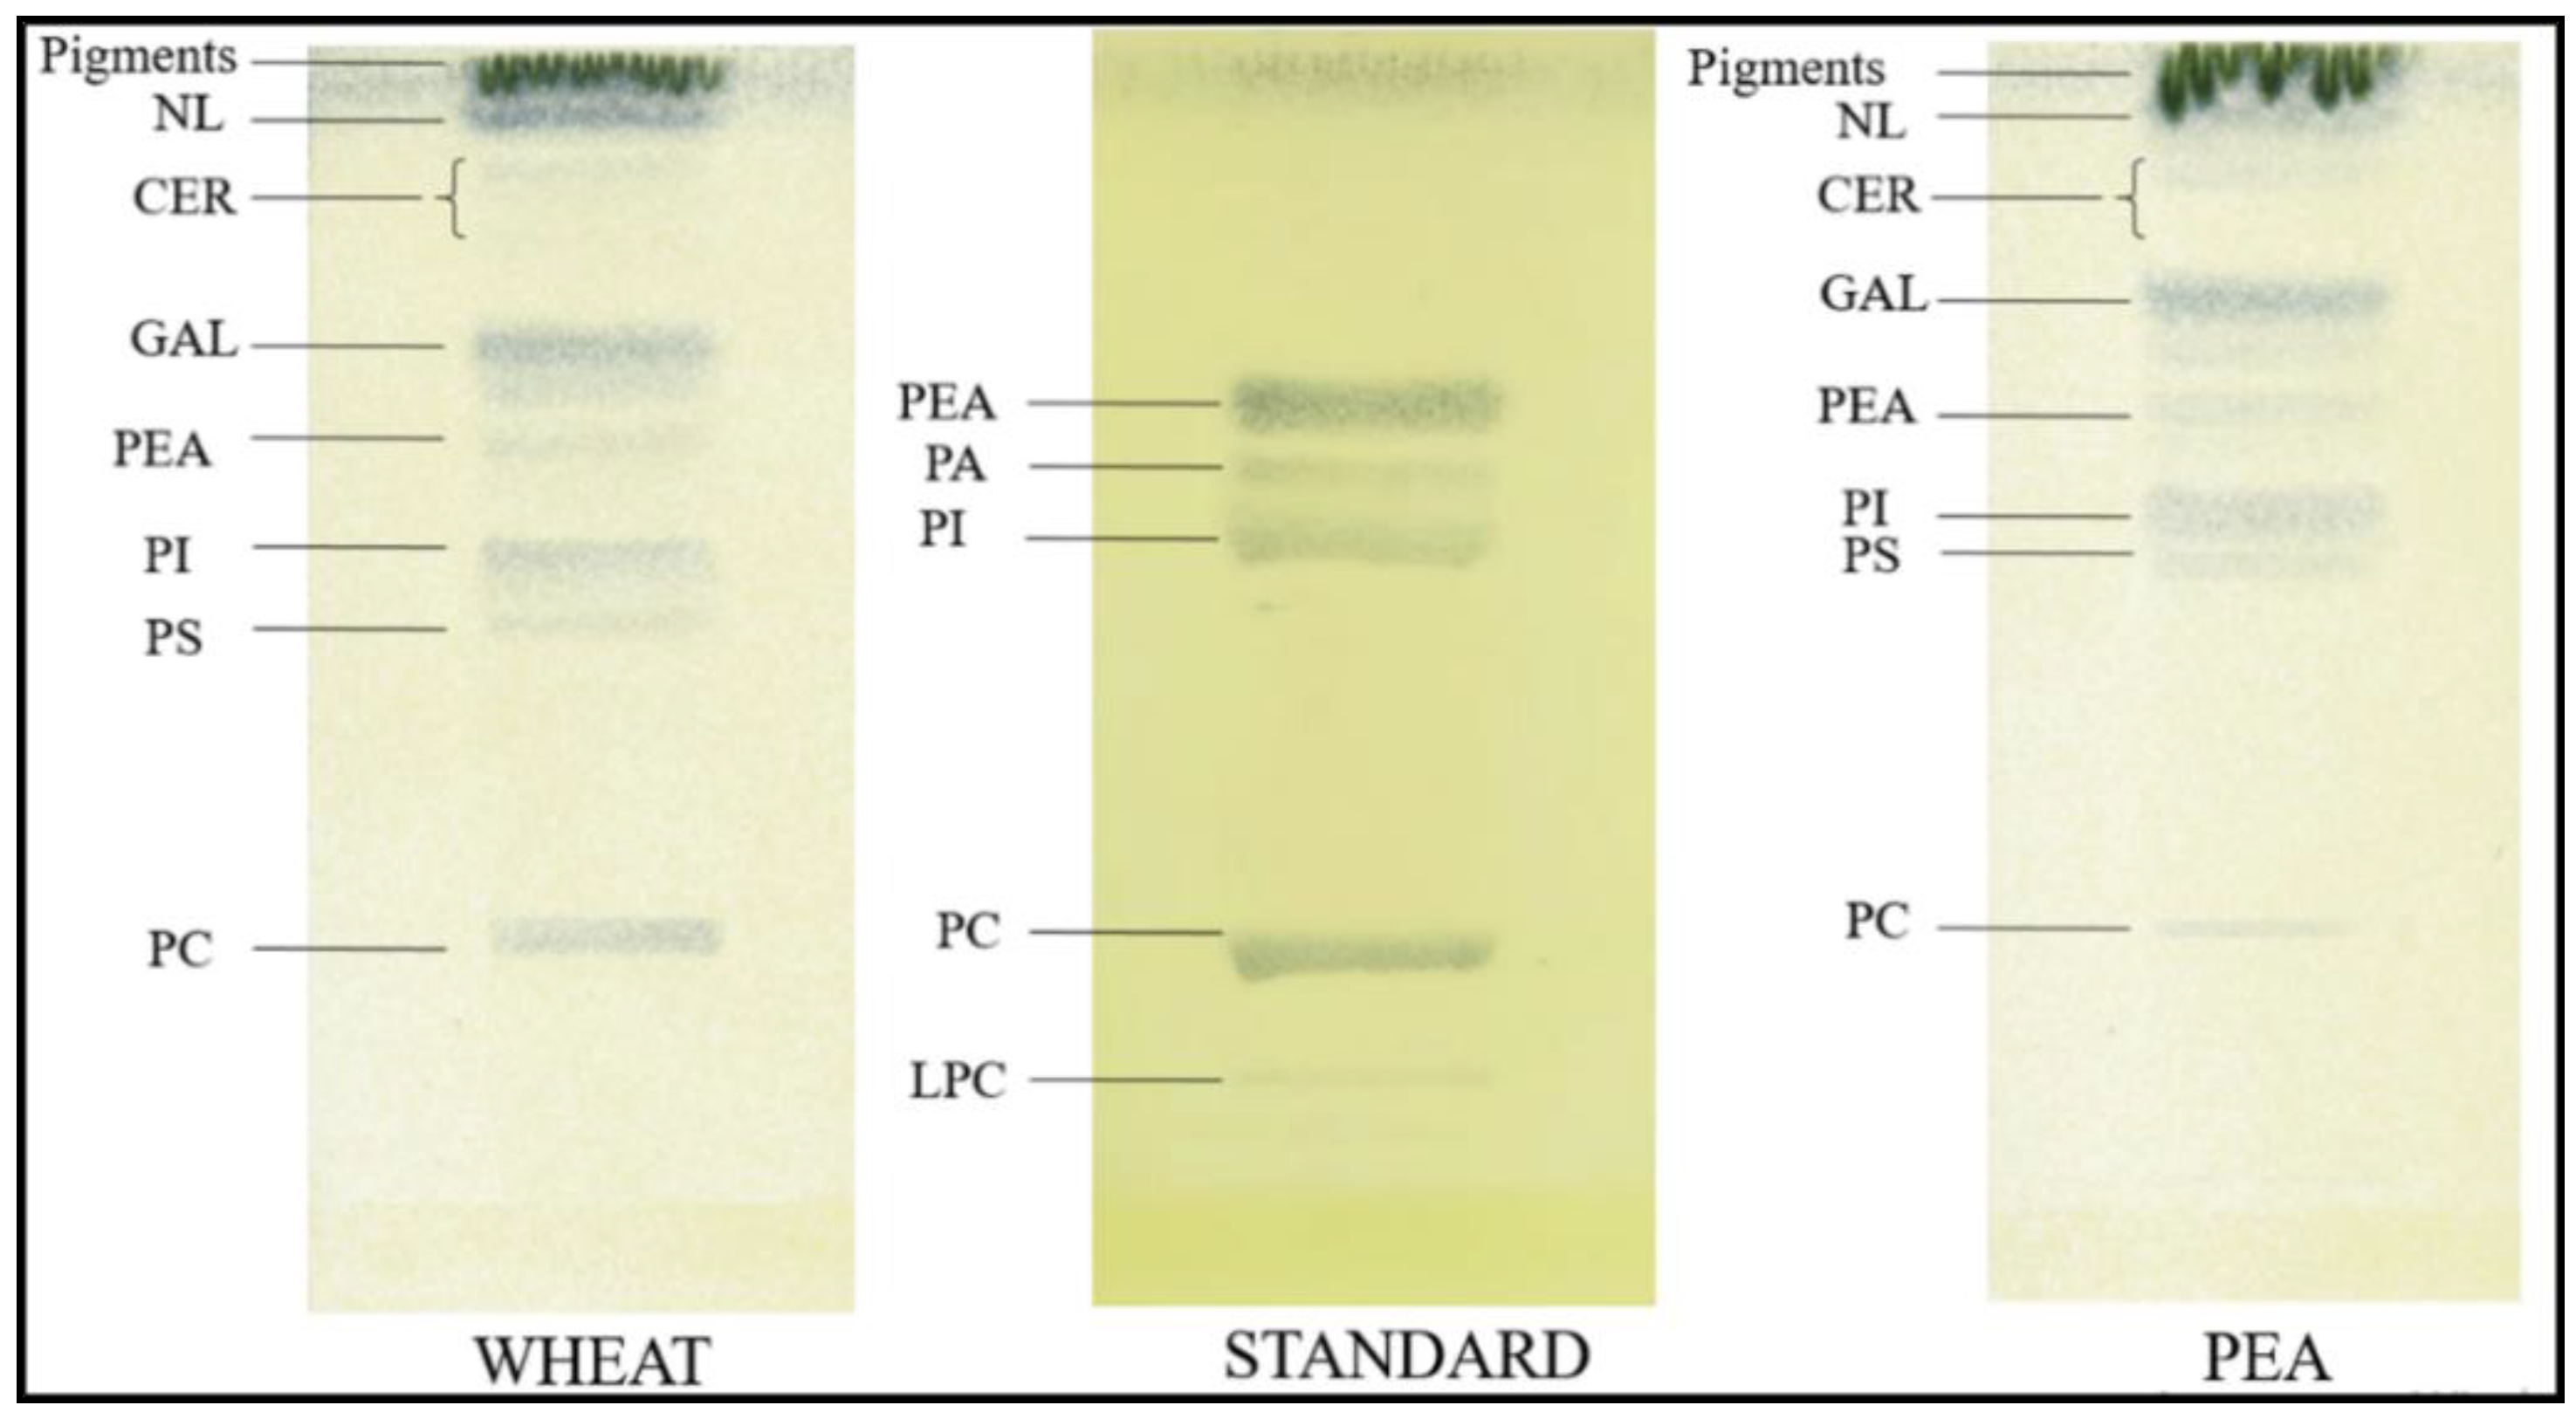
4.6. Thin Layer Chromatography
4.7. Statistical Analysis
Author Contributions
Funding
Institutional Review Board Statement
Informed Consent Statement
Data Availability Statement
Conflicts of Interest
References
- Lennick, C.; Cochemé, H.M. Redox metabolism: ROS as specific molecular regulators of cell signaling and function. Mol. Cell 2021, 81, 3691–3707. [Google Scholar] [CrossRef]
- Zhao, Y.; Yang, Y.; Loscalzo, J. Chapter Eighteen–Real-time assessment of the metabolic profile of living cells with genetically encoded NADH sensors. Methods Enzymol. 2014, 542, 349–367. [Google Scholar] [CrossRef] [Green Version]
- Mandal, M.; Sarkar, M.; Khan, A.; Biswas, M.; Masi, A.; Rakwal, R.; Agrawal, G.K.; Srivastava, A.; Sarkar, A. Reactive oxygen species (ROS) and reactive nitrogen species (RNS) in plants-maintenance of structural individuality and functional blend. Adv. Redox Res. 2022, 5, 100039. [Google Scholar] [CrossRef]
- Messner, K.R.; Imlay, J.A. The identification of primary sites of superoxide and hydrogen peroxide formation in the aerobic respiratory chain and sulfite reductase complex of Escherichia coli. J. Biol. Chem. 1999, 274, 10119–10128. [Google Scholar] [CrossRef] [Green Version]
- Choudhury, S.; Panda, P.; Sahoo, L.; Panda, S.K. Reactive oxygen species signaling in plants under abiotic stress. Plant Signal. Behav. 2013, 8, 23681. [Google Scholar] [CrossRef] [Green Version]
- Hancock, J.T.; Desikan, R.; Neill, S.J. Role of reactive oxygen species in cell signalling pathways. Biochem. Soc. Trans 2001, 29, 345–350. [Google Scholar] [CrossRef]
- Quan, L.-J.; Zhang, B.; Shi, W.-W.; Li, H.-Y. Hydrogen peroxide in plants: A versatile molecule of the reactive oxygen species network. J. Integr. Plant Biol. 2008, 50, 2–18. [Google Scholar] [CrossRef] [PubMed]
- Liu, N.; Lin, Z.; Guan, L.; Gaughan, G.; Lin, G. Antioxidant enzymes regulate reactive oxygen species during pod elongation in Pisum sativum and Brassica chinensis. PLoS ONE 2014, 9, e87588. [Google Scholar] [CrossRef] [PubMed] [Green Version]
- Del Río, L.A. ROS and RNS in plant physiology: An overview. J. Exp. Bot. 2015, 66, 2827–2837. [Google Scholar] [CrossRef] [PubMed] [Green Version]
- Turkan, I. ROS and RNS: Key signalling molecules in plants. J. Exp. Bot. 2018, 69, 3313–3315. [Google Scholar] [CrossRef] [Green Version]
- Wang, X.-S.; Han, J.-G. Changes of proline content, activity, and active isoforms of antioxidative enzymes in two alfalfa cultivars under salt stress. Agric. Sci. China 2009, 8, 431–440. [Google Scholar] [CrossRef]
- Janero, D.R. Malondialdehyde and thiobarbituric acid-reactivity as diagnostic indices of lipid peroxidation and peroxidative tissue injury. Free Radic. Biol. Med. 1990, 9, 515–540. [Google Scholar] [CrossRef]
- Davey, M.W.; Stals, E.; Panis, B.; Keulemans, J.; Swennen, R.L. High-throughput determination of malondiadehyde in plant tissues. Anal. Biochem. 2005, 347, 201–207. [Google Scholar] [CrossRef] [PubMed]
- NavariIzzo, F.; Quatacci, M.F.; Sgherri, C.L.M. Superoxide generation in relation to dehydratation and rehydration. Biochem. Soc. Trans 1996, 24, 447–450. [Google Scholar] [CrossRef] [PubMed] [Green Version]
- Ighodaro, O.M.; Akinloye, O.A. First line defence antioxidants-superoxide dismutase (SOD), catalase (CAT) and glutathione peroxidase (GPX): Their fundamental role in the entire antioxidant defence grid. Alex. J. Med. 2018, 54, 287–293. [Google Scholar] [CrossRef] [Green Version]
- Huseynova, I.M.; Aliyeva, D.R.; Aliyev, J.A. Subcellular localization and responses of superoxide dismutase isoforms in local wheat varieties subjected to continuous soil drought. Plant Physiol. Biochem. 2014, 81, 54–60. [Google Scholar] [CrossRef]
- Nicholls, P. Classical catalase: Ancient and modern. Arch. Biochem. Biophys. 2012, 525, 95–101. [Google Scholar] [CrossRef]
- Witlekens, H.; Inz, D.; Van Montagu, M.; Van Camp, W. Catalases in plants. Mol. Breed. 1995, 1, 207–228. [Google Scholar] [CrossRef]
- Mhamdi, A.; Queval, G.; Chaouch, S.; Vanderauwera, S.; Van Breusegem, F.; Noctor, G. Catalase function in plants: A focus on Arabidopsis mutants as stress-mimic models. J. Exp. Bot. 2010, 61, 4197–4220. [Google Scholar] [CrossRef] [PubMed] [Green Version]
- Palma, J.M.; Mateos, R.M.; Lopez-Jaramillo, J.; Rodríguez-Ruiz, M.; González-Gordo, S.; Lechuga-Sancho, A.M.; Corpas, F.J. Plant catalases as NO and H2S targets. Redox Biol. 2020, 34, 101525. [Google Scholar] [CrossRef]
- Bowler, C.; Van Montagu, M.; Inze, D. Superoxide dismutase and stress tolerance. Annu. Rev. Plant Physiol. Plant Mol. Biol. 1992, 43, 83–116. [Google Scholar] [CrossRef]
- Mhamdi, A.; Noctor, G.; Baker, A. Plant catalases: Peroxisomal redox guardians. Arch. Biochem. Biophys. 2012, 525, 181–194. [Google Scholar] [CrossRef]
- Garcia, R.; Kaid, N.; Vignaud, C.; Nicolas, J. Purification and some properties of catalase from wheat germ (Triticum aestivum L.). J. Agric. Food Chem. 2000, 48, 1050–1057. [Google Scholar] [CrossRef] [PubMed]
- Tyagi, S.; Shumayla; Madhu; Singh, K.; Upadhyay, K.S. Molecular characterization revealed the role of catalases under abiotic and arsenic stress in bread wheat (Triticum aestivum L.). J. Hazard. Mater. 2021, 403, 123585. [Google Scholar] [CrossRef] [PubMed]
- Isin, S.H.; Allen, R.D. Isolation and characterization of a pea catalase cDNA. Plant Mol. Biol. 1991, 17, 1263–1265. [Google Scholar] [CrossRef] [PubMed]
- Corpas, F.J.; Palma, J.M.; Sandalio, L.M.; López-Huertas, E.; Romero-Puertas, M.C.; Barroso, J.B.; Del Río, L.A. Purification of catalase from pea leaf peroxisomes: Identification of five different isoforms. Free Radic. Res. 1999, 31, 235–241. [Google Scholar] [CrossRef]
- Becana, M.; Moran, J.F.; Iturbe-Ormaetxe, I. Iron-dependent oxygen free radical generation in plants subjected to environment stress: Toxicity and antioxidant protection. Plant Soil 1998, 3, 137–147. [Google Scholar] [CrossRef] [Green Version]
- Wu, G.; Wilen, R.; Robertson, A.; Gusta, L. Isolation, chromosomal localization and differentional expression of mitochondrial manganese superoxide dismutase and chloroplastic copper/zinc superoxide dismutase genes in wheat. Plant Physiol. 1999, 120, 513–520. [Google Scholar] [CrossRef] [Green Version]
- Corpas, F.J.; Barroso, J.B.; Del Rio, L.A. Peroxisomes as a source of reactive oxygen species and nitric oxide signal molecules in plant cells. Trends Plant Sci. 2001, 8, 145–150. [Google Scholar] [CrossRef]
- Kirova, E.; Pecheva, D.; Simova-Stoilova, L. Drought response in winter wheat: Protection from oxidative stress and mutagenesis effect. Acta Physiol. Plant. 2021, 43, 8. [Google Scholar] [CrossRef]
- Wojtyla, Ł.; Garnczarska, M.; Zalewski, T.; Bednarski, W.; Ratajczak, L.; Jurga, S. A comparative study of water distribution, free radical production and activation of antioxidative metabolism in germinating pea seeds. J. Plant Physiol. 2006, 163, 1207–1220. [Google Scholar] [CrossRef] [PubMed]
- Bela, K.; Bangash, S.; Riyazuddin, A.K.; Csiszár, J. Plant glutathione peroxidases: Antioxidant enzymes in plant stress responses and tolerance. J. Plant Physiol. 2017, 176, 113–126. [Google Scholar] [CrossRef] [Green Version]
- Stephenie, S.; Chang, Y.P.; Gnanasekaran, A.; Esa, N.M.; Charles Gnanaraj, C. An insight on superoxide dismutase (SOD) from plants for mammalian health enhancement. J. Funct. Foods 2020, 68, 103917. [Google Scholar] [CrossRef]
- Pilla, A.; Fitzsimmons, R.; Muehsam, D.; Wu, J.; Rohde, C.; Casper, D. Electromagnetic fields as first messenger in biological signaling: Application to calmodulin-dependent signaling in tissue repair. Biochim. Biophys. Acta. 2011, 1810, 1236–1245. [Google Scholar] [CrossRef] [PubMed]
- Oschman, J.L. Energy Medicine: The scientific Basis, 2nd ed.; Elsivier: Amsterdam, The Netherlands, 2016; p. 392. [Google Scholar]
- Wang, H.; Zhang, X. Magnetic fields and reactive oxygen species. Int. J. Mol. Sci. 2017, 18, 2175. [Google Scholar] [CrossRef] [Green Version]
- Sarraf, M.; Kataria, S.; Taimourya, H.; Santos, L.O.; Menegatti, R.D.; Jain, M.; Ihtisham, M.; Liu, S. Magnetic field (MF) applications in plants: An overview. Plants 2020, 9, 1139. [Google Scholar] [CrossRef]
- Vian, A.; Davies, E.; Gendraud, M.; Bonnet, P. Plant responses to high frequency electromagnetic fields. BioMed Res. Int. 2016, 2016, 1830262. [Google Scholar] [CrossRef] [Green Version]
- Hajnorouzi, A.; Vaezzadeh, M.; Ghanati, F.; Jamnezhad, H.; Nahidian, B. Growth promotion and a decrease of oxidative stress in maize seedlings by a combination of geomagnetic and weak electromagnetic fields. J. Plant Physiol. 2011, 168, 1123–1128. [Google Scholar] [CrossRef]
- Sahebjamei, H.; Abdolmaleki, P.; Ghanati, F. Effects of magnetic field on the antioxidant enzyme activities of suspension-cultured tobacco cells. Bioelectromagnetics 2007, 28, 42–47. [Google Scholar] [CrossRef]
- Cifra, M.; Apollonio, F.; Liberti, M.; Garcia-Sanchez, T.; Mir, L.M. Possible molecular and cellular mechanisms at the basis of atmospheric electromagnetic field bioeffects. Int. J. Biometeorol. 2021, 65, 59–67. [Google Scholar] [CrossRef] [Green Version]
- Shine, M.B.; Guruprasad, K.N. Impact of pre-sowing magnetic field exposure of seeds to stationary magnetic field on growth, reactive oxygen species and photosynthesis of maize under field conditions. Acta Physiol. Plant. 2012, 34, 255–265. [Google Scholar] [CrossRef]
- Sleptsov, I.V.; Shashurin, M.M.; Zhuravskaya, A.N. Short-Term Impact of a Permanent Magnetic Field on the Physiological, Morphological, and biochemical characteristics of Amaranthus retroflexus, Agastache rugosa, and Thlaspi arvense seedlings. Russ. J. Plant Physiol. 2019, 66, 95–101. [Google Scholar] [CrossRef]
- Serdyukov, Y.A.; Novitskii, Y.I. Impact of weak permanent magnetic field on antioxidant enzyme activities in radish seedlings. Russ. J. Plant Physiol. 2013, 60, 69–76. [Google Scholar] [CrossRef]
- Cakmak, T.; Cakmak, Z.E.; Dumlupinar, R.; Tekinay, T. Analysis of apoplastic and symplastic antioxidant system in shallot leaves: Impacts of weak static electric and magnetic field. J. Plant Physiol. 2012, 169, 1066–1073. [Google Scholar] [CrossRef] [PubMed] [Green Version]
- Wang, H.Y.; Zeng, X.B.; Guo, S.Y.; Li, Z.T. Effects of magnetic field on the antioxidant defense system of recirculation-cultured Chlorella vulgaris. Bioelectromagnetics 2008, 29, 39–46. [Google Scholar] [CrossRef] [PubMed]
- Mittler, R. Oxidative stress, antioxidants and stress tolerance. Trends Plant Sci. 2002, 7, 405–410. [Google Scholar] [CrossRef]
- Liboff, A.R. Ion cyclotron resonance in biological systems: Experimental evidence. Biological Effects of Electromagnetic Fields In Biological Effects of Electromagnetic Fields: Mechanisms, Modeling, Biological Effects, Therapeutic Effects, International Standards, Exposure Criteria; Stavroulakis, P., Ed.; Springer: Berlin/Heidelberg, Germany, 2003; pp. 76–113. Available online: https://link.springer.com/book/10.1007/978-3-662-06079-7 (accessed on 1 June 2022).
- Lednev, V.V. Possible mechanism for the influence of weak magnetic fields on biological systems. Bioelectromagnetics 1991, 12, 71–75. [Google Scholar] [CrossRef]
- Binhi, V.N. Interference ion quantum states within a protein explains weak magnetic field effects in biosystems. Electro Magn. 1997, 16, 203–214. [Google Scholar] [CrossRef]
- Gilroy, S.; Białasek, M.; Suzuki, N.; Górecka, M.; Devireddy, A.; Karpiński, S.; Mittler, R. ROS, calcium, and electric signals: Key mediators of rapid systemic signaling in plants. Plant Physiol. 2016, 171, 1606–1615. [Google Scholar] [CrossRef]
- Yang, T.; Poovaiah, B.W. Hydrogen peroxide homeostasis: Activation of plant catalase by calcium/calmodulin. Proc. Natl. Acad. Sci. USA 2002, 99, 4097–4102. [Google Scholar] [CrossRef] [Green Version]
- Afiyanti, M.; Chen, H.J. Catalase activity is modulated by calcium and calmodulin in detached mature leaves of sweet potato. J. Plant Physiol. 2014, 171, 35–47. [Google Scholar] [CrossRef]
- Elhalel, G.; Price, C.; Fixler, D.; Shainberg, A. Cardioprotection from stress conditions by weak magnetic fields in the Schumann Resonance band. Sci. Rep. 2019, 9, 1645. [Google Scholar] [CrossRef] [Green Version]
- Tang, J.-Y.; Yeh, T.-W.; Huang, Y.-T.; Wang, M.-H.; Jang, L.-S. Effects of extremely low-frequency electromagnetic fields on B16F10 cancer cells. Electromagn. Biol. Med. 2019, 38, 149–157. [Google Scholar] [CrossRef]
- Polovinkina, E.O.; Kal’yasova, E.A.; Sinitsina, Y.V.; Veselov, A.P. Effect of weak pulse magnetic fields on lipid peroxidation and activities of antioxidant complex components in pea chloroplasts. Russ. J. Plant Physiol. 2011, 58, 1069–1073. [Google Scholar] [CrossRef]
- Santa-Cruz, D.M.; Pacienza, N.A.; Zilli, C.G.; Tomaro, M.L.; Balestrasse, K.B.; Yannarelli, G.G. Nitric oxide induces specific isoforms of antioxidant enzymes in soybean leaves subjected to enhanced ultraviolet-B radiation. J. Photochem. Photobiol. B 2014, 141, 202–209. [Google Scholar] [CrossRef] [PubMed]
- Shishova, M.F.; Yemelyanov, V.V. Proteome and lipidome of plant cell membranes during development. Russ. J. Plant Physiol. 2021, 68, 800–817. [Google Scholar] [CrossRef]
- Feki, K.; Kamoun, Y.; Mahmoud, R.B.; Farhat-Khemakhem, A.; Gargouri, A.; Brini, F. Multiple abiotic stress tolerance of the transformants yeast cells and the transgenic Arabidopsis plants expressing a novel durum wheat catalase. Plant Physiol. Biochem. 2015, 97, 420–431. [Google Scholar] [CrossRef] [PubMed]
- Mouritsen, H.; Ritz, T. Magnetoreception and its use in bird navigation. Curr. Opin. Neurobiol. 2005, 15, 406–414. [Google Scholar] [CrossRef]
- Sukhov, V.; Sukhova, E.; Sinitsyna, Y.; Gromova, E.; Mshenskaya, N.; Ryabkova, A.; Ilin, N.; Vodeneev, V.; Mareev, E.; Price, C. Influence of magnetic field with schumann resonance frequencies on photosynthetic light reactions in wheat and pea. Cells 2021, 10, 149. [Google Scholar] [CrossRef]
- Kumar, G.M.; Knowles, N.R. Changes in lipid peroxidation and lipolytic and free-radical scavenging enzyme activities during aging and sprouting of potato (Solanum tuberosum) seed-tubers. Plant Physiol. 1993, 102, 115–124. [Google Scholar] [CrossRef] [Green Version]
- Giannopolitis, C.N.; Ries, S.K. Superoxide dismutases: I. Occurrence in higher plants. Plant Physiol. 1977, 59, 309–314. [Google Scholar] [CrossRef] [PubMed]
- Patterson, B.D.; Payne, L.A.; Chen, Y.Z.; Graham, D. An inhibitor of catalase induced by cold in chilling-sensitive plants. Plant Physiol. 1984, 76, 1014–1018. [Google Scholar] [CrossRef] [Green Version]
- Bittner, N.; Trauer-Kizilelma, U.; Hilker, M. Early plant defence against insect attack: Involvement of reactive oxygen species in plant responses to insect egg deposition. Planta 2017, 245, 993–1007. [Google Scholar] [CrossRef]
- Lowry, O.H.; Rosebrough, N.J.; Farr, A.L.; Randall, R.J. Protein measurement with the Folin phenol reagent. J. Biol. Chem. 1951, 193, 265–275. [Google Scholar] [CrossRef]
- Davis, B.J. Disc electrophoresis. II. Method and application to human serum proteins. Ann. N. Y. Acad. Sci. 1964, 121, 404–427. [Google Scholar] [CrossRef]
- Srivalli, B.; Khanna-Chopra, R. Induction of new isoforms of superoxide dismutase and catalase enzymes in the flag leaf of wheat during monocarpic senescence. Biochem. Biophys. Res. Commun. 2001, 288, 1037–1042. [Google Scholar] [CrossRef]
- Folch, J.; Lees, M.; Sloane-Stanley, G.H. A Simple method for the isolation and purification of total lipides from animal tissues. J. Biol. Chem. 1957, 226, 497–509. [Google Scholar] [CrossRef]
- Vitello, F.; Zanetta, J.-P. Thin-layer chromatography of phospholipids. J. Chromatogr. A 1978, 166, 637–640. [Google Scholar] [CrossRef]


| Investigated Parameter | Object | Frequency | 7.8 Hz | 14.3 Hz | 20.8 Hz |
|---|---|---|---|---|---|
| SHORT-TIME | |||||
| Catalase activity, µM H2O2/min×mg of protein | Wheat | control | 17.84 ± 2.05 | 15.89 ± 1.1 | 23.44 ± 1.37 |
| MF | 16.24 ± 1.02 | 26.09 ± 1.38 * | 27.95 ± 2.49 * | ||
| Pea | control | 24.32 ± 2.72 | 18.4 ± 3.63 | 26.65 ± 0.71 | |
| MF | 25.73 ± 1.36 | 21.29 ± 1.89 | 23.61 ± 0.68 | ||
| SOD activity, r.u/mg of protein | Wheat | control | 1.1 ± 0.41 | 0.61 ± 0.15 | 2.45 ± 0.51 |
| MF | 0.81 ± 0.14 | 0.51 ± 0.11 | 1.92 ± 0.27 | ||
| Pea | control | 0.42 ± 0.05 | 1.25 ± 0.11 | 1.84 ± 0.08 | |
| MF | 0.44 ± 0.04 | 1.02 ± 0.14 | 1.87 ± 0.17 | ||
| MDA, µM/g of dry weight | Wheat | control | 110.4 ± 1.11 | 136.78 ± 9.25 | 102.05 ± 1.2 |
| MF | 123.11 ± 1.42 * | 147.27 ± 7.36 | 83.45 ± 1.31 * | ||
| Pea | control | 235.87 ± 30.12 | 215.05 ± 9.42 | 177.68 ± 11.92 | |
| MF | 275.83 ± 8.54 | 195.41 ± 13.92 | 227.91 ± 27.11 | ||
| LONG-TIME | |||||
| Catalase activity, µM H2O2/min×mg of protein | Wheat | control | 20.75 ± 1.03 | 19.24 ± 0.92 | 29.62 ± 1.69 |
| MF | 19.85 ± 0.88 | 20.9 ± 1.06 | 33.8 ± 1.61 * | ||
| Pea | control | 14.68 ± 0.42 | 22.07 ± 0.86 | 27.98 ± 0.74 | |
| MF | 14.83 ± 0.51 | 17.56 ± 0.99 * | 26.73 ± 1.49 | ||
| SOD activity, r.u/mg of protein | Wheat | control | 2.53 ± 0.36 | 5.24 ± 0.5 | 6.69 ± 0.86 |
| MF | 3.19 ± 0.58 | 4.09 ± 0.25 | 4.59 ± 0.68 | ||
| Pea | control | 5.77 ± 1.13 | 3.98 ± 0.55 | 6.99 ± 0.82 | |
| MF | 3.3 ± 1.13 | 4.03 ± 0.72 | 12.47 ± 5.97 | ||
| MDA, µM/g of dry weight | Wheat | control | 168.19 ± 12.26 | 133.75 ± 8.05 | 100.00 ± 5.67 |
| MF | 182.69 ± 21.20 | 139.02 ± 6.55 | 104.06 ± 4.73 | ||
| Pea | control | 224.10 ± 13.01 | 176.06 ± 16.38 | 271.11 ± 15.89 | |
| MF | 231.65 ± 16.10 | 202.20 ± 17.85 | 260.46 ± 16.23 | ||
| Object | Isoform | Control | 7.8 Hz | 14.3 Hz | 20.8 Hz |
|---|---|---|---|---|---|
| SHORT-TIME | |||||
| Wheat | Mn-SOD | 13.6 ± 1.3 | 9.8 ± 0.3 | 7.3 ± 1.2 | 8.2 ± 0.9 |
| Fe-SOD | 45.8 ± 0.2 | 46.7 ± 0.2 | 47.4 ± 1.3 | 46.6 ± 2.1 | |
| SOD-3 | 43.5.0 ± 1.1 | 43.4 ± 0.4 | 45.2 ± 0.1 | 45.2 ± 3.0 | |
| Pea | Mn-SOD | 26.7 ± 3.0 | 24.9 ± 2.4 | 23.7 ± 1.2 | 27.4 ± 2.0 |
| Fe-SOD | 44.0 ± 2.6 | 44.2 ± 2.0 | 40.3 ± 3.2 | 38.8 ± 2.1 | |
| SOD-3 | 29.3 ± 0.5 | 30.9 ± 4.4 | 36.0 ± 1.9 | 33.8 ± 0.1 | |
| LONG-TIME | |||||
| Wheat | Mn-SOD | 6.1 ± 1.1 | 8.8 ± 2.2 * | 5.2 ± 0.7 | 11.3 ± 1.2 * |
| Fe-SOD | 41.1 ± 1.3 | 30.8 ± 4.7 | 38.3 ± 1.3 | 44.6 ± 3.5 | |
| SOD-3 | 52.8 ± 1.2 | 60.3 ± 3.4 | 56.5 ± 1.5 | 44 ± 2.8 | |
| Pea | Mn-SOD | 34.8 ± 3.2 | 27.7 ± 1.2 | 37.3 ± 3.6 | 39.1 ± 1.3 |
| Fe-SOD | 34 ± 2.8 | 36.4 ± 1.6 | 36.5 ± 0.9 | 30.8 ± 1.4 | |
| SOD-3 | 31.2 ± 1.2 | 35.9 ± 0.8 | 26.2 ± 2.8 | 30 ± 1.2 | |
Publisher’s Note: MDPI stays neutral with regard to jurisdictional claims in published maps and institutional affiliations. |
© 2022 by the authors. Licensee MDPI, Basel, Switzerland. This article is an open access article distributed under the terms and conditions of the Creative Commons Attribution (CC BY) license (https://creativecommons.org/licenses/by/4.0/).
Share and Cite
Mshenskaya, N.; Sinitsyna, Y.; Kalyasova, E.; Valeria, K.; Zhirova, A.; Karpeeva, I.; Ilin, N. Influence of Schumann Range Electromagnetic Fields on Components of Plant Redox Metabolism in Wheat and Peas. Plants 2022, 11, 1955. https://doi.org/10.3390/plants11151955
Mshenskaya N, Sinitsyna Y, Kalyasova E, Valeria K, Zhirova A, Karpeeva I, Ilin N. Influence of Schumann Range Electromagnetic Fields on Components of Plant Redox Metabolism in Wheat and Peas. Plants. 2022; 11(15):1955. https://doi.org/10.3390/plants11151955
Chicago/Turabian StyleMshenskaya, Natalia, Yulia Sinitsyna, Ekaterina Kalyasova, Koshcheeva Valeria, Anastasia Zhirova, Irina Karpeeva, and Nikolay Ilin. 2022. "Influence of Schumann Range Electromagnetic Fields on Components of Plant Redox Metabolism in Wheat and Peas" Plants 11, no. 15: 1955. https://doi.org/10.3390/plants11151955
APA StyleMshenskaya, N., Sinitsyna, Y., Kalyasova, E., Valeria, K., Zhirova, A., Karpeeva, I., & Ilin, N. (2022). Influence of Schumann Range Electromagnetic Fields on Components of Plant Redox Metabolism in Wheat and Peas. Plants, 11(15), 1955. https://doi.org/10.3390/plants11151955