Article

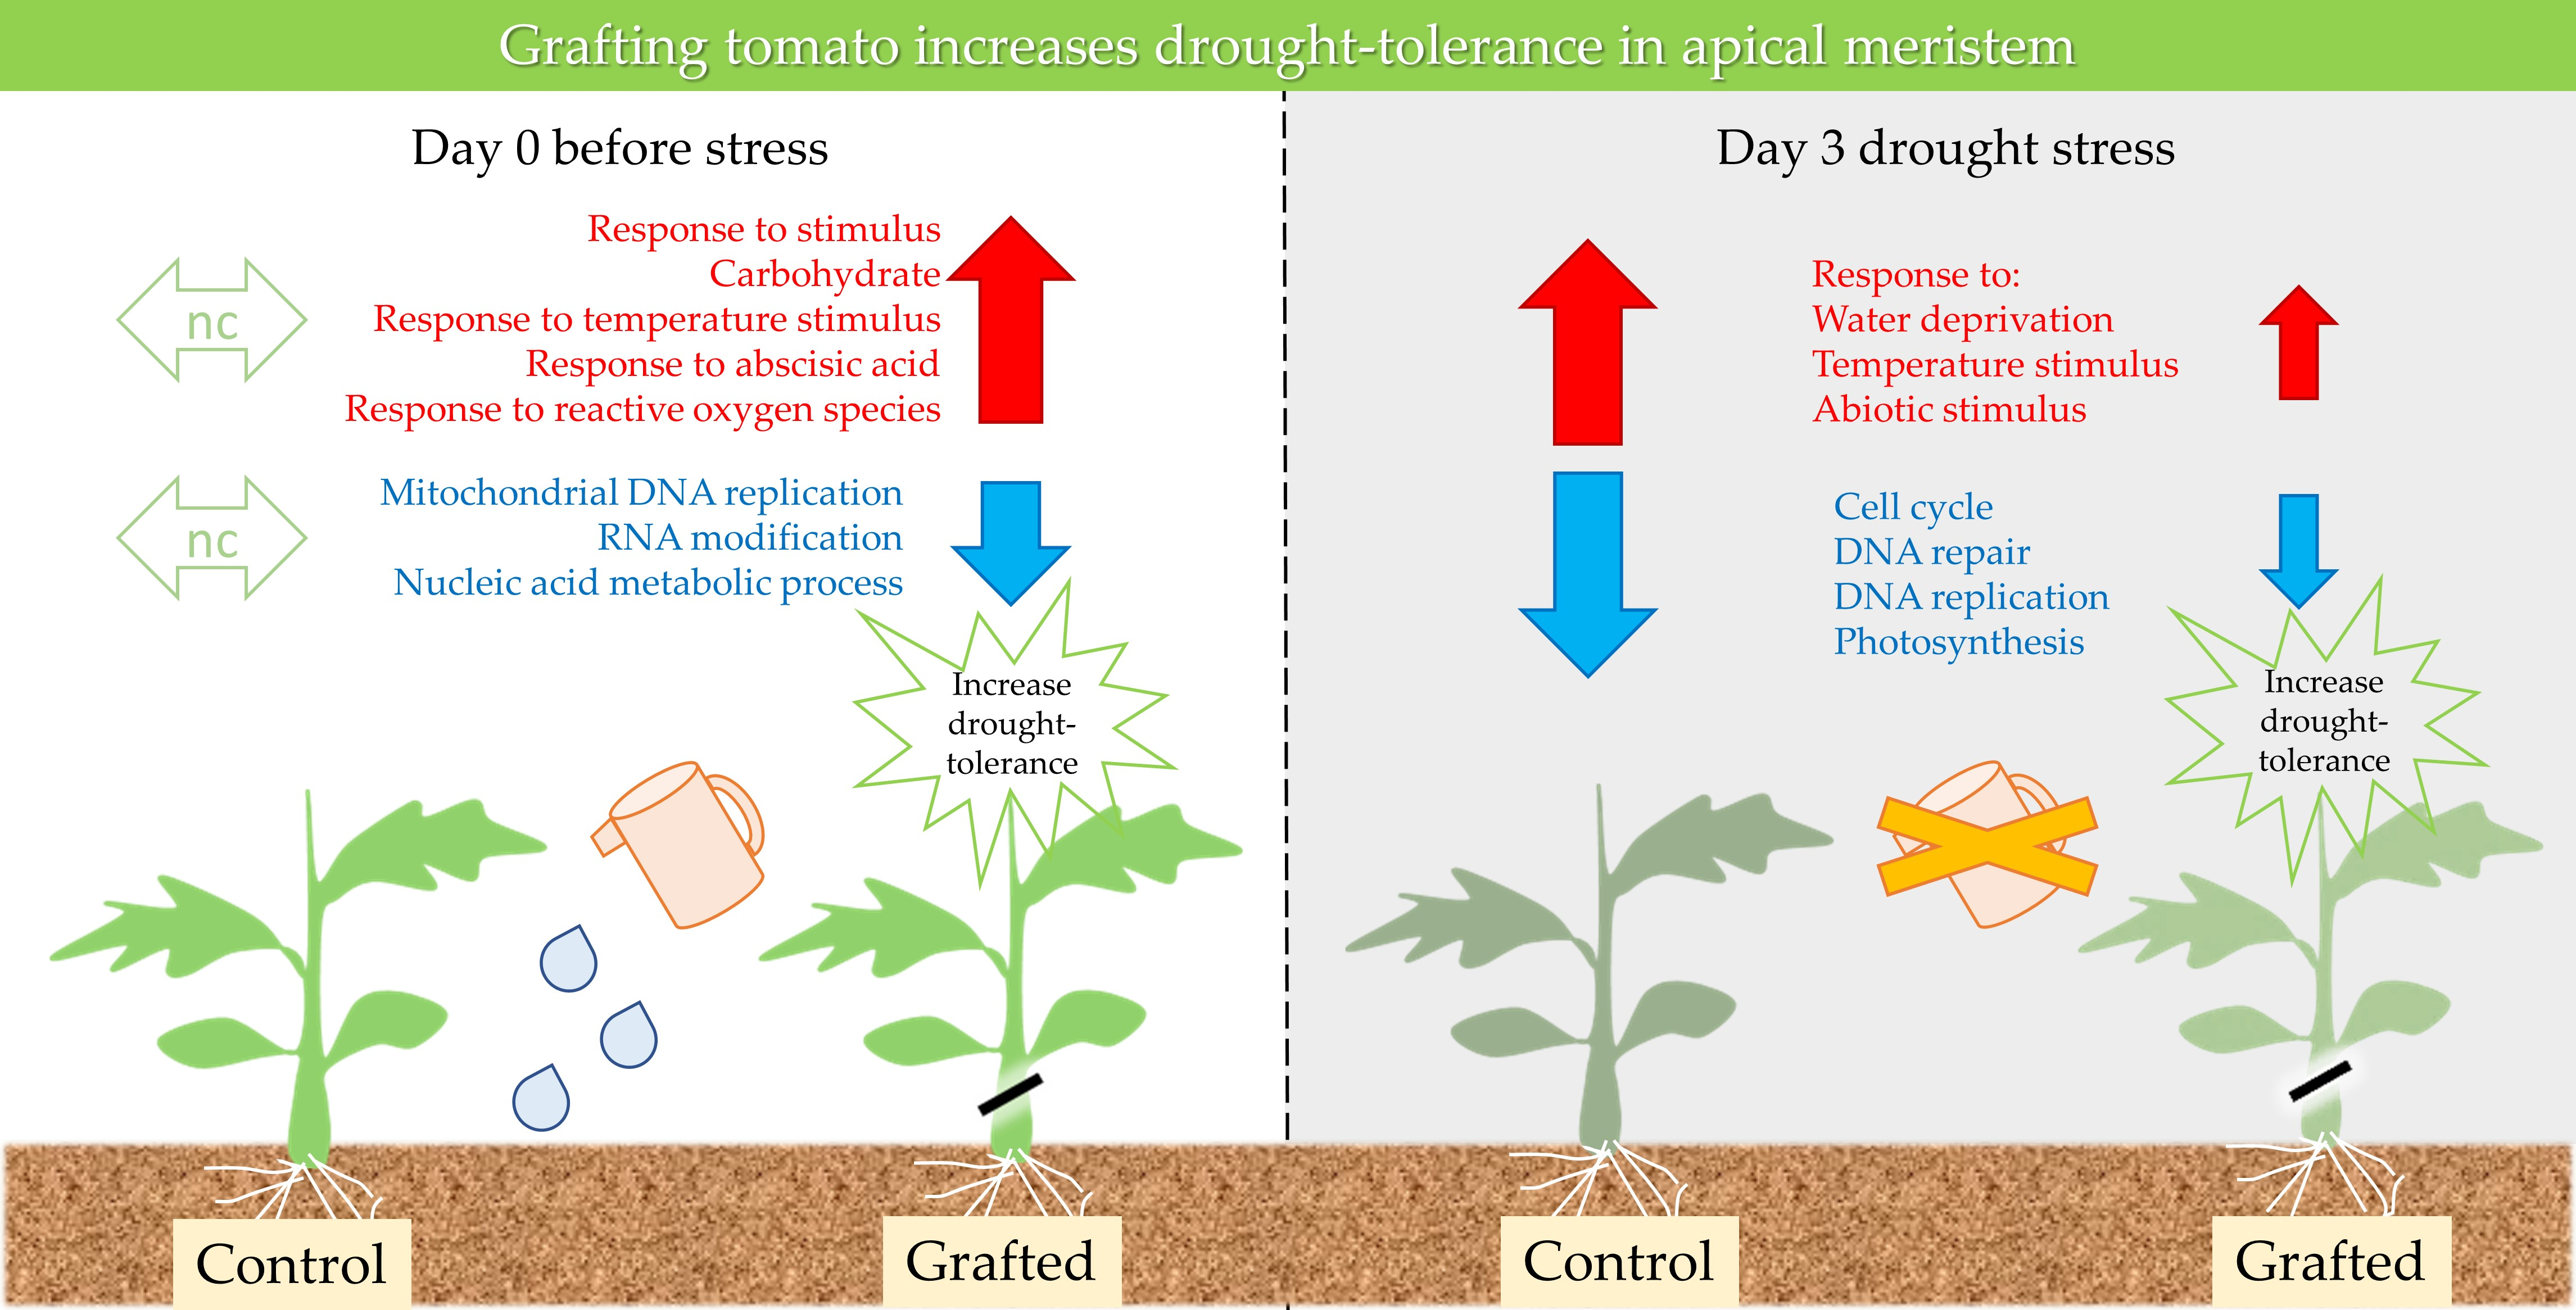
Comparative Transcriptome Analysis of Grafted Tomato with Drought Tolerance

by
Maria Isabel Fuentes-Merlos
*,
Masaru Bamba
,
Shusei Sato
and
Atsushi Higashitani
*
Graduate School of Life Sciences, Tohoku University, Sendai 980-8577, Japan
*
Authors to whom correspondence should be addressed.
Plants 2022, 11(15), 1947; https://doi.org/10.3390/plants11151947
Submission received: 9 June 2022 / Revised: 20 July 2022 / Accepted: 25 July 2022 / Published: 27 July 2022
(This article belongs to the Special Issue Physiological and Molecular Mechanisms of Plant Grafting)

Abstract

:
Grafting is a method used in agriculture to improve crop production and tolerance to biotic and abiotic stress. This technique is widely used in tomato, Solanum lycopersicum L.; however, the effects of grafting on changes in gene expression associated with stress tolerance in shoot apical meristem cells are still under-discovered. To clarify the effect of grafting, we performed a transcriptomic analysis between non-grafted and grafted tomatoes using the tomato variety Momotaro-scion and rootstock varieties, TD1, GS, and GF. Drought tolerance was significantly improved not only by a combination of compatible resistant rootstock TD1 but also by self-grafted compared to non-grafted lines. Next, we found the differences in gene expression between grafted and non-grafted plants before and during drought stress treatment. These altered genes are involved in the regulation of plant hormones, stress response, and cell proliferation. Furthermore, when comparing compatible (Momo/TD1 and Momo/Momo) and incompatible (Momo/GF) grafted lines, the incompatible line reduced gene expression associated with phytohormones but increased in wounding and starvation stress-response genes. These results conclude that grafting generates drought stress tolerance through several gene expression changes in the apical meristem.

Graphical Abstract

1. Introduction

Drought stress causes damage to crop plants, generating economic and production losses. Grafting is a method used in agriculture that improves crop production and biotic and abiotic stress tolerance through water and nutrient uptake enhancement [1,2]. This technique consists in connecting the shoot or “scion” and the root or “rootstock”, ensuring that the compatibility of the graft combinations is successful [3].
Previous studies have established critical parameters for graft formation, including cell adhesion, division, proliferation, and vascular reconnections [4]. In addition, plant hormones such as auxins, cytokinin, and gibberellins, play an essential role in cell proliferation at the graft junction, aiding in the correct progression of vascular reconnection mechanisms. Auxin plays an essential role in cell proliferation and vascular reconnection in the graft junction [5,6]. Ethylene and cytokinin have a minor contribution to the phloem reconnection [5]. Gibberellin is involved in expanding cortex cells in the vascular tissue [6]. Several studies have elucidated graft union formation; however, research on stress-tolerance mechanisms is still in progress.
Grafted Solanaceae and Cucurbitaceae crop plants have been recently used for grafting, becoming essential for stress-tolerance studies [7]. For example, in tomato (Solanum lycopersicum) plants, many studies have reported improved fruit yield, quality, and resistance to biotic and abiotic stress [1,7,8,9]. Severe drought stress causes a reduction of photosynthesis rate and root activity, and, under mild stress, water deficiency increases total carotenoid and vitamin C content in the tomato fruit [10,11]. The reduction of photosynthesis is related to the abscisic acid (ABA) signaling pathway, where this hormone regulates the stomatal closure, decreasing the CO2 uptake in leaves [12]. ABA activity activates a signaling pathway that triggers reactive oxygen species (ROS) production. As a result, several antioxidant systems are activated, such as ROS scavenger enzymes and antioxidant molecules, such as ascorbate peroxidase (APX) and vitamin C [13,14].
Momotaro tomato varieties, including “Momotaro peace” (Momo), are bred and cultivated in greenhouse and fields in Japan and are mainly known for their sweetness, hardiness, and flavor [15]. In addition, grafts of this variety have been widely used to increase biotic and abiotic stress tolerance and tomato fruit quality and yield [16]. However, the molecular basis and effects of grafting on drought stress tolerance are still under investigation. Therefore, this study presents transcriptional alterations on shoot apical meristem by grafting. In addition, we assessed whether vigorous rootstock and grafted Momo could improve drought tolerance by transcriptomic analysis between grafted and non-grafted lines.

2. Results

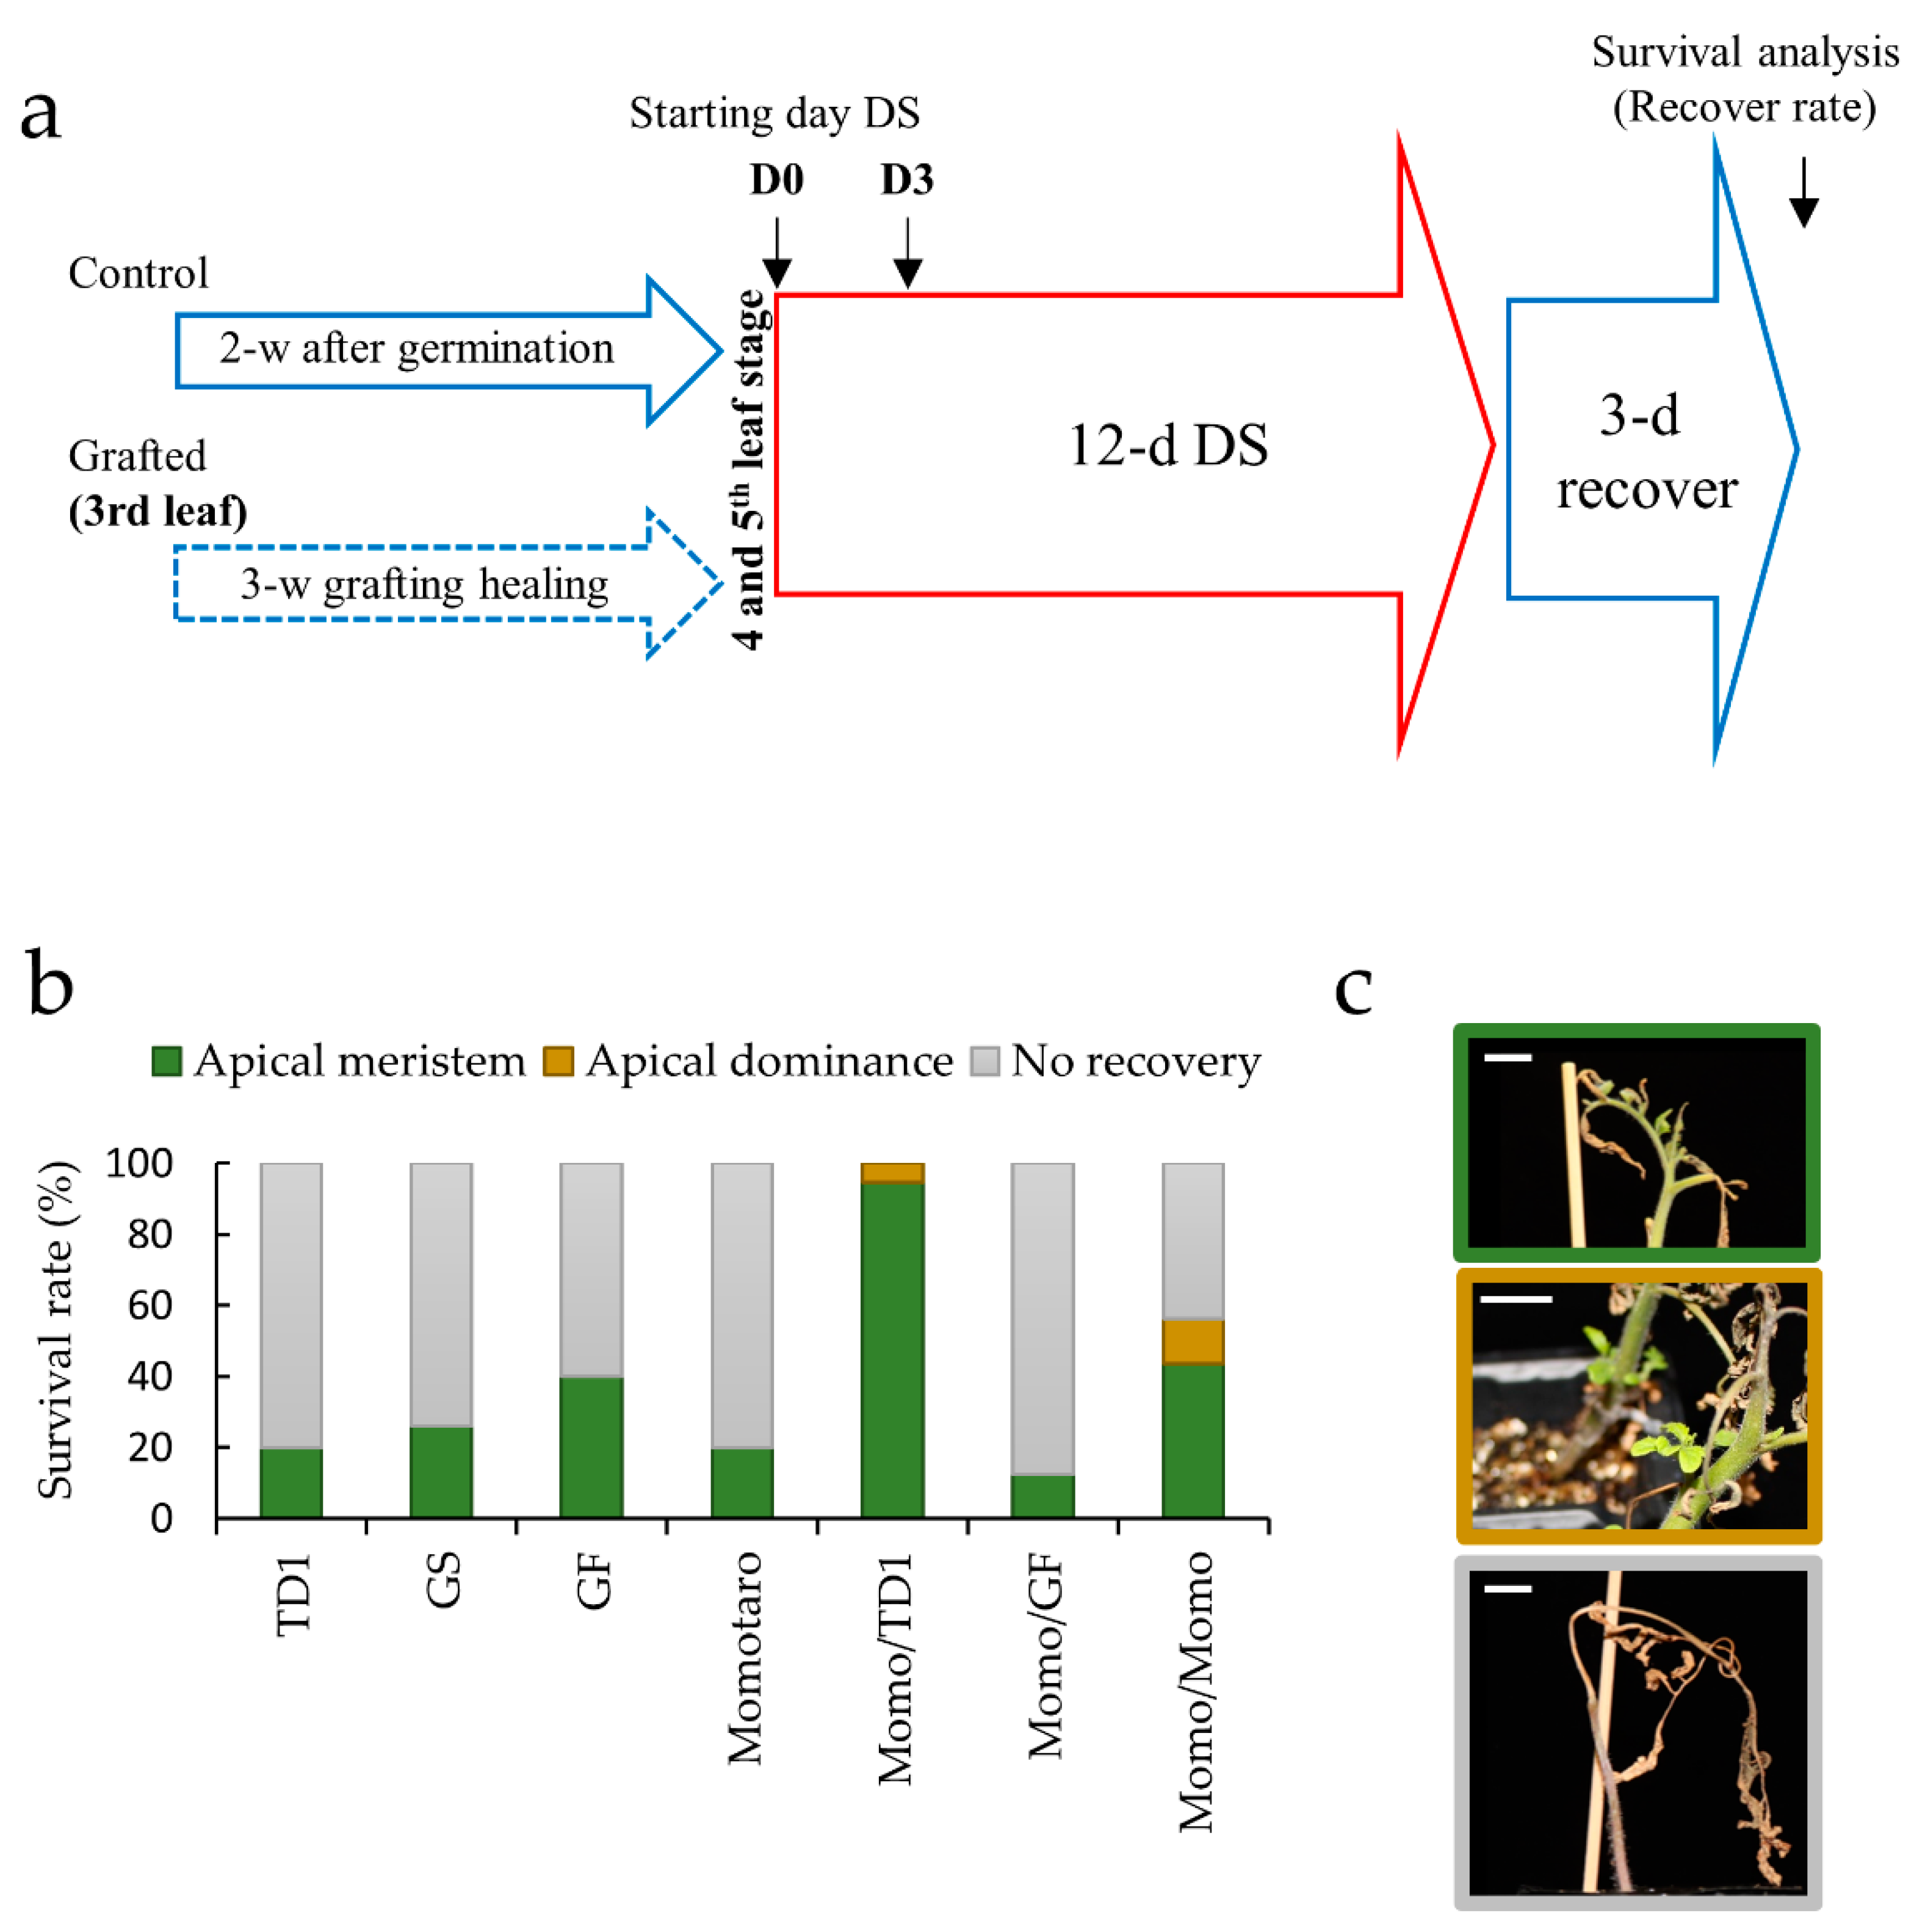
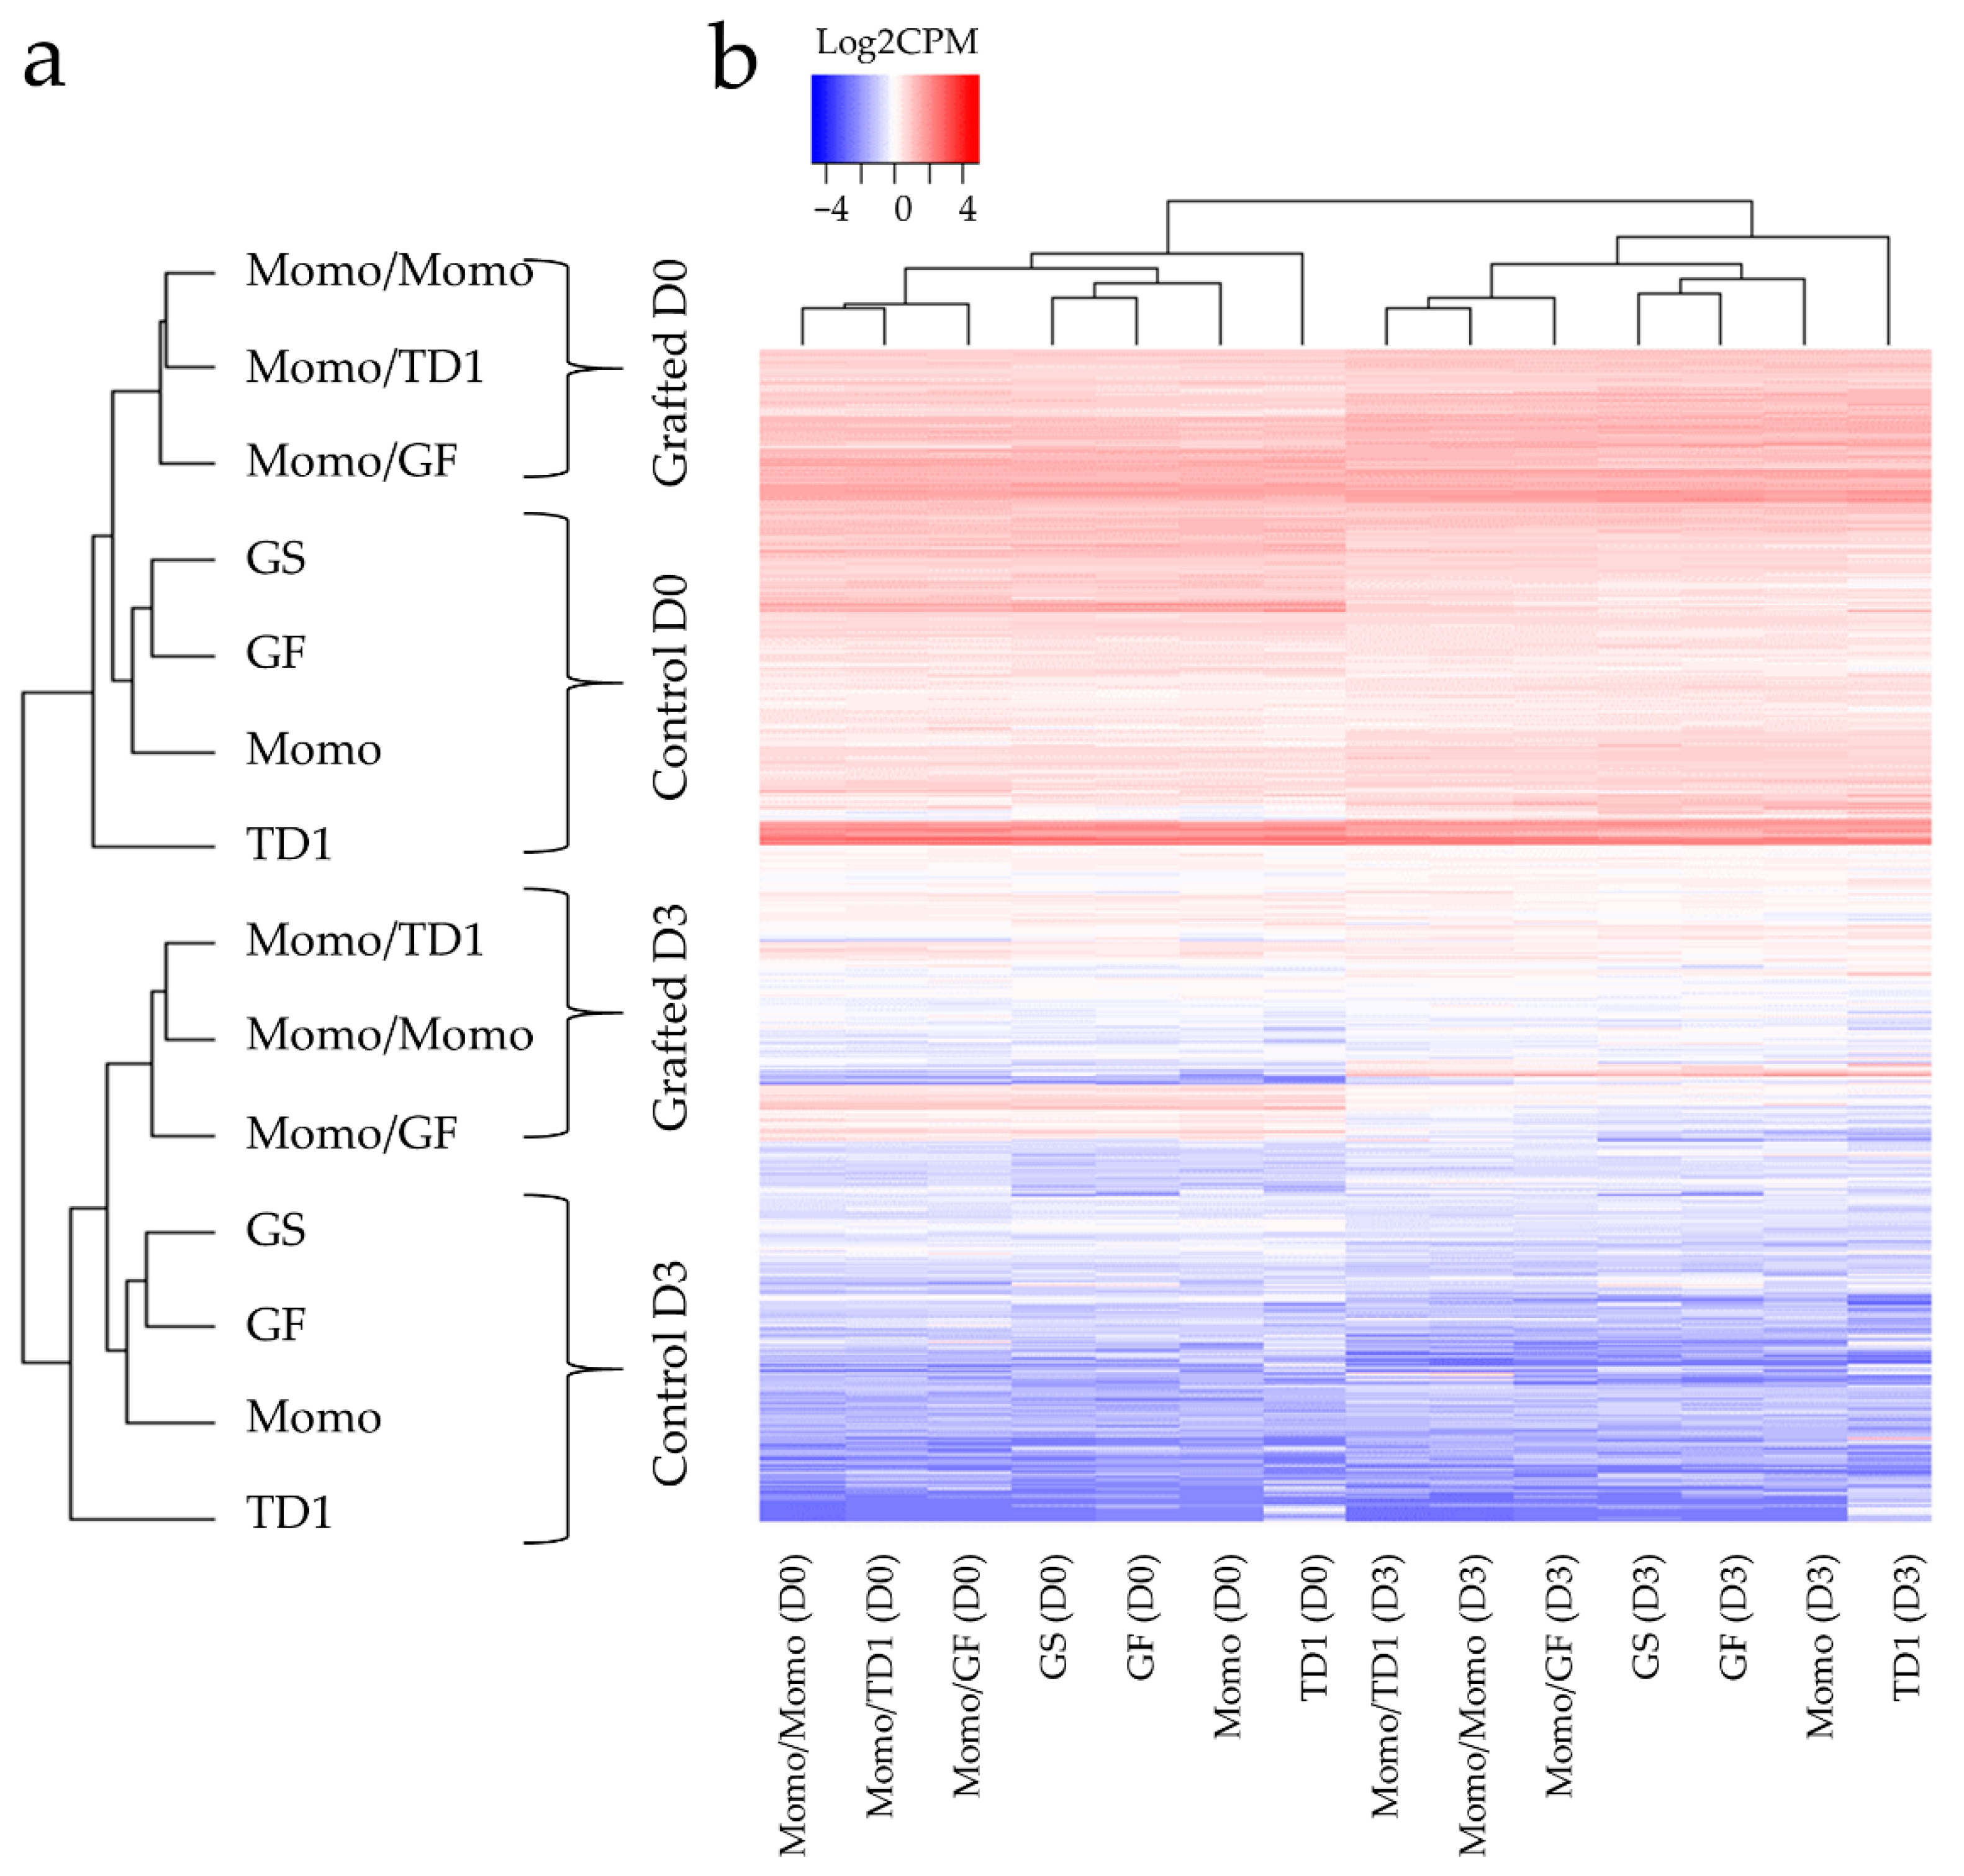
2.1. Identification of Tissue Types Involved in the Recovery of Drought-Tolerant Grafted Lines

To determine the effect of grafting on drought stress in the Momo shoot apical meristem, two different homo-grafted lines, Momo-scion and green force rootstock (Momo/GF) and Momo-scion and TTM-079 rootstock (Momo/TD1), and a self-grafted line (Momo/Momo) were used as compared with the non-grafted lines, GF, TD1, green guard (GS), and Momo. All lines were subjected to 12 d of drought stress treatment by withholding water (Figure 1a). Only the Momo/TD1 plants demonstrated a 100% recovery rate, whereas the control lines had a recovery ratio of less than 40% (Figure 1b). Interestingly, the self-grafted Momo/Momo were more resistant to drought stress (56% recovery ratio) than non-grafted Momo (20% recovery ratio). It was shown that grafting results in drought stress tolerance regardless of root varieties. Additionally, these grafted lines showed recovery from apical meristems or axillary buds, which were thought to have reduced their apical dominance (Figure 1c). On the other hand, the homo-grafted Momo/GF decreased resistance (less than 20% from 40% of GF control) and showed no recovery from the axillary buds, which could have been due to graft incompatibility.

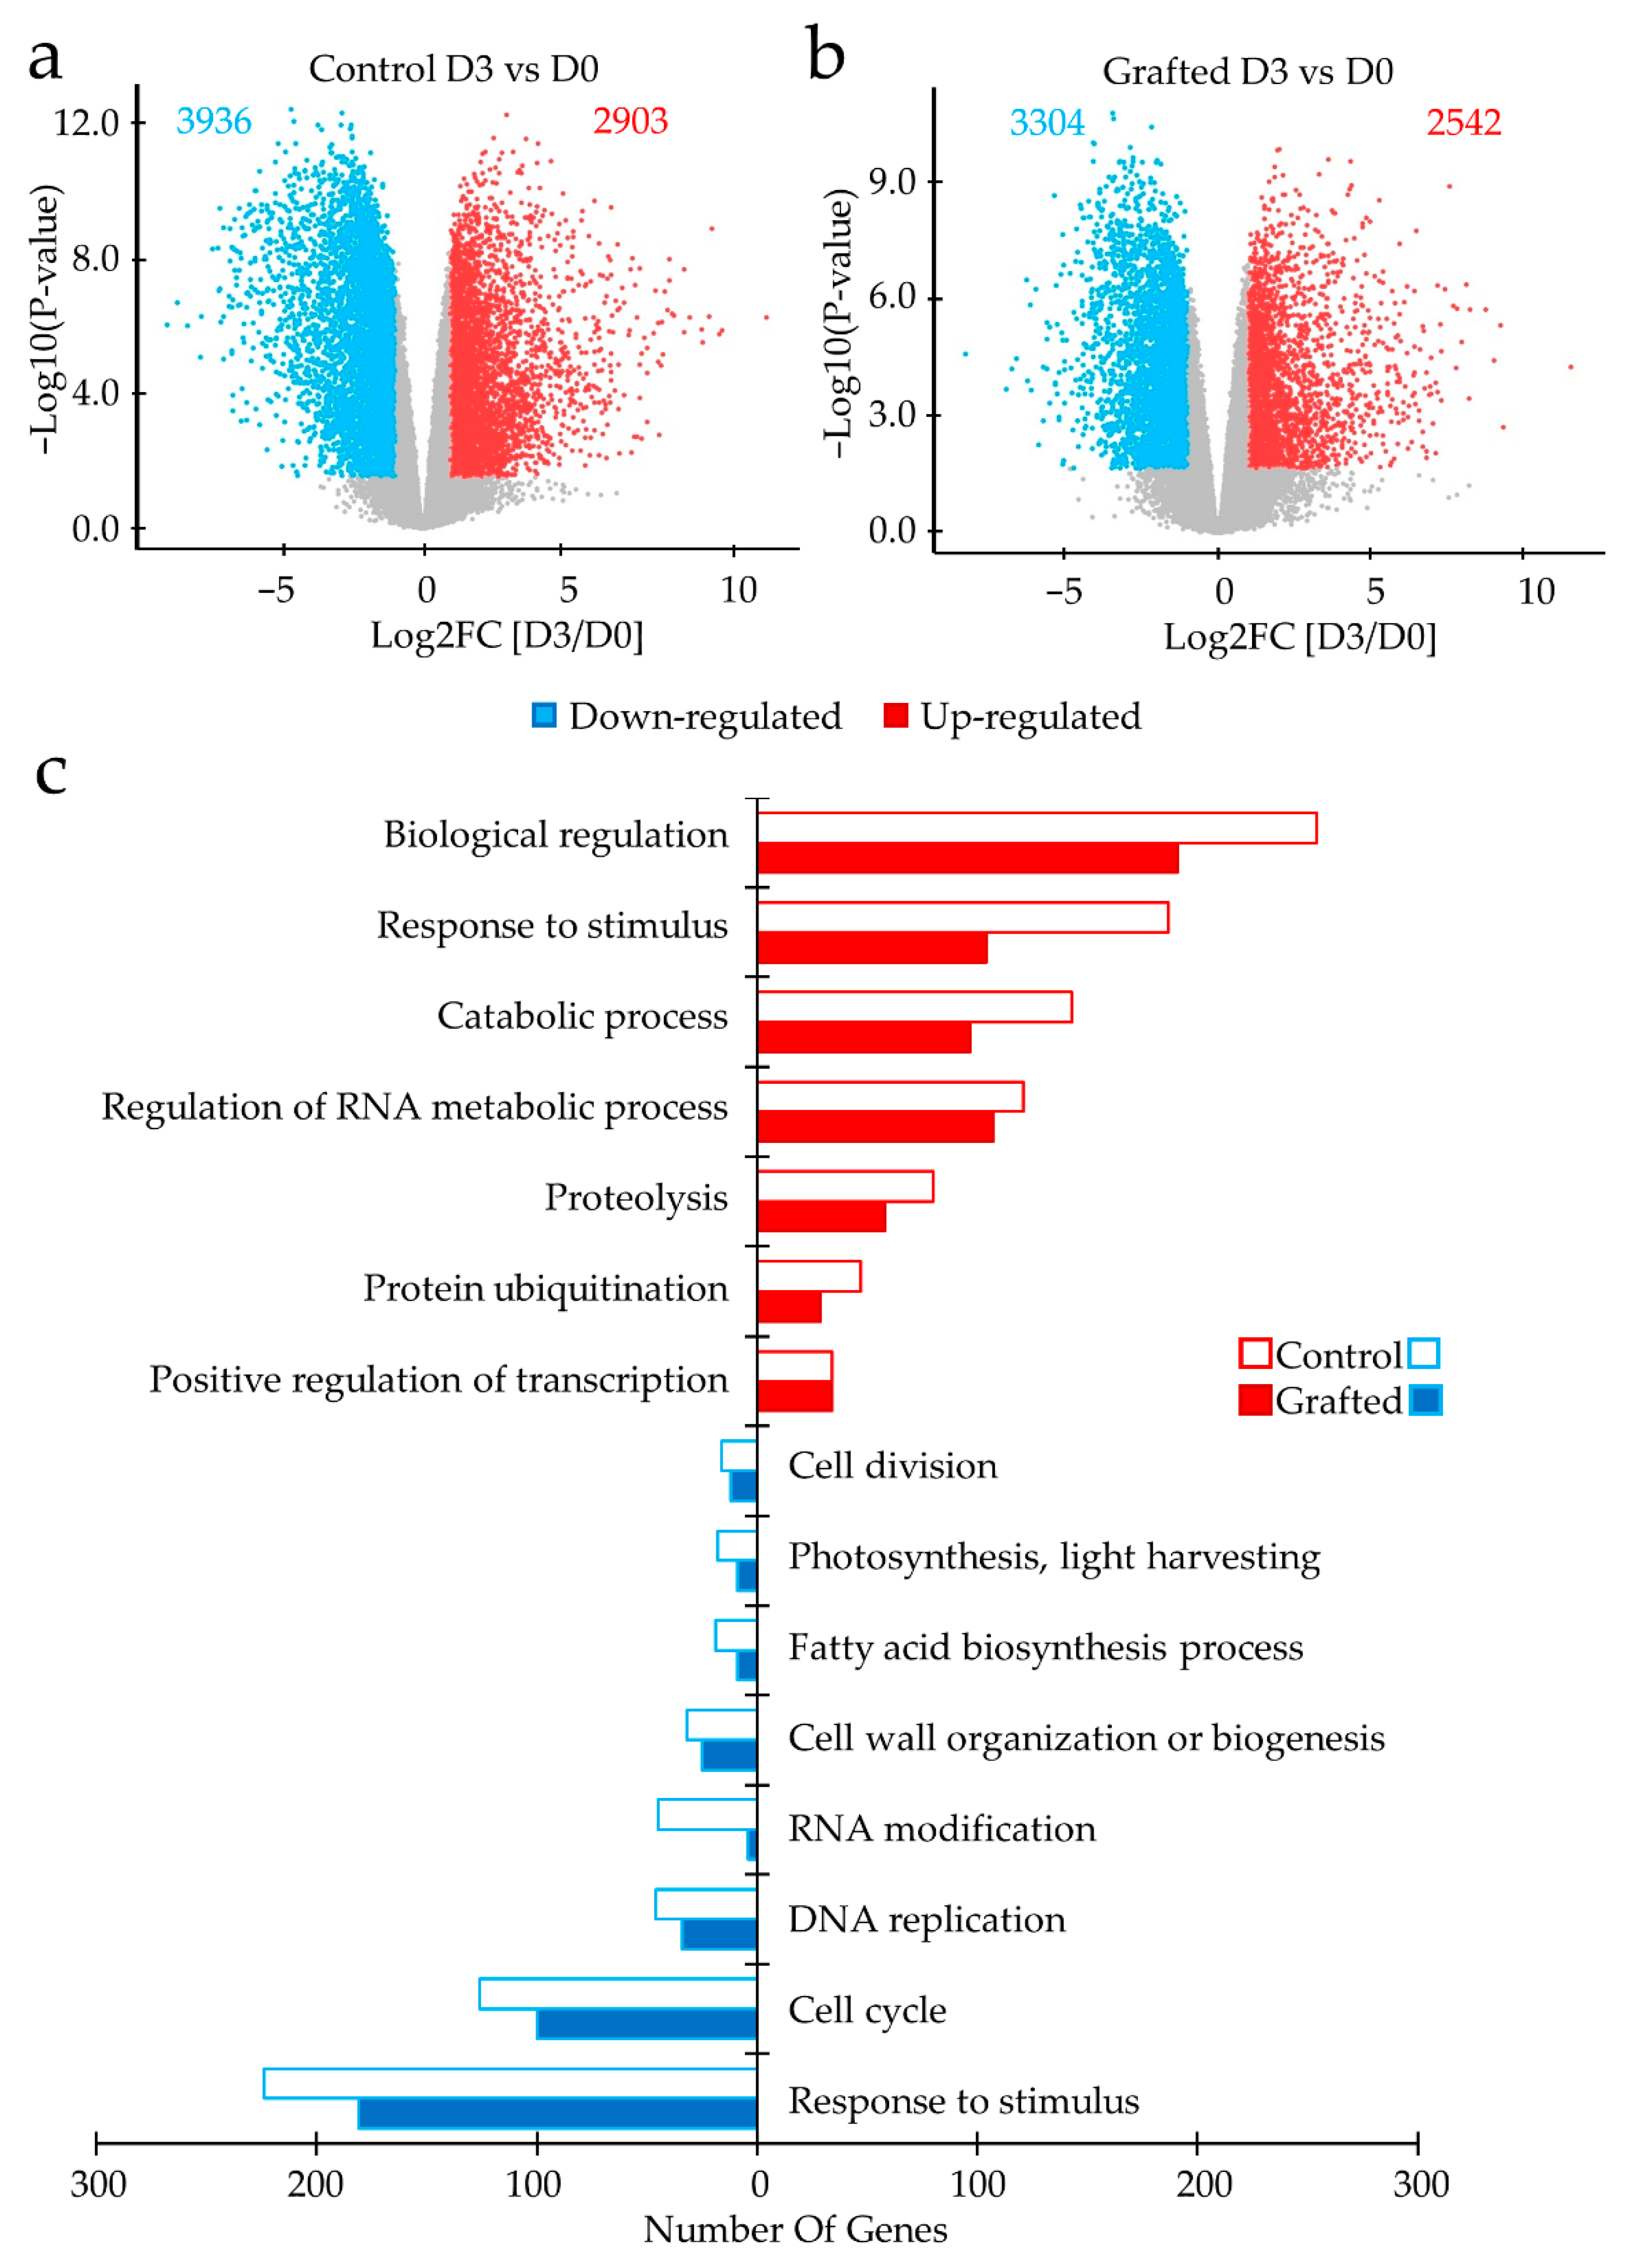
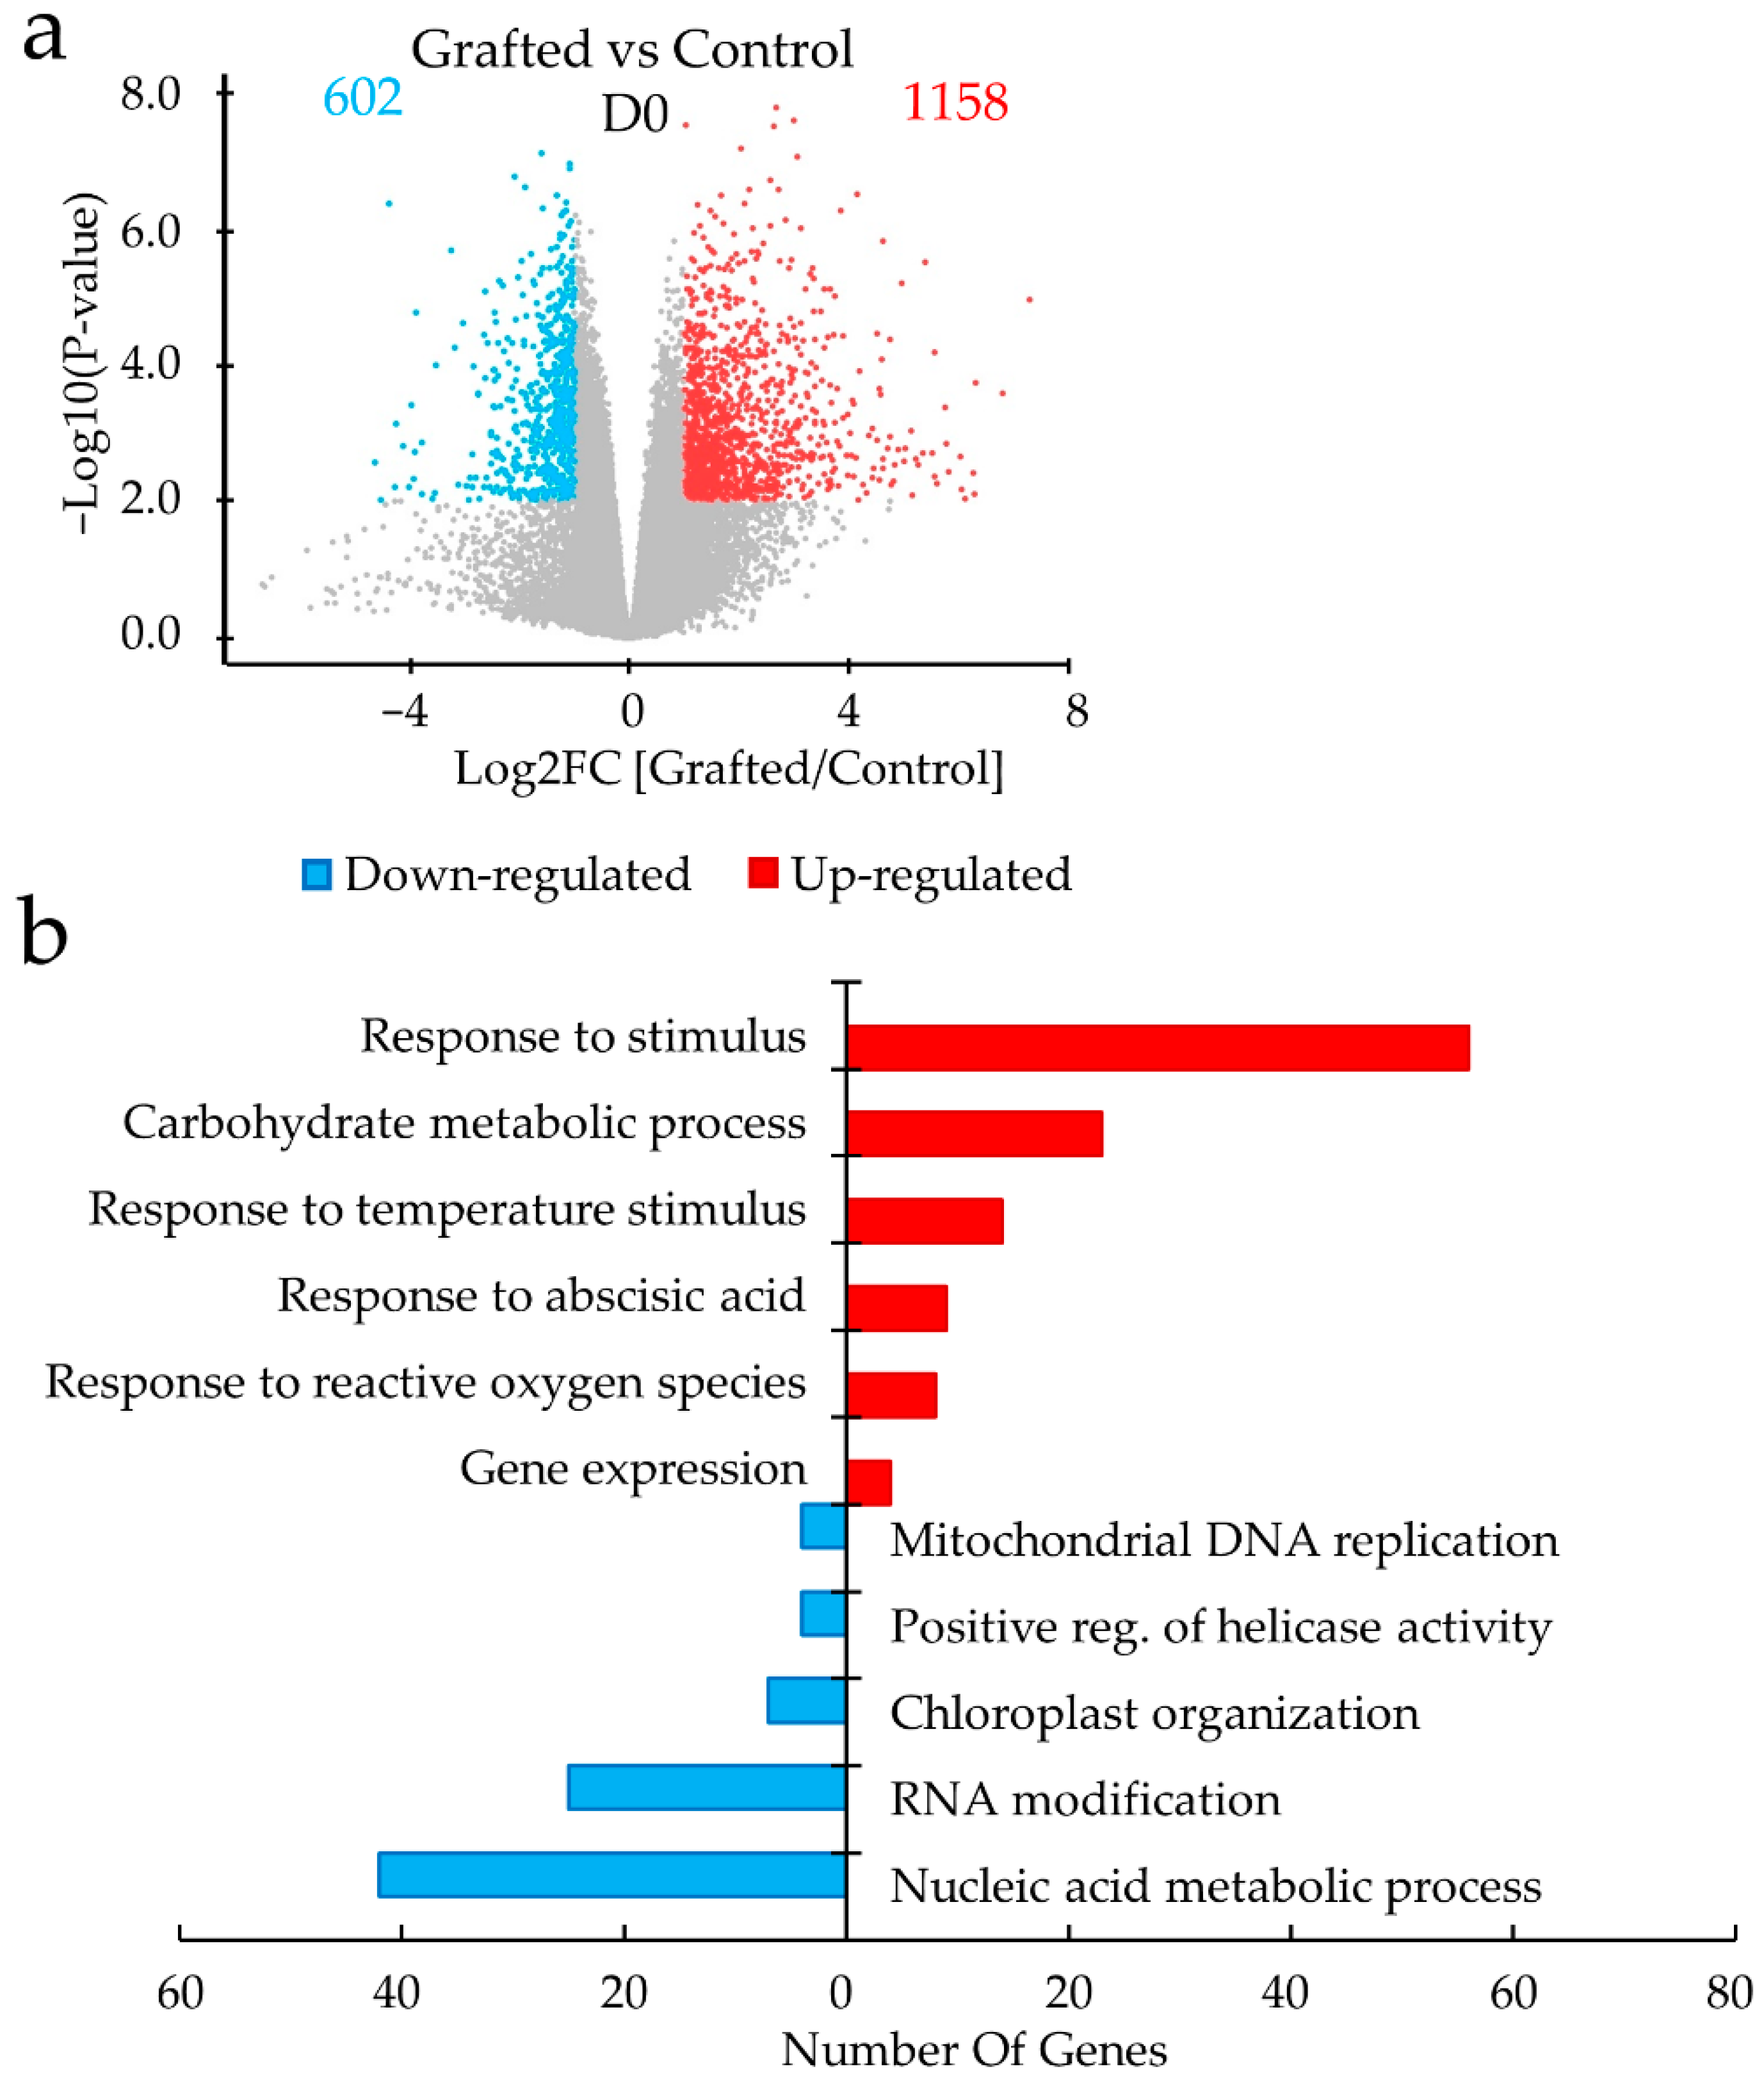
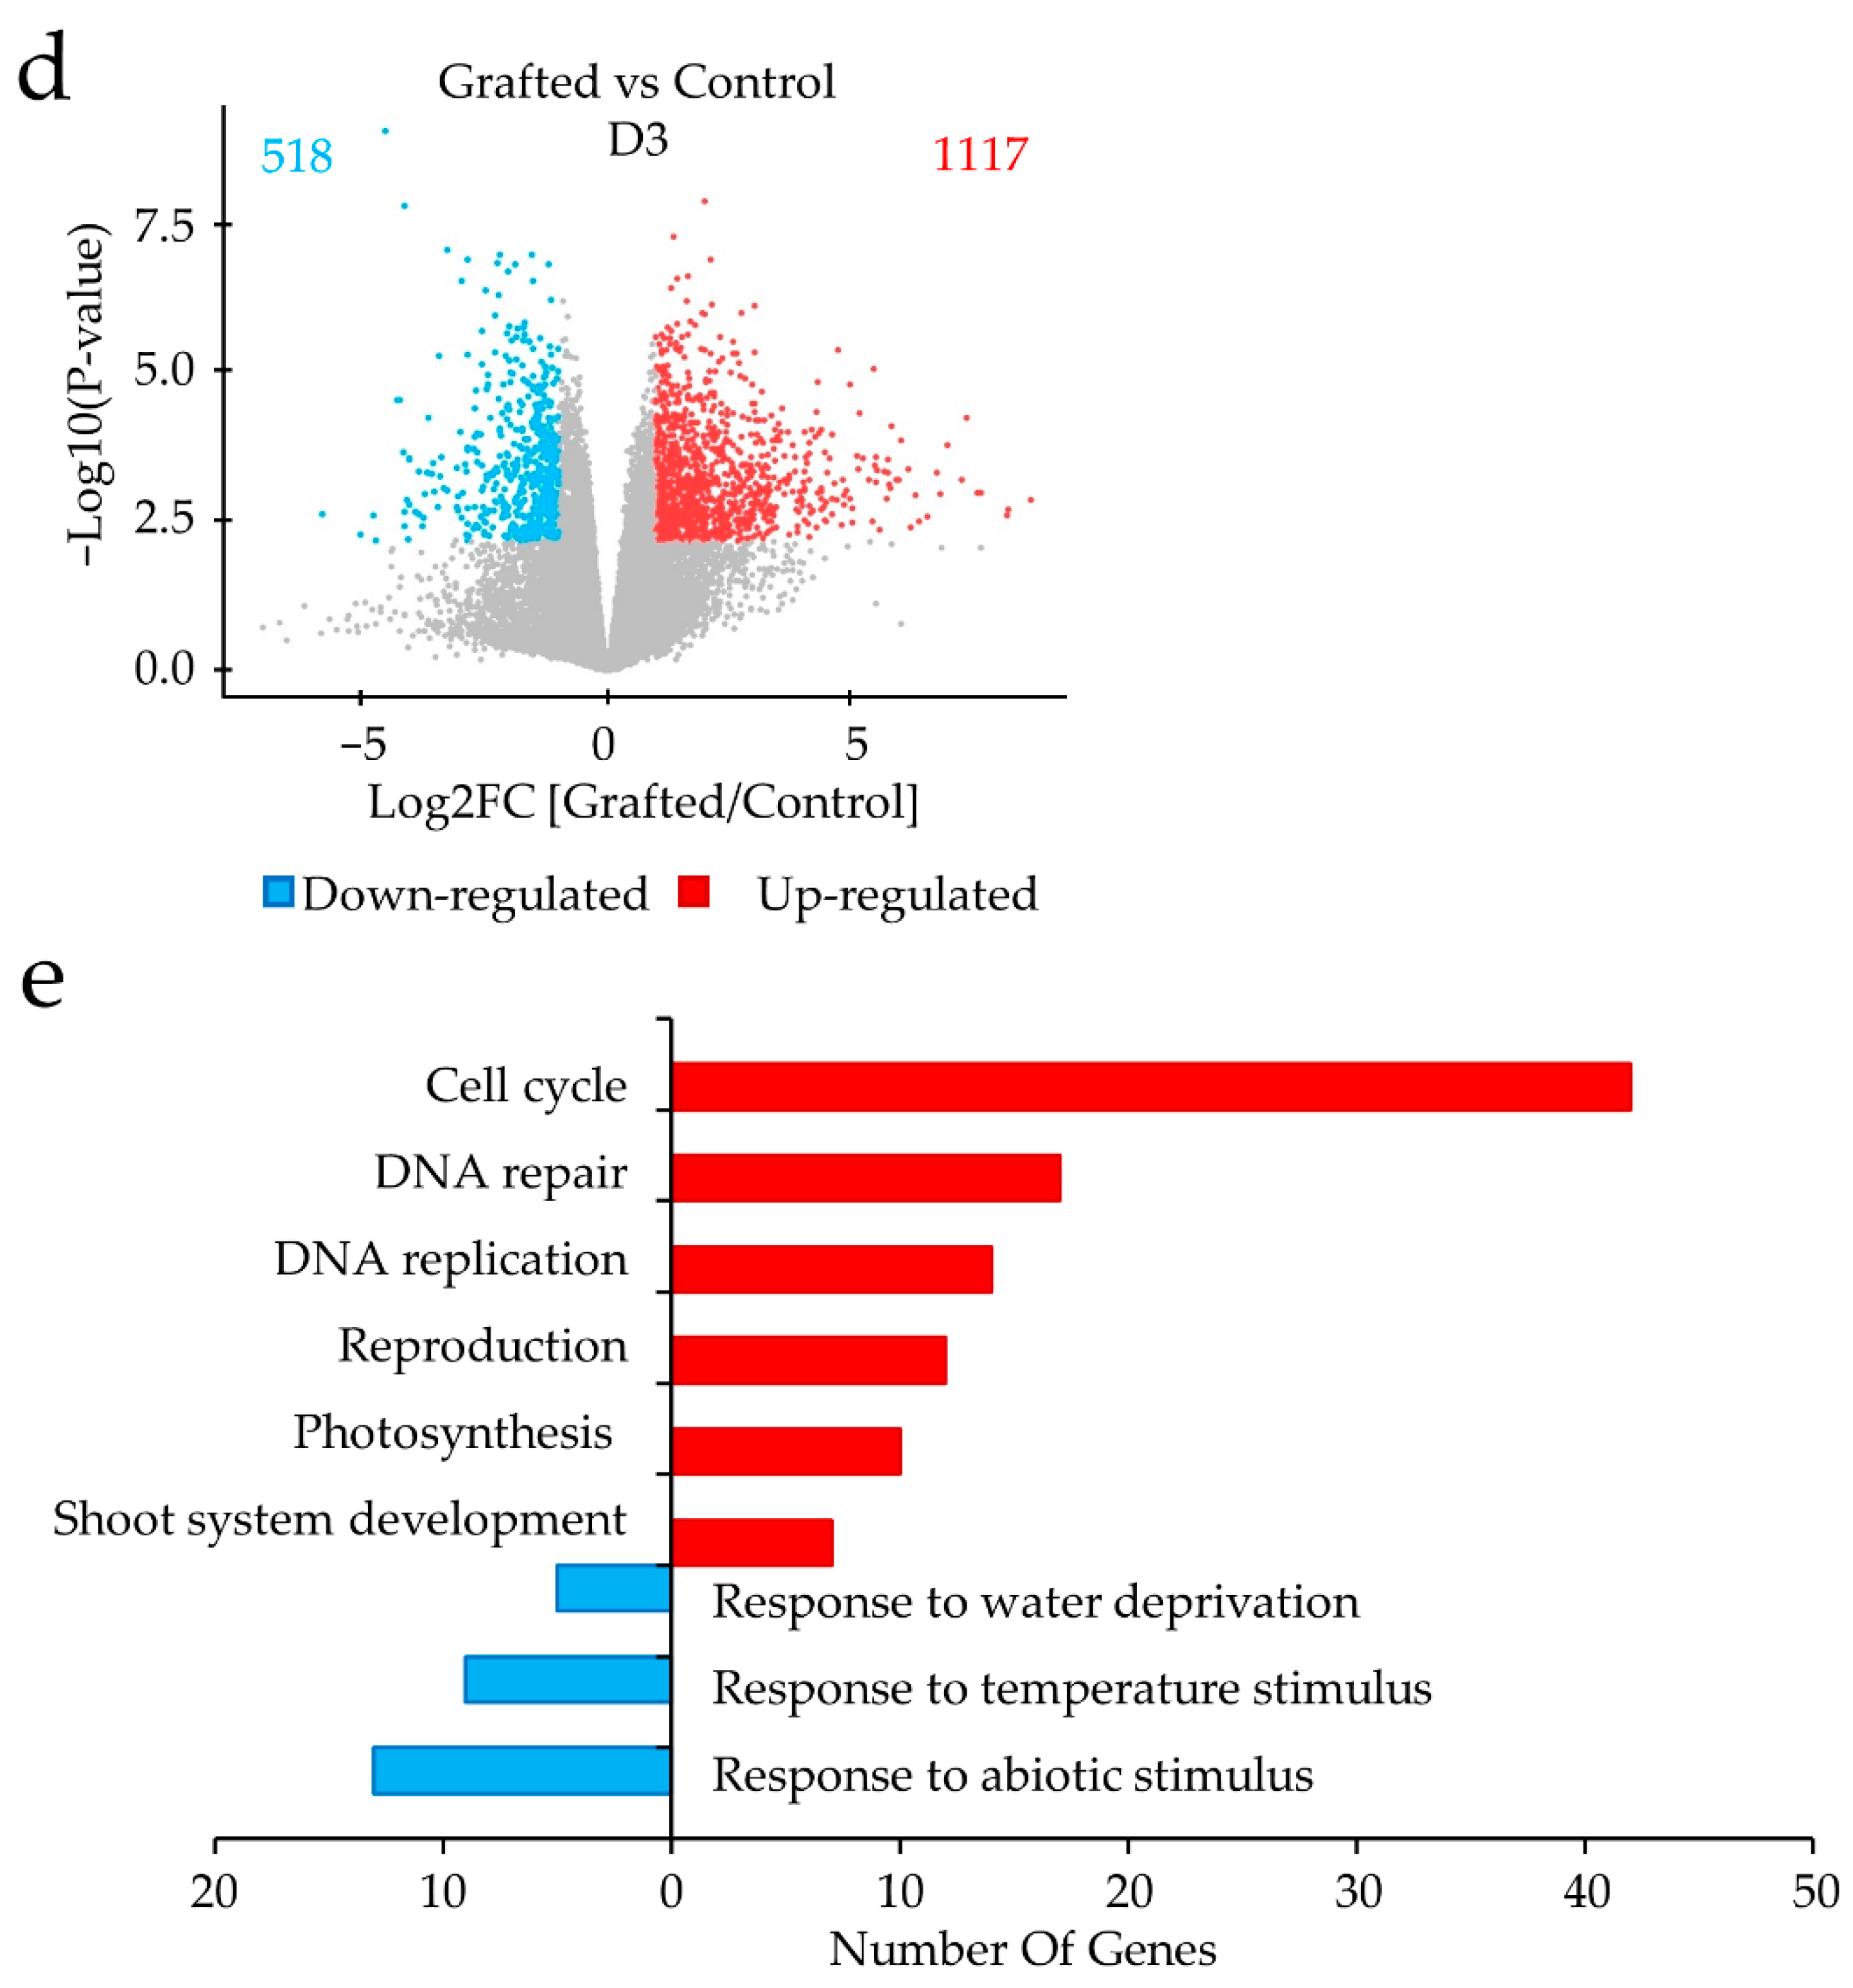
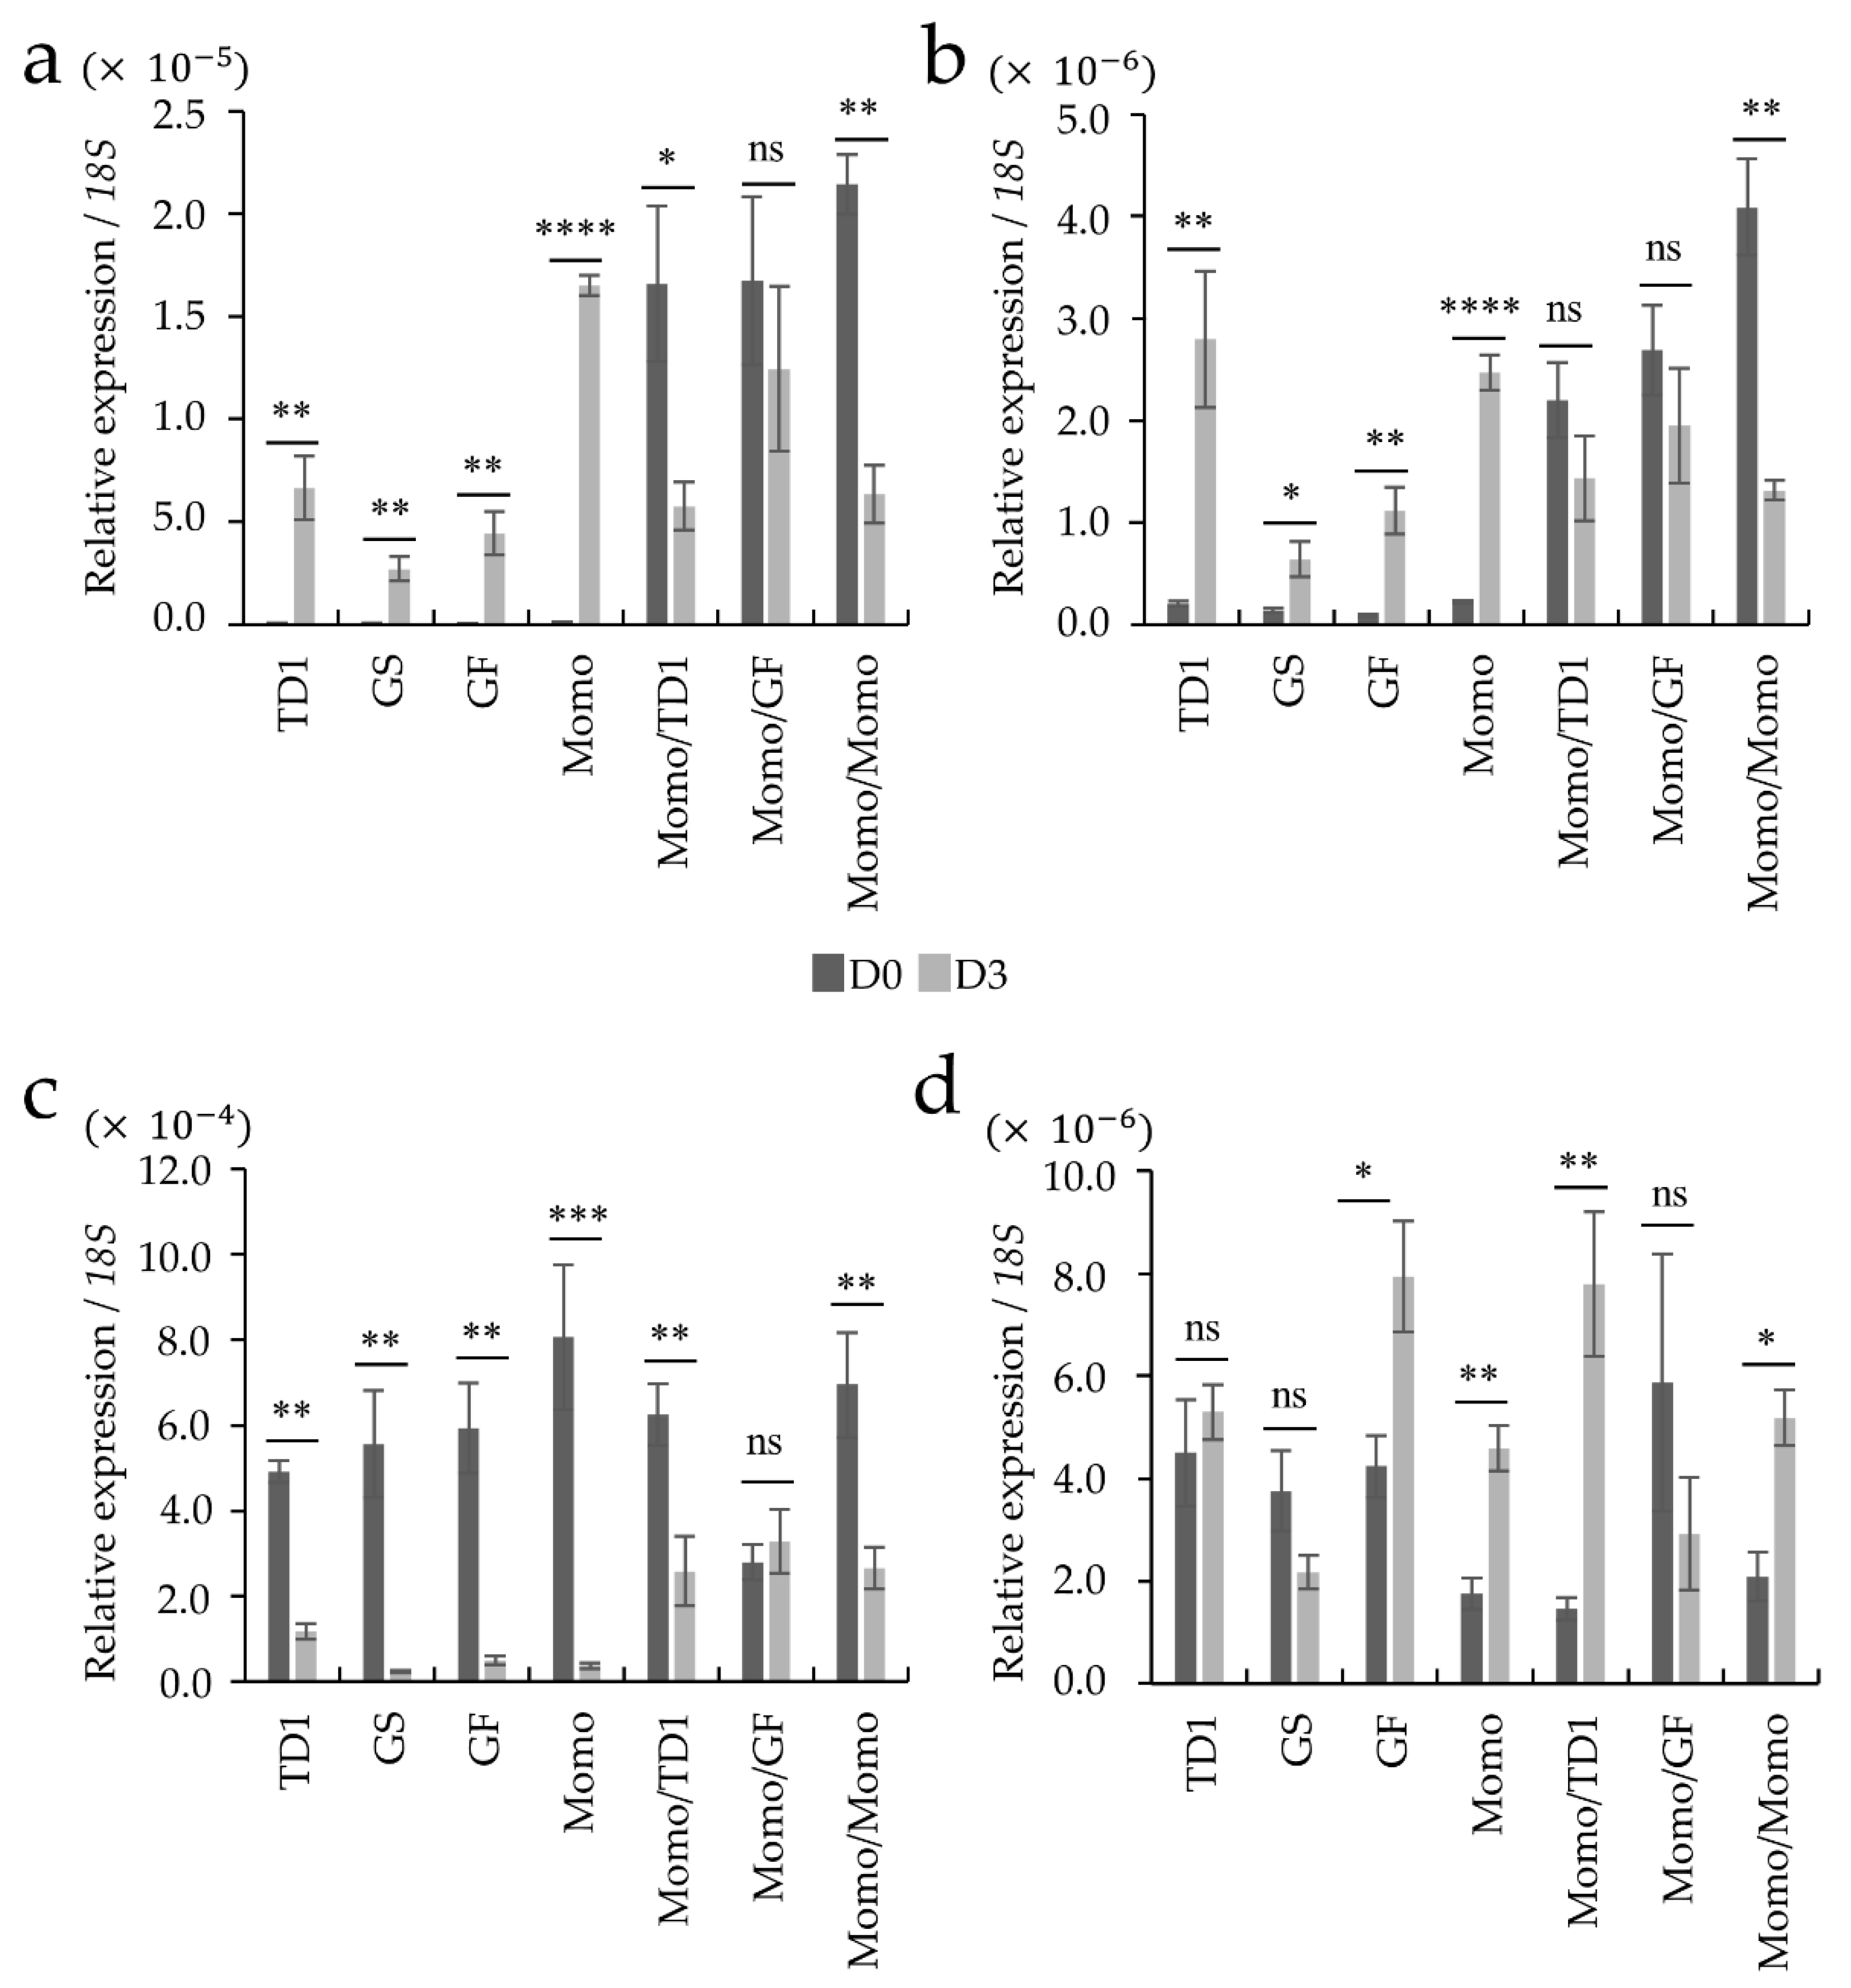
2.2. Differences in Gene Expression between Grafted and Non-Grafted Plants before and during Drought Stress Treatment

To identify genes whose expression was altered by grafting and resulted in changes in drought tolerance, we performed RNA sequencing (RNA-seq) on shoot apical meristem before (D0) and 3-day drought stress treatment (D3). First, counts per million (CPM) values for gene expression were calculated between the formed clusters of the control and grafted lines and between D0 and D3 (Figure 2a). Subsequently, a heatmap was generated using the control and grafted gene expression data, in which we observed two major clusters, drought and grafting effect. The clusters separated the control and grafted lines, and D0 and D3 treated lines are shown in the upper part of the heatmap (Figure 2b).
Comparison between grafted and non-grafted control group under D0 revealed that grafting caused down-regulation (Log2 fold change ≤ −1) of 602 differentially expressed genes (DEGs) and up-regulation (Log2 fold change ≥ 1) of 1158 DEGs (Figure 3a, Table S1). The classification of these DEGs by gene ontology (GO) analysis indicated that several up-regulated genes were related to the following categories: “carbohydrate metabolic process: 23 DEGs”, “gene expression: 4 DEGs”, “response to stimulus: 56 DEGs”, such as “temperature stimuli (heat shock protein): 14 DEGs”, “response to reactive oxygen species (ROS): 8 DEGs”, and “response to abscisic acid: 9 DEGs” (Figure 3b). GO analysis of the down-regulated genes was associated with different categories, namely “nucleic acid metabolic process: 42 DEGs”, “RNA modification: 25 DEGs”, “chloroplast organization: 7 DEGs”, “positive regulation of helicase activity: 4 DEGs”, and “mitochondria DNA replication: 4 DEGs”.
We also listed several hormone-related genes that were differentially expressed between grafted and control plants in Table 1. Those hormone-related genes include ABA receptors, auxin, cytokinin, ethylene-responsive transcription factors, and gibberellins (GA). Several small auxins up-regulated RNAs (SAURs), dormancy-associated gene/auxin-repressed protein, auxin efflux carriers, and auxin response factors were found in the auxin classification. Additionally, cytokinin was differentially expressed in cytokinin biosynthesis pathway enzymes. Grafting differently regulated ethylene-responsive transcription factors and response factors, with the majority being up-regulated. A similar pattern was observed with the gibberellin-regulated protein (GASA).
DEGs obtained by comparing the gene expressions in D3 and D0 were used to evaluate the effects of drought stress in the control and grafted lines. Transcriptomic analysis revealed that 3936 DEGs were down-regulated in D3 while 2903 were up-regulated in the control lines (Figure 4a). Similar patterns, but slightly decreased, were observed in the grafted lines, with 3304 and 2542 DEGs down- and up-regulated, respectively (Figure 4b). Additionally, DEGs classified by GO analysis showed gene regulation similarities in grafted and control lines. However, control lines exhibited more genes in each GOs category (Figure 4c) than those in the grafted lines. The commonly up-regulated (control/grafted) are related to the “biological regulation: 254/191 DEGs”, “response to stimulus: 187/104 DEGs”, “catabolic process: 143/97 DEGs”, “regulation of RNA metabolic process: 121/107 DEGs”, “proteolysis: 80/58 DEGs”, “protein ubiquitination: 47/29 DEGs”, and “positive regulation of transcription: 34 DEGs”. The commonly down-regulated were identified as “cell division: 16/12 DEGs”, “photosynthesis, light-harvesting: 18/9 DEGs”, “fatty acid biosynthesis process: 19/9 DEGs”, “cell wall organization or biogenesis: 32/25 DEGs”, “RNA modification: 45/4 DEGs”, “DNA replication: 46/34 DEGs”, “cell cycle: 126/100 DEGs”, and “response to stimulus: 224/181 DEGs”. These results indicate that drought stress has a more significant impact on the control lines than the grafted lines.
We performed a comparative analysis between the control and grafted lines under D3 to clarify the observed differences between DEGs due to grafting. Gene expression analysis revealed that grafting resulted in up-regulated 1117 DEGs and down-regulated 518 DEGs in comparison to control (Figure 4d, Table S2). Several of the up-regulated genes are related to the “cell cycle: 42 DEGs”, “DNA repair: 17 DEGs”, “DNA replication: 14 DEGs”, “reproduction: 12 DEGs”, “photosynthesis: 10 DEGs”, and “shoot system development: 7 DEGs” categories. Down-regulated DEGs were identified as a “response to abiotic stimulus: 13 DEGs” that included “water deprivation: 5 DEGs” and “temperature stimulus: 9 DEGs” (Figure 4e). These results show that non-grafted and grafted lines have several DEG, further supporting observational analysis results in which grafted lines continued to have normal growth patterns and were less affected by the stress stimulus. By contrast, the control lines were heavily affected and could not withstand drought stress conditions beyond day 3.
To confirm RNA-seq results, we analyzed expression levels of 4 genes, heat shock protein 20 (HSP20), ascorbate peroxidase (APX), chlorophyll a–b binding protein (LHCB) and 9-cis-epoxycaratenoid dioxygenase (NCED) by real-time quantitative PCR (Figure 5). In the grafted lines, HSP20 and APX showed up-regulation at D0, but their expression was reduced or unchanged at D3. In the control lines, their lower expression at D0 significantly increased at D3 (Figure 5a,b). By contrast, LHCB showed down-regulation under D3 in the control and grafted lines; however, in the grafted lines, the decrease in gene expression was less severe than in the control lines (Figure 5c). NCED gene expression showed significant up-regulation in response to drought stress (D3) in several lines (GF, Momo, Momo/TD1 and Momo/Momo) (Figure 5d). Interestingly, these up-regulations were commonly observed in lines with high survival rates to drought stress treatment (Figure 1b).
Furthermore, when comparing compatible (Momo/TD1 and Momo/Momo) and incompatible (Momo/GF) grafted lines, the DEGs (Table S3) in which GO is commonly enriched in both compatible lines were related to “regulation of transcription: 33 DEGs”, “signaling: 13 DEGs”, “response to hormone: 12 DEGs”, and “response to abiotic stimulus: 8 DEGs” categories (Figure 6a, Table 2). By contrast, high expression in incompatible line showed GO enrichment genes in different categories such as “response to wounding: 2 DEGs”, “plant-type cell wall biogenesis: 3 DEGs”, “phospholipid metabolic process: 3 DEGs”, and “response to stress: 7 DEGs” (Figure 6b, Table 2). These possibly lead to activation of pathway differentiation related to graft junction compatibility, suggesting that grafting enhances the drought-tolerance effect in the combination of scion and rootstock.

3. Discussion

In general, grafting can improve plant development and stress tolerance [1,2]. Our results show that Momo/TD1 has a high survival rate (Figure 1b) indicating that this combination is the most successful for drought tolerance in Momo-scion. TD1 has been selected and used as one of vigorous rootstocks by Takii Seed Co., Ltd. However, ungrafted TD1 was less tolerant, indicating that grafting is needed to acquire stress tolerance. In addition, unexpectedly, self-grafted Momo/Momo was found to be more resistant to drought than non-grafted Momo (Figure 1b). This suggests that the process of cutting and connecting in the graft activates several wound-healing mechanisms, leading to increased drought tolerance. Wound stress can activate several responsive signaling at the wound sites and can be propagated to the rest of the plant [17,18]. Similarly, this signaling can pass between the rootstock and scion, such as reactive oxygen species (ROS), phytohormones, metabolites, and genetic information as small RNAs [2,19]. Recently, a study in grafted junction of tomato seedlings showed differentially expressed genes (DEGs) related to several pathways, such as oxidative stress and hormones, ABA, ethylene, auxin, gibberellin, and jasmonic acid [20]. Such ROS signaling and hormonal changes at the grafted site can affect the apical meristem of the scion.
As ROS signaling, HSPs and ROS scavenger enzymes increased in the apical meristem of the grafted lines before drought stress (D0) (Table S1, Figure 3b and Figure 5a,b), these pre-activations can lead to drought stress tolerance. In fact, some studies on the overexpression of HSPs and APX have shown increased tolerance to drought stress [21,22,23,24]. Furthermore, these activations are regulated by ABA signaling pathway in plants [25,26]. For example, HSP70 in cucumber (Cucumis sativus L.) was induced by a stress-tolerant rootstock pumpkin (Cucurbita moschata) and luffa (Luffa cylindrica Roem.) through ABA-dependent activation [27,28]. As the result shown in Table 1 and Figure 3b, the graft strongly activated several ABA-related genes. ABA is a vital rapidly produced stress-responsive hormone that can help increase the plant’s survival during drought stress [10,29]. ABA signaling involves ABA receptor PYL [Pyrabactin Resistance 1 (PYR)/pyrabactin resistance-like (PYL)], which generates a cascade of response and signal transduction [10]. The activation of ABA receptors PYL in the shoot apical tissue could be due to water stress caused by the disconnection of the vascular system.
The SAURs family is one example of an auxin-responsive gene family. SAURs are auxin-induced and play a role in cell elongation. Additionally, they can act independently of auxin, regulated by other hormones, transcription factors, and environmental stress [30]. Some SAURs (Solyc07g042490, Sl-SAUR5, and Sl-SAUR26) were up-regulated under D0 (Table 1), whereas their Arabidopsis (Arabidopsis thaliana) orthologs (SAUR76, SAUR8, and SAUR 14) are regulated by auxin, ethylene, or environmental conditions, including light [31,32,33,34]. By contrast, the down-regulation of Sl-SAUR55 (Solyc05g046320) is related to leaf senescence, dormancy/auxin associated protein (Solyc01g099840), and auxin-repressed protein (Solyc02g077880) associated with pathogen response, which are triggered by other conditions other than auxin [35,36,37]. Based on these results, we can assume that auxin activated several genes in the shoot apical meristem of Momo-scion, which can regulate stress tolerance in association with other hormones [38].
Cytokinin appears to be present in the shoot apical meristem of the Momo-scion, where biosynthetic genes (Solyc06g075090, Solyc04g080820, and Solyc10g082020) are up-regulated, and SlCRF4 (Solyc03g007460), which is not induced by cytokinin, is down-regulated [39]. Additionally, ethylene, essential for abiotic stress response, was up-regulated by grafting (Table 1). We identified several ethylene-responsive transcription factors that were up-regulated by grafting. Therefore, we expected interaction between ethylene and auxin for stress tolerance, as it promotes vascular cell division during graft union formation [40,41]. GA-regulated proteins are usually activated by GA. Several genes have been found to play a role in cell growth and differentiation and the ABA signaling pathway [42]. Several days after grafting (Table 1), GA was not activated in grafted plants, where GA-regulated proteins 3, 14 and Solyc12g042500 (ortholog of GASA11, 14, and 10 in Arabidopsis) are not affected by GA or can be inhibited by exogenous GA application [42,43]. However, GASA14 (an ortholog of Solyc03g113910) was induced by ABA treatment [43].
During D3 of drought stress treatment, the overall change in gene expression by grafting (both up-regulation and down-regulation) was slightly reduced compared to the control (Figure 4a,b). On the other hand, grafting at D3 increased about 1000 genes and decreased about 500 genes compared to control (Figure 4d). Interestingly, some of these genes that are apparently increased (GOs: cell cycle, DNA replication, and photosynthesis) are down-regulated by drought, and conversely, some of these genes that are apparently decreased (GOs: response to abiotic stimulus) are up-regulated (Figure 4c,e). This suggests that grafting reduces the drought response by suppressing the activation or reduction of gene expression.
Furthermore, Momo-scion’s sensitivity to drought depended on the rootstock used (Figure 1b). The interaction between scions and rootstocks is essential for the phenotypic variability of grafted plants [2]. The drought sensitivity of the grafted Momo/GF could be related to the incompatibility between the scion and rootstock. When the separated tissues are attached, and incomplete reconnection of the xylem occur during vascular reconnection, the root and shoot water potential can be affected [5,44,45]. We observed differences in gene expression between the compatible (Momo/Momo and Momo/TD1) and incompatible lines (Momo/GF), such as the “response to hormones” and “response to stress” (Figure 6a,b, Table 2). Hormonal dynamics contribute graft reconnection and communication between the rootstock and the scion [6,46]. One possible reason for drought tolerance in the compatible and incompatible lines could be related to a rapid physiological response to the stress, such as response to ABA.
An ABA receptor PYL4-like was induced in compatible lines as compared to Momo/GF (Table 2). Likewise, it was observed that an essential enzyme in the ABA biosynthetic pathway, 9-cis-epoxycarotenoid dioxygenase (NCED), was up-regulated on D3 in the compatible lines (Figure 5d). NCED plays a role in the stomatal closure, generating a decrease in gas exchange and photosynthesis [14]. Moreover, our results showed that during drought stress, grafting had less reduction in the expression of photosynthesis-related genes than in the control (Figure 4c,e). For example, chlorophyll a–b binding proteins (LHCB) are part of the early light-induced protein, with the primary function as photosynthetic light-harvesting complex but also as stress-responsive genes, especially under drought stress [47,48]. An LHCB (Solyc08g067330) in our study was reduced during drought stress in control and lesser reduced in the grafted lines (Figure 5c). The stress-responsive genes activated in Momo/GF could demonstrate that oxidative stress occurring in the scion, which could indicate a lack of vascular reconnection [49]. Nevertheless, the main reasons for the incompatibility between same or different graft species are largely unknown.
Communication signals between scion and rootstock are important for stress response and survival of tomato. One hypothesis of how grafting alters gene expression in the shoot apical meristem after several days of the graft-healing process could be through epigenetic modifications. We are attempting to study those epigenetic changes in Momo-scion.

4. Materials and Methods

4.1. Plant Materials, Growth Conditions, and Grafting

First-generation (F1) hybrid green force (GF), green guard (GS), TTM-079 (TD1), and Momotaro (Momo) tomato seeds (Takii Seed Co., Ltd., Kyoto, Japan) were sown in soil with vermiculite in a 30-well strip (5 × 5 cm per well) and placed in a large growth cabinet (Espec Ltd., Osaka, Japan), at 28/22 °C (day/night), with a 12 h photoperiod (300 μmol/m2/s) and 85/75% relative humidity. Thirty germinated seedlings of each line were watered every day to keep the soil moisturized without waterlogging.
For grafting, three different graft combinations were made using the same Momo as the scion [homo-grafted (Momo/TD1 and Momo/GF), and self-grafted (Momo/Momo)]. Before grafting (3 true leaves stage), the stem diameter below the hypocotyl should be 1.7–2.2 mm for the rootstock and scion before grafting. Then, a diagonal cut was made using a graft-cutter, and the scion with the rootstock was joined using a joint graft holder (Seem, Kita-Kyushu, Japan). The grafted material was kept under high humidity (85–90%) and low light for 3 d during the healing process. After that, the humidity was gradually decrease and light irradiation increased. After 5 d, the grafted plants were acclimated to growth cabinet conditions. A total of 3 weeks after grafting, plants were used for further experiments.

4.2. Drought Stress Treatment and Sample Collection

Ungrafted lines referred to as control (2-week-old plants with 4 true leaves), and grafted plants (3 weeks after grafting with 5 true leaves), were subjected to drought stress by withholding water for 12 d and then irrigated for 3 d to measure the survival rate (Figure 1a). The plants were kept in a 30-well strip per line in the same growth cabinet under the same conditions as described previously. D0 is before applying the stress and D3 is withholding water for 3 days. The shoot apical meristems (bud area containing the apical meristem and young leaves) of each line were collected in three biological replicates at different time points (D0 and D3).

4.3. RNA Extraction and RNA Sequencing and Data Analysis

Total RNA was extracted from shoot apical meristematic tissues of lines exposed to D0 and D3 using TRIzol reagent (Thermo Fisher Scientific, Waltham, MA, USA) and RNeasy Mini Kit (Qiagen, Hilden, Germany) for genomic DNA elimination. RNA quantity was obtained by measuring by absorbance using a Quantifier RNA NanoQuant Infinite 200 (TECAN, Mannedorf, Switzerland). RNA integrity was verified using an Agilent 2200 TapeStation System (Agilent Technologies, Santa Clara, CA, USA).
RNA pools of the three biological replicates per line were used for all RNA sequencing experiments. Samples were purified using a Ribo-Zero rRNA Removal Kit [Plant Leaf (Illumina, San Diego, CA, USA)]. Furthermore, the SureSelect Strand-Specific RNA Library Prep for Illumina Multiplexed Sequencing (Agilent Technologies) and NextSeq 500 (Illumina) were used for mRNA library preparation. The sequencing service was provided by the Kazusa DNA Research Institute, Chiba, Japan. All data analysis was performed as described in Refs. [50,51,52,53] with ITAG4.0 tomato annotation information [54] and featureCounts v.2.01 [55].
Raw read counts were normalized to Reads per Kilobase per Million (RPKM) to determine gene expression. For DEGs, raw read counts were used and analyzed using the limma-voom package [56] to generate normalized values as logarithm count per million (log-CPM). We chose to examine counts per million (CPM) instead of reads per kilobase per million (RPKM) [57] because of our interest in comparing relative changes in expression between conditions. Filtered genes expressed above 0.5 CPM in at least 1 sample in control and grafted lines were retained. Log-CPM values were transformed to log2 fold change between the non-grafted as a control and grafted as a treatment, to measure the grafting effect. Additionally, D0 was used as a control and D3 was used as a treatment to measure the drought effect.

4.4. Real-Time Quantitative PCR (RT-PCR) in Stress-Responsive Genes

RT-PCR was performed with PrimeScript RT Reagent Kit (Takara Bio Inc., Shiga, Japan) for reverse transcription to cDNA. For each reaction, 4 μL of cDNA (1:100 dilution) and 5.8 μL of KAPA SYBR FAST universal (Kapa Biosystems Inc., Wilmington, MA, USA), and 0.2 μL of primer mix were used. CFX Connect Real-Time System (Bio-Rad Laboratories, Hercules, CA, USA) with the following cycling condition: 3 min at 95 °C, followed by 40 cycles of 95 °C for 15 s, 60 °C for 30 s, and 72 °C for 1 min. Three biological replicates with three technical repetitions were tested. The housekeeping gene 18S rRNA was set as the endogenous control, where forward 5′-ATGATAACTCGACGGATCGC-3′ and reverse 5′-CTTGGATGTGGTAGCCGTTT-3′. The selected genes used to verify the results of the RNA-seq data were heat shock protein 20 (HSP20), ascorbate peroxidase (APX), chlorophyll a–b binding protein (LHCB), and 9-cis-epoxycaratenoid dioxygenase (NCED). For HSP20 (Solyc08g062450), the forward 5′-CCGGTGAAGATTCCGACAAG-3′ and reverse 5′-TTCACATCCGCTGGTGTAGC-3′ was used. For APX (Solyc09g007270), the forward 5′-TCAGGCACCCGAATGAACTT-3′ and reverse 5′-GGGCCTCCCGTAACTTCAAC-3′ was used. For LHCB (Solyc08g067330), the forward 5′-GGGCCTGACCGTGTGAAGTA-3′ and reverse 5′-AGTCCAGCAGTGTCCCATCC-3′. Lastly, for NCED (Solyc07g056570), the forward 5′-GCTGGAATGGTGAACCGAAA-3′ and reverse 5′-TGCTGTTGGGGTCTCTTGGT-3′. The relative expression of each gene was calculated with the 2△C’T method [58].

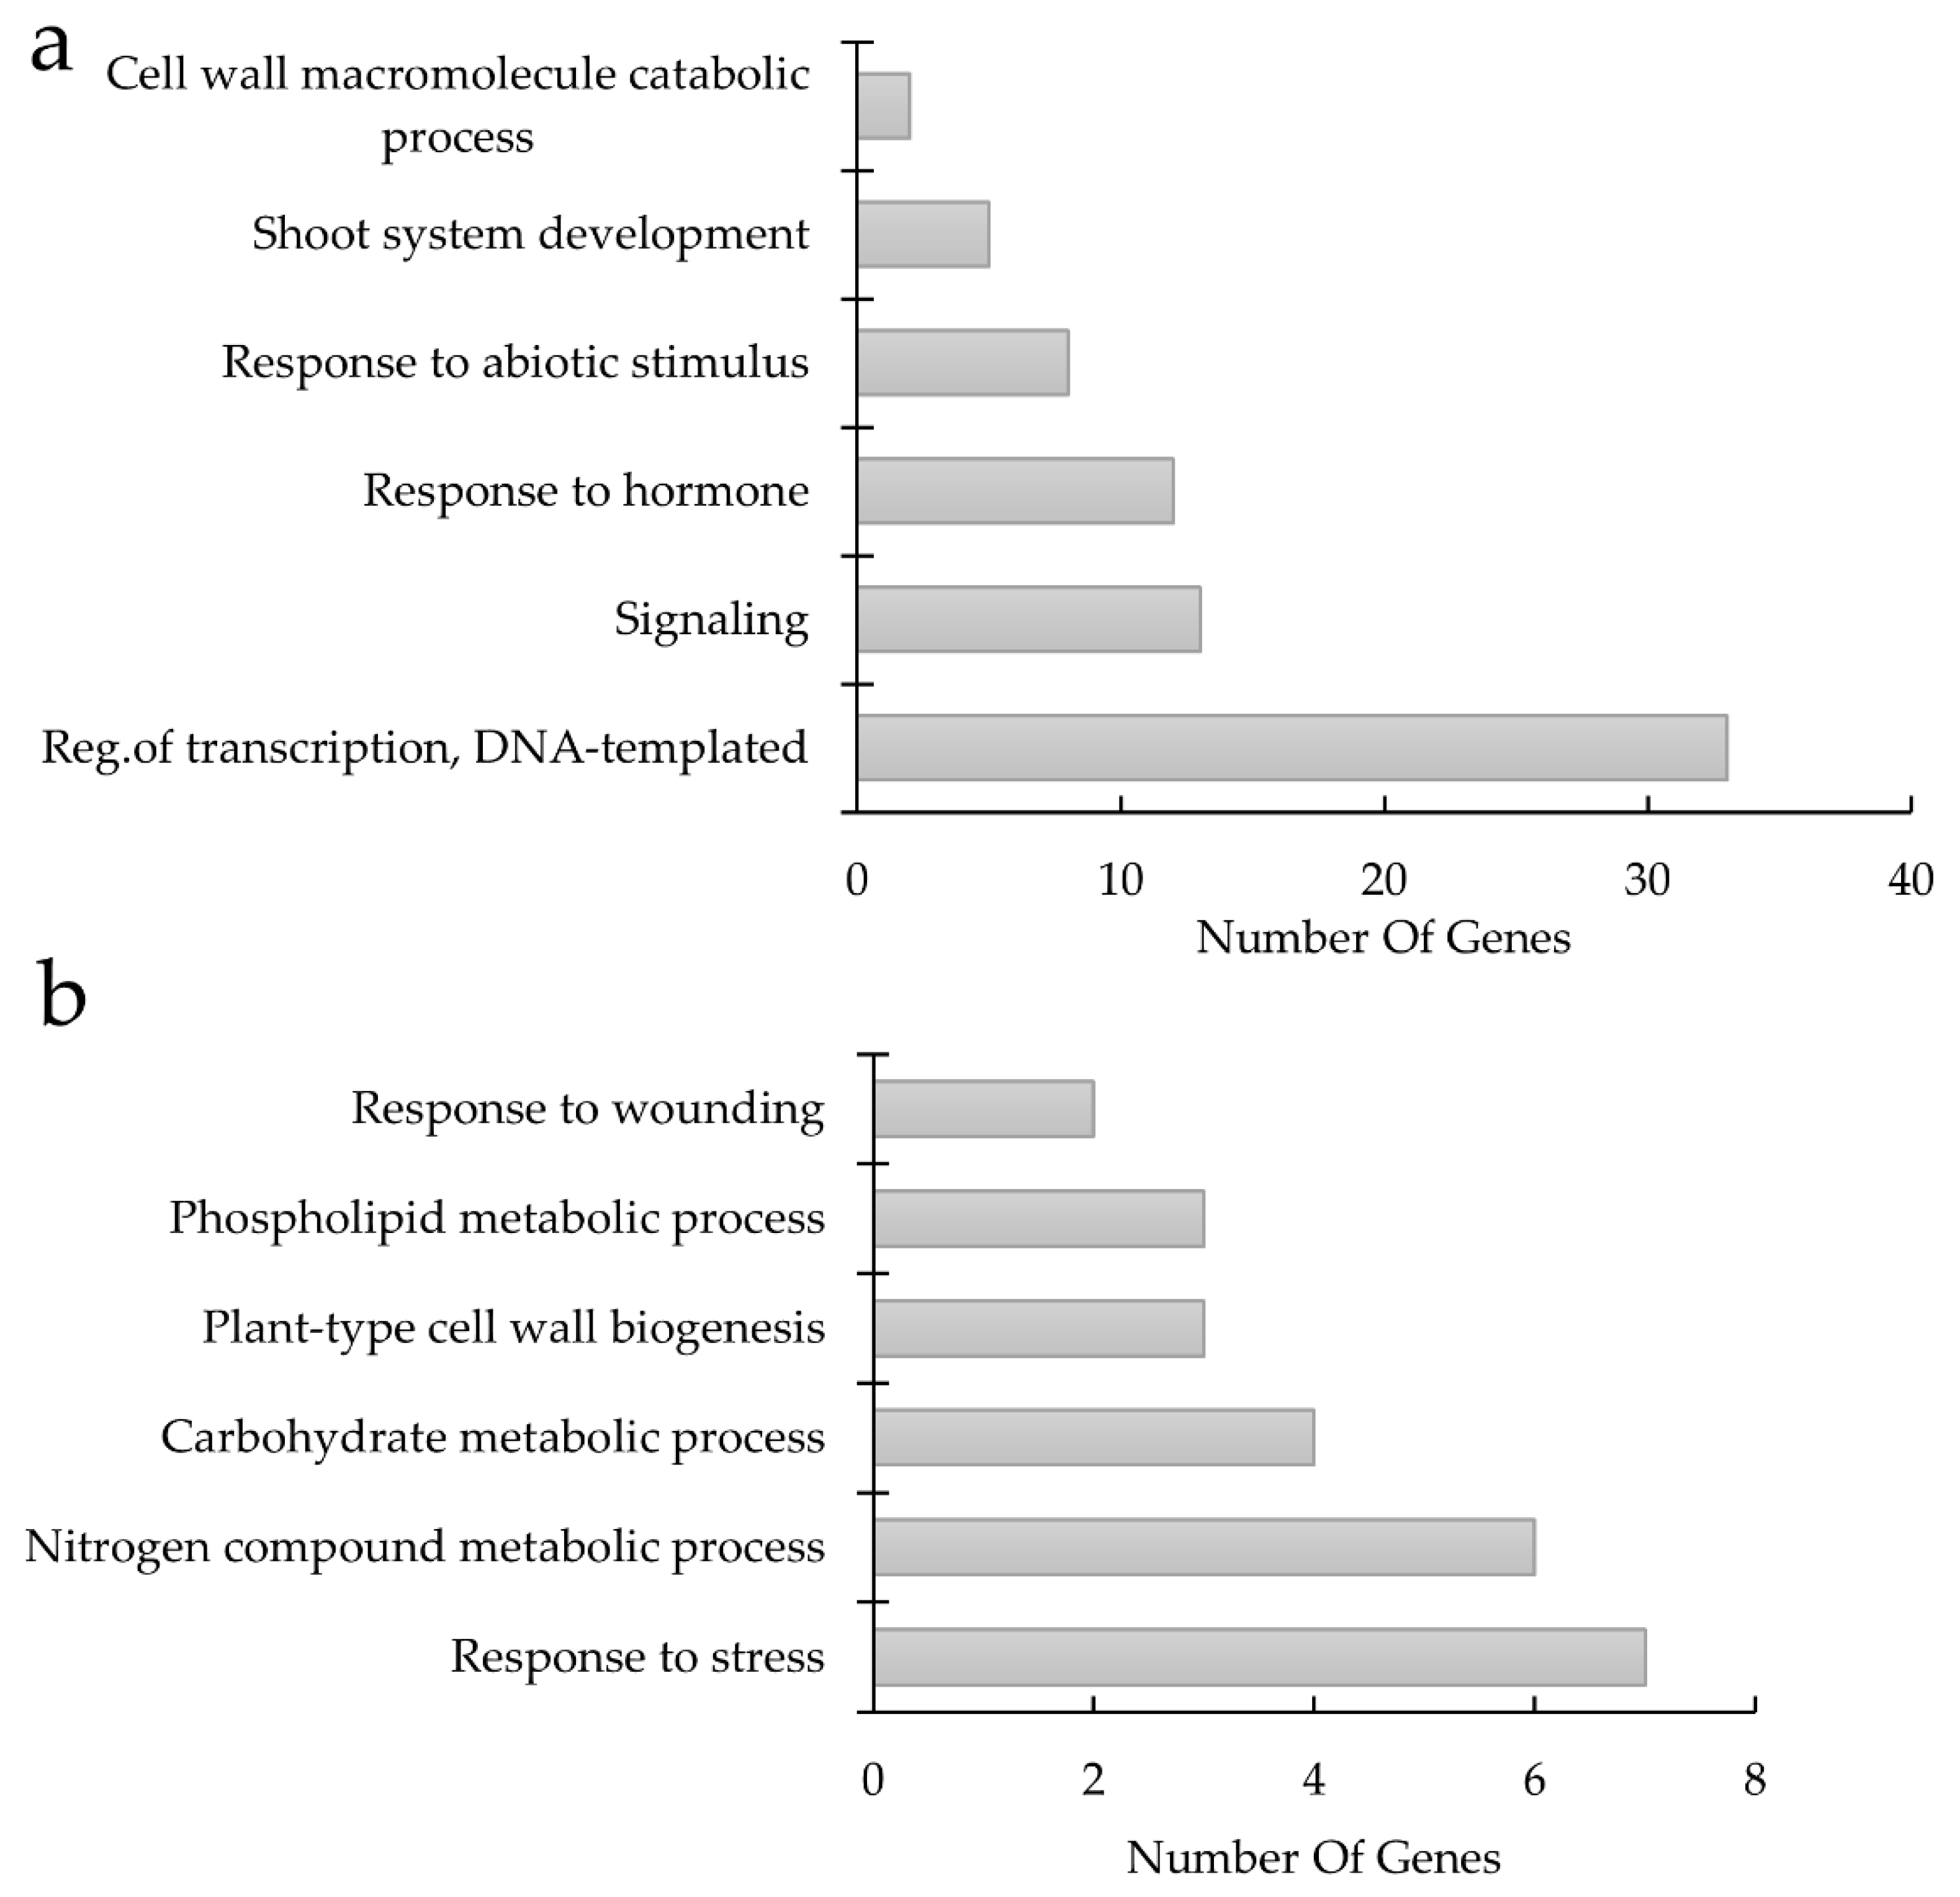
4.5. Gene Ontology Categorization

The PANTHER 14.0 tool [59] was used for the GO enrichment analysis of the DEGs with false discovery rate (FDR) < 0.05 and p-value < 0.05. Only GOs categories of interest were selected from the biological process family.

5. Conclusions

Our results show that grafting, especially self-grafting, increases drought stress survival rate by inducing stress-adaptative mechanisms on transcriptomic changes on the shoot apical meristem of Momo. Additionally, the drought resistance is highly dependent on the grafting compatibility and rootstock used.

Supplementary Materials

The following supporting information can be downloaded at: https://www.mdpi.com/article/10.3390/plants11151947/s1, Table S1: Differentially expressed genes in grafted vs. control under pre-stress conditions (Log2FC > |1| CPM, Adj. p-value < 0.05); Table S2: Differentially expressed genes in grafted vs. control under 3-days stress conditions (Log2FC > |1| CPM, Adj. p-value < 0.05); Table S3: Differentially expressed genes on compatible [Momotaro (Momo)/TTM-079 (TD1) and Momo/Momo] vs. incompatible [Momo/green force (GF)] lines (Log2FC > |1| RPKM).

Author Contributions

M.I.F.-M. and A.H. conceived and designed the study. M.I.F.-M. conducted experiments and analyzed the data. M.B. and S.S. contributed to RNA sequencing. M.I.F.-M. and A.H. wrote the manuscript. All authors read and approved the final paper. All authors have read and agreed to the published version of the manuscript.

Funding

This research was funded by JSPS KAKENHI (Japan Society for the Promotion of Science), grant number JP18H03947 (A.H) and 21K14763 (M.B).

Institutional Review Board Statement

Not applicable.

Informed Consent Statement

Not applicable.

Data Availability Statement

The data of this study are available from the authors upon reasonable request. All global gene expression data are deposited in the BioProject database as the accession number of PRJDB13627.

Acknowledgments

We thank Makoto Endo for providing the tomato seeds and for contributing in seed to the generation of grafting tomato plants. M.I.M-F. obtained a scholarship from Ministry of Education, Culture, Sports, Science, and Technology (MEXT).

Conflicts of Interest

The authors declare no conflict of interest.

References

  1. Oda, M. New Grafting Methods for Fruit-Bearing Vegetables in Japan. Jpn. Agric. Res. Q. 1995, 29, 187–194. [Google Scholar]
  2. Albacete, A.; Martínez-Andújar, C.; Martínez-Pérez, A.; Thompson, A.J.; Dodd, I.C.; Pérez-Alfocea, F. Unravelling Rootstock×scion Interactions to Improve Food Security. J. Exp. Bot. 2015, 66, 2211–2226. [Google Scholar] [CrossRef] [Green Version]
  3. Goldschmidt, E.E. Plant Grafting: New Mechanisms, Evolutionary Implications. Front. Plant. Sci. 2014, 5, 727. [Google Scholar] [CrossRef] [PubMed] [Green Version]
  4. Melnyk, C.W. Plant Grafting: Insights into Tissue Regeneration. Regeneration 2017, 4, 3–14. [Google Scholar] [CrossRef]
  5. Melnyk, C.W.; Schuster, C.; Leyser, O.; Meyerowitz, E.M. A Developmental Framework for Graft Formation and Vascular Reconnection in Arabidopsis Thaliana. Curr. Biol. 2015, 25, 1306–1318. [Google Scholar] [CrossRef] [PubMed] [Green Version]
  6. Matsuoka, K.; Sugawara, E.; Aoki, R.; Takuma, K.; Terao-Morita, M.; Satoh, S.; Asahina, M. Differential Cellular Control by Cotyledon-Derived Phytohormones Involved in Graft Reunion of Arabidopsis Hypocotyls. Plant. Cell Physiol. 2016, 57, 2620–2631. [Google Scholar] [CrossRef] [Green Version]
  7. Schwarz, D.; Rouphael, Y.; Colla, G.; Venema, J.H. Grafting as a Tool to Improve Tolerance of Vegetables to Abiotic Stresses: Thermal Stress, Water Stress and Organic Pollutants. Sci. Hortic. 2010, 127, 162–171. [Google Scholar] [CrossRef]
  8. Kyriacou, M.C.; Rouphael, Y.; Colla, G.; Zrenner, R.; Schwarz, D. Vegetable Grafting: The Implications of a Growing Agronomic Imperative for Vegetable Fruit Quality and Nutritive Value. Front. Plant. Sci. 2017, 8, 741. [Google Scholar] [CrossRef] [PubMed]
  9. Kumar, P.; Rouphael, Y.; Cardarelli, M.; Colla, G. Vegetable Grafting as a Tool to Improve Drought Resistance and Water Use Efficiency. Front. Plant. Sci. 2017, 8, 1130. [Google Scholar] [CrossRef] [PubMed] [Green Version]
  10. Osakabe, Y.; Yamaguchi-Shinozaki, K.; Shinozaki, K.; Tran, L.S.P. ABA Control of Plant Macroelement Membrane Transport Systems in Response to Water Deficit and High Salinity. New Phytol. 2014, 202, 35–49. [Google Scholar] [CrossRef]
  11. Medyouni, I.; Zouaoui, R.; Rubio, E.; Serino, S.; Ahmed, H.B.; Bertin, N. Effects of Water Deficit on Leaves and Fruit Quality during the Development Period in Tomato Plant. Food Sci. Nutr. 2021, 9, 1949–1960. [Google Scholar] [CrossRef] [PubMed]
  12. Osakabe, Y.; Osakabe, K.; Shinozaki, K.; Tran, L.-S.P. Response of Plants to Water Stress. Front. Plant. Sci. 2014, 5, 86. [Google Scholar] [CrossRef] [PubMed] [Green Version]
  13. Akram, N.A.; Shafiq, F.; Ashraf, M. Ascorbic Acid-a Potential Oxidant Scavenger and Its Role in Plant Development and Abiotic Stress Tolerance. Front. Plant. Sci. 2017, 8, 613. [Google Scholar] [CrossRef]
  14. Cruz De Carvalho, M.H. Drought Stress and Reactive Oxygen Species: Production, Scavenging and Signaling. Plant. Signal. Behav. 2008, 3, 156–165. [Google Scholar] [CrossRef] [PubMed] [Green Version]
  15. Higashide, T.; Heuvelink, E. Physiological and Morphological Changes Over the Past 50 Years in Yield Components in Tomato. J. Am. Soc. Hortic. Sci. 2009, 134, 460–465. [Google Scholar] [CrossRef] [Green Version]
  16. Higashide, T.; Nakano, A.; Yasuba, K.I. Yield and Dry Matter Production of a Japanese Tomato “Momotaro York” Are Improved by Grafting onto a Dutch Rootstock “Maxifort”. J. Jpn. Soc. Hortic. Sci. 2014, 83, 235–243. [Google Scholar] [CrossRef] [Green Version]
  17. Ikeuchi, M.; Iwase, A.; Rymen, B.; Lambolez, A.; Kojima, M.; Takebayashi, Y.; Heyman, J.; Watanabe, S.; Seo, M.; de Veylder, L.; et al. Wounding Triggers Callus Formation via Dynamic Hormonal and Transcriptional Changes. Plant. Physiol. 2017, 175, 1158–1174. [Google Scholar] [CrossRef] [Green Version]
  18. Vega-Muñoz, I.; Duran-Flores, D.; Fernández-Fernández, Á.D.; Heyman, J.; Ritter, A.; Stael, S. Breaking Bad News: Dynamic Molecular Mechanisms of Wound Response in Plants. Front. Plant. Sci. 2020, 11, 610445. [Google Scholar] [CrossRef]
  19. Tsaballa, A.; Xanthopoulou, A.; Madesis, P.; Tsaftaris, A.; Nianiou-Obeidat, I. Vegetable Grafting From a Molecular Point of View: The Involvement of Epigenetics in Rootstock-Scion Interactions. Front. Plant. Sci. 2021, 11, 621999. [Google Scholar] [CrossRef]
  20. Wang, H.; Zhou, P.; Zhu, W.; Wang, F. De Novo Comparative Transcriptome Analysis of Genes Differentially Expressed in the Scion of Homografted and Heterografted Tomato Seedlings. Sci. Rep. 2019, 9, 20240. [Google Scholar] [CrossRef]
  21. Sato, Y.; Yokoya, S. Enhanced Tolerance to Drought Stress in Transgenic Rice Plants Overexpressing a Small Heat-Shock Protein, SHSP17.7. Plant. Cell Rep. 2008, 27, 329–334. [Google Scholar] [CrossRef] [PubMed]
  22. Xiang, J.; Chen, X.; Hu, W.; Xiang, Y.; Yan, M.; Wang, J. Overexpressing Heat-Shock Protein OsHSP50.2 Improves Drought Tolerance in Rice. Plant. Cell Rep. 2018, 37, 1585–1595. [Google Scholar] [CrossRef] [PubMed]
  23. Badawi, G.H.; Kawano, N.; Yamauchi, Y.; Shimada, E.; Sasaki, R.; Kubo, A.; Tanaka, K. Over-Expression of Ascorbate Peroxidase in Tobacco Chloroplasts Enhances the Tolerance to Salt Stress and Water Deficit. Physiol. Plant. 2004, 121, 231–238. [Google Scholar] [CrossRef]
  24. Faize, M.; Burgos, L.; Faize, L.; Piqueras, A.; Nicolas, E.; Barba-Espin, G.; Clemente-Moreno, M.J.; Alcobendas, R.; Artlip, T.; Hernandez, J.A. Involvement of Cytosolic Ascorbate Peroxidase and Cu/Zn-Superoxide Dismutase for Improved Tolerance against Drought Stress. J. Exp. Bot. 2011, 62, 2599–2613. [Google Scholar] [CrossRef]
  25. Jiang, M.; Zhang, J. Effect of Abscisic Acid on Active Oxygen Species, Antioxidative Defence System and Oxidative Damage in Leaves of Maize Seedlings. Plant. Cell Physiol. 2001, 42, 1265–1273. [Google Scholar] [CrossRef]
  26. Cho, E.K.; Hong, C.B. Over-Expression of Tobacco NtHSP70-1 Contributes to Drought-Stress Tolerance in Plants. Plant. Cell Rep. 2006, 25, 349–358. [Google Scholar] [CrossRef] [PubMed]
  27. Davoudi, M.; Chen, J.; Lou, Q. Genome-Wide Identification and Expression Analysis of Heat Shock Protein 70 (HSP70) Gene Family in Pumpkin (Cucurbita Moschata) Rootstock under Drought Stress Suggested the Potential Role of These Chaperones in Stress Tolerance. Int. J. Mol. Sci. 2022, 23, 1918. [Google Scholar] [CrossRef] [PubMed]
  28. Li, H.; Liu, S.S.; Yi, C.Y.; Wang, F.; Zhou, J.; Xia, X.J.; Shi, K.; Zhou, Y.H.; Yu, J.Q. Hydrogen Peroxide Mediates Abscisic Acid-Induced HSP70 Accumulation and Heat Tolerance in Grafted Cucumber Plants. Plant. Cell Environ. 2014, 37, 2768–2780. [Google Scholar] [CrossRef]
  29. Ikegami, K.; Okamoto, M.; Seo, M.; Koshiba, T. Activation of Abscisic Acid Biosynthesis in the Leaves of Arabidopsis Thaliana in Response to Water Deficit. J. Plant. Res. 2009, 122, 235–243. [Google Scholar] [CrossRef]
  30. Stortenbeker, N.; Bemer, M. The SAUR Gene Family: The Plant’s Toolbox for Adaptation of Growth and Development. J. Exp. Bot. 2019, 70, 17–27. [Google Scholar] [CrossRef] [Green Version]
  31. Markakis, M.N.; Boron, A.K.; van Loock, B.; Saini, K.; Cirera, S.; Verbelen, J.P.; Vissenberg, K. Characterization of a Small Auxin-up RNA (SAUR)-like Gene Involved in Arabidopsis Thaliana Development. PLoS ONE 2013, 8, e82596. [Google Scholar] [CrossRef] [Green Version]
  32. van Mourik, H.; van Dijk, A.D.J.; Stortenbeker, N.; Angenent, G.C.; Bemer, M. Divergent Regulation of Arabidopsis SAUR Genes: A Focus on the SAUR10-Clade. BMC Plant. Biol. 2017, 17, 245. [Google Scholar] [CrossRef] [PubMed] [Green Version]
  33. Dong, J.; Sun, N.; Yang, J.; Deng, Z.; Lan, J.; Qin, G.; He, H.; Deng, X.W.; Irish, V.F.; Chen, H.; et al. The Transcription Factors Tcp4 and Pif3 Antagonistically Regulate Organ-Specific Light Induction of Saur Genes to Modulate Cotyledon Opening during de-Etiolation in Arabidopsis. Plant. Cell 2019, 31, 1155–1170. [Google Scholar] [CrossRef] [PubMed] [Green Version]
  34. Sun, N.; Wang, J.; Gao, Z.; Dong, J.; He, H.; Terzaghi, W.; Wei, N.; Wang, X.; Chen, H. Arabidopsis Saurs Are Critical for Differential Light Regulation of the Development of Various Organs. Proc. Natl. Acad. Sci. USA 2016, 113, 6071–6076. [Google Scholar] [CrossRef] [PubMed] [Green Version]
  35. Wen, Z.; Mei, Y.; Zhou, J.; Cui, Y.; Wang, D.; Wang, N.N. SAUR49 Can Positively Regulate Leaf Senescence by Suppressing SSPP in Arabidopsis. Plant. Cell Physiol. 2020, 61, 644–658. [Google Scholar] [CrossRef]
  36. Rae, G.M.; David, K.; Wood, M. The Dormancy Marker DRM1/ARP Associated with Dormancy but a Broader Role In Planta. Dev. Biol. J. 2013, 2013, 632524 . [Google Scholar] [CrossRef] [Green Version]
  37. Roy, S.; Saxena, S.; Sinha, A.; Nandi, A.K. DORMANCY/AUXIN ASSOCIATED FAMILY PROTEIN 2 of Arabidopsis Thaliana Is a Negative Regulator of Local and Systemic Acquired Resistance. J. Plant. Res. 2020, 133, 409–417. [Google Scholar] [CrossRef]
  38. Verma, V.; Ravindran, P.; Kumar, P.P. Plant Hormone-Mediated Regulation of Stress Responses. BMC Plant. Biol. 2016, 16, 86. [Google Scholar] [CrossRef] [Green Version]
  39. Shi, X.; Gupta, S.; Rashotte, A.M. Solanum lycopersicum Cytokinin Response Factor (SlCRF) Genes: Characterization of CRF Domain-Containing ERF Genes in Tomato. J. Exp. Bot. 2012, 63, 973–982. [Google Scholar] [CrossRef] [Green Version]
  40. Nanda, A.K.; Melnyk, C.W. The Role of Plant Hormones during Grafting. J. Plant. Res. 2018, 131, 49–58. [Google Scholar] [CrossRef] [Green Version]
  41. Zhai, L.; Wang, X.; Tang, D.; Qi, Q.; Yer, H.; Jiang, X.; Han, Z.; McAvoy, R.; Li, W.; Li, Y. Molecular and Physiological Characterization of the Effects of Auxin-Enriched Rootstock on Grafting. Hortic. Res. 2021, 8, 74. [Google Scholar] [CrossRef] [PubMed]
  42. Zhang, S.; Wang, X. Expression Pattern of GASA, Downstream Genes of DELLA, in Arabidopsis. Sci. Bull. 2008, 53, 3839–3846. [Google Scholar] [CrossRef] [Green Version]
  43. Nahirnak, V.; Almasia, N.I.; Hopp, H.E.; Vazquez-Rovere, C. Snakin/GASA Protein Involvement in Hormone Crosstalk and Redox Homeostasis. Plant. Signal. Behav. 2012, 7, 1004–1008. [Google Scholar] [CrossRef] [Green Version]
  44. Kawaguchi, M.; Taji, A.; Backhouse, D.; Oda, M. Anatomy and Physiology of Graft Incompatibility in Solanaceous Plants. J. Hortic. Sci. Biotechnol. 2008, 83, 581–588. [Google Scholar] [CrossRef]
  45. Oda, M.; Maruyama, M.; Mori, G. Water Transfer at Graft Union of Tomato Plants Grafted. J. Jpn. Soc. Hortic. Sci. 2005, 74, 458–463. [Google Scholar] [CrossRef] [Green Version]
  46. Kurotani, K.I.; Notaguchi, M. Cell-to-Cell Connection in Plant Grafting—Molecular Insights into Symplasmic Reconstruction. Plant. Cell Physiol. 2021, 62, 1362–1371. [Google Scholar] [CrossRef] [PubMed]
  47. Heddad, M.; Adamska, I. Light Stress-Regulated Two-Helix Proteins in Arabidopsis Thaliana Related to the Chlorophyll Ab-Binding Gene Family PLANT BIOLOGY. Proc. Natl. Acad. Sci. USA 2000, 28, 3741–3746. [Google Scholar] [CrossRef]
  48. Reddy, A.R.; Chaitanya, K.V.; Vivekanandan, M. Drought-Induced Responses of Photosynthesis and Antioxidant Metabolism in Higher Plants. J. Plant. Physiol. 2004, 161, 1189–1202. [Google Scholar] [CrossRef]
  49. Irisarri, P.; Binczycki, P.; Errea, P.; Martens, H.J.; Pina, A. Oxidative Stress Associated with Rootstock-Scion Interactions in Pear/Quince Combinations during Early Stages of Graft Development. J. Plant. Physiol. 2015, 176, 25–35. [Google Scholar] [CrossRef] [PubMed]
  50. Bolger, A.M.; Lohse, M.; Usadel, B. Trimmomatic: A Flexible Trimmer for Illumina Sequence Data. Bioinformatics 2014, 30, 2114–2120. [Google Scholar] [CrossRef] [Green Version]
  51. Li, H.; Durbin, R. Fast and Accurate Long-Read Alignment with Burrows–Wheeler Transform. Bioinformatics 2010, 26, 589–595. [Google Scholar] [CrossRef] [Green Version]
  52. Quinlan, A.R.; Hall, I.M. BEDTools: A Flexible Suite of Utilities for Comparing Genomic Features. Bioinformatics 2010, 26, 841–842. [Google Scholar] [CrossRef] [PubMed] [Green Version]
  53. Li, H.; Handsaker, B.; Wysoker, A.; Fennell, T.; Ruan, J.; Homer, N.; Marth, G.; Abecasis, G.; Durbin, R. The Sequence Alignment/Map Format and SAMtools. Bioinformatics 2009, 25, 2078–2079. [Google Scholar] [CrossRef] [PubMed] [Green Version]
  54. The Tomato Genome Consortium. The Tomato Genome Sequence Provides Insights into Fleshy Fruit Evolution. Nature 2012, 485, 635–641. [Google Scholar] [CrossRef] [Green Version]
  55. Liao, Y.; Smyth, G.K.; Shi, W. FeatureCounts: An Efficient General Purpose Program for Assigning Sequence Reads to Genomic Features. Bioinformatics 2014, 30, 923–930. [Google Scholar] [CrossRef] [PubMed] [Green Version]
  56. Afgan, E.; Baker, D.; Batut, B.; van den Beek, M.; Bouvier, D.; Čech, M.; Chilton, J.; Clements, D.; Coraor, N.; Grüning, B.A.; et al. The Galaxy Platform for Accessible, Reproducible and Collaborative Biomedical Analyses: 2018 Update. Nucleic Acids Res. 2018, 46, W537–W544. [Google Scholar] [CrossRef] [Green Version]
  57. Law, C.W.; Chen, Y.; Shi, W.; Smyth, G.K. Voom: Precision Weights Unlock Linear Model Analysis Tools for RNA-Seq Read Counts. Genome Biol. 2014, 15, 29. [Google Scholar] [CrossRef] [PubMed] [Green Version]
  58. Livak, K.J.; Schmittgen, T.D. Analysis of Relative Gene Expression Data Using Real-Time Quantitative PCR and the 2-ΔΔCT Method. Methods 2001, 25, 402–408. [Google Scholar] [CrossRef]
  59. Mi, H.; Huang, X.; Muruganujan, A.; Tang, H.; Mills, C.; Kang, D.; Thomas, P. PANTHER Version 14: More Genomes, a New PANTHER GO-Slim and Improvements in Enrichment Analysis Tools. Nucleic Acids Res. 2019, 47, 419–426. [Google Scholar] [CrossRef] [PubMed]
Figure 1. Grafting in tomato plants increases survival rate through the shoot apical meristem and apical dominance recovery from the axillary bud. (a) Schematic representation of the drought stress experimental design, marking the points of sample collection for RNA sequencing. D0 indicated before treatment and D3 indicates 3 d of drought stress treatment. GH = grafting healing, DS = drought stress. (b) Survival rates of all tomato lines after drought stress treatment. (c) Phenotype of self-grafted Momotaro (Momo/Momo) tomato recovery after 12 d of drought stress treatment through apical meristem, apical dominance, or no recovery. Control: TTM-079 [TD1 (n = 30)], green guard [GS (n = 30)], green force [GF (n = 30)], and Momo (n = 30). Grafted: Momo/TD1 (n = 19), Momo/GF (n = 8), and Momo/Momo (n = 16). Green = apical meristem, brown = apical dominance, and gray = no recovery. White scale = 1 cm.
Plants 11 01947 g001
Figure 2. Control and grafted tomato lines show different gene expression pattern under normal and stress conditions. (a) Dendrogram of control and grafted tomato lines under D0 and D3. Brackets indicated sample lines that were grouped as control and grafted, and D0 and D3. (b) Heatmap of the gene expression in logarithm counts per million (Log2 CPM) of the different grafted combinations and non-grafted tomato lines. Red and blue indicate high and low expressions, respectively. Top brackets group the gene expression similarities between tomato lines. D0 and D3 indicates before drought stress and day 3 during drought stress treatment.
Plants 11 01947 g002
Figure 3. Comparison of the differentially expressed genes (DEGs) in grafted and control before drought stress treatment. (a) Volcano plot representation of DEGs up-regulated and down-regulated by grafting. The x axis shows Log2 fold change (FC) between Grafting vs. Control and y axis shows −Log10 (p-value). (b) Bar plot showing gene ontology (GO) enrichment analysis (Panther, false discovery rate < 0.05) for biological process in DEGs by grafted plants. Red and blue color indicate high and low gene expressions on significant DEGs (Adj. p < 0.05, Log2FC ≥ |1|). The x axis shows the number of genes categorized in each GO term (y axis).
Plants 11 01947 g003
Figure 4. Differentially expressed genes (DEGs) and enriched pathways in grafted and control shoot apical meristem before drought stress and day 3 during stress. Volcano plot representation of DEGs up-regulated and down-regulated by drought stress treatment in (a) control and (b) grafted samples. The x axis shows logarithm fold change (Log2FC [D3/D0]) and y axis shows –Log10 (p-value). Significant DEGs (Adj. p < 0.05, Log2FC ≥ |1|) are in red and blue for up-regulation and down-regulation. (c) Bar plot showing gene ontology (GO) enrichment analysis (Panther, false discovery rate (FDR) < 0.05) for biological processes on significant DEGs of the control and grafted samples. Empty bars indicate the control and fill bars indicate the grafted samples. The x axis shows the number of genes categorized in each GO term (y axis). (d) Comparison of the DEGs in the grafted and control samples during stress. The x axis shows logarithm fold change (Log2FC [Grafting/Control]) and y axis shows –Log10 (p-value). (e) Bar plot showing GO enrichment analysis (Panther, FDR < 0.05) for biological process in DEGs by the grafted samples. Red and blue color indicate higher and lower gene expression on significant DEGs (Adj. p < 0.05, Log2FC ≥ |1|). The x axis shows the –Log10 (p-value) categorized in each GO term (y axis).
Plants 11 01947 g004aPlants 11 01947 g004b
Figure 5. Changes in gene expression of 4 genes differentially expressed by grafting or drought stress assessed by quantitative real-time PCR. (a) Heat shock protein (Solyc08g062450); (b) Ascorbate peroxidase (Solyc09g007270); (c) Chlorophyll a–b binding protein (Solyc08g067330); and (d) 9-cis-epoxycaratenoid dioxygenase (Solyc07g056570). Gray bars represent before treatment (D0) and black bars represent 3 days drought stress treatment (D3). Asterisks denote significant differences according to t-test (Wilcoxon test) between D0 and D3 of each line, where * indicate p < 0.05, ** p < 0.01, *** p < 0.001, and **** p < 0.0001. No significance is denoted as ns. Error bars represent the standard error from 3 biological replicates with 3 technical replicates.
Plants 11 01947 g005
Figure 6. Compatible [Momotaro shoot (Momo)/TTM-079 (TD1) and Momo/Momo] and incompatible grafted lines [Momo/green force (GF)] show differentially expressed genes revealed by transcriptomic analysis. Gene ontology (GO) analysis classification on (a) reduced gene expression on DEGs by Momo/GF (fold change ≥ 2, Momo/TD1, Momo/Momo vs. Momo/GF) and (b) increased gene expression on DEGs by Momo/GF (fold change ≤ 0.5, Momo/TD1, Momo/Momo vs. Momo/GF). The x axis shows the number of genes of each GO cluster classification, and the y axis shows the GO ontology term.
Plants 11 01947 g006
Table 1. List of hormone-related genes differentially expressed by grafting before drought stress (D0).
Gene IDAnnotationLog2FC * (Grafted /Control)Adj. p-Value
Abscisic Acid-related genes
Solyc03g095780Abscisic acid receptor PYL4-like4.24.2 × 10−3
Solyc09g015380Abscisic acid receptor PYL53.24.2 × 10−3
Solyc06g050500Abscisic acid receptor PYL4-like3.29.6 × 10−3
Solyc10g076410Abscisic acid receptor PYL63.02.0 × 10−2
Solyc10g085310Abscisic acid receptor PYL52.45.5 × 10−3
Solyc12g055990Abscisic acid receptor PYL101.24.4 × 10−3
Auxin-related genes
Solyc07g042490Auxin-responsive SAUR protein3.72.5 × 10−3
Solyc02g037550Auxin efflux carrier2.64.8 × 10−3
Solyc01g110580Small auxin up-regulated RNA51.45.2 × 10−3
Solyc02g077560Auxin response factor 31.34.7 × 10−4
Solyc01g110920Small auxin up-regulated RNA261.32.9 × 10−2
Solyc09g007810Auxin Response Factor 16A1.02.0 × 10−3
Solyc05g046320Small auxin up-regulated RNA55−1.11.3 × 10−2
Solyc06g075150Auxin Response Factor 10B−1.54.3 × 10−3
Solyc01g099840Dormancy/auxin associated protein−1.61.6 × 10−2
Solyc02g077880Auxin-repressed protein−2.61.2 × 10−3
Cytokinin-related genes
Solyc06g075090Cytokinin riboside 5-monophosphate phosphoribohydrolase1.73.7 × 10−3
Solyc04g080820Cytokinin oxidase 41.44.6 × 10−2
Solyc10g082020Cytokinin riboside 5-monophosphate phosphoribohydrolase1.22.4 × 10−2
Solyc03g007460Solanum lycopersicum Cytokinin Response Factor 4−1.51.6 × 10−2
Ethylene-related genes
Solyc04g011440Ethylene-responsive heat shock protein cognate 705.48.6 × 10−4
Solyc09g059390Ethylene-responsive transcription factor4.91.8 × 10−2
Solyc12g056590Ethylene Response Factor D.23.51.4 × 10−2
Solyc01g090300Ethylene-responsive transcription factor 22.43.3 × 10−2
Solyc06g065820Ethylene Response Factor H.12.04.5 × 10−2
Solyc01g106820Ethylene-dependent gravitropism-deficient and yellow-green-like 31.99.6 × 10−3
Solyc08g066660Ethylene-responsive transcription factor TINY1.83.8 × 10−2
Solyc04g012050Ethylene-responsive transcription factor1.72.6 × 10−2
Solyc03g118190Ethylene-responsive transcription factor1.74.4 × 10−2
Solyc03g093610Ethylene response factor A.21.63.0 × 10−3
Solyc01g006650ETHYLENE INSENSITIVE 3-like 3 protein1.51.0 × 10−2
Solyc04g078640Ethylene-responsive transcription factor RAP2-1−1.33.9 × 10−2
Solyc07g054220Ethylene-responsive transcription factor−1.52.4 × 10−2
Solyc06g019200Ethylene-dependent gravitropism-deficient and yellow-green-like 2−1.71.8 × 10−2
Solyc08g007230Ethylene-responsive transcription factor 2−1.84.9 × 10−2
Solyc02g088310Ethylene-responsive transcription factor−2.01.1 × 10−2
Gibberellin-related genes
Solyc02g083880Gibberellin-regulated protein 34.24.3 × 10−4
Solyc01g150176Gibberellin-regulated protein3.94.8 × 10−4
Solyc03g113910Gibberellin-regulated protein 142.92.7 × 10−3
Solyc12g042500Gibberellin-regulated family protein1.83.3 × 10−2
Solyc09g074270Gibberellin receptor1.57.6 × 10−3
Jasmonic acid-related genes
Solyc01g103595Jasmonate ZIM domain protein l2.04.2 × 10−2
* Logarithm fold change between grafted and control (Log2 FC > |1|, Adj. p-value < 0.05).
Table 2. List of differentially expressed genes with potential significance to identify compatible grafts [Momotaro (Momo)/TTM-079 (TD1) and Momo/Momo] vs. incompatible [Momo/green force (GF)] lines.
Gene IDAnnotationLog2FC * (Compatible vs. Incompatible)
Momo/TD1 vs. Momo/GFMomo/Momo vs. Momo/GF
GO:0006355 Regulation of transcription, DNA-templated
Solyc04g079930Histone deacetylase complex subunit1.01.3
Solyc07g008540Zinc finger protein CONSTANS-LIKE 21.21.8
GO:0009725 Response to hormone
Solyc05g047590Pectinesterase1.31.8
Solyc06g050500Abscisic acid receptor PYL4-like1.21.6
GO:0009628 Response to abiotic stimulus
Solyc08g061130Transcription factor HY51.11.1
Solyc09g065660Heat shock transcription factor1.63.6
GO:0006950 Response to stress -> GO:0042594 Response to starvation
Solyc02g088240Phosphate transporter PHO1-like protein 5−2.6−2.9
Solyc08g068240Phosphate transporter PHO1-like protein−1.2−1.7
GO:0005975 Carbohydrate metabolic process -> GO:0009832 Plant-type cell wall biogenesis
Solyc01g103860COBRA-like protein−1.2−1.0
Solyc03g114900COBRA-like protein−2.1−3.0
GO:0006950 Response to stress -> GO:0009611 Response to wounding
Solyc08g036660Jasmonate ZIM domain protein f−4.7−3.6
Solyc08g036640Jasmonate ZIM domain protein f−3.1−2.4
* Logarithm fold change between compatible and incompatible (Log2FC > |1| RPKM).
Publisher’s Note: MDPI stays neutral with regard to jurisdictional claims in published maps and institutional affiliations.

