Article

Gene Losses and Plastome Degradation in the Hemiparasitic Species Plicosepalus acaciae and Plicosepalus curviflorus: Comparative Analyses and Phylogenetic Relationships among Santalales Members

by
Widad AL-Juhani
1,*,
Noha T. Al Thagafi
2 and
Rahmah N. Al-Qthanin
3,4
1
Department of Biology, Faculty of Applied Science, Umm Al-Qura University, Makkah 24381, Saudi Arabia
2
Department of Biology, Faculty of Science, Taif University, Taif 21974, Saudi Arabia
3
Department of Biology, College of Sciences, King Khalid University, Abha 61421, Saudi Arabia
4
Prince Sultan Bin-Abdul-Aziz Center for Environment and Tourism Studies and Researches, King Khalid University, Abha 61421, Saudi Arabia
*
Author to whom correspondence should be addressed.
Plants 2022, 11(14), 1869; https://doi.org/10.3390/plants11141869
Submission received: 23 April 2022 / Revised: 18 June 2022 / Accepted: 7 July 2022 / Published: 18 July 2022
(This article belongs to the Special Issue 10th Anniversary of Plants—Recent Advances and Perspectives)

Abstract

:
The Plicosepalus genus includes hemiparasitic mistletoe and belongs to the Loranthaceae family, and it has several medicinal uses. In the present study, we sequenced the complete plastomes of two species, Plicosepalus acaciae and Plicosepalus curviflorus, and compared them with the plastomes of photosynthetic species (hemiparasites) and nonphotosynthetic species (holoparasites) in the order Santalales. The complete chloroplast genomes of P. acaciae and P. curviflorus are circular molecules with lengths of 120,181 bp and 121,086 bp, respectively, containing 106 and 108 genes and 63 protein-coding genes, including 25 tRNA and 4 rRNA genes for each species. We observed a reduction in the genome size of P. acaciae and P. curviflorus and the loss of certain genes, although this reduction was less than that in the hemiparasite and holoparasitic cp genomes of the Santalales order. Phylogenetic analysis supported the taxonomic state of P. acaciae and P. curviflorus as members of the family Loranthaceae and tribe Lorantheae; however, the taxonomic status of certain tribes of Loranthaceae must be reconsidered and the species that belong to it must be verified. Furthermore, available chloroplast genome data of parasitic plants could help to strengthen efforts in weed management and encourage biotechnology research to improve host resistance.

1. Introduction

Parasitic plants completely or partially lose the ability to photosynthesize, and they absorb water and nutrients from the host via the haustorium. Depending on the degree of loss of photosynthetic ability, parasitic plants are divided into photosynthetic parasites (hemiparasites) and nonphotosynthetic parasites (holoparasites) [1]. All hemiparasitic species are capable of photosynthesis (at different levels), whereas holoparasites entirely lose their photosynthetic ability and obtain all nutrients from their hosts [2]. The most parasitic plant species are included in the family Orobanchaceae and the order Santalales.
The family Loranthaceae is the largest in the sandalwood order Santalales, and it includes 76 genera and over 1000 species [3,4]. Loranthaceae are mainly distributed in tropical and subtropical regions of the Americas, Africa, Asia and Australia, with a few species extending to the temperate zones in Europe and East Asia [3,5]. The origin of the Loranthaceae family has been traced back to the Australasian continent in the Late Cretaceous, and it was likely dispersed by birds from Australasia to Asia. African and European species migrated from Asia after the middle Oligocene, and birds also played an important role in dispersing Loranthaceae from Africa to Madagascar [3]. Loranthaceae mainly include aerial parasitic plants, although they also contain three monotypic genera that are root parasites and considered relicts [5]. Mistletoe is an aerial parasitic plant that depends on pollination and seed dispersal by birds and other pollinators, and it provides a habitat for these organisms; moreover, mistletoe determines the natural structure of the surrounding plant communities [6].
In terms of taxonomic state, initial studies on Loranthaceae included most mistletoes in the genus Loranthus or in a section of Loranthus [7,8] presented genera with new names, some of which are still used at present. However, the interspecific relationships within genera remain unclear [4].
The Loranthaceae family was divided into tribes and subtribes [5,9] according to morphological data, chromosome numbers, and molecular sequences of the “nuclear gene rDNA and chloroplast genes rbcl, matk, and trnl-F”. The tribe Lorantheae has been characterized by a chromosome number x = 9, the tribe Psittacantheae has been characterized by x = 8, while the other two tribes (Elytrantheae and Nuytsieae) have been characterized by x = 12 [5].
P. acaciae (Zucc.) Wiens and Polhill, and P. curviflorus (Benth. ex Oliv.) Tiegh, are hemiparasite species (mistletoe) belonging to Loranthaceae. These plants are woody parasites with brownish slender branchlets, evergreen, rigidly coriaceous, oblong to elliptic-oblong, glabrous leaves, solitary or clustered umbels of scarlet flowers, and berry fruits, and they are widespread parasites of Acacia [10]. P. acaciae is distributed in Syria to northeast tropical Africa and the southern Arabian Peninsula. P. curviflorus is distributed in southeast Egypt to east central and east tropical Africa. Plicosepalus is traditionally used as a treatment for diabetes and cancer and as an antioxidant, antimicrobial, anti-inflammatory agent, and it is also used to increase lactation in cattle [11,12].
According to the parsimony, likelihood and Bayesian inference trees presented by [5], Plicosepalus sagittiflorus belongs to subtribe Loranthinae (Clade J) and Asian and African taxa (x = 9). Furthermore, this study reported 12 species belonging to the genus Plicosepalus, which is the same number currently mentioned in Plants of the World Online [13].
Liu et al. conducted taxonomic analyses of Loranthaceae based on floral, inflorescence morphology, phylogenetic and biogeographical analyses using both nuclear and chloroplast DNA regions, and they included 62 of the 76 genera [3]. This study classified the species belonging to family Loranthaceae within five tribes (Psittacantheae, Nuytsieae, Elytrantheae, Gaiadendreae and Lorantheae), and species belonging to the tribe Lorantheae were distributed within seven subtribes (Tapinanthinae, Scurrulinae, Emelianthinae, Dendrophthoinae, Amyeminae, Loranthinae and Ileostylinae). The species Plicosepalus sagittiflorus and P. curviflorus are representative of the genus Plicosepalus, which appears in the phylogenetic tree within the subtribe Tapinanthinae and belongs to the Africa–Madagascar section (including regions of the coastal area of the Arabian Peninsula and Sub-Saharan Africa and Madagascar). However, the African subtribe Tapinanthinae was not monophyletic but rather was nested within the Emelianthinae subtribe. Therefore, further studies are recommended to resolve the phylogenetic relationship between Tapinanthinae and Emelianthinae and test the monophyly of the African genera.
The chloroplast is an organelle in plant cells that contains its own genome, the plastome, and it has essential roles in photosynthesis [14]. During the evolutionary history of plant families, plastomes have been subjected to strong selective pressures [15]. Thus, chloroplast genomes include useful phylogenetic information that has been used to study evolutionary relationships at different taxonomic levels and resolve difficult problems in plant phylogenetics [3,16]. Investigating the genomes of hemiparasitic plants is important for understanding the changes in the chloroplast genome of a plant when it shifts from an autotrophic to a parasitic state. Moreover, most parasitic plants are medicinally important, and their reliable identification is important for avoiding damage caused by the misidentification of herbal medicinal plants. This study aimed to assemble and compare the complete plastomes of P. acaciae and P. curviflorus; assess the systematic relationships within the family and tribes of Loranthaceae; and compare the new plastomes with representatives of hemiparasites and holoparasites to investigate the evolution of plastomes associated with parasitism.

2. Results

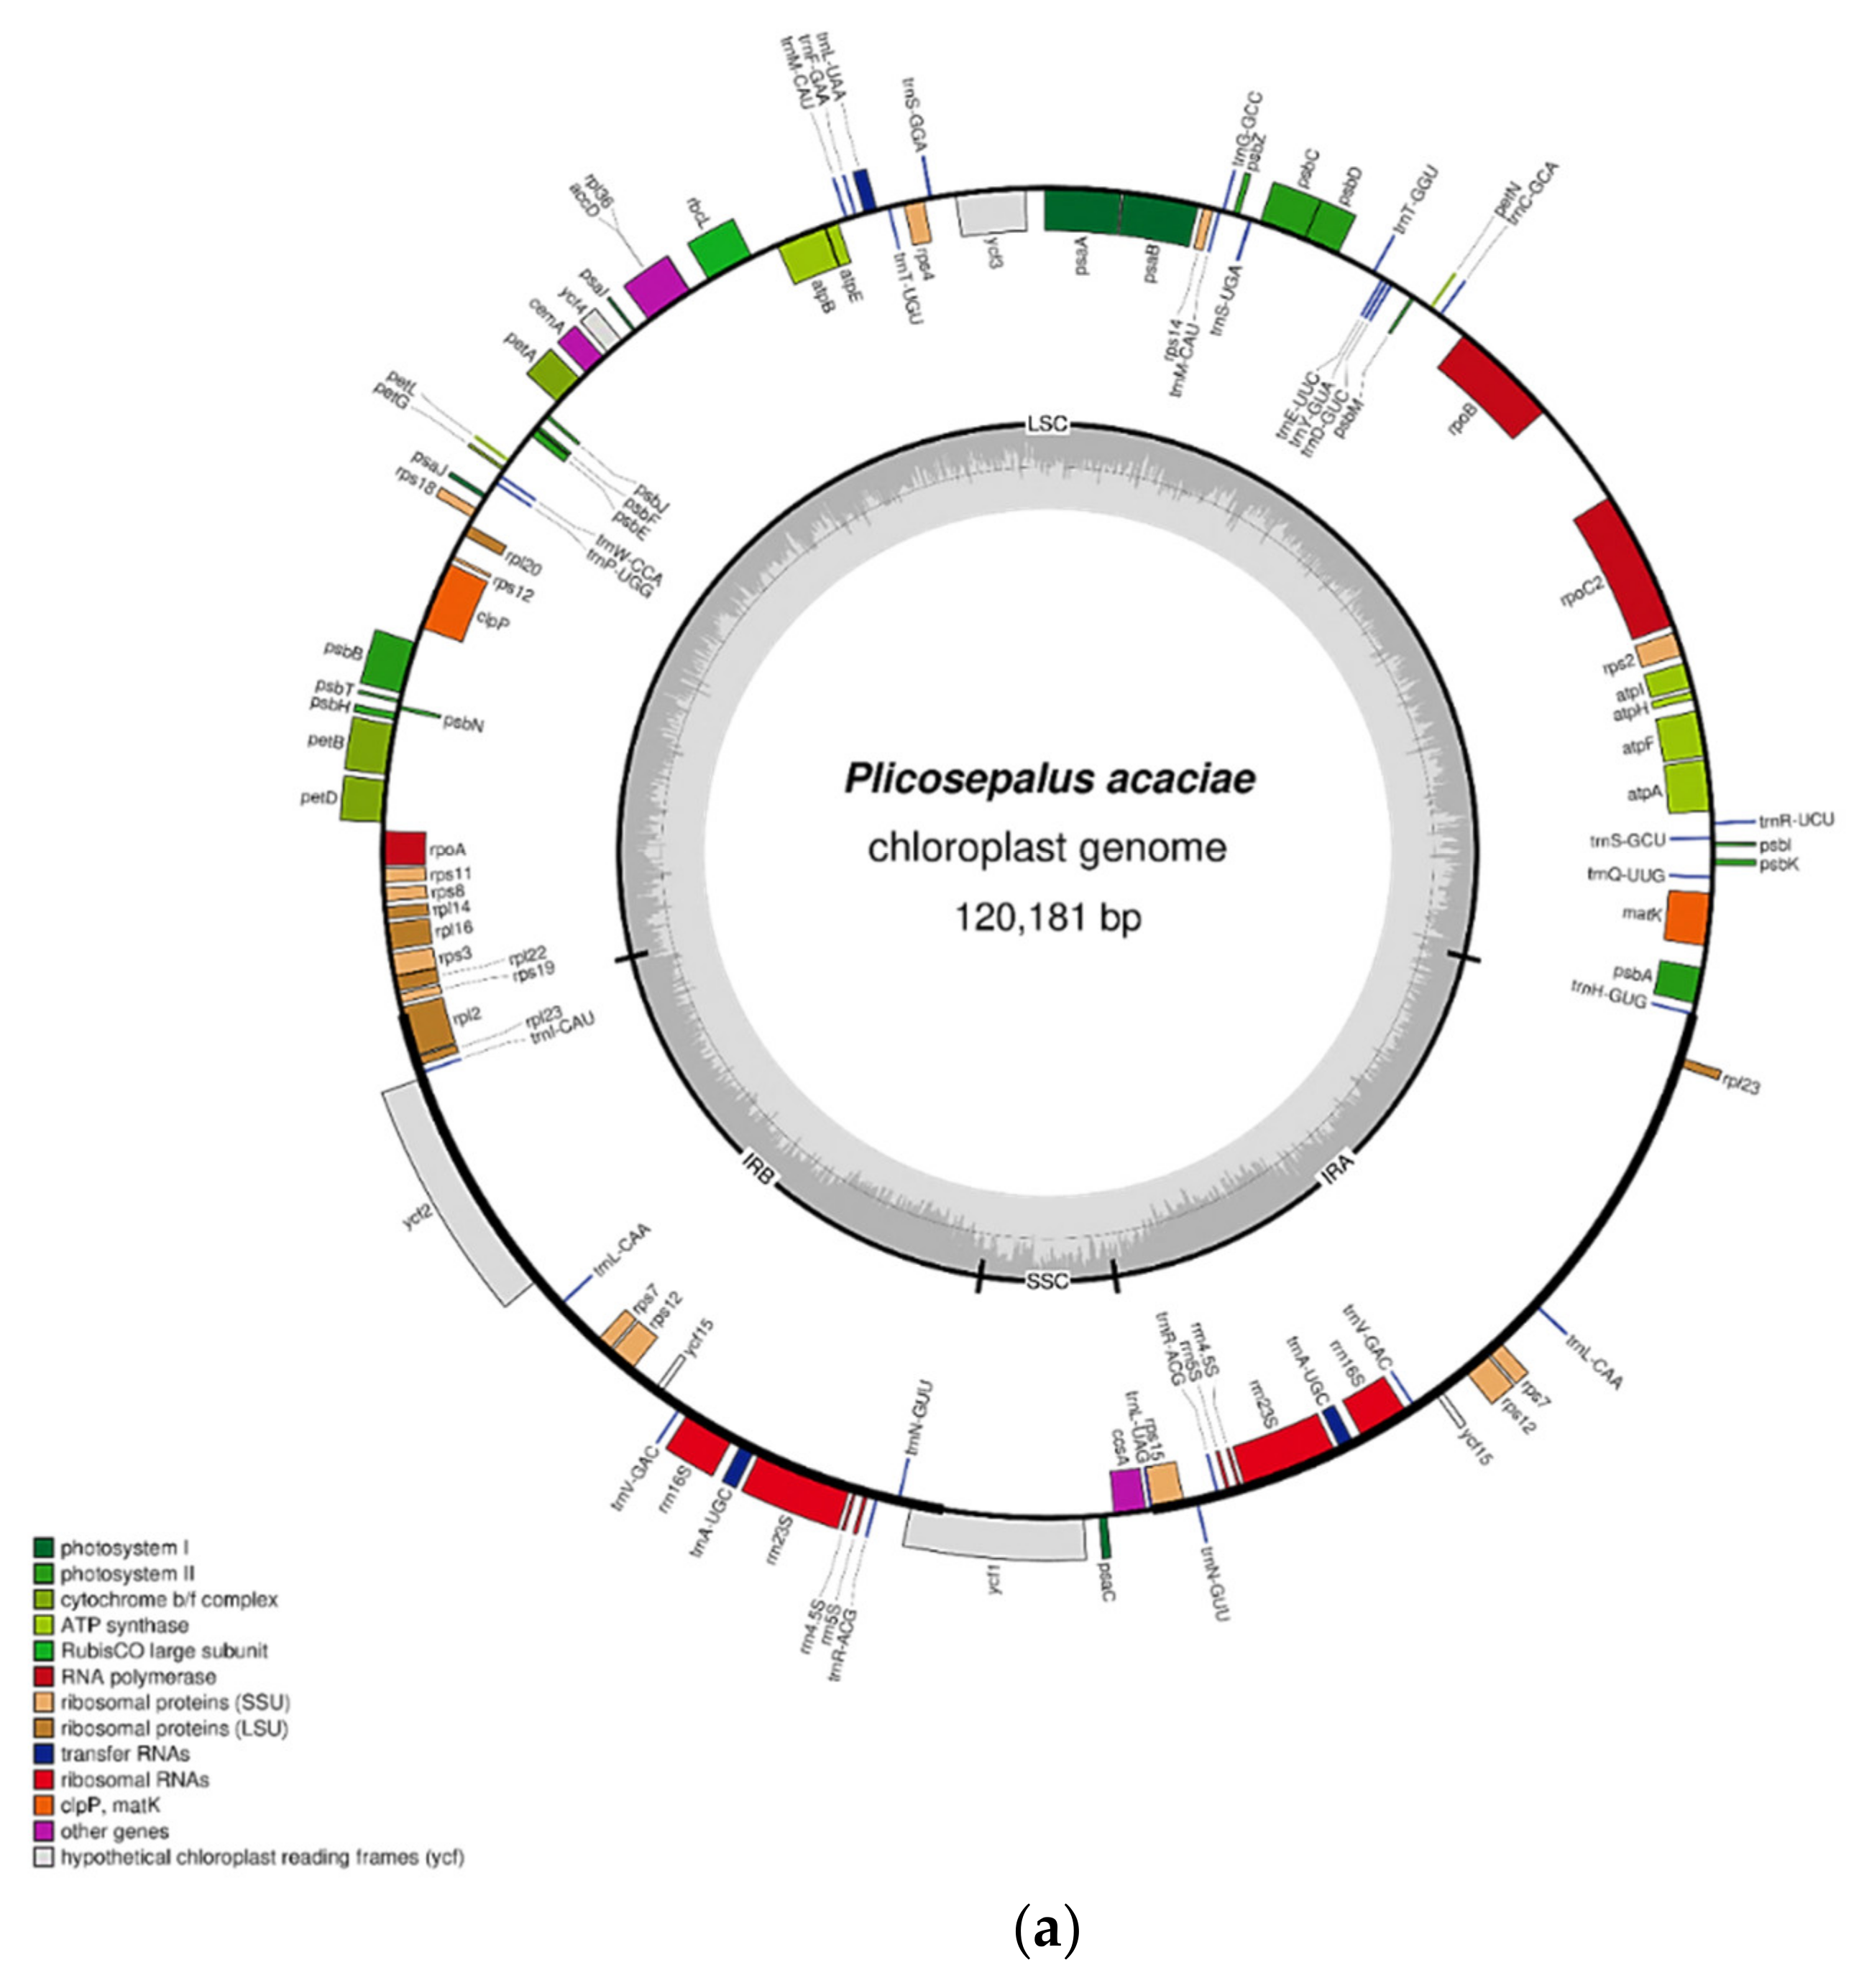
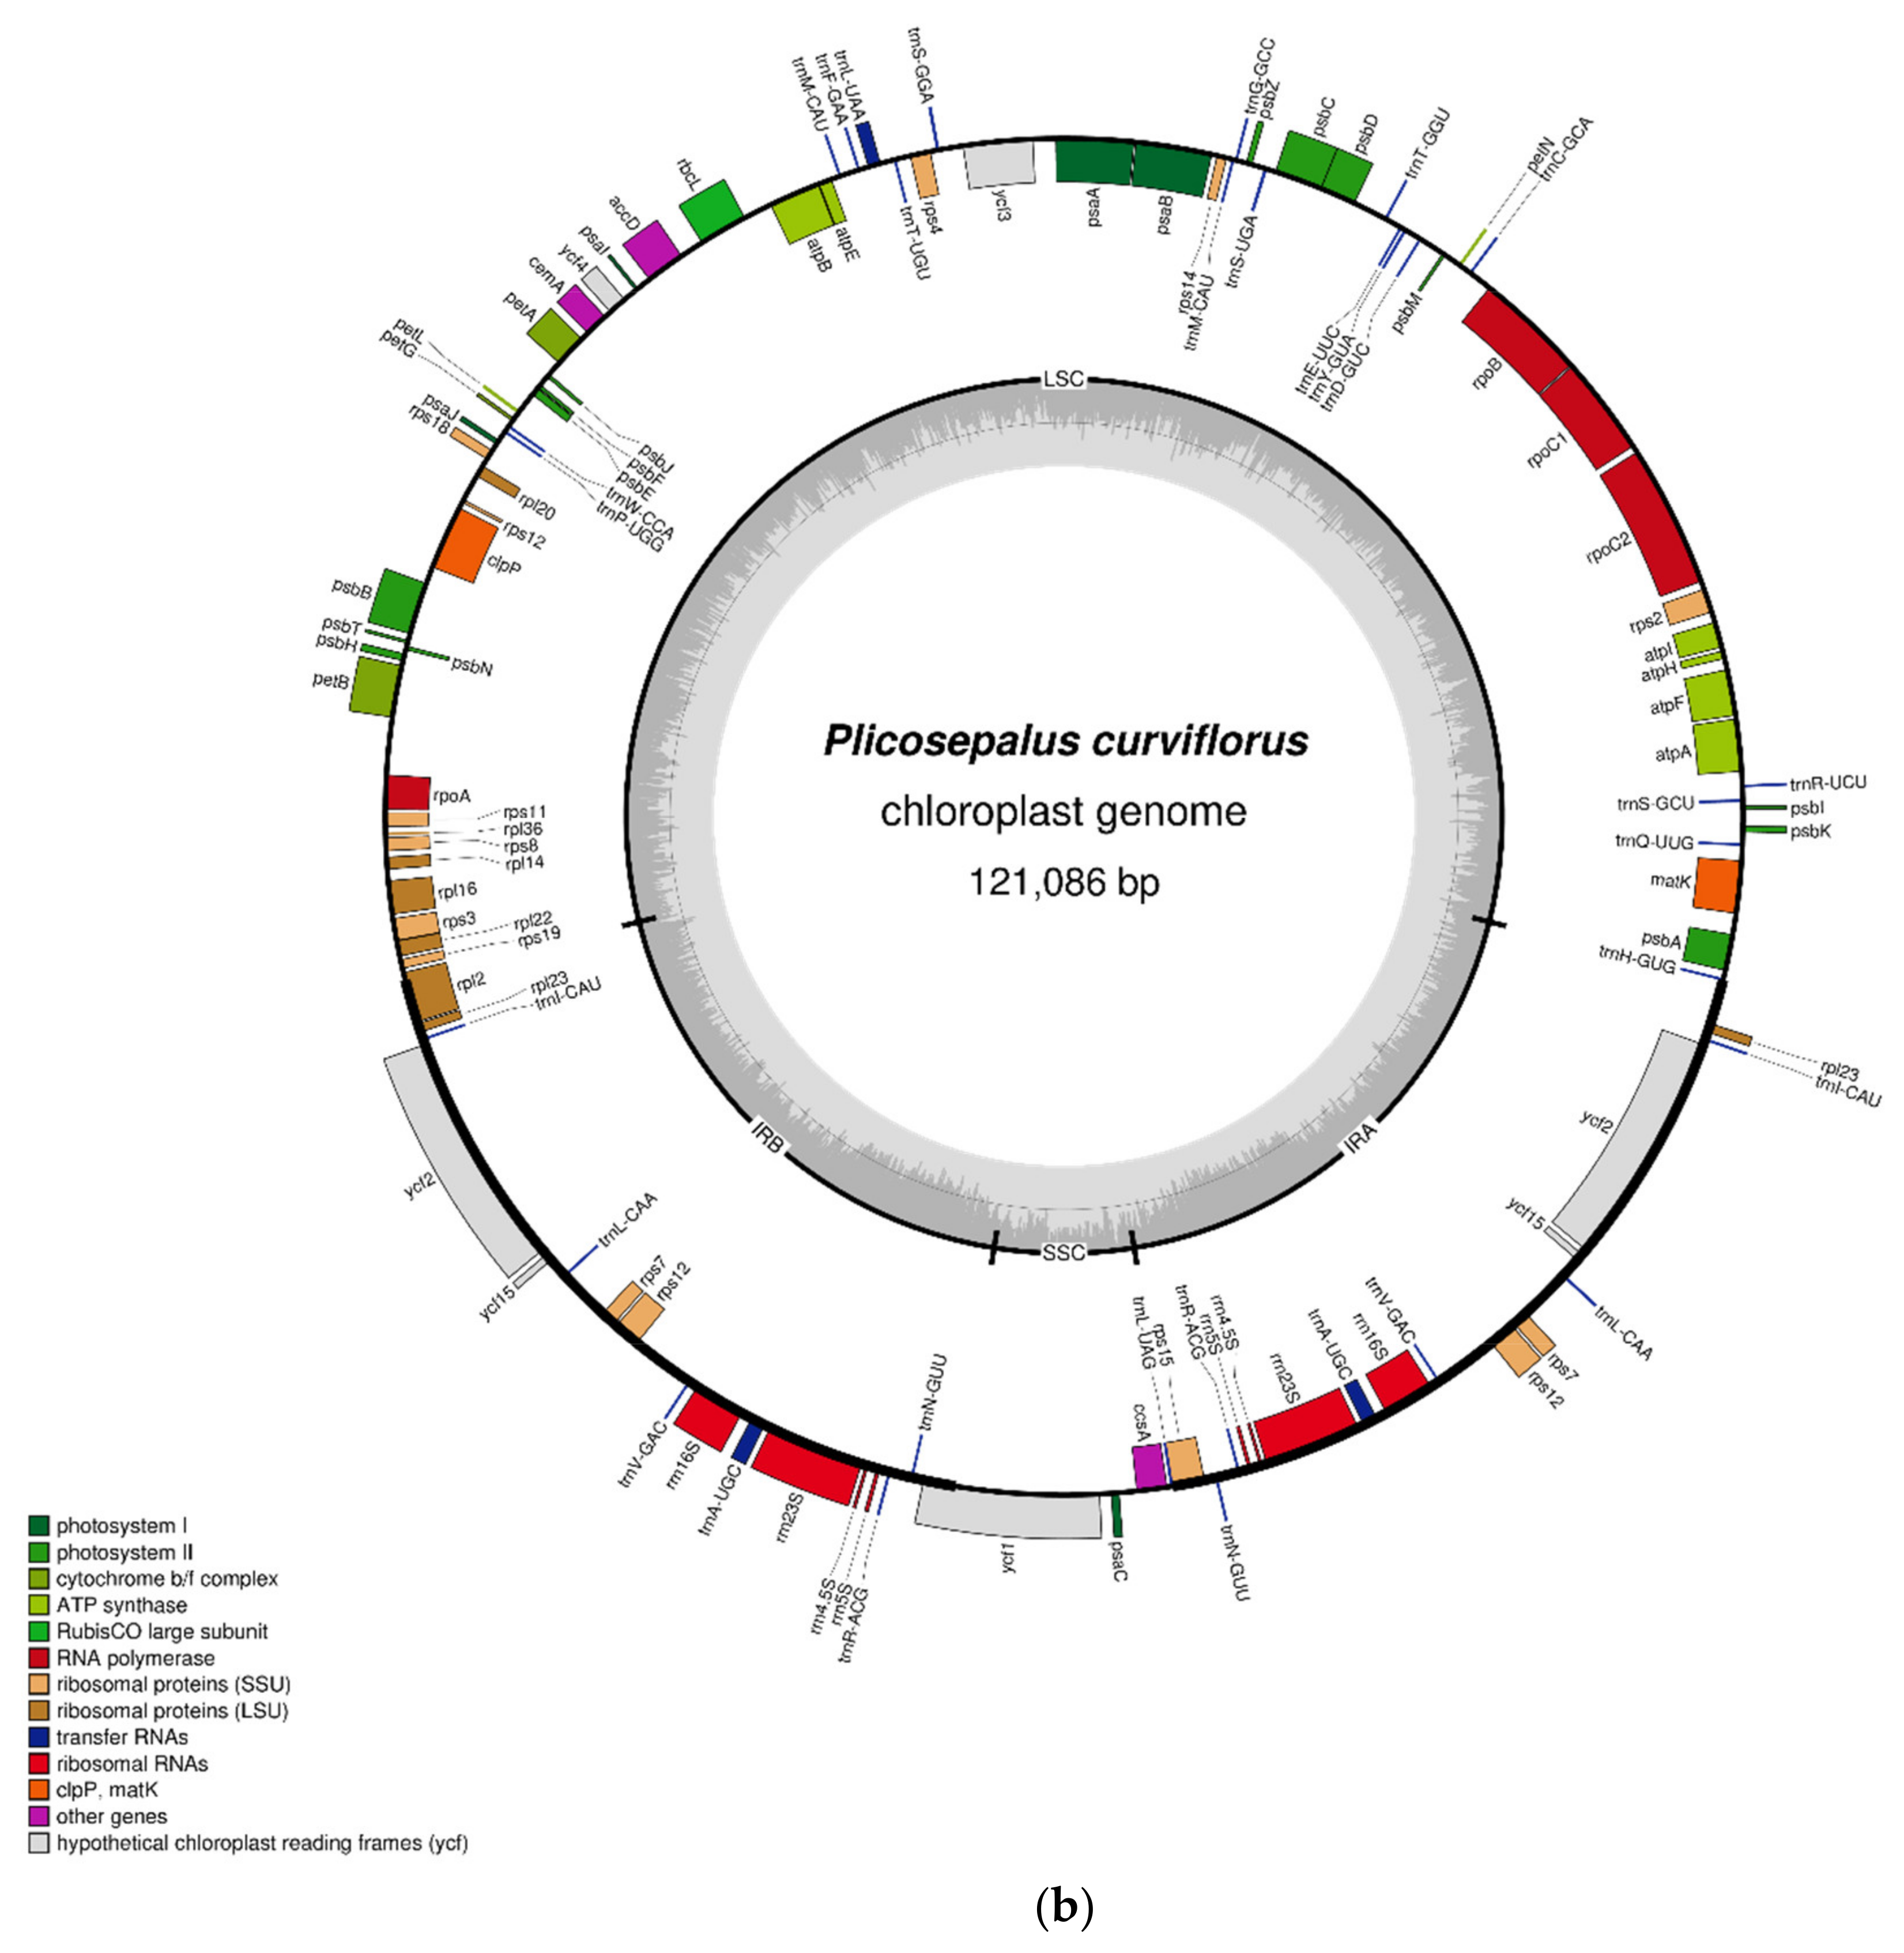
2.1. Characteristics of the Chloroplast Genome

The complete chloroplast genomes of P. acaciae and P. curviflorus are shown in Figure 1, and they are circular molecules with lengths of 120, 181 bp and 121,086 bp, respectively. The chloroplast genome presents a typical four-region structure that consists of a large single copy (LSC), a small single copy (SSC) and two inverted repeats (IRa and IRb). The LSC and SSC regions in P. acaciae and P. curviflorus are 69,497 bp and 69,947 bp long and 6038 bp and 6187 bp long, respectively, while IRa and IRb are 22,323 bp and 22,476 bp each in P. acaciae and P. curviflorus (Table 1). The lengths of the coding regions are 58,089 and 64,539 bp, and they represent 48.33% and 53.30% of the entire genome in P. acaciae and P. curviflorus, respectively, while the noncoding region lengths are 62,092 and 56,547 bp (51.67% and 46.70%), respectively. The percentage of AT in P. acaciae and P. curviflorus in the entire genome is 63.43% and 63.23%, respectively, whereas the percentage of GC is 36.6% and 36.8%, respectively. The genomic structure of P. acaciae and P. curviflorus consists of A = (31.50% and 31.34%), T(U) = (31.93% and 31.89%), C = (18.59% and18.65%) and G = (17.97% and18.12%), respectively, as shown in Table 1.
Figure 1 and Tables S1 and S2 show the results obtained from gene annotation of the chloroplast genomes of P. acaciae and P. curviflorus: 106 and 108 genes were obtained, respectively, which included 92 of unique genes and 12 and 14 genes that were duplicated in the IR region. The cp contains 63 protein-coding genes, including 25 tRNA and 4 rRNA genes for each species. Most of the protein-coding genes start with a methionine codon (AUG).
Introns play a significant role in gene expression regulation [17,18]. Table 2 and Table 3 illustrate that 10 of the 106 and 108 genes in P. acaciae and P. curviflorus contain introns, and they include 8 protein-coding genes and 2 tRNA genes. The ycf3 and clpP genes have two introns, while the remaining genes have only one intron. The seven introns are included in the LSC, and the rest are specifically located within the IRa and IRb regions.

2.2. Relative Synonymous Codon Usage (RSCU)

Codon usage bias plays an important role in chloroplast genome evolution and occurs as a result of natural selection and mutations [19,20]. The nucleotides of protein-coding and tRNA genes (58,089 bp and 64,539 bp, respectively) in P. acaciae and P. curviflorus were used to determine the codon usage bias of the plastome. As shown in Tables S3 and S4, these genes are encoded by 19,363 and 21,513 codons in P. acaciae and P. curviflorus, respectively. As shown in Figure 2, the amino acid leucine was the most frequent amino acid (10.097% and 10.052%, respectively) in P. acaciae and P. curviflorus, cysteine was the least frequent amino acid (1.097%) in P. acaciae, and tryptophan (1.181) was the least frequent amino acid in P. curviflorus.
The RSCU values in P. acaciae in Table S3 show that 27 codons are >1, while 32 codons are <1. The data show that tryptophan, glycine, valine, and methionine with no codon usage bias have an RSCU value of 1. The RSCU values in P. curviflorus in Table S4 show that 26 codons are >1 and 32 codons are <1. The data show that tryptophan, glycine, and methionine with no codon usage bias have an RSCU value of 1.

2.3. RNA Editing Sites

RNA editing sites include the processes of inserting, deleting or modifying nucleotides, which lead to changes in the DNA coding sequence during RNA transcription processes [21], which in turn allows for the creation of different protein transcripts [22]. The PREP suite was used to predict the RNA editing sites in the P. acaciae and P. curviflorus plastomes, and the first codon position of the first nucleotide was used in the analysis. The RNA editing sites are presented in Tables S5 and S6. Overall, there are 33 and 40 editing sites in the genomes of P. acaciae and P. curviflorus distributed among 15 and 16 protein-coding genes. The results show that the highest number of editing sites in P. curviflorus are the rpoB and rpoC2 genes (7 and 6 sites, respectively), while the highest number of editing sites in P. acaciae are the rpoB and matK genes (6 and 5 sites). Most of the codon position exchanges involve the amino acids serine (S) and leucine (L) (S to L). The results of RNA editing show that certain genes do not possess a predictable site in the first nucleotide of the first codon, namely, rpl23, accD, atpB, clpP, petG, petL, psaB, psaI, psbE, psbF, and rps14 in P. acaciae and accD, atpB, clpP, ndhA, ndhB, ndhD, ndhF, ndhG, petD, petG, petL, psaB, psaI, psbE, psbF, psbL, rpl2, rpl23, and rps16 in P. curviflorus.

2.4. Repeat Analysis
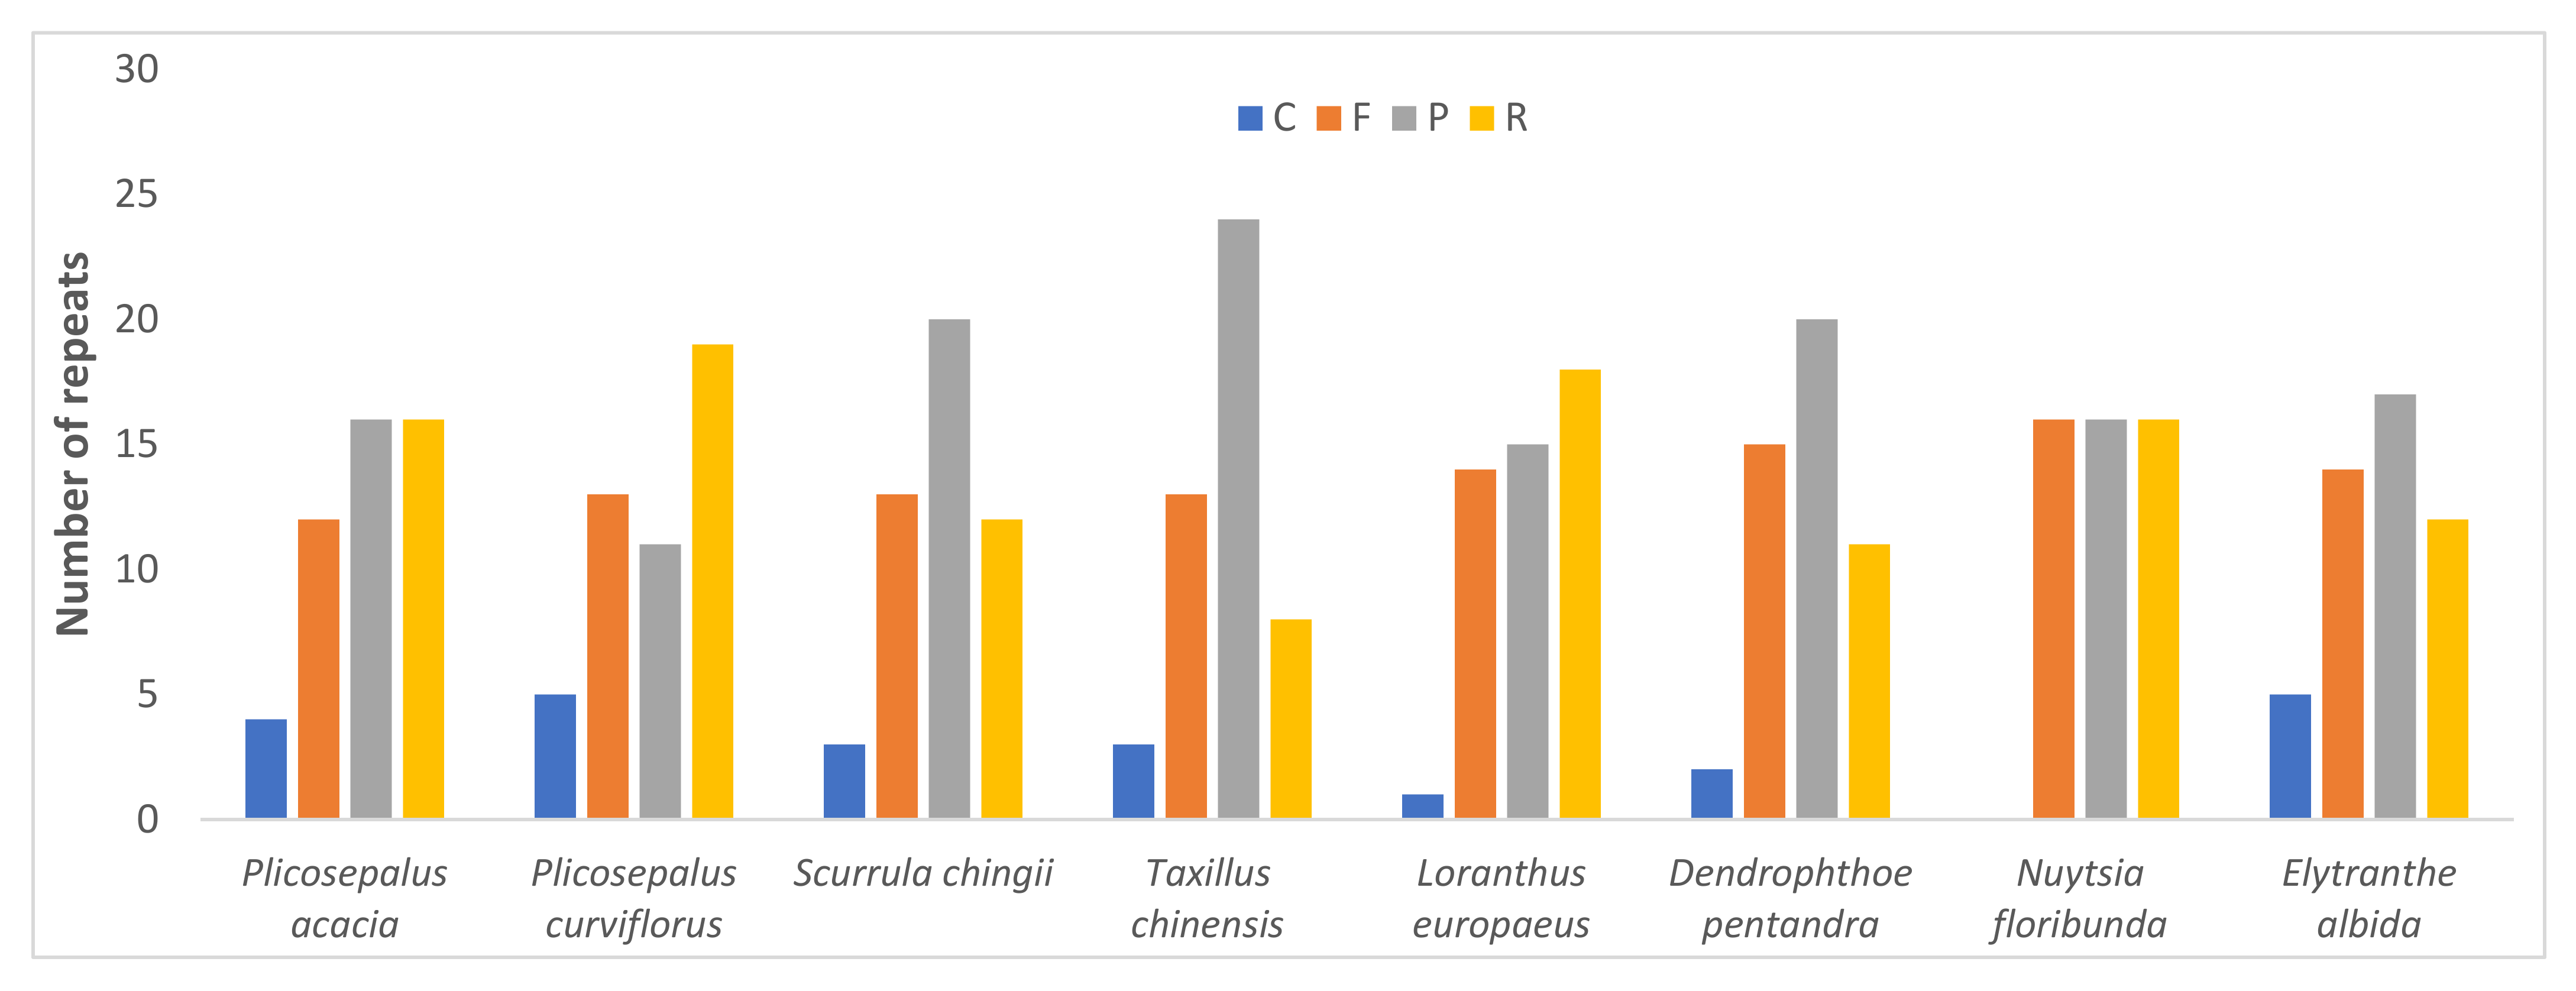
2.4.1. Long Repeats

Figure 3 shows that there are four types of repeats in the P. acaciae and P. curviflorus cp genomes: palindromic (16 and 11), forward (12 and 13), reverse (16 and 19), and complementary (4 and 5). We compared the frequency of repeats (palindromic, forward, reverse, and complementary) in the cp genomes of P. acaciae, P. curviflorus and six species of Loranthaceae (Scurrula chingii (W.C.Cheng) H.S.Kiu, Taxillus chinensis (DC.) Danser, Loranthus europaeus Jacq., Dendrophthoe pentandra (L.) Miq., Nuytsia floribunda (Labill.) R.Br. ex G.Don. Elytranthe albida (Blume) Blume.) (Figure 3). T. chinensis had the highest frequency of palindromic repeats (24), N. floribunda had the highest frequency of forward repeats (16), and P. curviflorus had the highest frequency of reverse repeats (19). Complement repeats were the least common type of repeat in the genome, with P. curviflorus and E. albida having five repeats and N. floribunda presenting no complementary repeats (Figure 3).

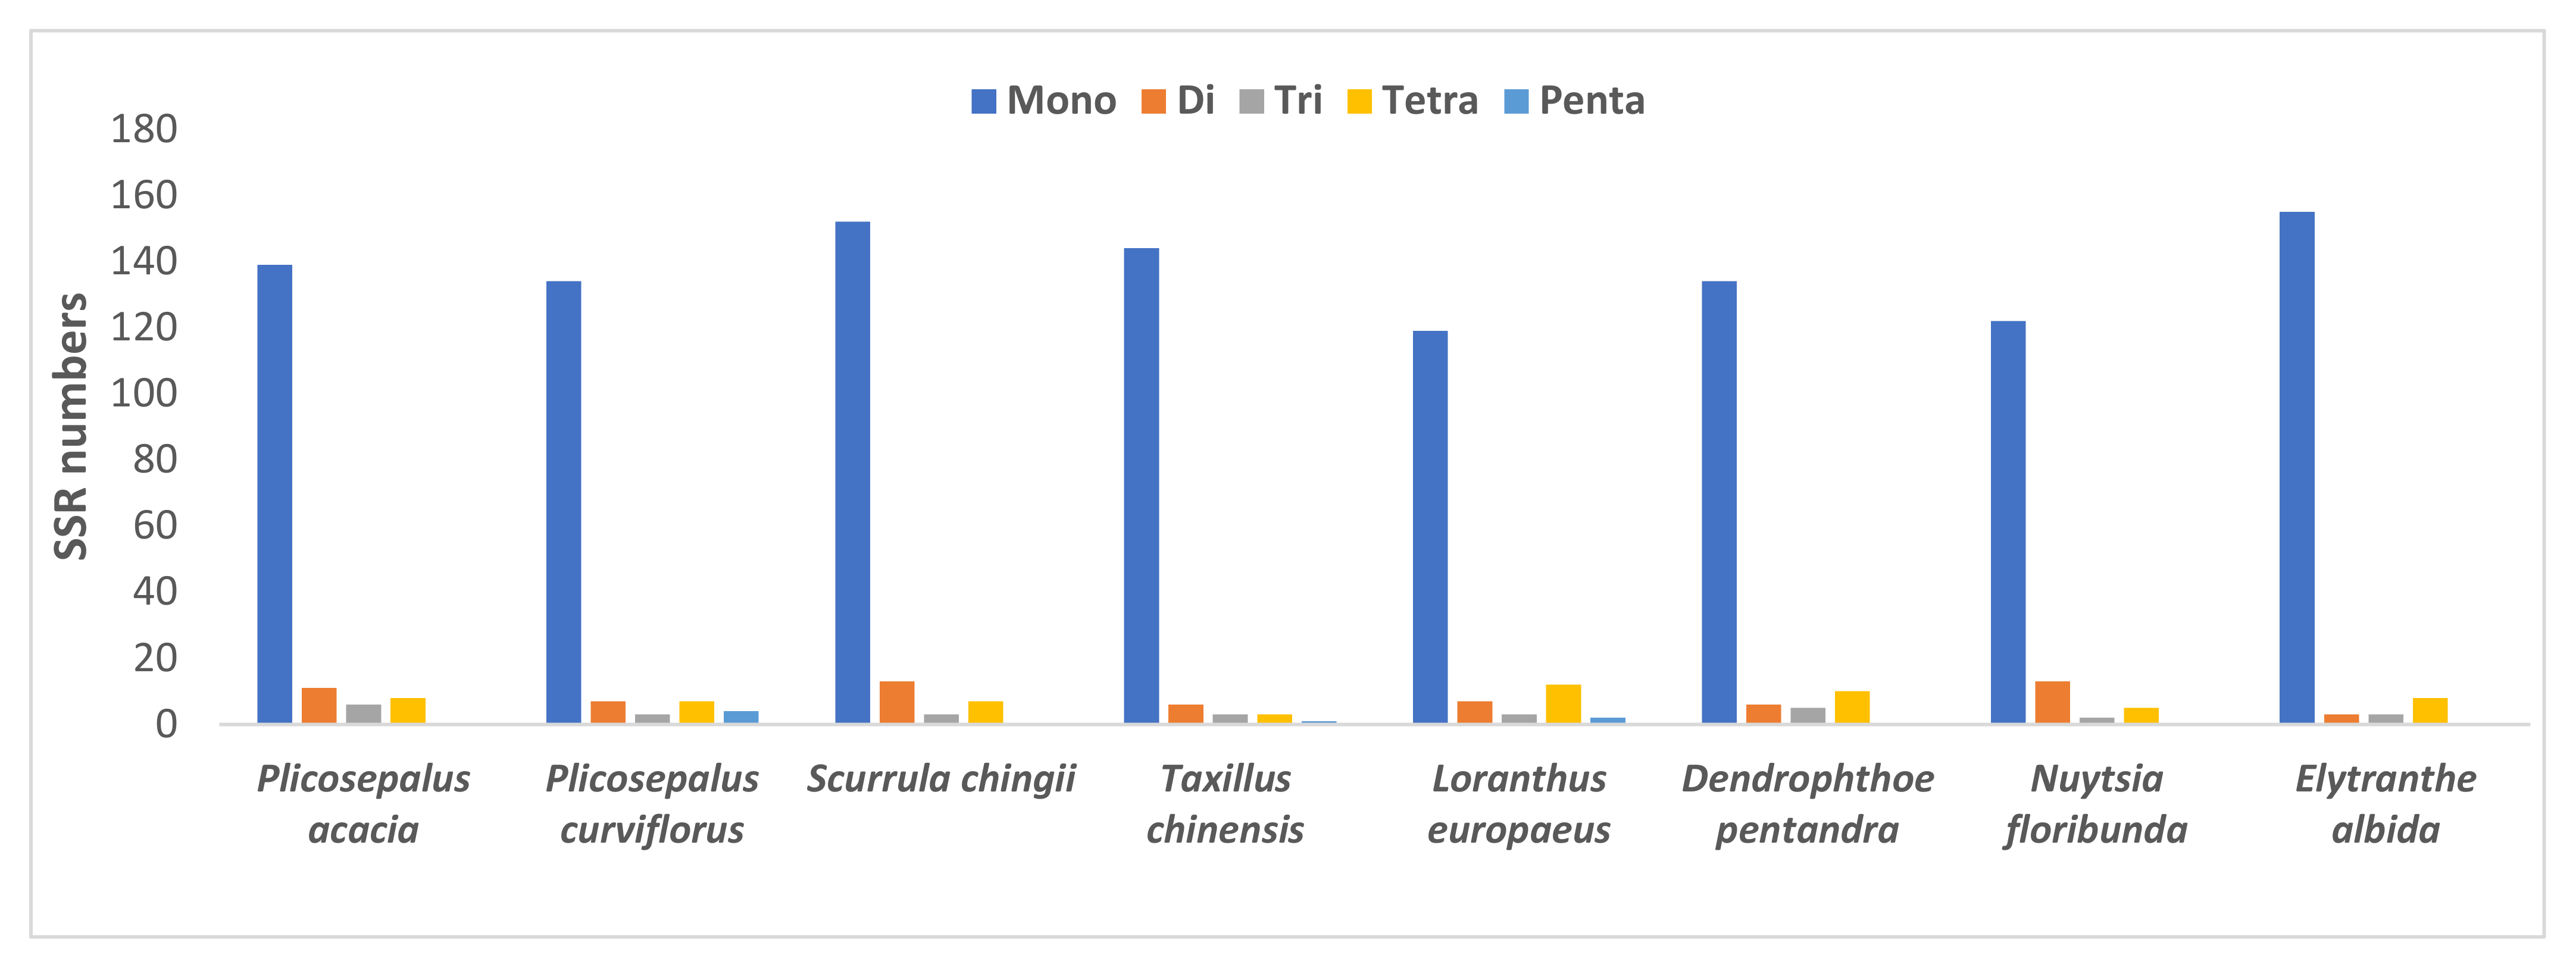
2.4.2. Simple Sequence Repeats

A total of 164 and 155 SSRs are present in the plastid genome of P. acacia and P. curviflorus, as shown in Table 4, poly T (42.07 and 52.24%) and A (40.85 and 46.27%), and poly C (1.22 and 1.49%) and G (0.61 and 0.00%) repeats. The results obtained from the analysis of microsatellite frequency in the genome of six species from the Loranthaceae family are presented in Table 4. The di-repeat AT/AT is found in the genome of all species, while the dinucleotide AG/CT is found in five species but is absent in three species: S. chingii, T. chinensis and E. albida. Furthermore, there were 3 trinucleotide repeats (AAG/CTT, AAT/ATT and ATC/ATG), 11 tetra repeats (AAAG/CTTT, AAAT/ATTT, ACAG/CTGT, AGGG/CCCT, AAGT/ACTT, AATT/AATT, AATC/ATTG, AAAC/GTTT, AACC/GGTT, AGAT/ATCT, and AATG/ATTC) and 2 penta repeats (AAAAT/ATTTT and AATAT/ATATT) (Table 3).
The frequency of SSRs among the cp genomes of the eight species was also compared (Figure 4), and the results showed that mononucleotides occurred more frequently across all genomes. N. floribunda had the highest number of dinucleotides with 13 repeats, P. acacia has the highest number of trinucleotides with 6 repeats, and L. europaeus had the highest number of tetranucleotides with 12 repeats and pentanucleotides with 4 repeats. The majority of SSRs in the cp genome of P. acacia and P. curviflorus were monorepeats (84.76 and 86.45%) (Figure 5).

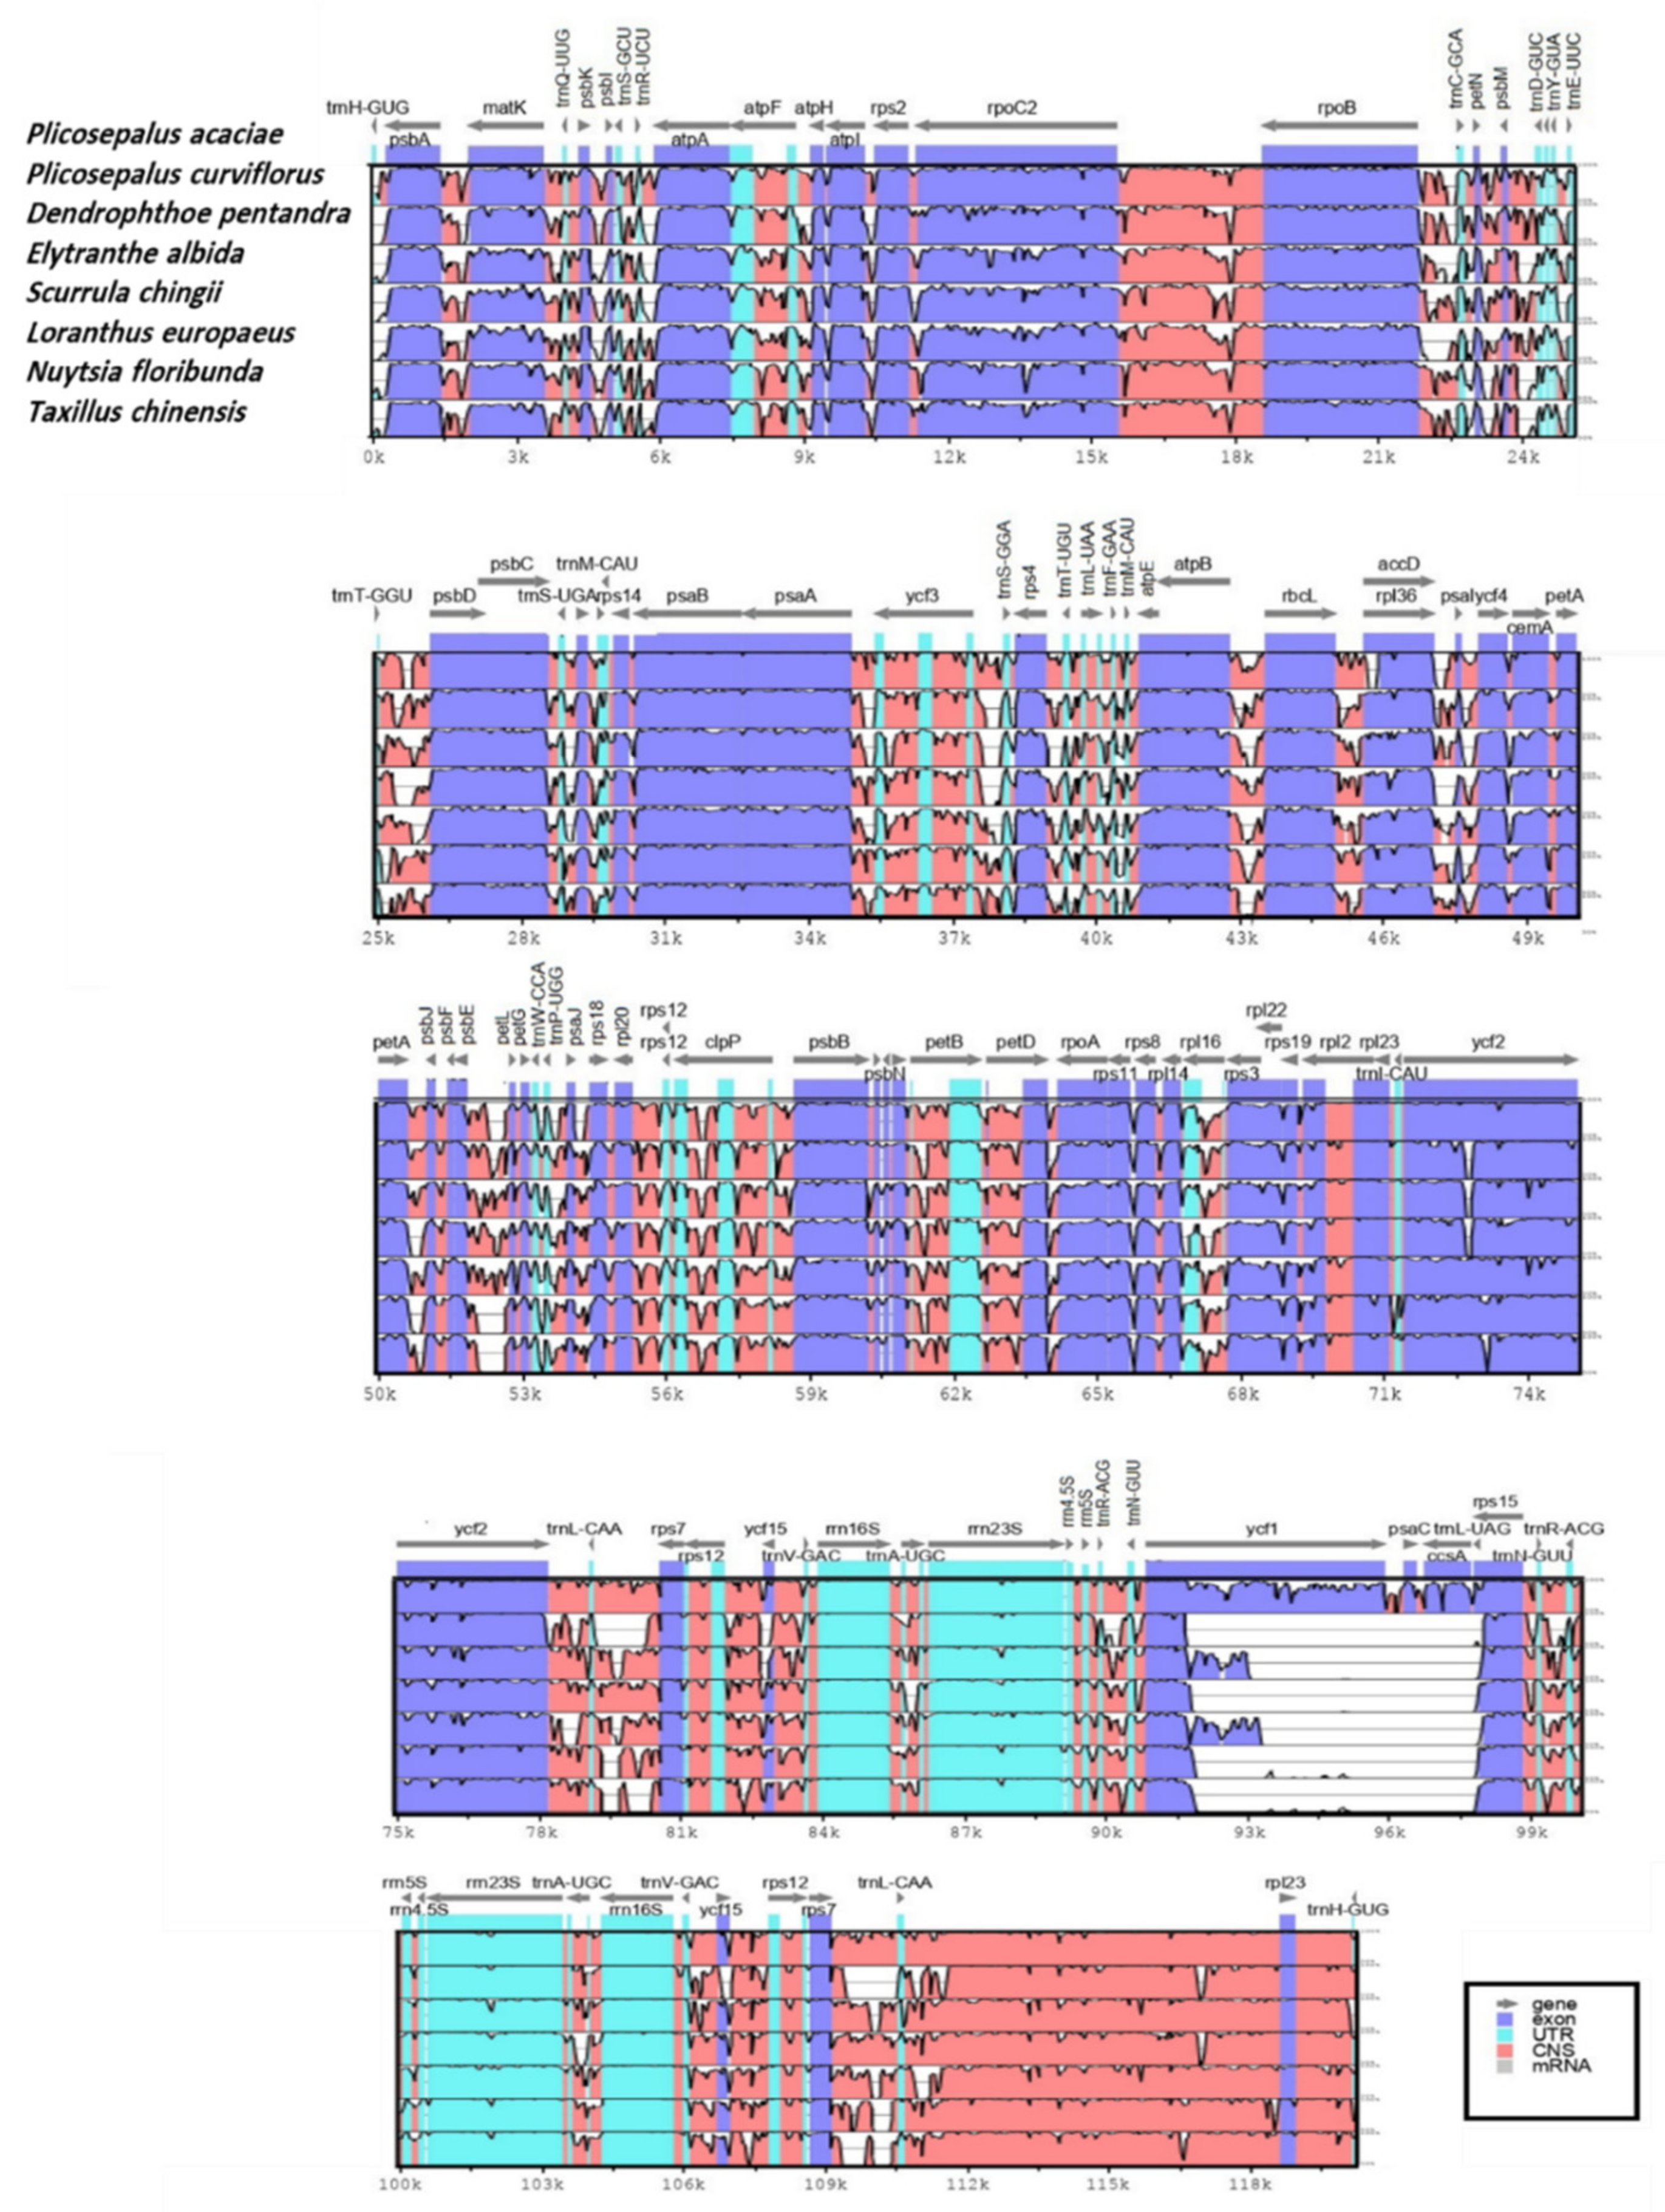
2.5. Sequence Divergence

To investigate the degree of sequence divergence, the program mVISTA was used to align the complete chloroplast genomic sequences of P. acaciae and P. curviflorus with the six Loranthaceae chloroplast genomes available in GenBank: S. chingii, T. chinensis, L. europaeus, D. pentandra, N. floribunda and E. albida. The annotation of P. acaciae was used as a reference. The protein-coding genes were more conserved than the noncoding regions (Figure 6). The noncoding regions presented high divergence in the following genes: trnH-GUG-matK, matK-trnQ-UUG, atpA-atpH, rpoC2-rpoB, rpoB-trnC-GCA, trnT-GGU-psbD, psbC-trnS-UGA, pspA-ycf3, ycf3-trnS-UGU, atpB-rbcL, rbcL-rpl36, rpl36-pspI, pspI-ycf4, ycf2-trnL-CAA, trnL-CAA-rps7, ycf15-trnV-GAC, rps12-ycf15, ycf15-trnV-GAC, trnV-GAC-rrn23S, trnR-ACG-trnN-GUU, trnN-GUU-trnR-AGG, petA-psbJ, pspE-petL, rpl20-rps12, rps12-clpP, clpP-psbB, psbN-petB, petB-petD, rpl14-rps3, trnA-UGC-rrn16S, trnV-GAC-ycf15, ycf15-rps12, rps12-rps7, rps7-trnL-CAA, trnL-CAA-rpl23 and rpl23-trnH-GUG. However, the protein-coding genes showed divergence in fewer regions: matK, rpoC2, accD-rpl36, ycf2 and ycf1.

2.6. Boundary between LSC/SSC and IRs

The difference in the lengths of the LSC, SSC, and IR regions between the species was compared (Figure 7), and a significant reduction in the size of the SSC region was observed, with the shortest SSC (5250 bp) in E. albida and the longest SSC in P. curviflorus (6187 bp). E. albida had the largest LSC region at 72,966 bp, while D. pentandra had the shortest LSC at 69,368 bp. Great variation in the length of the IR regions was observed among the species, with the root hemiparasite N. floribunda presenting the largest IR region at 26,801 bp and D. pentandra presenting the shortest IR region at 20,118 bp.
The four genes rp12, trnL, ycf1, and trnH, which were located at the junction of inverted repeats and single copy regions, showed variations in the location and number of base pairs, with the IRa-SSC and IRb border presenting the greatest variations. The two genes ycf1 and trnL were found in the IR/SSC border. The ycf1 gene crossed the SSC/IRa border in D. pentandra (873 bp), E. albida (2310 bp), L. europaeus (963 bp), N. floribunda (2982 bp) and S. chingii (945 bp). The SSC/IRa border was distinct in P. acaciae and P. parviflorus along the rps15 gene. The ycf1 gene was in the IRb region of D. pentandra (872 bp), E. albida (2309 bp) and S. chingii (945 bp), while the extended ycf1 gene was observed in the SSC region of P. acaciae and P. curviflorus (4070 bp and 4112 bp, respectively).
The trnL gene was located in the SSC region in D. pentandra, E. albida and S. chingii, and it was located across the SSC/IRb in T. chinensis (15 bp) and L. europaeus (45 bp). The root parasite N. floribunda differed from the other species, with the rpI32 gene located across the SSC/IRb (26 bp). The rp12 gene extended across the LSC/IRb in all species: P. acaciae (218 bp), P. curviflorus (228 bp), D. pentandra (231 bp), E. albida (300 bp), L. europaeus (215 bp), N. floribunda (225 bp), S. chingii (249 bp) and T. chinensis (219 bp). There was a duplication in the rp12 gene that was present as well on the LSC/IRa border in N. floribunda.
Variations were observed in the location of the trnH gene in the IRa/LSC border as well, and it was in the LSC region in S. chingii and E. albida, across the IRa/LSC border in D. pentandra, and extended across the IRa region away from the IRa/LSC border (1 bp) in P. acaciae, P. curviflorus, N. floribunda and L. europaeus.

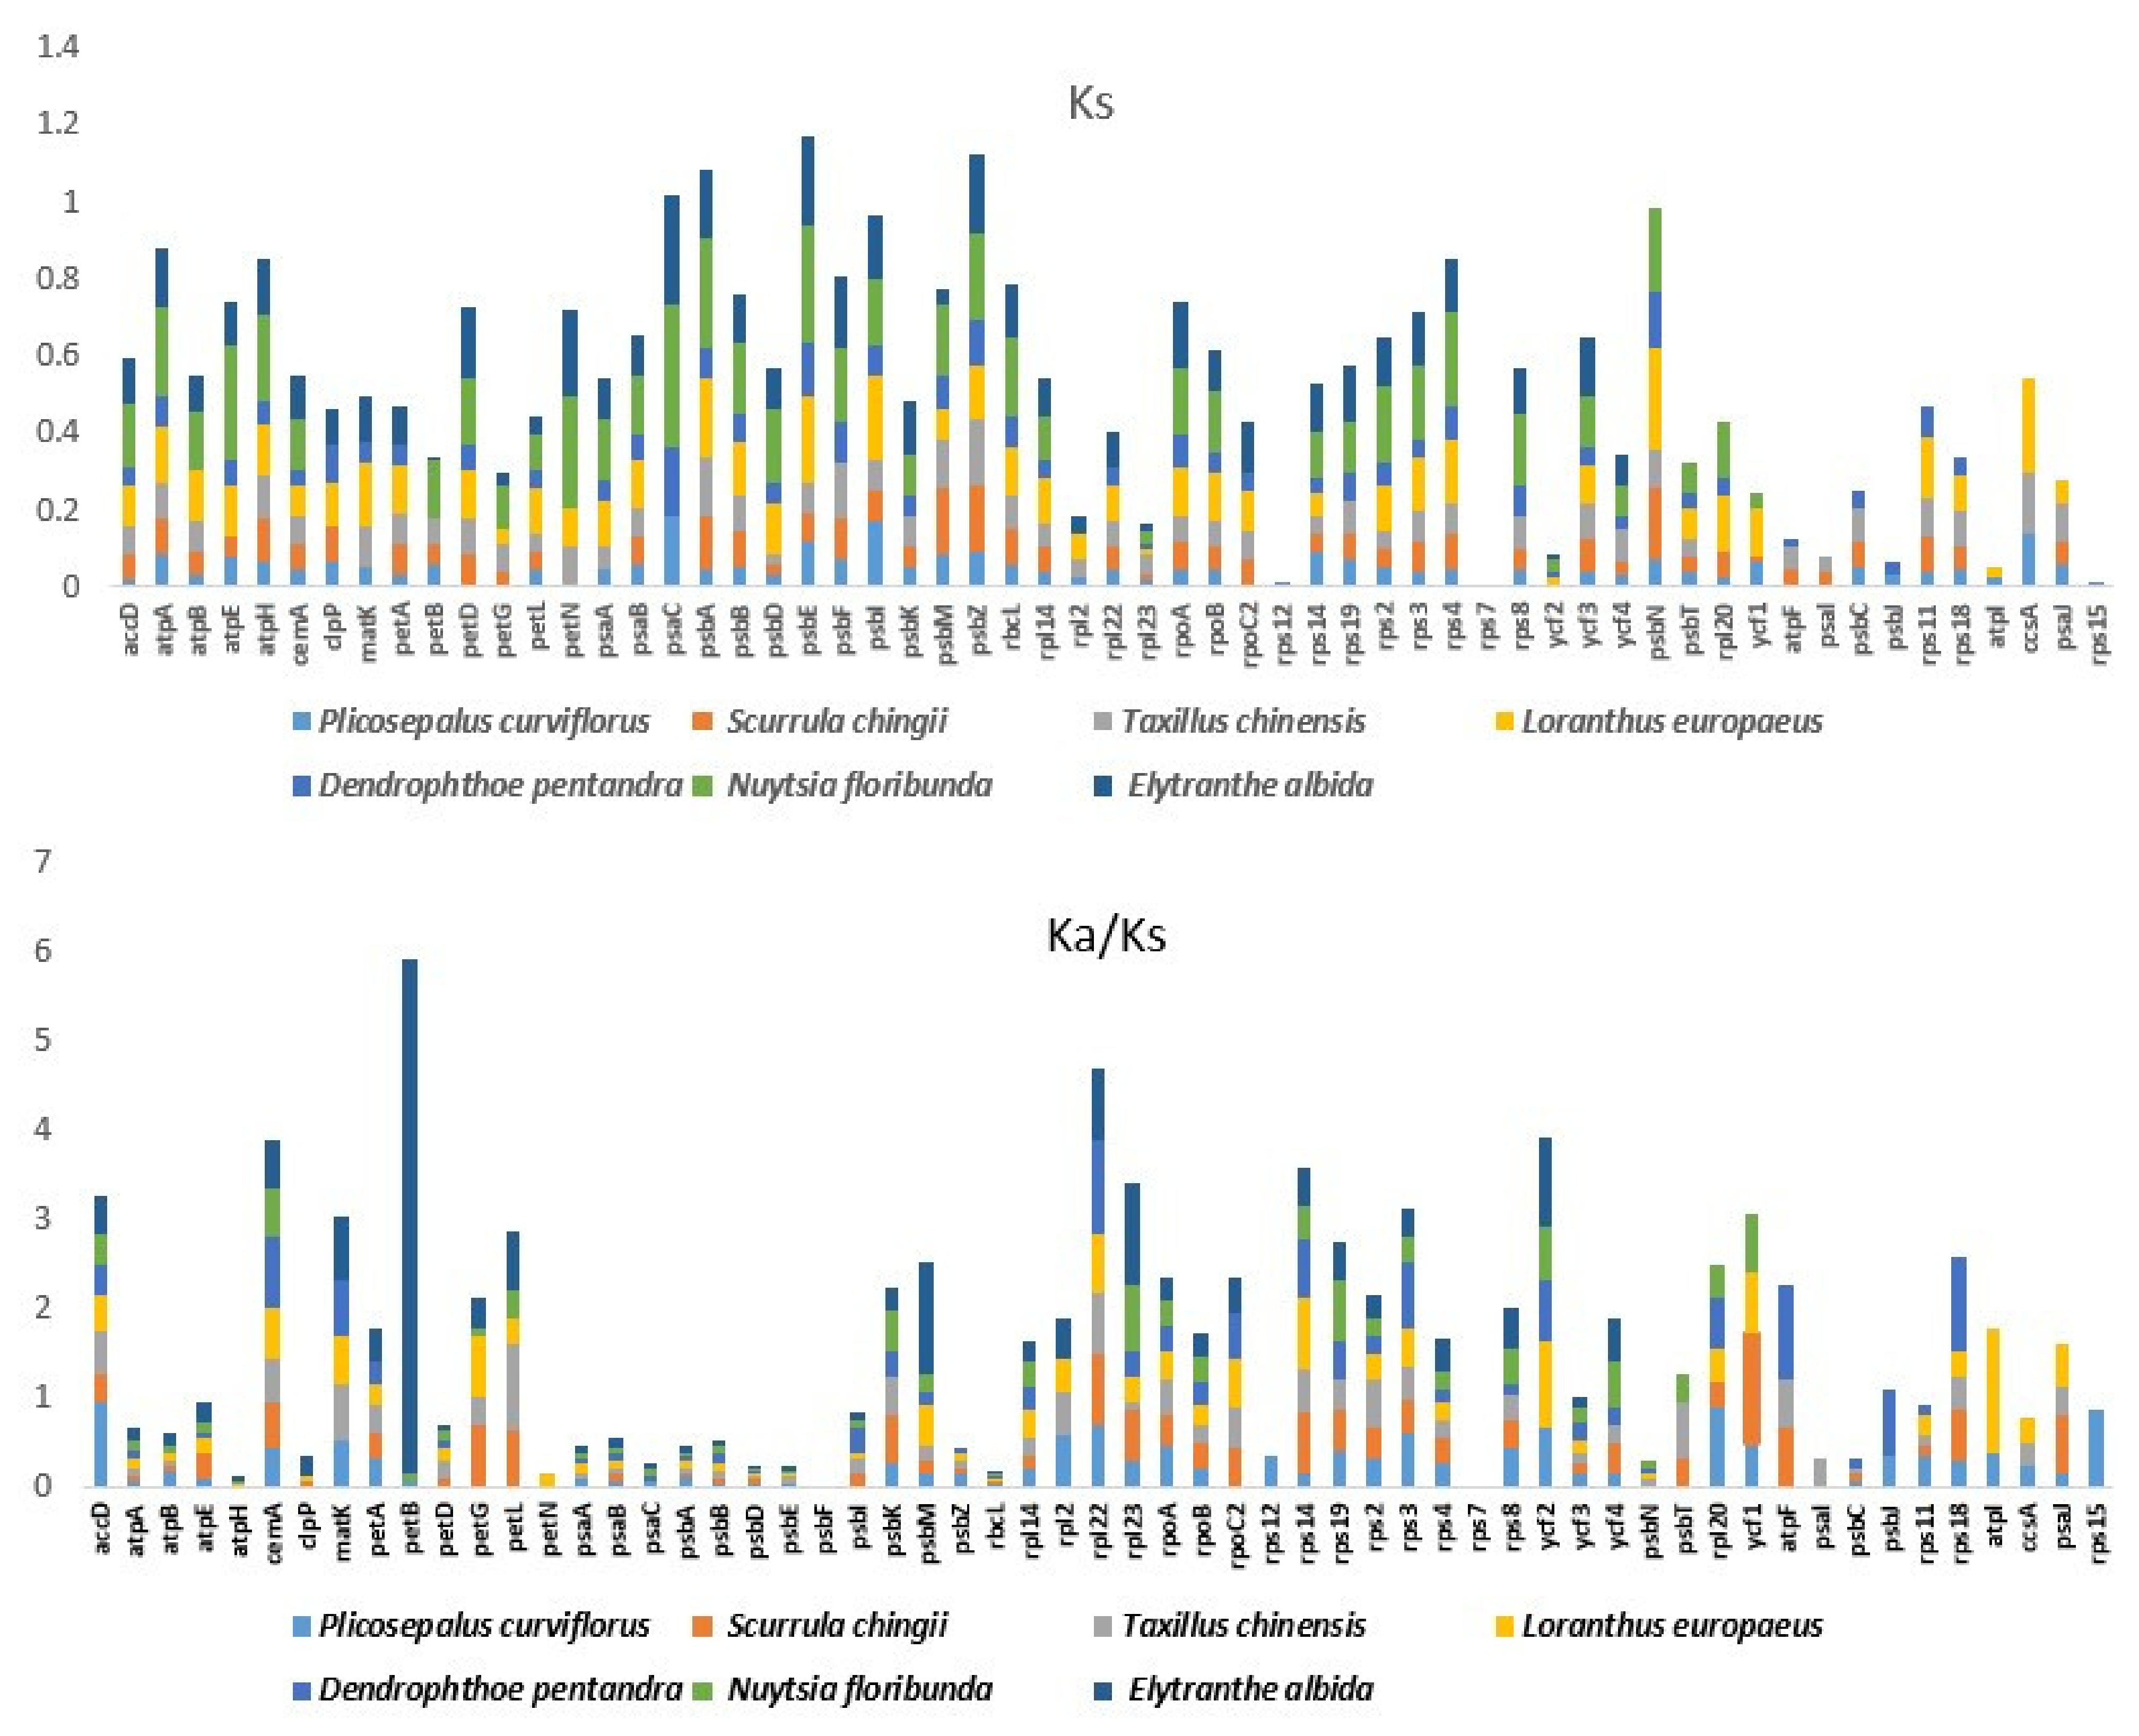
2.7. Divergence of Protein-Coding Gene Sequences
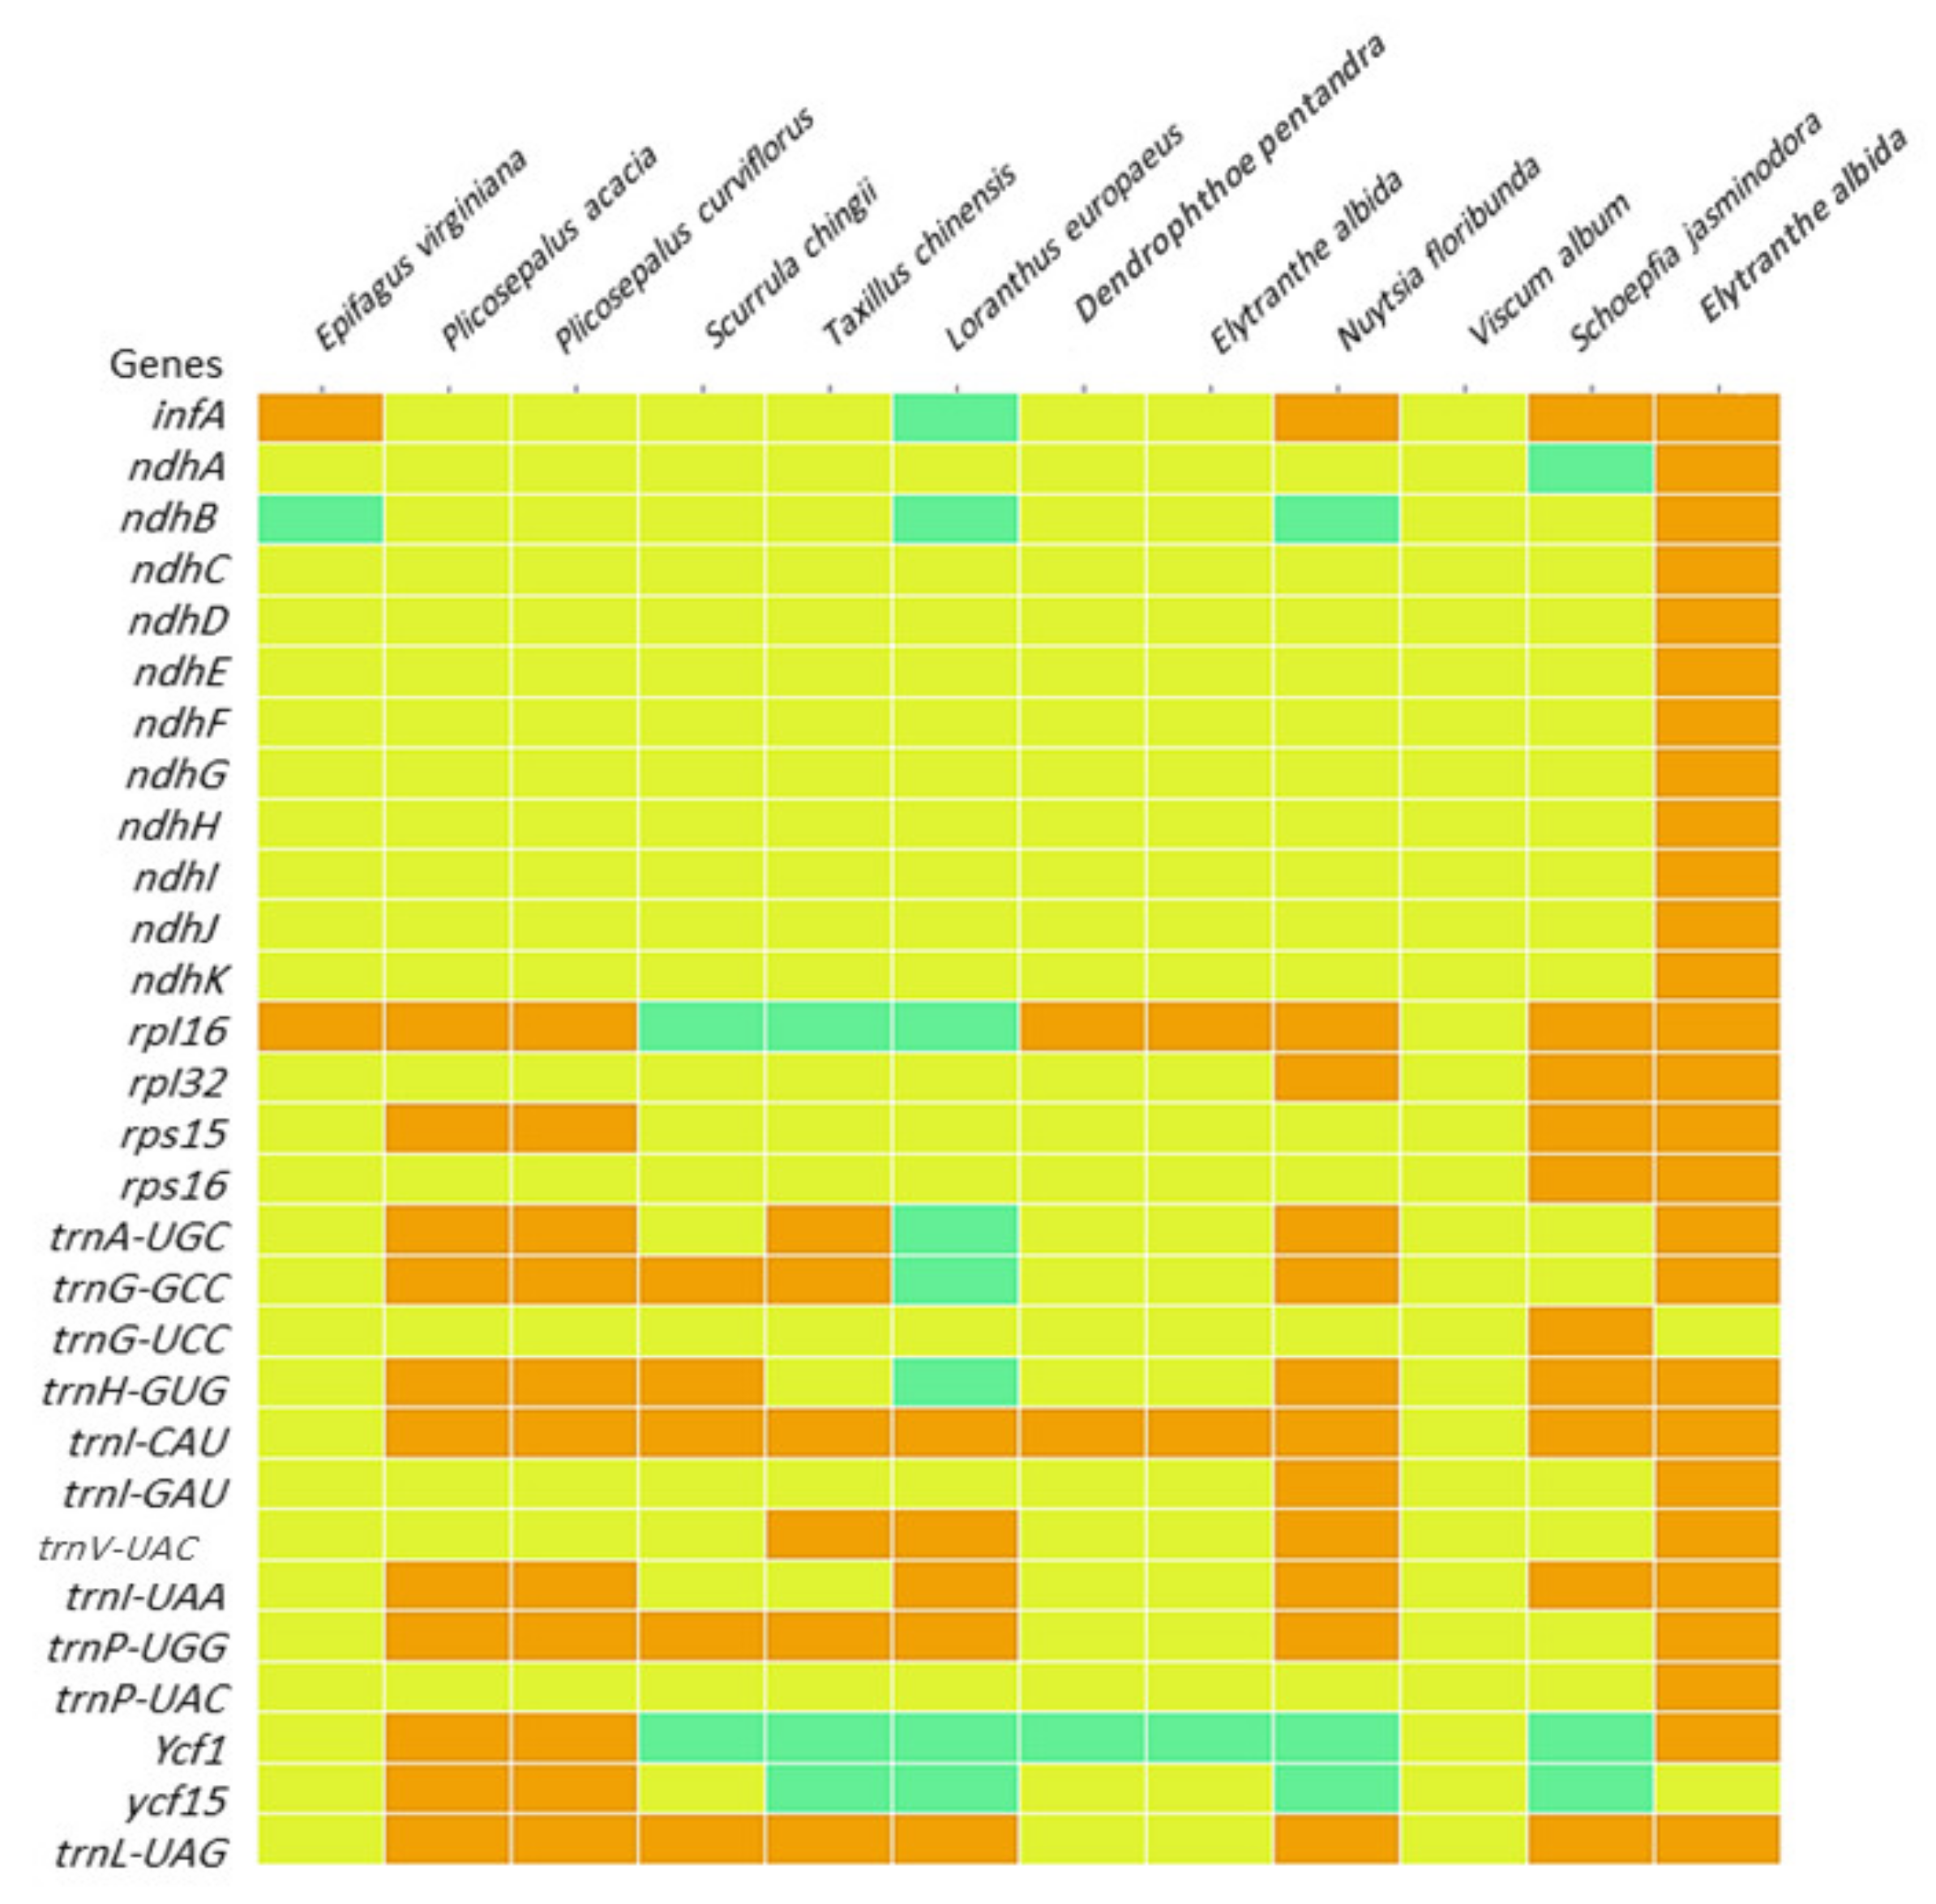
The value of synonymous (Ks) and nonsynonymous (Ka) substitutions and the Ka/Ks ratio were calculated among the 59 protein-coding genes that represent the common genes in the chloroplast genomes of P. acaciae, P. curviflorus and six Loranthaceae species S. chingii, T. chinensis, L. europaeus, D. pentandra, N. floribunda and E. albida. The Ka/Ks value usually used for evaluating sequences variations in different species or taxonomical species with unknown evolutionary status, and to detect substitution, selection and beneficial mutation genes under selective pressure [23]. As shown in Figure 8, for Plicosepalus acacia vs. Plicosepalus curviflorus, Scurrula chingii, Taxillus chinensis, Loranthus europaeus, Dendrophthoe pentandra, Nuytsia floribunda and Elytranthe, the Ka/Ks ratio was >1 in five genes—petB, psbM, ycf1, rpl23 and atpI; while for Plicosepalus curviflorus vs. Plicosepalus acacia, Scurrula chingii, Taxillus chinensis, Loranthus europaeus, Dendrophthoe pentandra, Nuytsia floribunda and Elytranthe in Figure S1,the Ka/Ks ratio was >1 in three genes—petB, ycf1 and accD. However, all the Ks values were <1 in all of the genes (Figure 8 and Figure S1).

2.8. Heatmap

The heatmap was created to investigate the evolution of the plastome associated with parasitism in the aerial hemiparasites investigated in this study, i.e., P. acacia and P. curviflorus, and they were compared to representatives of the Loranthaceae family: aerial hemiparasitic S. chingii, T. chinensis, L. europaeus, D. pentandra and E. albida. N. floribunda represents a root hemiparasite in Loranthaceae. In addition to the species Viscum album as an aerial hemiparasitic (Viscaceae), Schoepfia jasminodora is a root hemiparasite (Santalaceae). Erythropalum scandens (Santalales; Erythropalaceae) is an example of an autotrophic plant. In contrast, Epifagus virginiana was used in the heatmap as a representative of an obligate parasite or holoparasite (Orobanchaceae), (GenBank accession numbers, names are available in Table 5).
As shown in Figure 9, common losses were observed in some protein-coding and tRNA genes as follows: the gene group ndh (A, B, C, D, F, H, I, J and K) was absent from most species or present as pseudogenes in some cases, such as the ndhB gene pseudogene in E. virginiana, L. europaeus, and N. floribunda and ndhA gene in S. jasminodora. The infA gene was absent in most species and pseudogenes in L. europaeus, whereas it was present in E. virginiana, N. floribunda and S. jasminodora.
The rpl16 gene was present in E. virginiana, P. acacia, P. curviflorus, D. pentandra, E. albida and N. floribunda and Schoepfia jasminodora, and the pseudogene in S. chingii, T. chinensis, and L. europaeus was absent from only V. album. The rpl32 gene was missing from all comparison species except N. floribunda and S. jasminodora. The rps16 gene was missing from all comparison species except S. jasminodora. The rps15 gene was present in only P. acacia, P. curviflorus and S. jasminodora.
Regarding the tRNA genes, TrnV-UAC was lost in all comparison species. The trnG-UCC gene was absent in all comparison species except S. jasminodora. The trnI-GAU gene was absent in all comparison species except N. floribunda. The trnK-UUU gene was absent in all comparison species except T. chinensis, L. europaeus and N. floribunda. The trnA-UGC gene was present in P. acaciae, P. curviflorus, T. chinensis and N. floribunda and absent in E. virginiana, S. chingii, D. pentandra, E. albida, V. album and S. jasminodora, while the pseudogene was present in L. europaeus. The trnH-GUG gene was present in P. acaciae, P. curviflorus, S. chingii, S. jasminodora and N. floribunda. In contrast, it was absent in E. virginiana, T. chinensis, D. pentandra, E. albida and V. album, while the pseudogene was present in L. europaeus. The gene trnL-UAG was present in P. acaciae, Plicosepalus curviflorus, S. chingii, T. chinensis, L. europaeus, N. floribunda and S. jasminodora. However, it was absent in E. virginiana, D. pentandra, E. albida and V. album.
The trnG-GCC gene was present in P. acacia, P. curviflorus, S. chingii, T. chinensis and N. floribunda, while the pseudogene was presents in L. europaeus but absent in E. virginiana, D. pentandra, E. albida, V. album and S. jasminodora. The trnI-CAU gene was absent only in V. album and E. virginiana. The trnI-UAA gene was present in P. acacia, P. curviflorus, L. europaeus, N. floribunda and S. jasminodora but absent in D. pentandra, E. albida, V. album, S. chingii, T. chinensis and E. virginiana. The trnP-UGG gene was present in P. acacia, P. curviflorus, S. chingii, T. chinensis, N. floribunda and L. europaeus, while it was absent in E. virginiana, D. pentandra, E. albida, V. album and S. jasminodora.

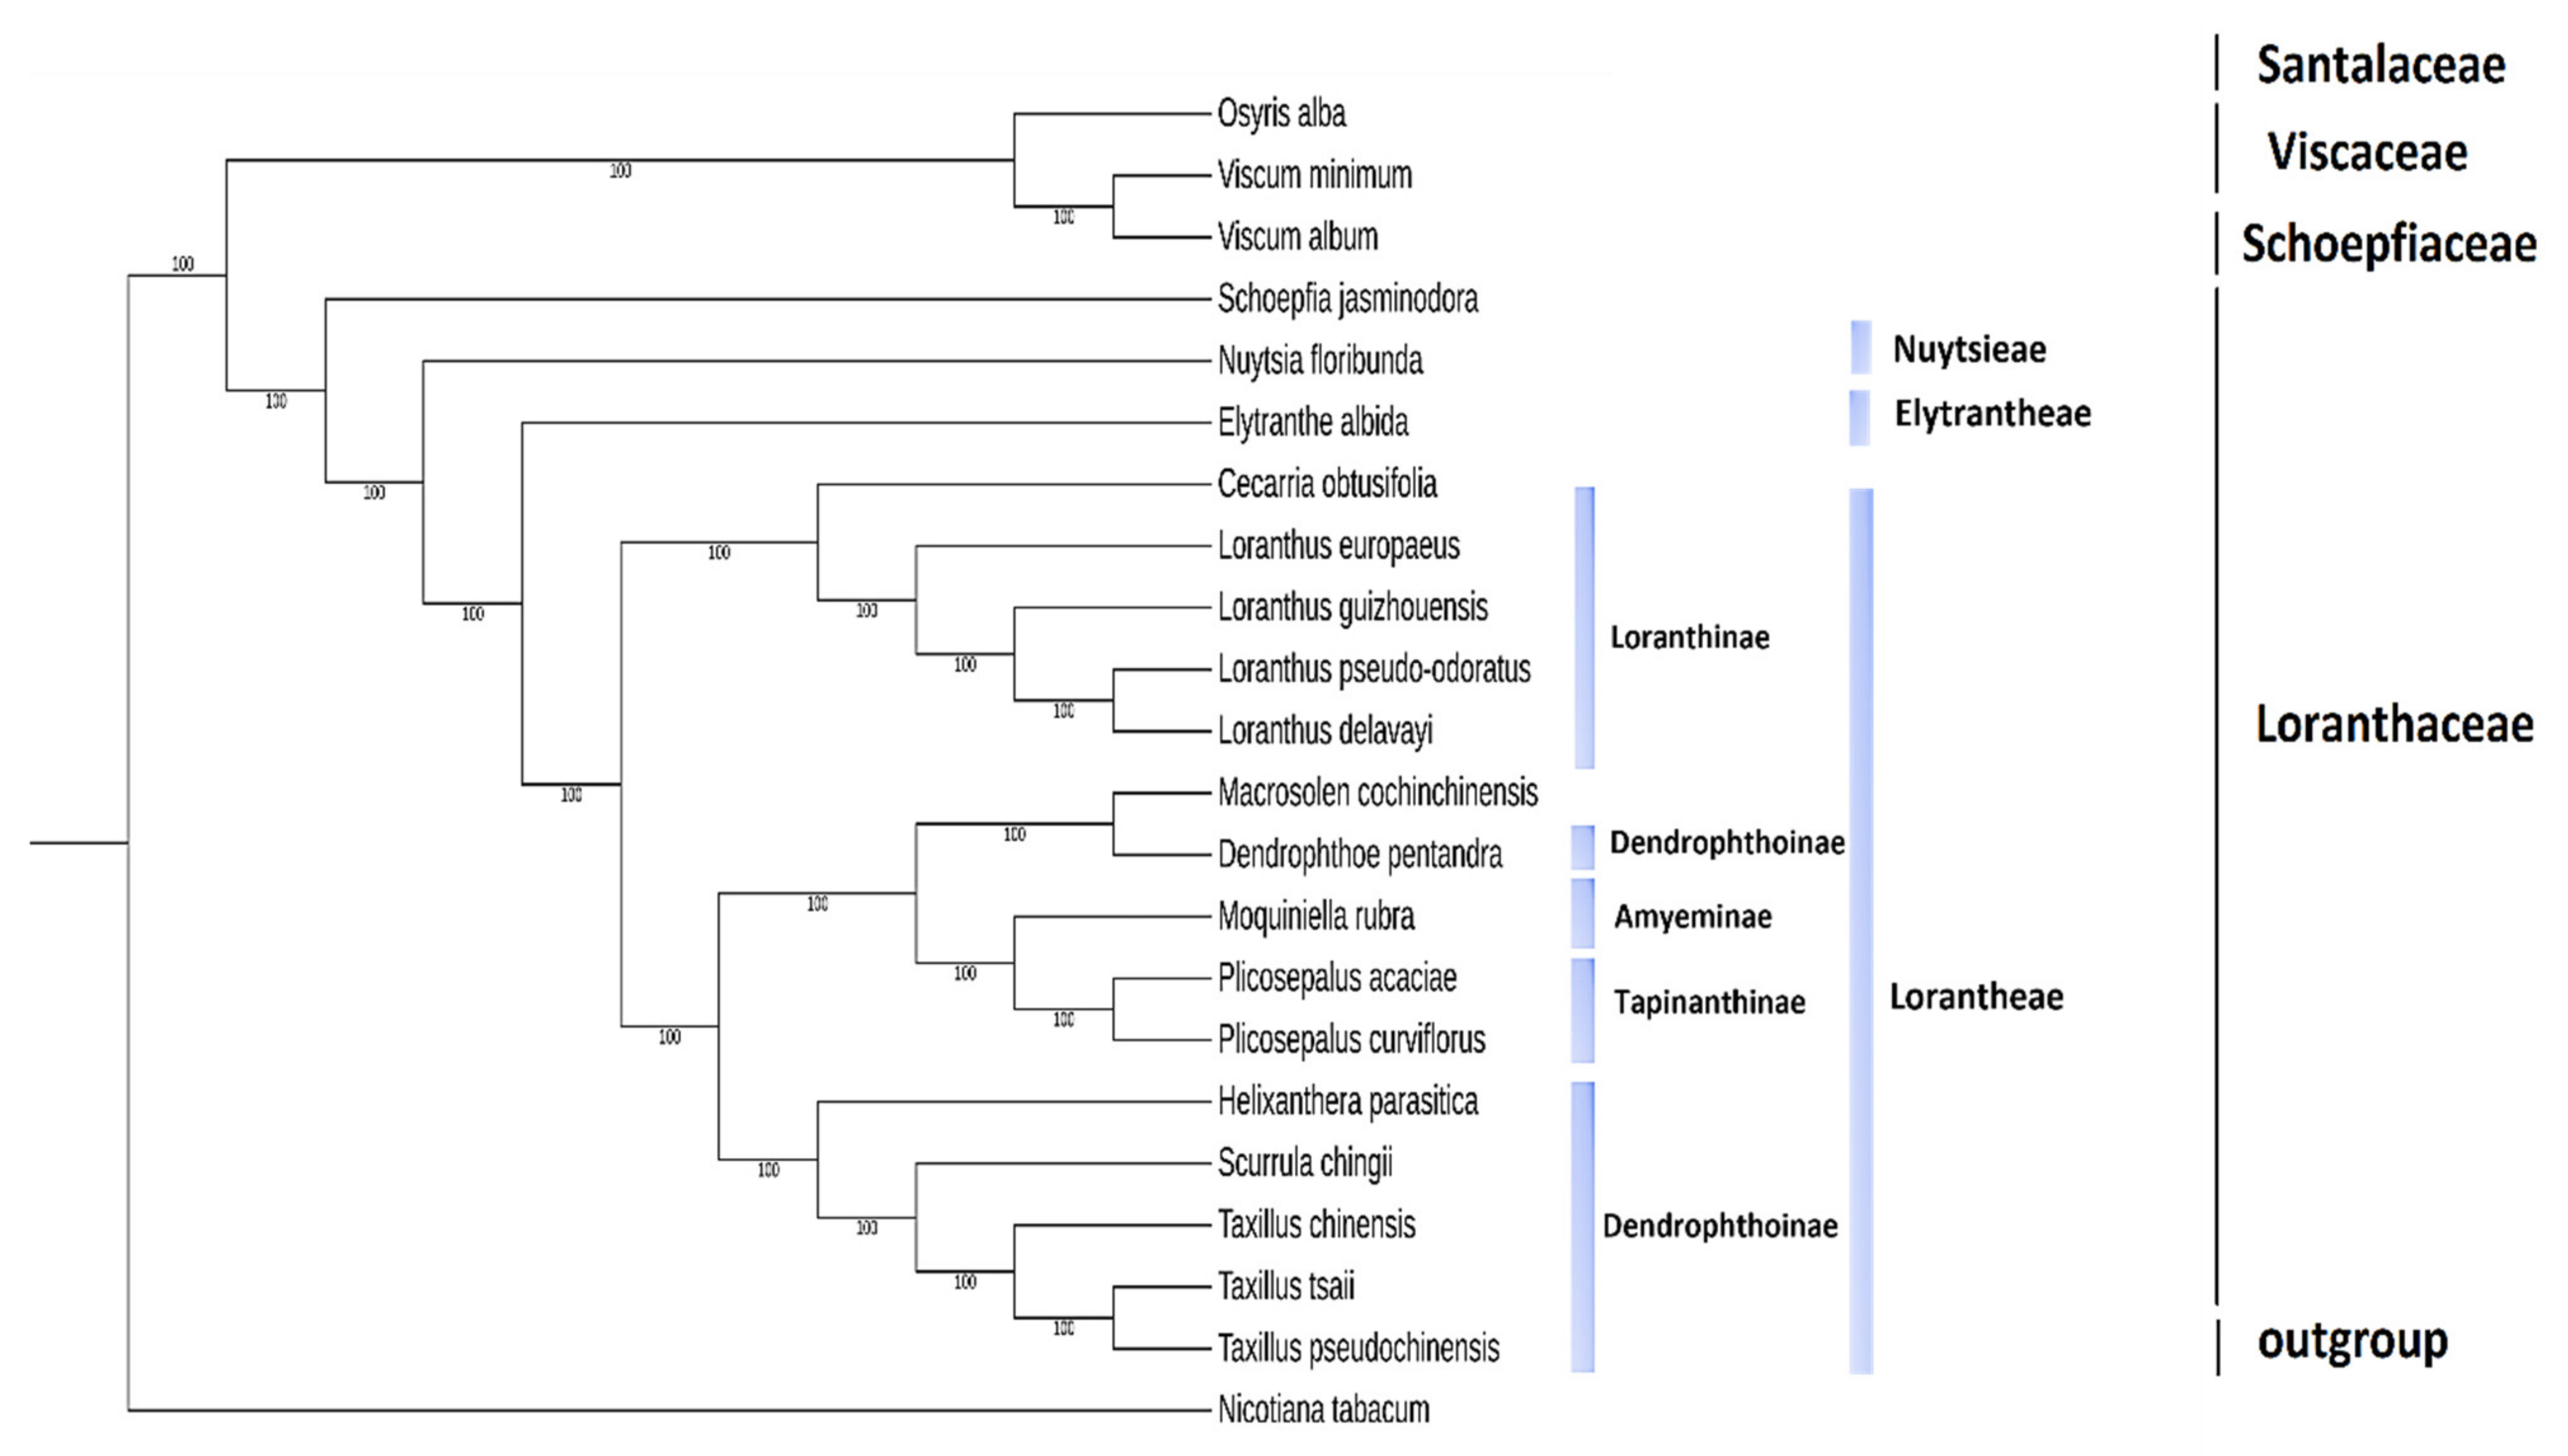
2.9. Phylogenetic Analysis

In the current study, the phylogenetic relationships were assessed among plastomes of P. acaciae and P. curviflorus, and examples of cp genomes of the Santalales order from GenBank included 15 species belonging to the Loranthaceae family, and they represented different tribes (GenBank accession numbers, names are available in Table 5). The cp genomes from three families (Viscaceae, Santalaceae, and Schoepfiaceae) were also included. The Nicotiana tabacum chloroplast genome represents an outgroup.
The phylogenetic trees with all nodes having 100% bootstrap support BS (Figure 10). The monophyly of the Loranthaceae family was strongly supported (BS = 100) by the results.
Loranthaceae was divided into three main highly supported clades (BS = 100) in the maximum likelihood (ML) tree: one clade contained species from the Lorantheae tribe, and the other clades consisted of N. floribunda representing tribe Nuytsieae and E. albida representing tribe Elytrantheae.
Lorantheae was further divided into two separate clades, and each clade was divided into two subclades representing four different subtribes that were highly supported. The first clade was divided into two subclades, with BS = 100. The first subclade included the subtribe Scurrulinae (BS = 100), which consisted of three species of the genera Taxillus (Taxillus chinensis, Taxillus pseudochinensis, and Taxillus tsaii) and S. chingii a sister, and the second subclade included Helixanthera parasitica, representing the subtribe Dendrophthoinae (BS = 100). The second subclade was divided into two branches (BS = 100) consisting of P. acacia and P. curviflorus (subtribe Tapinanthinae) and linked to Moquiniella rubra (subtribe Emelianthinae) as a sister. The second branch in subclade two included D. pentandra (subtribe Dendrophthoinae); interestingly, Macrosolen cochinchinensis, which belongs to Elytrantheae, was nested with this branch. The second clade of the tribe Lorantheae was divided into two subclades (BS = 100) consisting of four species of the genus Loranthus (Loranthus europaeus, Loranthus pseudo-odouratus, Loranthus guizhouensis, and Loranthus delavayi) and Cecarria obtusifolia as a sister. All species that belonged to this clade represented subtribe (Loranthinae)

3. Discussion

This study presents the first chloroplast genome of the species P. acaciae and P. curviflorus of the Loranthaceae family. The size, structure, gene content, and organization are usually conserved in the chloroplast genome of angiosperms [15].
Typically, chloroplast genome sizes range between 120 and 170 kilobase pairs (kb) [23]. The length of the cp genome is 120,181 bp and 121,086 bp in P. acaciae and P. curviflorus, respectively. The decrease in the size of the genome is a common feature in parasitic plants as a result of the shift from autotrophic to parasitic life, which is accompanied by several changes, such as pseudogenization, gene loss, structural rearrangement and size reduction [24,25]. Hemiparasites and holoparasite species of the Loranthaceae family have a genome size ranging from 116–139 kb (mean = 122.3 kbp), and a reduction in the plastid of some holoparasites may be more than that, such as in root parasites species of Cynomoriaceae the total Plastid genome length is 45,519 bp [26].
The organization, size, and structure of the chloroplast genome in Plicosepalus spp. are analogous to those of other angiosperms, with a typical four-region structure in the chloroplast genome. The size of the LSC regions is 69,497 bp and 69,947 bp, that of the SSC is 6038 bp and 6187 bp, and that of the two IR regions is 22,323 bp and 22,476. The LSC region in angiosperms ranges from 80–90 kb, the SSC regions are approximately 16–27 kb, and the two IRs range from 20–28 kb [27]. Hence, the reduction in the LSC and SSC regions was greater than that in the IR region in the P. acaciae and P. curviflorus plastomes.
P. acaciae and P. curviflorus had 106 and 108 genes, including 63 protein-coding genes and 25 tRNA and 4 rRNA genes for each species. A typical angiosperm chloroplast genome consists of 113 genes, including 79 protein-coding genes, 30 tRNA genes and four rRNA genes [21]. The cp genome in autotrophic E. scandens (Santalales) consists of almost the same gene number as that observed in angiosperms at 112 genes, including 79 protein-coding genes, 29 tRNA genes and 4 rRNA genes [26]. Other Santalales hemiparasites genomes have gene totals ranging from 80 to 101 [1,2,26,27,28]. Compared to other parasites in Santalales, fewer genes were lost in the P. acaciae and P. curviflora plastid genomes. The level of degradation in the chloroplast genome of parasitic plants varies with the level of photosynthesis [1]. Gene losses in the chloroplast genome of hemiparasitic Santalales are not as large as those in holoparasitic plastid genomes, which lose most or all of their genes [1]. P. acaciae and P. curviflora curviflorus have well-configured green leaves.
We also found that the AT content was higher than the GC content in the P. acaciae and P. curviflorus cp genomes, which is also observed in the chloroplast genome of holoparasitic species of the Balanophoraceae family [28,29]; nonetheless, some Angiosperms also have high AT contents [30].
The two genes clpP and ycf3 had two introns in each of the P. acaciae and P. curviflorus plastomes, while the remaining genes presented only one intron, which is consistent with previous reports in the chloroplast genome Macrosolen (Santalales) [31] and other cp genomes of angiosperms [32,33].
Codons encoding the amino acid leucine were the most frequent while those encoding cysteine and tryptophan were the least frequent in P. acaciae and P. curviflorus, respectively. Similar results were reported in the chloroplast genomes of the order Santalales [31], as well in some species of angiosperms [32,33]. The results obtained from the present study show that in the plastid genome of P. acaciae and P. curviflorus, the amino acid exchange of serine-to-leucine represents the greatest codon transformation. The authors of [31] indicated that the amino acid conversion from serine (S) to leucine (L) occurred most frequently in three parasitic species of the Macrosolen genus (Santalales). This agreement between results could be attributed to the high preservation of RNA editing [34,35].
A total of 164 and 155 SSRs are present in the plastid genome of P. acacia and P. curviflorus, and most of the microsatellites in repeats are present in the noncoding IGS region. Several reports [36,37,38,39,40] have shown the importance of chloroplast SSRs (cpSSRs) as reliable molecular markers to discriminate between specimens at lower taxonomic levels and for studying the population structure. A previous study using RAPD markers revealed the difference in genetic makeup depending on the host on which the mistletoe grows. The difference in genetic makeup might influence the chemical composition and, in turn, might affect the therapeutic properties of the mistletoe [41]. Thus, we recommend developing the SSRs (cpSSRs) from the cp genome of Plicosepalus spp. or available hemiparasitic plastomes to investigate changes in the genetic structure of the parasitic species when the grow on different hosts and to account for variations within the population of mistletoe.
A heatmap of genes present in the plastomes of P. acaciae and P. curviflorus and the comparison species showed that all ndh genes (A, B, C, D, E, F, G, H, I, D and K) were lost or pseudogenes. The gene ndh represents a complex group consisting of approximately 30 subunits, with 11 out of 30 used for encoding subunits of the NADH dehydrogenase complex in plant plastids and involved in photosynthesis [42]. The partial or complete loss (physically or functionally) of genes associated with photosynthesis (ndh) is a common phenomenon in hemiparasitic and holoparasites of Santalales and Orobanchaceae [1,2,20,43,44,45].
In the present study, the infA gene was lost in P. acaciae and P. curviflorus and in most of the compared parasitic species, or it was present as a pseudogene. The infA gene is thought to function as a translation initiation factor that assists in the assembly of the translation initiation complex [21]. The infA gene is also a common gene lost in parasitic species of Santalales; however, the infA gene was also lost in the cp genome in some autotrophic species of angiosperms [46]. The infA gene is believed to be the most mobile chloroplast gene and is transferred to the nucleus in angiosperms [44], and it is believed that a similar scenario could also occur in parasitic plants. Several hypotheses have been proposed to explain the reasons for cp gene transfer to the nucleus by [45,46,47,48,49] and was summarised by [49] as three factors: (1) the relatively high frequency of organellar DNA escape to the nucleus provides numerous opportunities for successful functional gene transfers and is essentially a one-way process; (2) the progressive accumulation of detrimental mutations in asexual organelle genomes by Muller’s ratchet favours transfer; and (3) smaller, streamlined organelle genomes are favoured selectively. Although all of these hypotheses could be applicable to eukaryote organelles, the first hypothesis is likely more significant in flowering plants [44]. In the history of chloroplast evolution, the infA gene has rapidly moved from the chloroplast genome to the nuclear genome. No other chloroplast genes have been reported to undergo multiple evolutionary transfers to the nucleus. Several hypotheses have been proposed to explain why genes are transferred more than once from organelles to plastids, but many have not been applied to infA gene [44]. Alternatively, it could be that the small size of infA plays a role in repeated transfer of a gene to the nucleus, because it affects both the possibility of transferring genes to the nucleus and the prospect of the transferred gene being damaged by mutation [44].
Additionally, two rRNA (rpI32, rps16) genes and four tRNA genes (trnG-UCC, trnI-GAU, trnK-UUU, trnV-UAC) were lost in the two cp genomes of P. acaciae and P. curviflorus, and these genes are missing from most of the parasitic plastomes included for comparison. Previous studies indicated that these genes were lost in some species of the family Loranthaceae [4]. However, this loss was not limited to parasitic plants only because similar cases of gene loss were reported in angiosperms [1].
In contrast, previous studies [4,20] indicated the loss or pseudogenesis of some protocode genes, including rp16, rps15, ycf1, ycf15 and tRNA (trnA-UGC, trnG-GCC, trnH-GUG, trnI-CAU, trnI-UAA, trnP-UGG and trnL-UAG). However, we noticed the presence of these genes in the P. acaciae and P. curviflorus cp genomes. Our results are consistent with that of [4], who found some of these missing genes after a cp genome reannotation (ycf1, trnH-GUG, trnL-UAG and trnL-UAA).
Overall, comparisons between the plastomes of Plicosepalus spp. and hemiparasite species showed different degrees of gene loss. A similar pattern of gene loss from the plastome was reported in parasitic species of the family Orobanchaceae as well [20]. Hemiparasites still present varying degrees of photosynthetic ability and use their host to meet some of their nutrient needs, whereas holoparasites lose their photosynthetic ability and depend entirely on the host plant to meet their nutrient needs. Consequently, hemiparasitic plants have different degrees of photosynthesis ability; thus, the chloroplast genomes of parasitic plants are exposed to different levels of selective pressures [24,46]. We suggest that further studies should be conducted on the Plastome structure of different types of hemiparasitic plants to determine the exact structural changes that occur in the genome and the variation in genes lost during the shift to the parasitic state.
Although close species tend to have similar IR/SC boundaries, several studies have reported variations in the size and boundaries among IR/LSC and IR/SSC regions and variations in the gene location [47,48]. We observed variations in the size of the IR region in the hemiparasitic species. In addition to a reduction in the size of the LSC region and a large reduction in the size of the SSC, a greater amount (more than half) of the SSC region size was lost compared to that in angiosperms [27], which could be the result of contraction and expansion of the IR region.
The rpl2 gene occupied the LSC/IRb borders in all samples, which is consistent with previous observations [31] in parasitic species of Santalales. In addition, ycf1 was found at the IR/SC borders in most of the compared species, which is consistent with the results for Loranthaceae species mentioned in previous studies [14,31,50,51]. The IRa/SSC boundaries of the two species P. acaciae and P. curviflorus were distinguished by the presence of the protein-code gene rps15, which is usually lost from many other hemiparasites species, as mentioned by [4,20].
Zong et al. indicated that the trnL gene is present in the SSC in the Macrosolen genus of the Loranthaceae family [30]. We noticed the same phenomenon in certain species, and the trnL gene was extended along the SSC/IRb border in certain species, which could be attributed to the extension in the IR region. The ycf1 gene present at the SSC/IRb borders of angiosperm plastomes is often pseudogenized, and the expansion length of ycf1 could influence the IR length and the gene distribution at the SC/IR borders [52,53,54].
The trnH gene is usually located at the IRb/LSC border in angiosperms. We observed variations in the genomes of Plicosepalus spp. and the comparison species, where the trnH gene was present in the inverted repeat region, which could be a result of expansion in the IR region. A similar finding was reported by [55] in the Acanthoideae family.
The values of synonymous (Ks) and nonsynonymous (Ka) substitutions and the Ka/Ks ratio showed that protein-coding genes (petB, psbM, accD, ycf1, rpl23 and atpI) were under positive selection in the P. acaciae and P. curviflorus chloroplast genomes, and these genes could have a faster evolution rate [56]. Our result corresponds with that of [31], who reported that the ycf1 gene was a mutational hotspot in hemiparasitic Macrosolen species (Santalales). We suggest subjecting these genes to further investigation to identify their ability as indicators of phylogenetic relationships within Loranthaceae.
The plastome consists of many highly efficient genes capable of resolving phylogenetic issues at different levels of angiosperm taxonomy [33,57,58,59]. In this study, we found that P. acaciae and P. curviflorus were strongly related to the family Loranthaceae and tribe Lorantheae and all species in the family Loranthaceae represented the monophylitic group. These findings provide additional evidence to confirm the monophyly state of Loranthaceae, as reported by previous studies [3]. In addition, they confirm the taxonomic state of root hemiparasitic N. floribunda (tribe Nuytsieae) and E. albida (tribe Elytrantheae) as sisters to the Lorantheae tribe (belonging to the family Loranthaceae), as mentioned by [3,5,60].
The current results supported those of previous studies [3]. In the taxonomic state of genera and species belonging to subtribes of Lorantheae, the results corresponded to that of [3], who reported that the subtribe Dendrophile did not represent a monophyletic group. In contrast, we noticed a difference in the taxonomic case of M. cochinchinensis, which was previously reported to belong to the tribe Elytrantheae [3]; however, it is a part of the Lorantheae tribe in the current ML and MP trees in a highly supported clade (BP = 100), suggesting the need to rearrange some genera and change the circumscription of some tribes and subtribes of Lorantheae.

4. Materials and Methods

4.1. Sample Collection

Fresh leaves of P. curviflorus were collected from the Al-Taif region, Saudi Arabia (21.218874°, 40.557426°), while those of P. acacia were collected from the Al-Wajh district, Saudi Arabia (26.5737260°, 36.3731150°). The plants were identified by Dr. Rahma Alqthanin, the curator of the Sultan bin Abdulaziz for Research and Environmental Studies Centre, based on herbarium specimens and morphologies in the relevant literature. A sample specimen was prepared and deposited in the herbarium of Umm Al-Qura University, Makkah, under accession numbers P. curviflorus (UQU012021) and P. acacia (UQU062021). Samples of fresh leaves were dried in silica gel for DNA extraction. DNA was extracted from the silica gel-dried leaves of P. curviflorus and P. acacia using the CTAB Plant DNA extraction protocol [61].

4.2. Library Construction

To build the genomic library, 1.0 µg g of DNA was used as input material for sample preparation. The DNA library was constructed using the Illumina TruSeq Nano DNA 350 Kit (Illumina, San Diego, CA, USA) following the manufacturer’s recommendations. The library was initially prepared via the random fragmentation of DNA samples to a size of 350 bp, followed by ligation to 5′ and 3′ adapters. The adapter-ligated fragments were then amplified via PCR and subjected to gel purification. To verify the size of the PCR-enriched fragments, the template size distribution was checked with an Agilent Technologies 2100 Bioanalyzer using a DNA 1000 chip (Agilent Technologies, Santa Clara, CA, USA). The prepared libraries were quantified using qPCR in accordance with the Illumina qPCR Quantification Protocol Guide (Illumina, San Diego, CA, USA).

4.3. De Novo Genome Sequencing

Library construction and sequencing was performed using Illumina sequencing (Illumina, San Diego, CA, USA) and a read length of 151 bp paired ends, and the procedures were carried out by Macrogen (https://dna.macrogen.com/, Seoul, Korea). The final yield of filtered data was 3.7 Gb and 3.25 Gb for P. curviflorus and Plicosepalus acacia, respectively.

4.4. Genome Assembly and Annotation

The FastQC tool was used to assess the raw read quality using a Phred score above 30. All adapters were removed, vector contamination was removed from the assembly, and the N50 value was high for a single genome. Clean reads were processed for genome assembly using NOVOPlasty 4.3.0 Version [62] with kmer (K-mer = 33) to assemble the complete chloroplast genome from the whole genomic sequence of Plicosepalus spp. Arabidopsis thaliana (NC_000932.1) was used as a reference in the assembly. Single contigs containing the complete chloroplast genome were generated. Gene prediction and annotation of the Plicosepalus spp. chloroplast (cp) genome were performed using the GeSeq tool [63] with default parameters, and the percent identity cut-off for protein-coding genes and RNAs was set at ≥60 and ≤85, respectively. tRNA genes were identified with trnAscan-SE Version 2.0 [64]. The annotated (gb) format sequence files were used to draw the circular chloroplast genome maps with the OGDRAW tool (Organellar Genome DRAW), Version 1.3.1 [65]. The sequences of the chloroplast genome of Plicosepalus spp. were deposited in the GenBank database under accession numbers P. acacia (OM640467) and P. curviflorus (OM675776).

4.5. Sequence Analysis

The relative synonymous codon usage (RSCU) values, base composition, and codon usage were analyszd using MEGA software [66], Version 11.0. Potential RNA editing sites present in the protein-coding genes were predicted by the PREP suite [21], with a cut-off value of 0.8.

4.6. Repeat Analysis in the Chloroplast Genome

The online software MIcroSAtellite (MISA) v2.1 [67] was used to identify simple sequence repeats (SSRs) in the chloroplast genome of Plicosepalus spp. and six other species from the Loranthaceae family, namely, S. chingii, T. chinensis, L. europaeus, D. pentandra, N. floribunda, and E. albida. Parameterwise, eight, five, four and three repeat units were assessed for mononucleotides, dinucleotides, trinucleotides and tetra- and pentanucleotide SSR motifs, respectively.
In addition, REPuter [68] software was used with default settings to detect the size and location of long palindromic, forward, reverse, and complementary repeats in the Plicosepalus spp. cp genomes and the genomes of six species from Loranthaceae.

4.7. Sequence Divergence and Boundary

Comparisons between the genome of Plicosepalus spp. and six chloroplast genomic sequences of Loranthaceae (S. chingii, T. chinensis, L. europaeus, D. pentandra, N. floribunda, E. albida) were analysed using the mVISTA program [69], and the annotation of Plicosepalus spp. was used as a reference in the Shuffle-LAGAN mode. Furthermore, comparisons between the borders of the IR, SSC, and LSC regions were performed using IRSCOPE [70].

4.8. Characterization of the Substitution Rate

Methods for estimating nonsynonymous and synonymous substitution rates (Ka and Ks), selection and beneficial mutations among protein-coding sequences were applied [71]. Nonsynonymous (Ka), synonymous (Ks), and Ka/Ks ratios were calculated to detect plastome genes under selection pressure in Plicosepalus spp. and they were compared with those in the six aforementioned Loranthaceae species. We employed KaKs Calculator Version 2.0 [71] with default parameters and the Nei and Gojobori substitutions.

4.9. Heatmap

A heatmap was created to investigate the evolution of the plastome associated with parasitism in the two plastomes of the aerial hemiparasites evaluated in this study, i.e., P. acacia and P. curviflorus, and the results were compared to that of the species of the Loranthaceae family, S. chingii, T. chinensis, L. europaeus, D. pentandra, and E. albida. N. floribunda represents a root hemiparasite in Loranthaceae. In addition to the aerial hemiparasitic species V. album (Viscaceae), S. jasminodora is a root hemiparasite (Santalaceae). E. virginiana was used in the heatmap as a representative of an obligate parasite or holoparasite parasite (Orobanchaceae). E. scandens (Santalales; Erythropalacea) was included as an example of an autotrophic plant. Heatmaps were generated using Python Version 3.7 [72], and multiple libraries were used to plot the heatmap graph. Pandas was used to import data, and Seaborn and plotly were used to plot the actual heatmap data.

4.10. Phylogenetic Analysis

Phylogenetic analyses were conducted built based on coding genes of genome sequences of Santalales order, including species and families (Loranthaceae, Santalaceae, Schoepfiaceae and Viscaceae). Species of the Solanaceae family (N. tabacum) were used as an outgroup. To identify gene families, the OrthoFinder (v 2.5.4) pipeline [73] was sequentially applied to the genomes with all-to-all BLASTP (E-value ≤ 1 × 10− 5), reciprocity best hit, pairs connected by orthology and in-paraolgy, normalize the E-value and cluster pairs by OrthoFinder. Finally, genes were classified into orthologues, paralogues and single copy orthologues (only one gene in each species). To construct the phylogenetic tree, single-copy orthologous genes were used; each gene family nucleotide sequence was aligned using Mafft [74], and the phylogenetic tree was built with both the maximum likelihood (GTR model) and the maximum parsimony using Megatool [66], supports for nodes were assessed with 1000 bootstrapping replicates. The cladograms of the two methods were compared, and we considered that the evolutionary tree constructed by the ML method was more fit. The phylogenetic tree was visualized and modified by ITOL [75].

5. Conclusions

The aim of the present research was to provide the complete chloroplast genome of the medicinal species and hemiparasitic species P. acaciae and P. curviflorus to assess the systematic relationships within the Loranthaceae family. Furthermore, to investigate the evolution of plastome structure associated with parasitism, we compared these the cp genomes of these species with examples of available hemiparasitic and holoparasitic species and autotroph plants. We observed a reduction in the genome size of hemiparasitic P. acaciae and P. curviflorus and a loss of some genes. However, these losses were much less than those observed in the hemiparasite and holoparasite cp genomes. For a better understanding, we recommend that future studies investigate the chloroplast genome of different species in families of Santalales. This study confirmed the taxonomic status of the species Plicosepalus acaciae and P. curviflorus as members of the Loranthaceae family and Lorantheae tribe; however, some species of the Loranthaceae family still require further investigation of their taxonomic status. Moreover, available genome data could facilitate more advanced applications in parasitic plant research, contribute to good parasitic weed management and contribute to modifying the host species to become more resistant.

Supplementary Materials

The following supporting information can be downloaded at: https://www.mdpi.com/article/10.3390/plants11141869/s1, Table S1: Genes present in the plastome of P. acaciae. Table S2: Genes present in the plastome of P. curviflorus. Table S3: Codon–anticodon recognition patterns and codon usage in the P. acacia chloroplast genome. Table S4: Codon–anticodon recognition patterns and codon usage in the P. curviflorus chloroplast genome. Table S5: The predicted RNA editing sites in P. acacia chloroplast genome. Table S6: The predicted RNA editing sites in P. curviflorus chloroplast genome. Figure S1: Synonymous (Ks) and Ka/Ks ratio values of 59 protein-coding genes of the Plicosepalus curviflorus vs. Loranthaceae plastomes. Figure S2: Phylogenetic tree construction inferred from the complete chloroplast genomes of 21 taxa, using Maximum Parsimony (MP) methods. The tree shows the relationships between Brassicales (Cleomaceae, Cappraceae and Brassicaceae). The numbers in the branch nodes represent bootstrap support (BP).

Author Contributions

Conceptualization, W.A.-J.; methodology, W.A.-J. and N.T.A.T.; software, W.A.-J. and R.N.A.-Q.; validation, W.A.-J., N.T.A.T. and R.N.A.-Q.; formal analysis, W.A.-J. and R.N.A.-Q.; investigation, W.A.-J. and N.T.A.T.; validation, W.A.-J., N.T.A.T. and R.N.A.-Q.; writing—original draft preparation, W.A.-J. and R.N.A.-Q.; supervision, W.A.-J. All authors have read and agreed to the published version of the manuscript.

Funding

This research received no external funding.

Institutional Review Board Statement

Not applicable.

Informed Consent Statement

Not applicable.

Data Availability Statement

The data presented in this study are available in this article and Supplementary Materials. The complete chloroplast genome sequence of P. acacia and P. curviflorus were deposited in GenBank at https://www.ncbi.nlm.nih.gov, (accessed on 2 February 2022) (accession numbers: P. acacia (OM640467) and P. curviflorus (OM675776).

Acknowledgments

We thank the Abdulrahman Al-Johani for his cooperation in collected plants samples from the Al-Wajh district.

Conflicts of Interest

The authors declare no conflict of interest.

Abbreviations

Photosystem 1: PS I is the collection of pigments of chlorophyll, absorbing mostly the wavelength of light at 700 nm; Photosystem 2: PS II is the collection of pigments of chlorophyll, absorbing mostly the wavelength of light at 680 nmcytochrome b/f complex; clpP: an enzyme complex; matK: a plant plastidial gene; Rubis CO subunit: a binding protein in Chloroplasts; ATP synthase: a protein that catalyzes the formation of the energy storage molecule adenosine triphosphate (ATP) using adenosine diphosphate (ADP) and inorganic phosphate (Pi); RNA polymerase: an enzyme that synthesizes RNA from a DNA template; Ribosomal protein ssu: the smaller of the two major RNA components of the ribosome; Ycf: hypothetical chloroplast frames; Ribosomal proten lsu: the largest of the two major RNA components of the ribosome; Transfer RNAs: an adaptor molecule that serves as the physical link between the mRNA and the amino acid sequence of proteins; Ribosomal RNAs: a ribozyme which carries out protein synthesis in ribosomes.

References

  1. Shin, H.W.; Lee, N.S. Understanding plastome evolution in hemiparasitic Santalales: Complete chloroplast genomes of three species, dendrotrophe varians, helixanthera parasitica, and macrosolen cochinchinensis. PLoS ONE 2018, 13, e0200293. [Google Scholar] [CrossRef] [PubMed]
  2. Petersen, G.; Cuenca, A.; Seberg, O. Plastome evolution in hemiparasitic mistletoes. Genome Biol. Evol. 2015, 7, 2520–2532. [Google Scholar] [CrossRef] [PubMed] [Green Version]
  3. Liu, B.; Le, C.T.; Barrett, R.L.; Nickrent, D.L.; Chen, Z.; Lu, L.; Vidal-Russell, R. Historical biogeography of Loranthaceae (Santalales): Diversification agrees with emergence of tropical forests and radiation of songbirds. Mol. Phylogenet. Evol. 2018, 124, 199–212. [Google Scholar] [CrossRef] [PubMed] [Green Version]
  4. Su, H.-J.; Liang, S.-l.; Nickrent, D.L. Plastome variation and phylogeny of Taxillus (Loranthaceae). PLoS ONE 2021, 16, 0256345. [Google Scholar]
  5. Vidal-Russell, R.; Nickrent, D.L. Evolutionary relationship in the showy mistletoe family (Loranthaceae). Am. J. Bot. 2008, 95, 1015–1029. [Google Scholar] [CrossRef] [Green Version]
  6. Watson, D.M. Mistletoe—A keystone resource in forests and woodlands worldwide. Annu. Rev. Ecol. Syst. 2001, 32, 219–249. [Google Scholar] [CrossRef] [Green Version]
  7. Engler, A. Loranthaceae. In Die Naturlichen Planzenfamilien, 3rd ed.; Engler, A., Prantl, K., Eds.; Wilhelm Engelmann: Leipzig, Germany, 1894; pp. 156–198. [Google Scholar]
  8. Tieghem, P. Sur le groupement des especes en genres dans les Loranthacees a calice gamosepale et antheres basifixes ou Dendrophthoees. Bull. Soc. Bot. Fr. 1895, 42, 241–272. [Google Scholar] [CrossRef] [Green Version]
  9. Nickrent, D.L.; Malécot, V.; Vidal-Russell, R.; Der, J.P. A revised classification of Santalales. Taxon 2010, 59, 538–558. [Google Scholar] [CrossRef]
  10. Migahid, A.M. Flora of Saudi Arabia, 4th ed.; King Saud University Press: Riyadh, Saudi Arabia, 1996; Volume 2, pp. 68–69. [Google Scholar]
  11. Orfali, R. Pharmacological evaluation of secondary metabolites and their simultaneous determination in the arabian medicinal plant plicosepalus curviflorus using hptlc validated. J. Anal. Methods Chem. 2019, 2019, 7435909. [Google Scholar] [CrossRef] [Green Version]
  12. Nickrent, D.L.; Su, H.-J.; Lin, R.-Z.; Devkota, M.P.; Hu, J.-M.; Glatzel, G. Examining the needle in the haystack: Evolutionary relationships in the mistletoe genus Loranthus (Loranthaceae). Syst. Bot. 2021, 46, 403–415. [Google Scholar] [CrossRef]
  13. Plant of the World, Royal Botanical Gardens (Kew). 2022. Available online: https://powo.science.kew.org/ (accessed on 5 February 2022).
  14. Palmer, J.D. Comparative organization of chloroplast genomes. Annu. Rev. Genet. 1985, 19, 325–354. [Google Scholar] [CrossRef] [PubMed]
  15. Wicke, S. The evolution of the plastid chromosome in land plants: Gene content, gene order, gene function. Plant Mol. Biol. 2011, 76, 273–297. [Google Scholar] [CrossRef] [PubMed] [Green Version]
  16. Straub, S.C.K.; Parks, M.; Weitemier, K.; Fishbein, M.; Cronn, R.C.; Liston, A. Navigating the tip of the genomic iceberg: Next-generation sequencing for plant systematics. Am. J. Bot. 2012, 99, 349–364. [Google Scholar] [CrossRef] [Green Version]
  17. Mattick, J.S.; Gagen, M.J. The evolution of controlled multitasked gene networks: The role of introns and other noncoding RNAs in the development of complex organisms. Mol. Biol. Evol. 2001, 18, 1611–1630. [Google Scholar] [CrossRef] [PubMed] [Green Version]
  18. Taberlet, P. Power and limitations of the chloroplast trnL (UAA) intron for plant DNA barcoding. Nucleic Acids Res. 2007, 35, e14. [Google Scholar] [CrossRef] [PubMed] [Green Version]
  19. Staden, R.; McLachlan, A.D. Codon preference and its use in identifying protein coding regions in long DNA sequences. Nucleic Acids Res. 1982, 10, 141–156. [Google Scholar] [CrossRef] [PubMed]
  20. Li, B. Complete chloroplast genome sequence of Decaisnea insignis: Genome organization, genomic resources and comparative analysis. Sci. Rep. 2017, 7, 10073. [Google Scholar] [CrossRef]
  21. Mower, J.P. The PREP suite: Predictive RNA editors for plant mitochondrial genes, chloroplast genes and user-defined alignments. Nucleic Acids Res. 2009, 37, 253–259. [Google Scholar] [CrossRef]
  22. Bundschuh, R.; Altmuller, J.; Becker, C.; Nurnberg, P.; Gott, J.M. Complete characterization of the edited transcriptome of the mitochondrion of Physarum polycephalum using deep sequencing of RNA. Nucleic Acids Res. 2011, 39, 6044–6055. [Google Scholar] [CrossRef] [Green Version]
  23. Shaw, J.; Lickey, E.B.; Schilling, E.E.; Small, R.L. Comparison of whole chloroplast genome sequences to choose noncoding regions for phylogenetic studies in angiosperms: The tortoise and the hare III. Am. J. Bot. 2007, 94, 275–288. [Google Scholar] [CrossRef] [Green Version]
  24. Wicke, S.; Müller, K.F.; Claude, W.D.; Quandt, D.; Bellot, S.; Schneeweiss, G.M. Mechanistic model of evolutionary rate variation en route to a nonphotosynthetic lifestyle in plants. Proc. Natl. Acad. Sci. USA 2016, 113, 9045–9050. [Google Scholar] [CrossRef] [PubMed] [Green Version]
  25. Wicke, S.; Naumann, J. Molecular evolution of plastid genomes in parasitic flowering plants. Adv. Bot. Res. 2018, 85, 315–347. [Google Scholar]
  26. Bellot, S.; Cusimano, N.; Luo, S.; Sun, G.; Zarre, S.; Groger, A.; Temsch, E.; Renner, S.S. Assembled plastid and mitochondrial genomes, as well as nuclear genes, place the parasite family cynomoriaceae in the saxifragales. Genome Biol. Evol. 2016, 8, 2214–2230. [Google Scholar] [CrossRef] [PubMed] [Green Version]
  27. Wang, X.; Dorjee, T.; Chen, Y.; Gao, F.; Zhou, Y. The complete chloroplast genome sequencing analysis revealed an unusual IRs reduction in three species of subfamily Zygophylloideae. PLoS ONE 2022, 17, e0263253. [Google Scholar] [CrossRef] [PubMed]
  28. Schelkunov, M.I.; Nuraliev, M.S.; Logacheva, M.D. Rhopalocnemis phalloides has one of the most reduced and mutated plastid genomes known. PeerJ 2019, 7, e7500. [Google Scholar] [CrossRef] [Green Version]
  29. Su, H.-J.; Barkman, T.J.; Hao, W.; Jones, S.S.; Naumann, J.; Skippington, E.; Wafula, E.K.; Hu, J.-M.; Palmer, J.D.; dePamphilis, C.W. Novel genetic code and record-setting AT-richness in the highly reduced plastid genome of the holoparasitic plant Balanophora. Proc. Natl. Acad. Sci. USA 2018, 116, 934–943. [Google Scholar]
  30. Zong, D.; Zhang, Y.; Zou, X.; Li, D.; Duan, A.; He, C. Characterization of the complete chloroplast genomes of five Populus species from the western Sichuan plateau, southwest China: Comparative and phylogenetic analyses. PeerJ 2019, 7, e6386. [Google Scholar] [CrossRef] [Green Version]
  31. Nie, L.; Cui, Y.; Wu, L.; Zhou, J.; Xu, Z.; Li, Y.; Li, X.; Wang, Y.; Yao, H. Gene losses and variations in chloroplast genome of parasitic plant macrosolen and phylogenetic relationships within santalales. Int. J. Mol. Sci. 2019, 20, 5812. [Google Scholar] [CrossRef] [Green Version]
  32. Raman, G.; Park, S. The complete chloroplast genome sequence of Ampelopsis: Gene organization, comparative analysis, and phylogenetic relationships to other angiosperms. Front. Plant Sci. 2016, 7, 341. [Google Scholar] [CrossRef] [Green Version]
  33. Alzahrani, D.A.; Yaradua, S.S.; Albokhari, E.J.; Abba, A. Complete chloroplast genome sequences of Dipterygium glaucum and Cleome chrysantha and other Cleomaceae species, comparative analysis and phylogenetic relationships. Saudi J. Biol. Sci. 2021, 28, 2476–2490. [Google Scholar] [CrossRef]
  34. Wang, W.; Yu, H.; Wang, J.; Lei, W.; Gao, J.; Qiu, X.; Wang, J. The complete chloroplast genome sequences of the medicinal plant Forsythia suspensa (Oleaceae). Int. J. Mol. Sci. 2017, 18, 2288. [Google Scholar] [CrossRef] [PubMed] [Green Version]
  35. Park, M.; Park, H.; Lee, H.; Lee, B.; Lee, J. The complete plastome sequence of an Antarctic bryophyte Sanionia uncinata (Hedw.) Loeske. Int. J. Mol. Sci. 2018, 19, 709. [Google Scholar] [CrossRef] [PubMed] [Green Version]
  36. Provan, J.; Powell, W.; Hollingsworth, P.M. Chloroplast microsatellites: New tools for studies in plant ecology and evolution. Trends Ecol. Evol. 2001, 16, 142–147. [Google Scholar] [CrossRef]
  37. Yang, A.-H.; Zhang, J.-J.; Yao, X.-H.; Huang, H.-W. Chloroplast microsatellite markers in Liriodendron tulipifera (Magnoliaceae) and cross-species amplification in L. chinense. Am. J. Bot. 2011, 98, e123–e126. [Google Scholar] [CrossRef] [PubMed]
  38. Xue, J.; Wang, S.; Zhou, S.-L. Polymorphic chloroplast microsatellite loci in Nelumbo (Nelumbonaceae). Am. J. Bot. 2012, 99, e240–e244. [Google Scholar] [CrossRef] [PubMed]
  39. Hu, Y.; Woeste, K.E.; Zhao, P. Completion of the chloroplast genomes of five Chinese juglans and their contribution to chloroplast phylogeny. Front. Plant Sci. 2017, 7, 1955. [Google Scholar] [CrossRef] [Green Version]
  40. Ruhsam, M.; Clark, A.; Finger, A.; Wulff, A.S.; Mill, R.R.; Thomas, P.I.; Gardner, M.F.; Gaudeul, M.; Ennos, R.A.; Hollingsworth, P.M. Hidden in plain view: Cryptic diversity in the emblematic Araucaria of New Caledonia. Am. J. Bot. 2016, 103, 888–898. [Google Scholar] [CrossRef] [Green Version]
  41. Sunil-Kumar, K.N.; Maruthi, K.R.; Alfarhan, A.H.; Rajakrishnan, R.; Thomas, J. Molecular fingerprinting of Helicanthus elastica (Desr.) Danser growing on five different hosts by RAPD. Saudi J. Biol. Sci. 2016, 23, 335–340. [Google Scholar] [CrossRef] [Green Version]
  42. Friedrich, T.; Klaus, S.; Weiss, H. The proton–pumping respiratory complex I of bacteria and mitochondria and its homologue in chloroplasts. FEBS Lett. 1995, 367, 107–111. [Google Scholar] [CrossRef] [Green Version]
  43. Zhu, Z.X.; Wang, J.H.; Cai, Y.C.; Zhao, K.K.; Moore, M.J.; Wang, H.F. Complete plastome sequence of Erythropalum scandens (Erythropalaceae), an edible and medicinally important liana in China. Mitochondrial DNA Part B 2018, 3, 139–140. [Google Scholar] [CrossRef] [Green Version]
  44. Su, H.J.; Hu, J.M. The complete chloroplast genome of hemiparasitic flowering plant Schoepfia jasminodora. Mitochondrial DNA Part B 2016, 1, 767–769. [Google Scholar] [CrossRef] [Green Version]
  45. Frailey, D.C.; Chaluvadi, S.R.; Vaughn, J.N.; Goatney, C.G.; Bennetzen, J.L. Gene loss and genome rearrangement in the plastids of five Hemiparasites in the family Orobanchaceae. BMC Plant Biol. 2018, 18, 30. [Google Scholar] [CrossRef] [Green Version]
  46. Wicke, S.; Müller, K.F.; Claude, W.D.; Quandt, D.; Bellot, S.; Schneeweiss, G.M. Mechanisms of functional and physical genome reduction in photosynthetic and nonphotosynthetic parasitic plants of the broomrape family. Plant Cell 2013, 25, 3711–3725. [Google Scholar] [CrossRef] [Green Version]
  47. Raubeson, L.A.; Peery, R.; Chumley, T.W.; Dziubek, C.; Fourcade, H.M.; Boore, J.L. Comparative chloroplast genomics: Analyses including new sequences from the angiosperms Nuphar advena and Ranunculus macranthus. BMC Genom. 2007, 8, 174. [Google Scholar] [CrossRef] [Green Version]
  48. Wang, R.J.; Cheng, C.L.; Chang, C.C.; Wu, C.-L.; Su, T.-M.; Chaw, S.-M. Dynamics and evolution of the inverted repeat-large single copy junctions in the chloroplast genomes of monocots. BMC Evol. Biol. 2008, 8, 3650. [Google Scholar] [CrossRef] [Green Version]
  49. Millen, R.S.; Olmstead, R.G.; Adams, K.L.; Palmer, J.D.; Lao, N.T.; Heggie, L.; Kavanagh, T.A.; Hibberd, J.M.; Gray, J.C.; Morden, C.W.; et al. Many Parallel Losses of infA from Chloroplast DNA during Angiosperm Evolution with Multiple Independent Transfers to the Nucleus. Plant Cell. 2001, 13, 645–658. [Google Scholar] [CrossRef] [Green Version]
  50. Goulding, S.E.; Wolfe, K.; Olmstead, R.; Morden, C. Ebb and flow of the chloroplast inverted repeat. Mol. Genet. Genom. 1996, 252, 195–206. [Google Scholar] [CrossRef]
  51. Sugiura, M. The chloroplast genome. In 10 Years Plant Molecular Biology; Springer: Dordrecht, The Netherlands, 1992; pp. 149–168. [Google Scholar]
  52. Daniell, H.; Lee, S.-B.; Grevich, J.; Saski, C.; Quesada-Vargas, T.; Guda, C.; Tomkins, J.; Jansen, R.K. Complete chloroplast genome sequences of Solanum bulbocastanum, Solanum lycopersicum and comparative analyses with other Solanaceae genomes. Theor. Appl. Genet. 2006, 112, 1503. [Google Scholar] [CrossRef]
  53. Yao, X.; Tan, Y.-H.; Liu, Y.-Y.; Song, Y.; Yang, J.-B.; Corlett, R.T. Chloroplast genome structure in Ilex (Aquifoliaceae). Sci. Rep. 2016, 6, 28559. [Google Scholar] [CrossRef] [Green Version]
  54. Wang, X.; Gussarova, G.; Ruhsam, M.; De Vere, N.; Metherell, C.; Hollingsworth, P.M.; Twyford, A.D. DNA barcoding a taxonomically complex hemiparasitic genus reveals deep divergence between ploidy levels but lack of species-level resolution. Ann. Bot. 2018, 10, ply026. [Google Scholar] [CrossRef]
  55. Alzahrani, D.A.; Yaradua, S.S.; Albokhari, E.J.; Abba, A. Complete chloroplast genome sequence of Barleria prionitis, comparative chloroplast genomics and phylogenetic relationships among Acanthoideae. BMC Genom. 2020, 21, 393. [Google Scholar] [CrossRef]
  56. Zhou, T.; Ruhsam, M.; Wang, J.; Zhu, H.; Li, W.; Zhang, X.; Xu, Y.; Xu, F.; Wang, X. The complete chloroplast genome of euphrasia regelii, pseudogenization of ndh genes and the phylogenetic relationships within orobanchaceae. Front. Genet. 2019, 10, 444. [Google Scholar] [CrossRef] [Green Version]
  57. Yaradua, S.S. Complete chloroplast genome sequence of justicia flava: Genome comparative analysis and phylogenetic relationships among acanthaceae. BioMed Res. Int. 2019, 17, 4370258. [Google Scholar] [CrossRef] [Green Version]
  58. Yang, Y.; Zhou, T.; Duan, D.; Yang, J.; Feng, L.; Zhao, G. Comparative analysis of the complete chloroplast genomes of five quercus species. Front. Plant Sci. 2016, 7, 959. [Google Scholar] [CrossRef] [Green Version]
  59. Dong, W.; Xu, C.; Li, W.; Xie, X.; Lu, Y.; Liu, Y.; Jin, X.; Suo, Z. Phylogenetic resolution in Juglans based on complete chloroplast genomes and nuclear DNA sequences. Front. Plant Sci. 2017, 8, 1148. [Google Scholar] [CrossRef] [Green Version]
  60. Cabrera, J.F. Molecular Phylogeny and Historical Biogeography of Loranthaceae (Santalales) Inferred from Matk Sequence Data. Master’s Thesis, Southern Illinois University, Carbondale, IL, USA, 2002. [Google Scholar]
  61. Doyle, J.; Doyle, J. A rapid DNA isolation procedure for small quantities of fresh leaf tissue. Phytochem. Bull. 1987, 19, 11–15. [Google Scholar]
  62. Dierckxsens, N.; Mardulyn, P.; Smits, G. NOVOPlasty: De novo assembly of organelle genomes from whole genome data. Nucleic Acids Res. 2017, 45, e18. [Google Scholar]
  63. Tillich, M.; Lehwark, P.; Pellizzer, T.; Ulbricht-Jones, E.S.; Fischer, A.; Bock, R.; Greiner, S. GeSeq—Versatile and accurate annotation of organelle genomes. Nucleic Acids Res. 2017, 45, W6–W11. [Google Scholar] [CrossRef]
  64. Chan, P.P.; Lin, B.Y.; Mak, A.J.; Lowe, T.M.; Notes, A. tRNAscan-SE 2.0: Improved detection and functional classification of transfer RNA genes. Nucleic Acids Res. 2021, 49, 9077–9096. [Google Scholar] [CrossRef]
  65. Greiner, S.; Lehwark, P.; Bock, R. Organellar genome DRAW (OGDRAW) version 1.3.1: Expanded toolkit for the graphical visualization of organellar genomes. Nucleic Acids Res. 2019, 47, W59–W64. [Google Scholar] [CrossRef] [Green Version]
  66. Kumar, S.; Stecher, G.; Tamura, K. MEGA7: Molecular evolutionary genetics analysis version 7.0 for bigger datasets. Mol. Biol. Evol. 2016, 33, 1870–1874. [Google Scholar] [CrossRef] [Green Version]
  67. Thiel, T.; Michalek, W.; Varshney, R. Exploiting EST databases for the development and characterization of gene-derived SSR-markers in barley (Hordeum vulgare L.). Theor. Appl. Genet. 2003, 106, 411–422. [Google Scholar] [CrossRef]
  68. Kurtz, S.; Choudhuri, J.V.; Ohlebusch, E.; Schleiermacher, C.; Stoye, J.; Giegerich, R. REPuter: The manifold applications of repeat analysis on a genomic scale. Nucleic Acids Res. 2001, 29, 4633–4642. [Google Scholar] [CrossRef] [Green Version]
  69. Mayor, C.; Brudno, M.; Schwartz, J.R.; Poliakov, A.; Rubin, E.M.; Frazer, K.A.; Pachter, L.S.; Dubchak, I. VISTA: Visualizing global DNA sequence alignments of arbitrary length. Bioinformatics 2000, 16, 1046–1047. [Google Scholar] [CrossRef] [Green Version]
  70. Amiryousefi, A.; Hyvönen, J.; Poczai, P. IRscope: An online program to visualize the junction sites of chloroplast genomes. Bioinformatics 2018, 34, 3030–3031. [Google Scholar] [CrossRef]
  71. Wang, D. KaKs_Calculator 2.0: A toolkit incorporating gamma-series methods and sliding window strategies. Genom. Proteom. Bioinform. 2010, 8, 77–80. [Google Scholar] [CrossRef] [Green Version]
  72. Van Rossum, G.; Drake, F.L., Jr. Python Reference Manual; Centrum voor Wiskunde en Informatica: Amsterdam, The Netherlands, 1995. [Google Scholar]
  73. Emms, D.M.; Kelly, S. OrthoFinder: Phylogenetic orthology inference for comparative genomics. Genome Biol. 2019, 20, 238. [Google Scholar] [CrossRef] [Green Version]
  74. Madeira, F.; Pearce, M.; Tivey, A.R.N.; Basutkar, P.; Lee, J.; Edbali, O.; Madhusoodanan, N.; Kolesnikov, A.; Lopez, R. Search and sequence analysis tools services from EMBL-EBI in 2022. Nucleic Acids Res. 2022, 50, W276–W279. [Google Scholar] [CrossRef]
  75. Letunic, I.; Bork, P. Interactive Tree of Life (iTOL) v5: An online tool for phylogenetic tree display and annotation. Nucleic Acids Res. 2021, 49, W293–W296. [Google Scholar] [CrossRef]
Figure 1. (a) Gene map of the Plicosepalus acaciae plastid genome. (b) Gene map of the Plicosepalus curviflorus plastid genome. Small single copy (SSC), large single copy (LSC) and inverted repeats (IRa and IRb) are indicated. Thick lines on the outer complete circle identify the inverted repeat regions (IRa and IRb). The genes outside the circle are transcribed counterclockwise, whereas those inside the circle are transcribed clockwise. Genes belonging to different functional groups are highlighted in different colours. The dark grey area in the inner circle indicates the CG content of the plastome, using OGDRAW tool Version 1.3.1.
Plants 11 01869 g001aPlants 11 01869 g001b
Figure 2. Amino acid frequencies of the protein-coding sequences of Plicosepalus acaciae (blue) and Plicosepalus curviflorus (orange) chloroplast genomes using MEGA software Version 11.0; the most and least frequent amino acids are shown.
Plants 11 01869 g002
Figure 3. Number of each repeat type—F, forward; P, palindromic; R, reverse; and C, complement repeats—in the plastid genome of Plicosepalus acaciae and Plicosepalus curviflorus and six species from Loranthaceae, using REPuter 2 software. Taxillus chinensis had the highest frequency of palindromic repeats, Nuytsia floribunda had the highest frequency of forward repeats, and Plicosepalus curviflorus had the highest frequency of reverse repeats. Complement repeats were the least common type of repeat.
Plants 11 01869 g003
Figure 4. Number of different simple sequence repeat (SSR) types in the plastid genomes of Plicosepalus acaciae and Plicosepalus curviflorus and six species from Loranthaceae using MISA software v2.1. The majority of SSRs in the cp genome were monorepeats.
Plants 11 01869 g004
Figure 5. Number of SSR types in the complete chloroplast genome, protein-coding regions, and non-coding regions of (a) Plicosepalus acacia, (b) Plicosepalus curviflorus.
Plants 11 01869 g005
Figure 6. Whole chloroplast genome alignments for Loranthaceae species via the mVISTA program, using the annotation of Plicosepalus acaciae as reference. The x-axis represents the coordinates in the cp genome, while the y-axis indicates percentage identity from 50% to 100%. The top grey arrows indicate the position and direction of each gene. Pink indicates non-coding sequences (NCS), blue indicates protein-coding genes, and light green indicates tRNAs and rRNAs.
Plants 11 01869 g006
Figure 7. Comparison of the large single copy (LSC), a small single copy (SSC) and two inverted repeats (IRa and IRb) region borders among the chloroplast genomes of eight Loranthaceae species using IRSCOPE. Variations in the region’s length and gene locations are observed.
Plants 11 01869 g007
Figure 8. Synonymous (Ks) and Ka/Ks ratio values of 59 protein-coding genes of the Plicosepalus acacia vs. Loranthaceae plastomes (Plicosepalus curviflorus, Scurrula chingii, Taxillus chinensis, Loranthus europaeus, Dendrophthoe pentandra, Nuytsia floribunda and Elytranthe), using the KaKs Calculator 2.0 to detect substitution, selection, and beneficial mutation genes under selective pressure (>1).
Plants 11 01869 g008
Figure 9. Heatmap displaying a comparison of the plastid genome gene content of 11 parasitic plants and 1 autotrophic plant (Erythropalum scandens) using Plotly software. The common existing genes in the plastid genome of the 12 species are not listed. Orange colour indicates each gene present and seafoam indicates a pseudogene. The yellow indicates an absent gene.
Plants 11 01869 g009
Figure 10. Phylogenetic tree construction inferred from the complete chloroplast genomes of 21 taxa including Plicosepalus acaciae and Plicosepalus curviflorus, using Maximum Likelihood (ML) methods and Megatool. The tree shows the relationships between tribes and sub-tribes of Loranthaceae and related families of the order Santalales (Viscaceae, Santalaceae, and Schoepfiaceae), Nicotiana tabacum was used as an outgroup. The numbers in the branch nodes represent bootstrap support (BS). All branches of the tree were highly supported with 100% bootstrap values. Monophyly of the Loranthaceae family was strongly supported and P. acacia and P. curviflorus belong to subtribe Tapinanthinae.
Plants 11 01869 g010
Table 1. Chloroplast genome features of Plicosepalus acaciae & Plicosepalus curviflorus.
FeatureP. acaciaeP. curviflorus
Genome size (bp)120,181121,086
IRA (bp)22,32322,476
IRB (bp)22,32322,476
LSC (bp)69,49769,947
SSC (bp)60386187
Total No of Genes106108
Total No of Unique Genes9292
rRNA44
tRNA2525
Protein-Coding genes6363
A%31.5031.34
T (U) %31.9331.89
G%17.9718.12
C %18.5918.65
%GC36.636.8
Table 2. Genes with introns in the chloroplast genome of Plicosepalus acaciae.
GeneStrandLocationExon I (bp)Intron I (bp)Exon II (bp)Intron II (bp)Exon III (bp)
atpF-LSC145801401
ycf3-LSC124762230768153
clpP-LSC71767294675229
petB+LSC6814642
rps12-IRB56515229
+IRA22951556
rpl2-IRB391654431
rpl16-LSC3034869
petD+LSC8743484
trnL-UAA+LSC3529955
trnA-UGC-IRA5534239
+IRB3934255
Table 3. Genes with introns in the chloroplast genome of Plicosepalus curviflorus.
GeneStrandLocationExon I (bp)Intron I (bp)Exon II (bp)Intron II (bp)Exon III (bp)
atpF-LSC145792410
rpoC1-LSC4328301617
ycf3-LSC124743230772153
clpP-LSC71752294524229
rpl2-IRB391654440
rps12-IRB56507229
+IRA22950756
rpl16-LSC989381
petB+LSC6864642
trnL-UAA+LSC3529055
trnA-UGC-IRA5535037
+IRB3735055
Table 4. cpSSRs detected in eight Lornthaceae chloroplast genomes.
SSR TypeRepeat UnitPlicosepalus
acacia
Plicosepalus curviflorusScurrula
chingii
Taxillus
chinensis
Loranthus
europaeus
Dendrophthoe pentandraNuytsia floribundaElytranthe
albida
MonoA6762594944504760
C22476636
G10222032
T6970878667786987
DiAG/CT11000110
AT/AT10613675123
TriAAG/CTT22222200
AAT/ATT41111321
ATC/ATG00000002
TetraAAAG/CTTT33112203
AAAT/ATTT42104531
ACAG/CTGT10111101
AGGG/CCCT02202200
AAGT/ACTT00100000
AATT/AATT00100001
AATC/ATTG00010000
AAAC/GTTT00001000
AACC/GGTT00001000
AGAT/ATCT00001011
AATG/ATTC00000011
PentaAAAAT/ATTTT01000000
AATAT/ATATT03012000
Total 164155175157143155142169
Table 5. Accession numbers of chloroplast genome analyzed in the study.
OrderFamilyAccession NumberOrganism
SantalalesLoranthaceaeNC_053563Scurrula chingii (W.C.Cheng) H.S.Kiu
MN080717Taxillus chinensis (DC.) Danser
MN080718.1Helixanthera parasitica Lour.
MT987630Loranthus europaeus Jacq.
MT987635.1Loranthus pseudo-odoratus Lingelsh.
NC_039376Macrosolen cochinchinensis (Lour.) Tiegh.
NC_045107Dendrophthoe pentandra (L.) Miq.
NC_045108Elytranthe albida (Blume) Blume
NC_058837Taxillus pseudochinensis (Yamam.) Danser
NC_058840Taxillus tsaii S.T.Chiu
NC_058859Cecarria obtusifolia (Merr.) Barlow
NC_058862.1Loranthus guizhouensis H.S.Kiu
NC_058868Moquiniella rubra (A.Spreng.) Balle
NC_058869Nuytsia floribunda (Labill.) R.Br. ex G.Don
NC_058858.1Loranthus delavayi Tiegh.
SantalaceaeNC_027960Osyris alba L.
SchoepfiaceaeNC_034228Schoepfia jasminodora Siebold & Zucc.
ViscaceaeKT003925.1Viscum album L.
NC_027829Viscum minimum Harv.
ErythropalaceaeNC_036759.1Erythropalum scandens Blume
LamialesOrobanchaceaeNC_001568.1Epifagus virginiana (L.) Barton
SolanalesSolanaceaeNC_001879Nicotiana tabacum L.
Publisher’s Note: MDPI stays neutral with regard to jurisdictional claims in published maps and institutional affiliations.

