
Polyphenols and Flavonoids Composition, Anti-Inflammatory and Antioxidant Properties of Andean Baccharis macrantha Extracts

 ,
,  and
and
Abstract
:1. Introduction
2. Materials and Methods
2.1. Chemicals
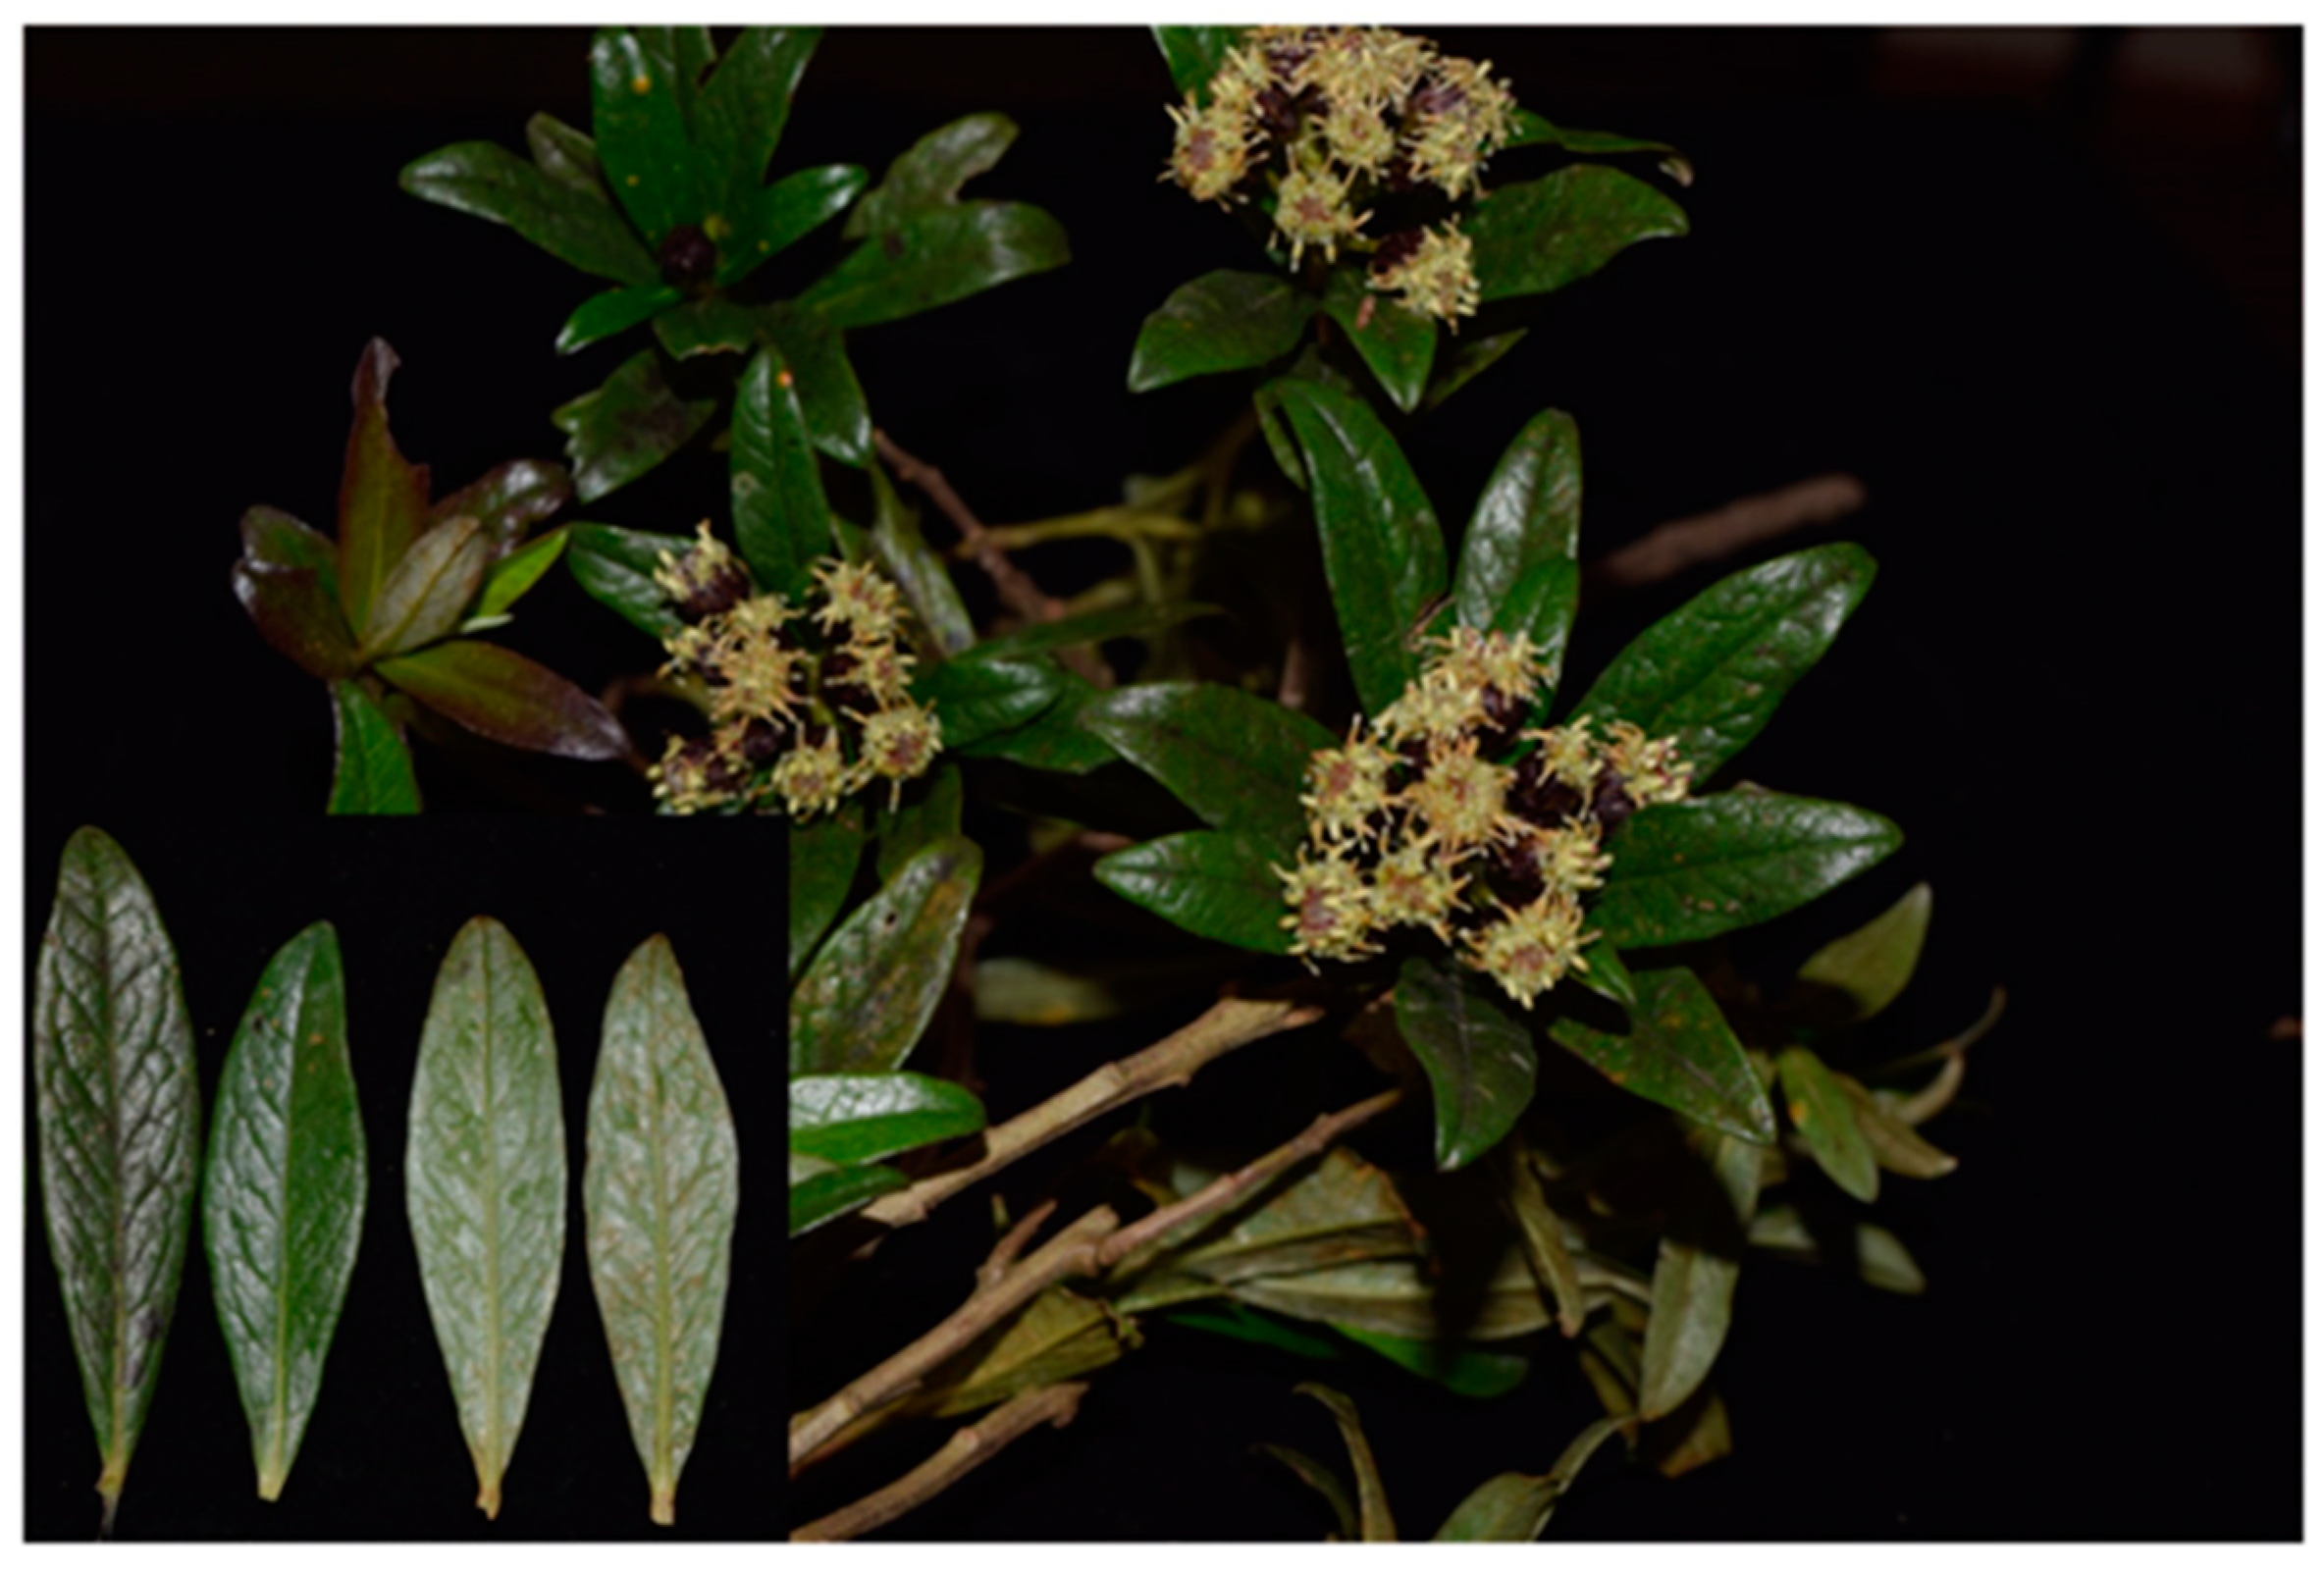
2.2. Plant Material
2.3. Optimization of Polyphenols and Flavonoids Extraction by the Solid-Liquid Phase Extraction
2.4. Total Polyphenol Content (TPC)
2.5. Total Flavonoid Content (TFC)
2.6. Thin-Layer Chromatography (TLC)
2.7. Reverse Phase-Ultra High-Performance Liquid Chromatography (RP-UHPLC)
2.8. Atomic Absorption Spectrometry Analysis of B. macrantha Metal Content
2.9. Biological Activities
2.9.1. Thiobarbituric Acid Reactive Substances (TBARs) In Vitro Assay
2.9.2. Red Blood Cell Membrane Stabilizing (RBC) Assay
2.9.3. Evaluation of Antioxidant Activity In Vitro
Ferric-Reducing Antioxidant Power (FRAP) Method
Azinobis (3-Ethyl-Benzothiazoline-6-Sulfonic Acid) Cation Bleaching ABTS Method
2,2-Diphenyl-1-Picrylhydrazyl (DPPH) Radical Scavenging Assay
2.10. Statistical Analysis
3. Results and Discussion
3.1. Effect of Solvent in the Extraction Process of TPC and TFC
3.2. Effect of Temperature in the Extraction Process of TPC and TFC
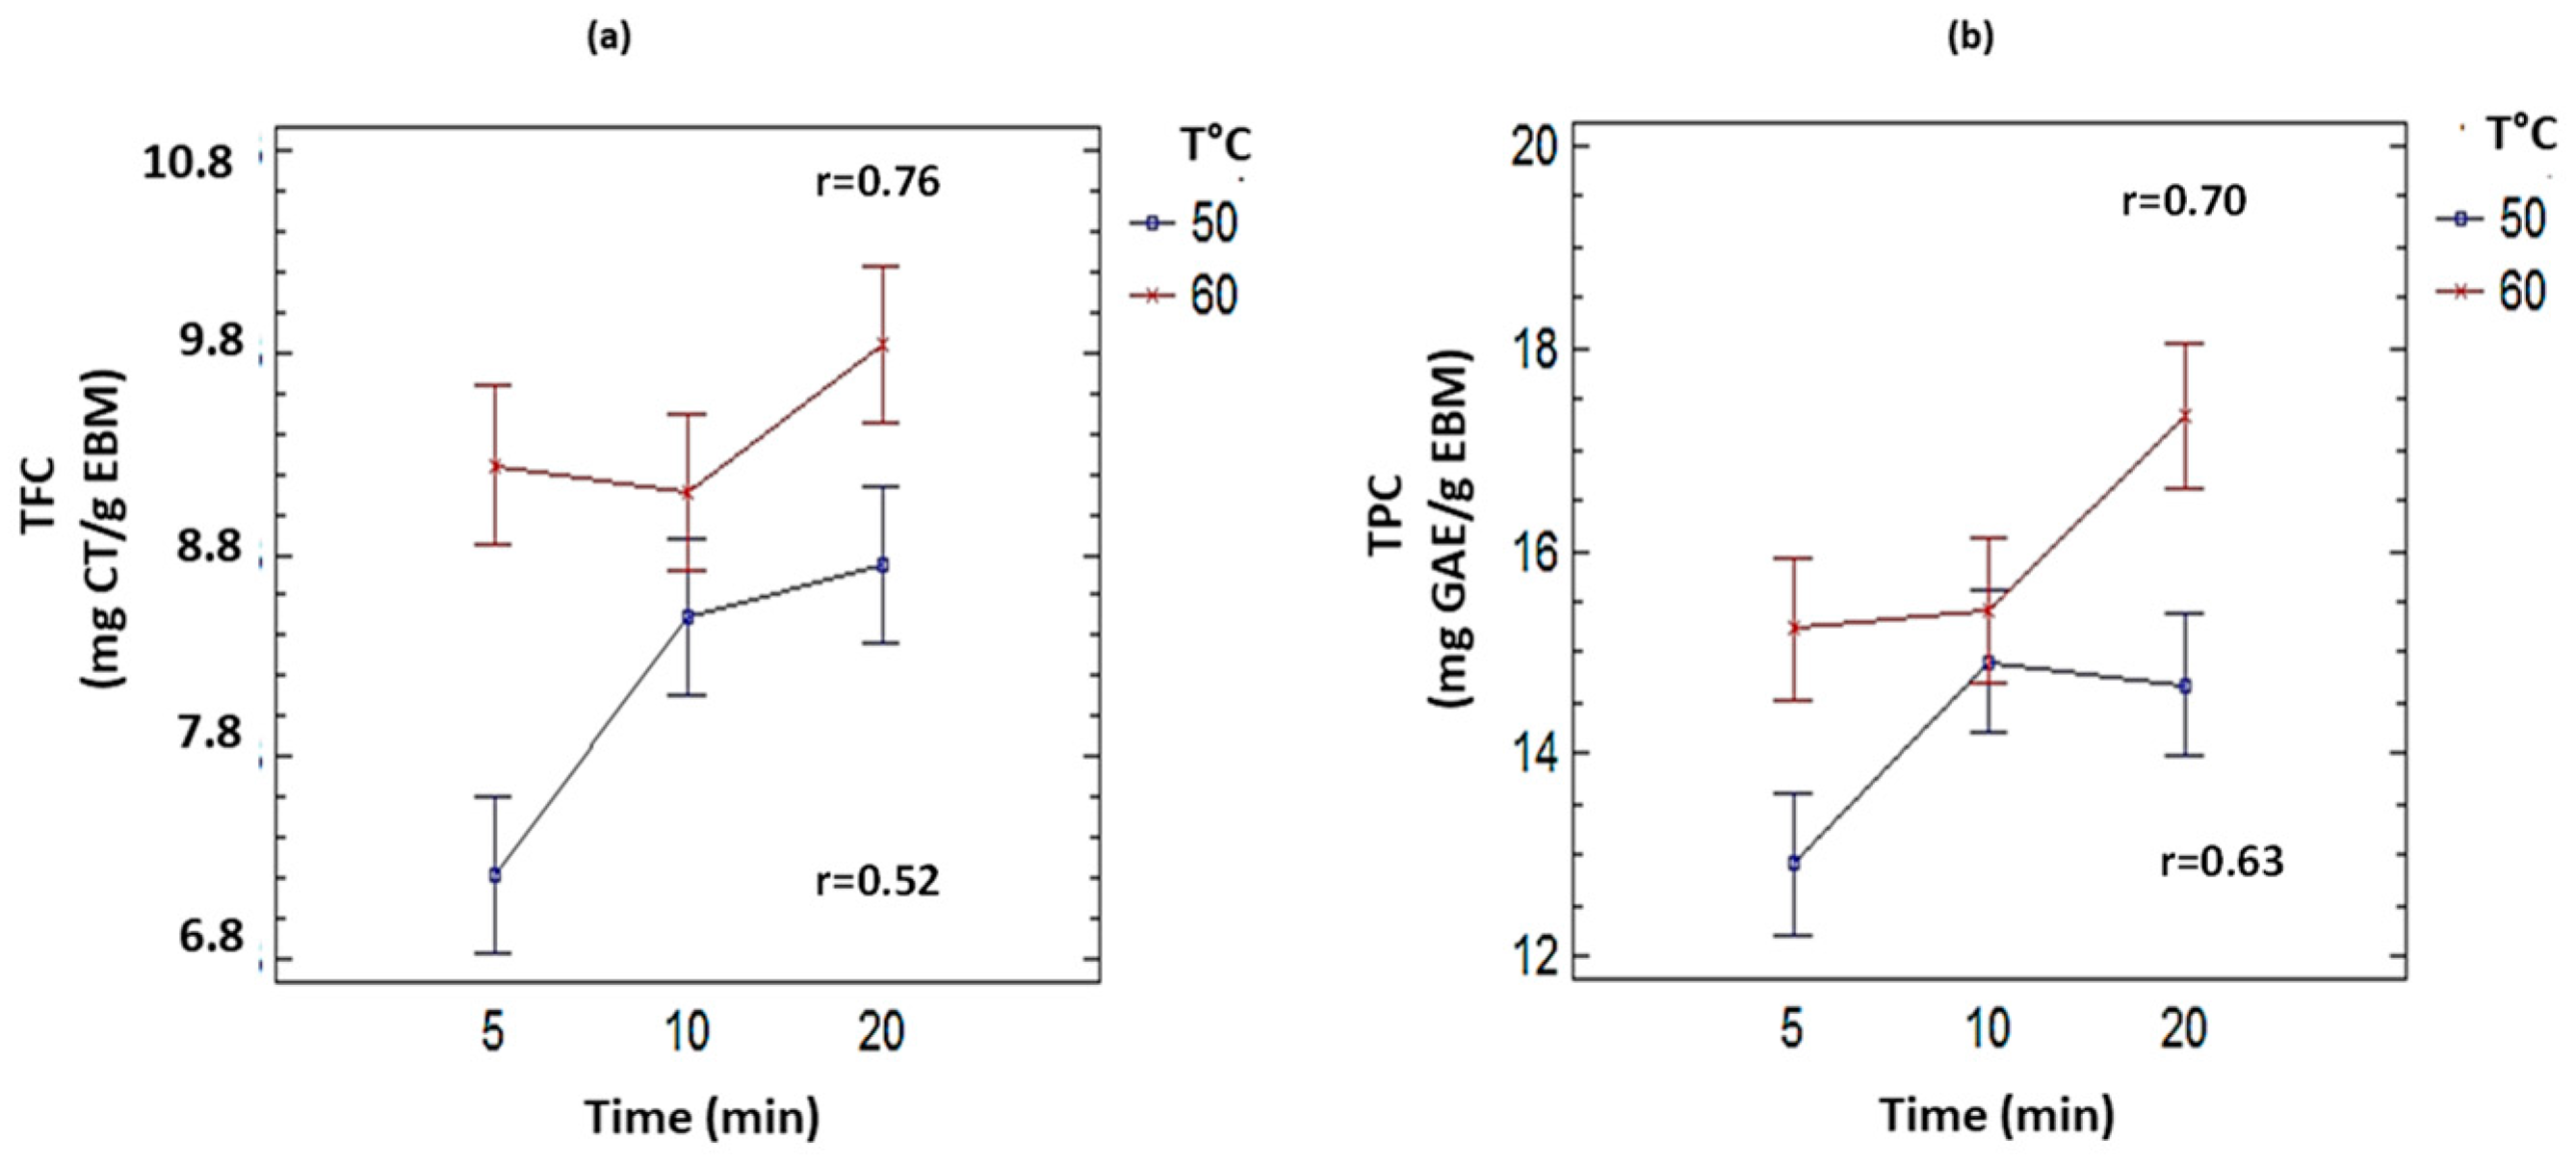
3.3. Effect of Time of Sonication in the Extraction Process of TPC and TFC
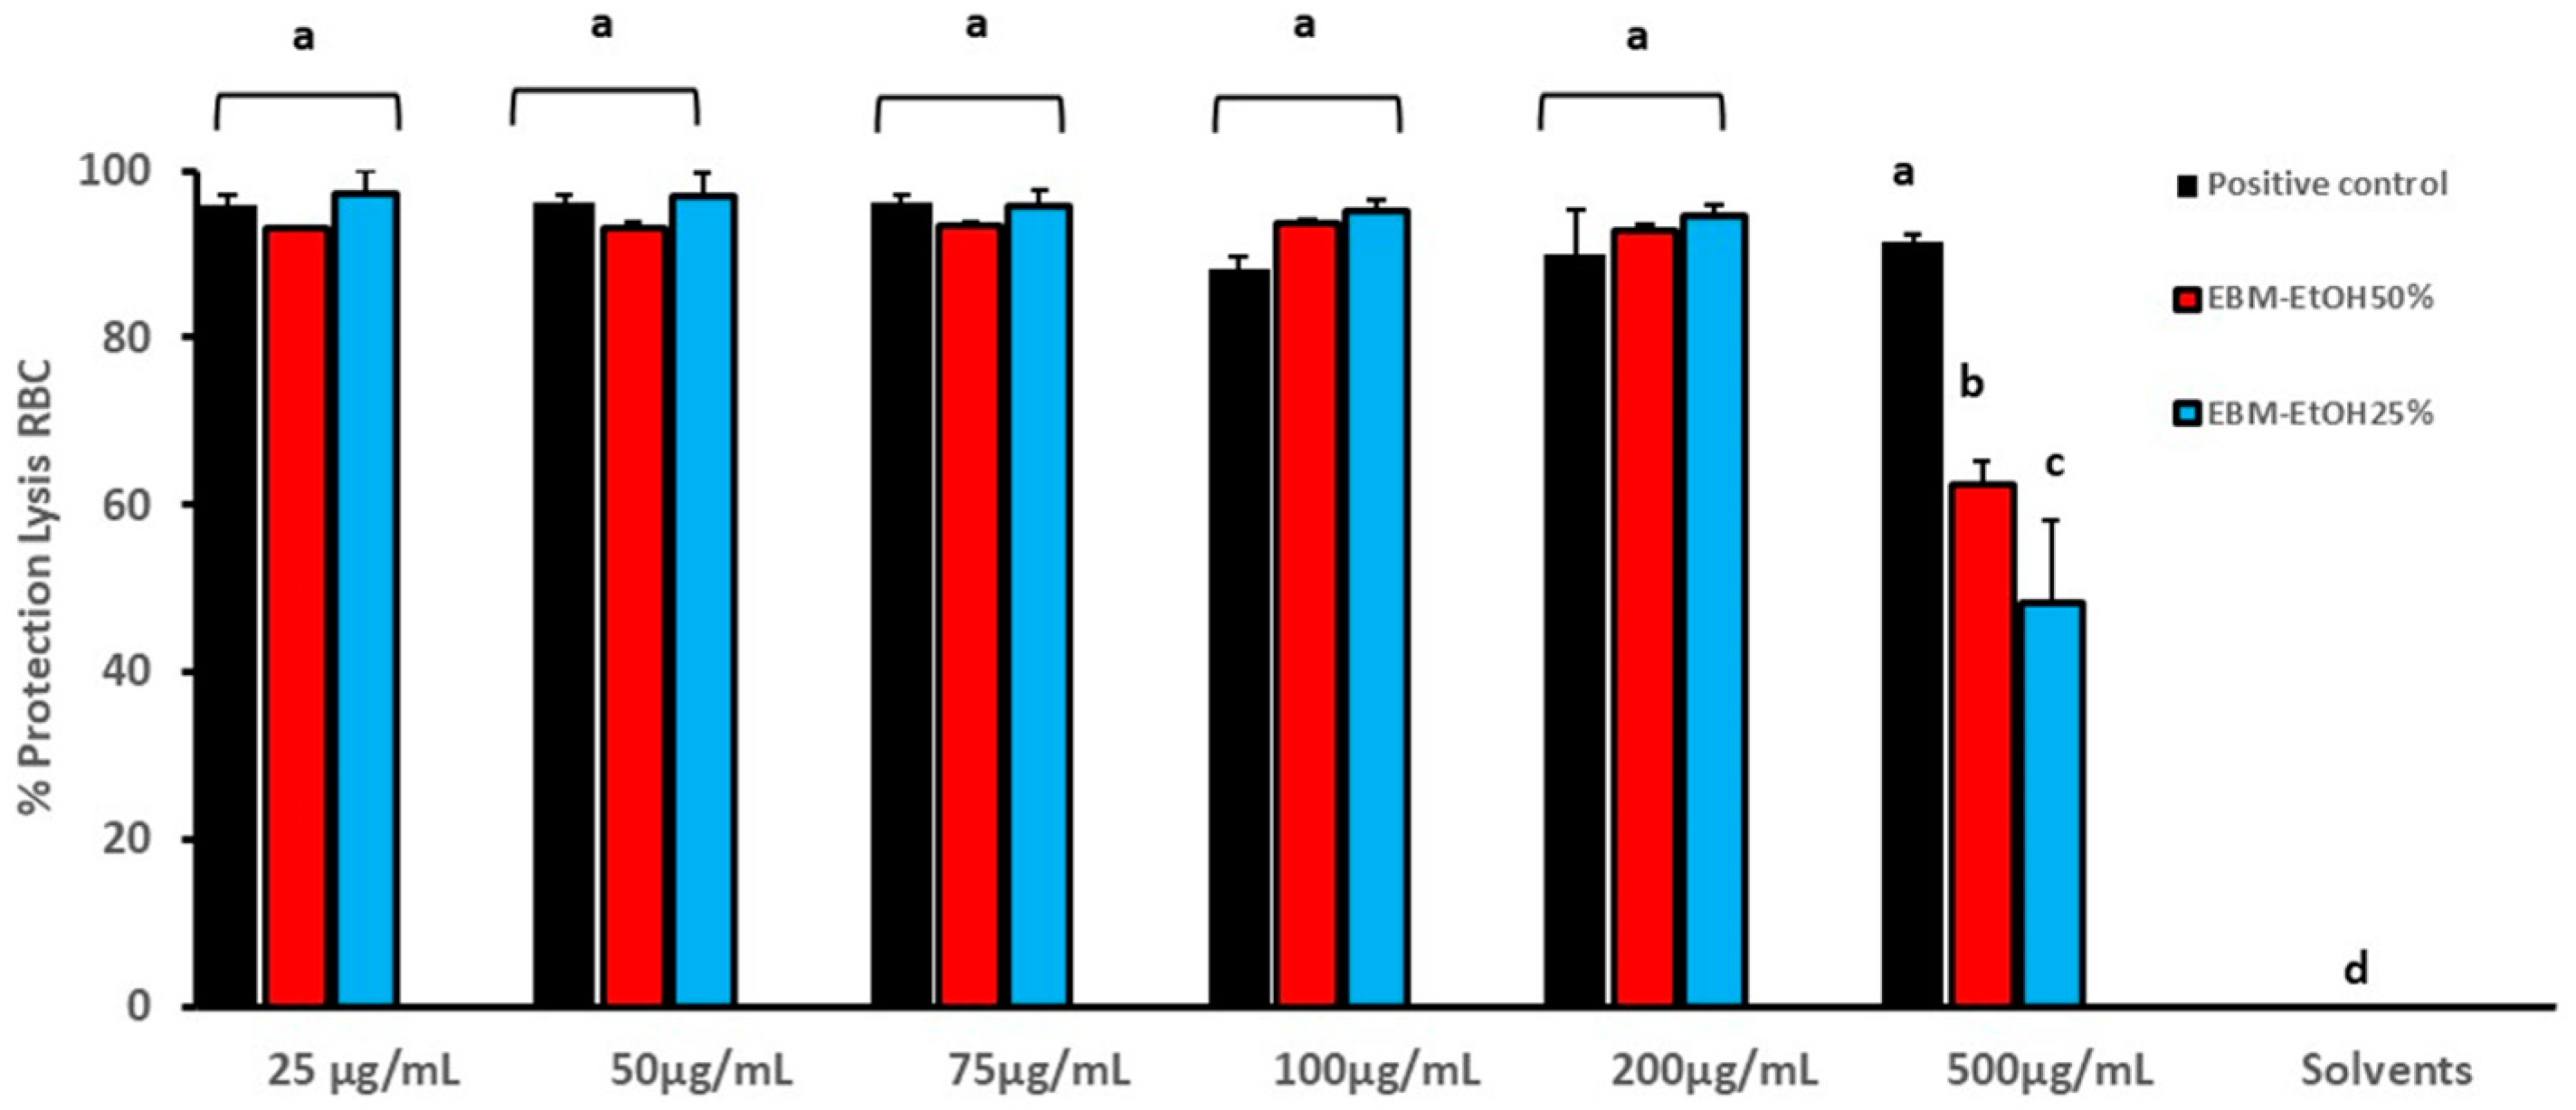
3.4. Anti-Inflammatory Activity of EBM
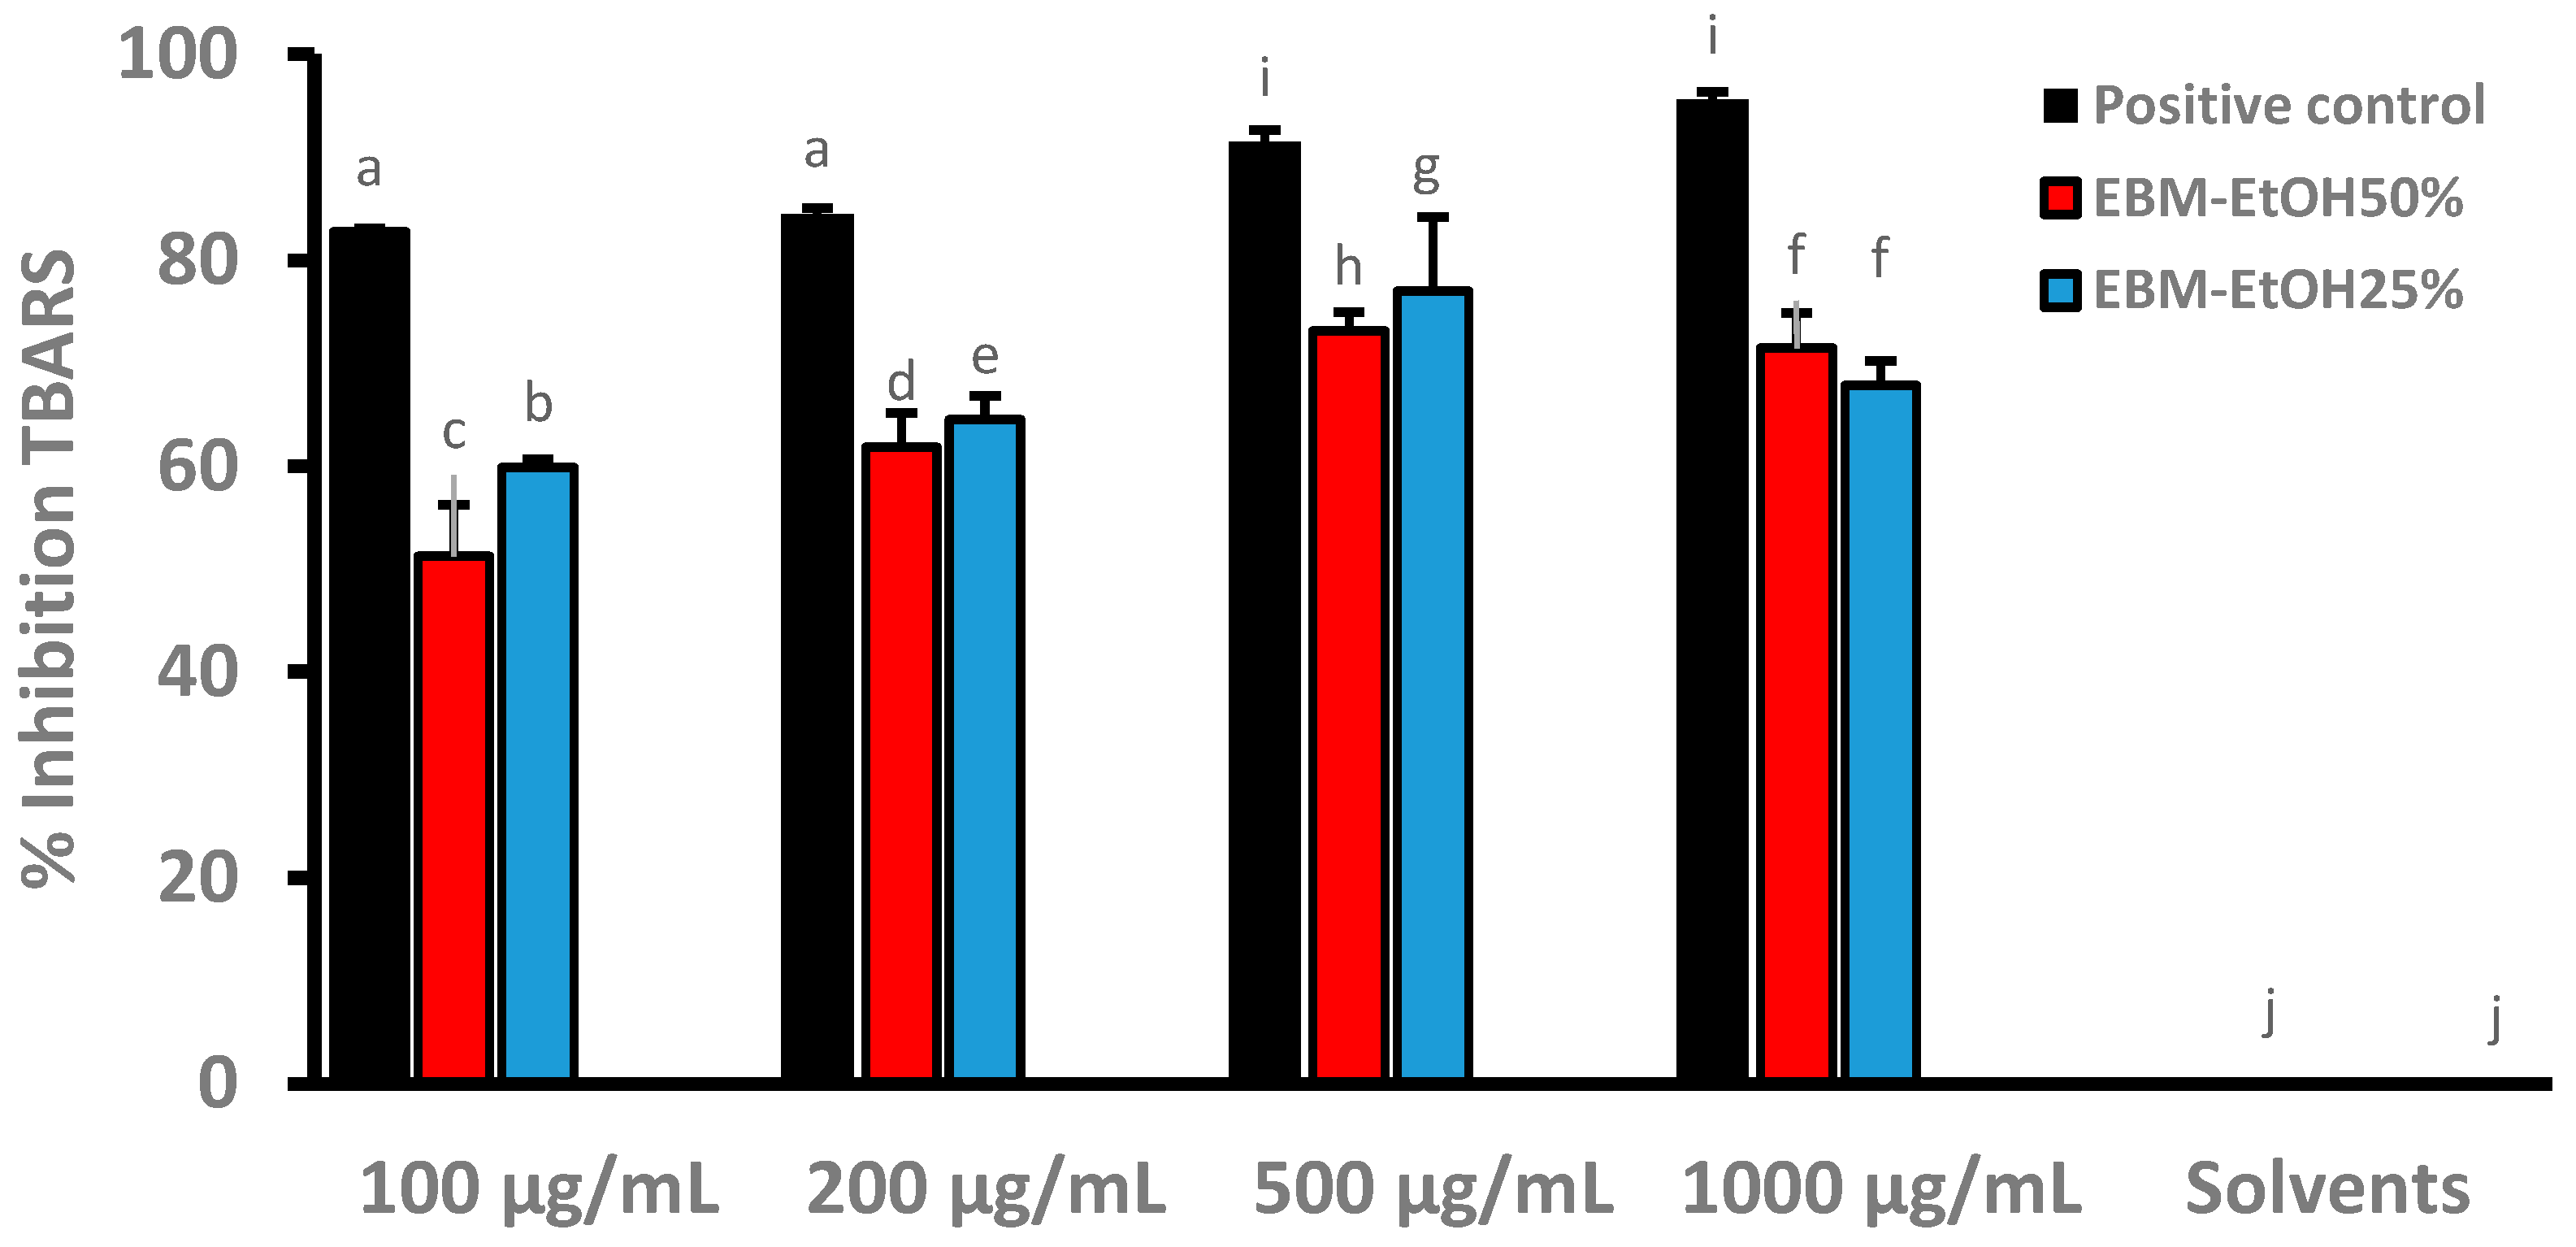
3.5. Inhibition of Lipid Peroxidation of EBM
3.6. Antioxidant Activity of EBM
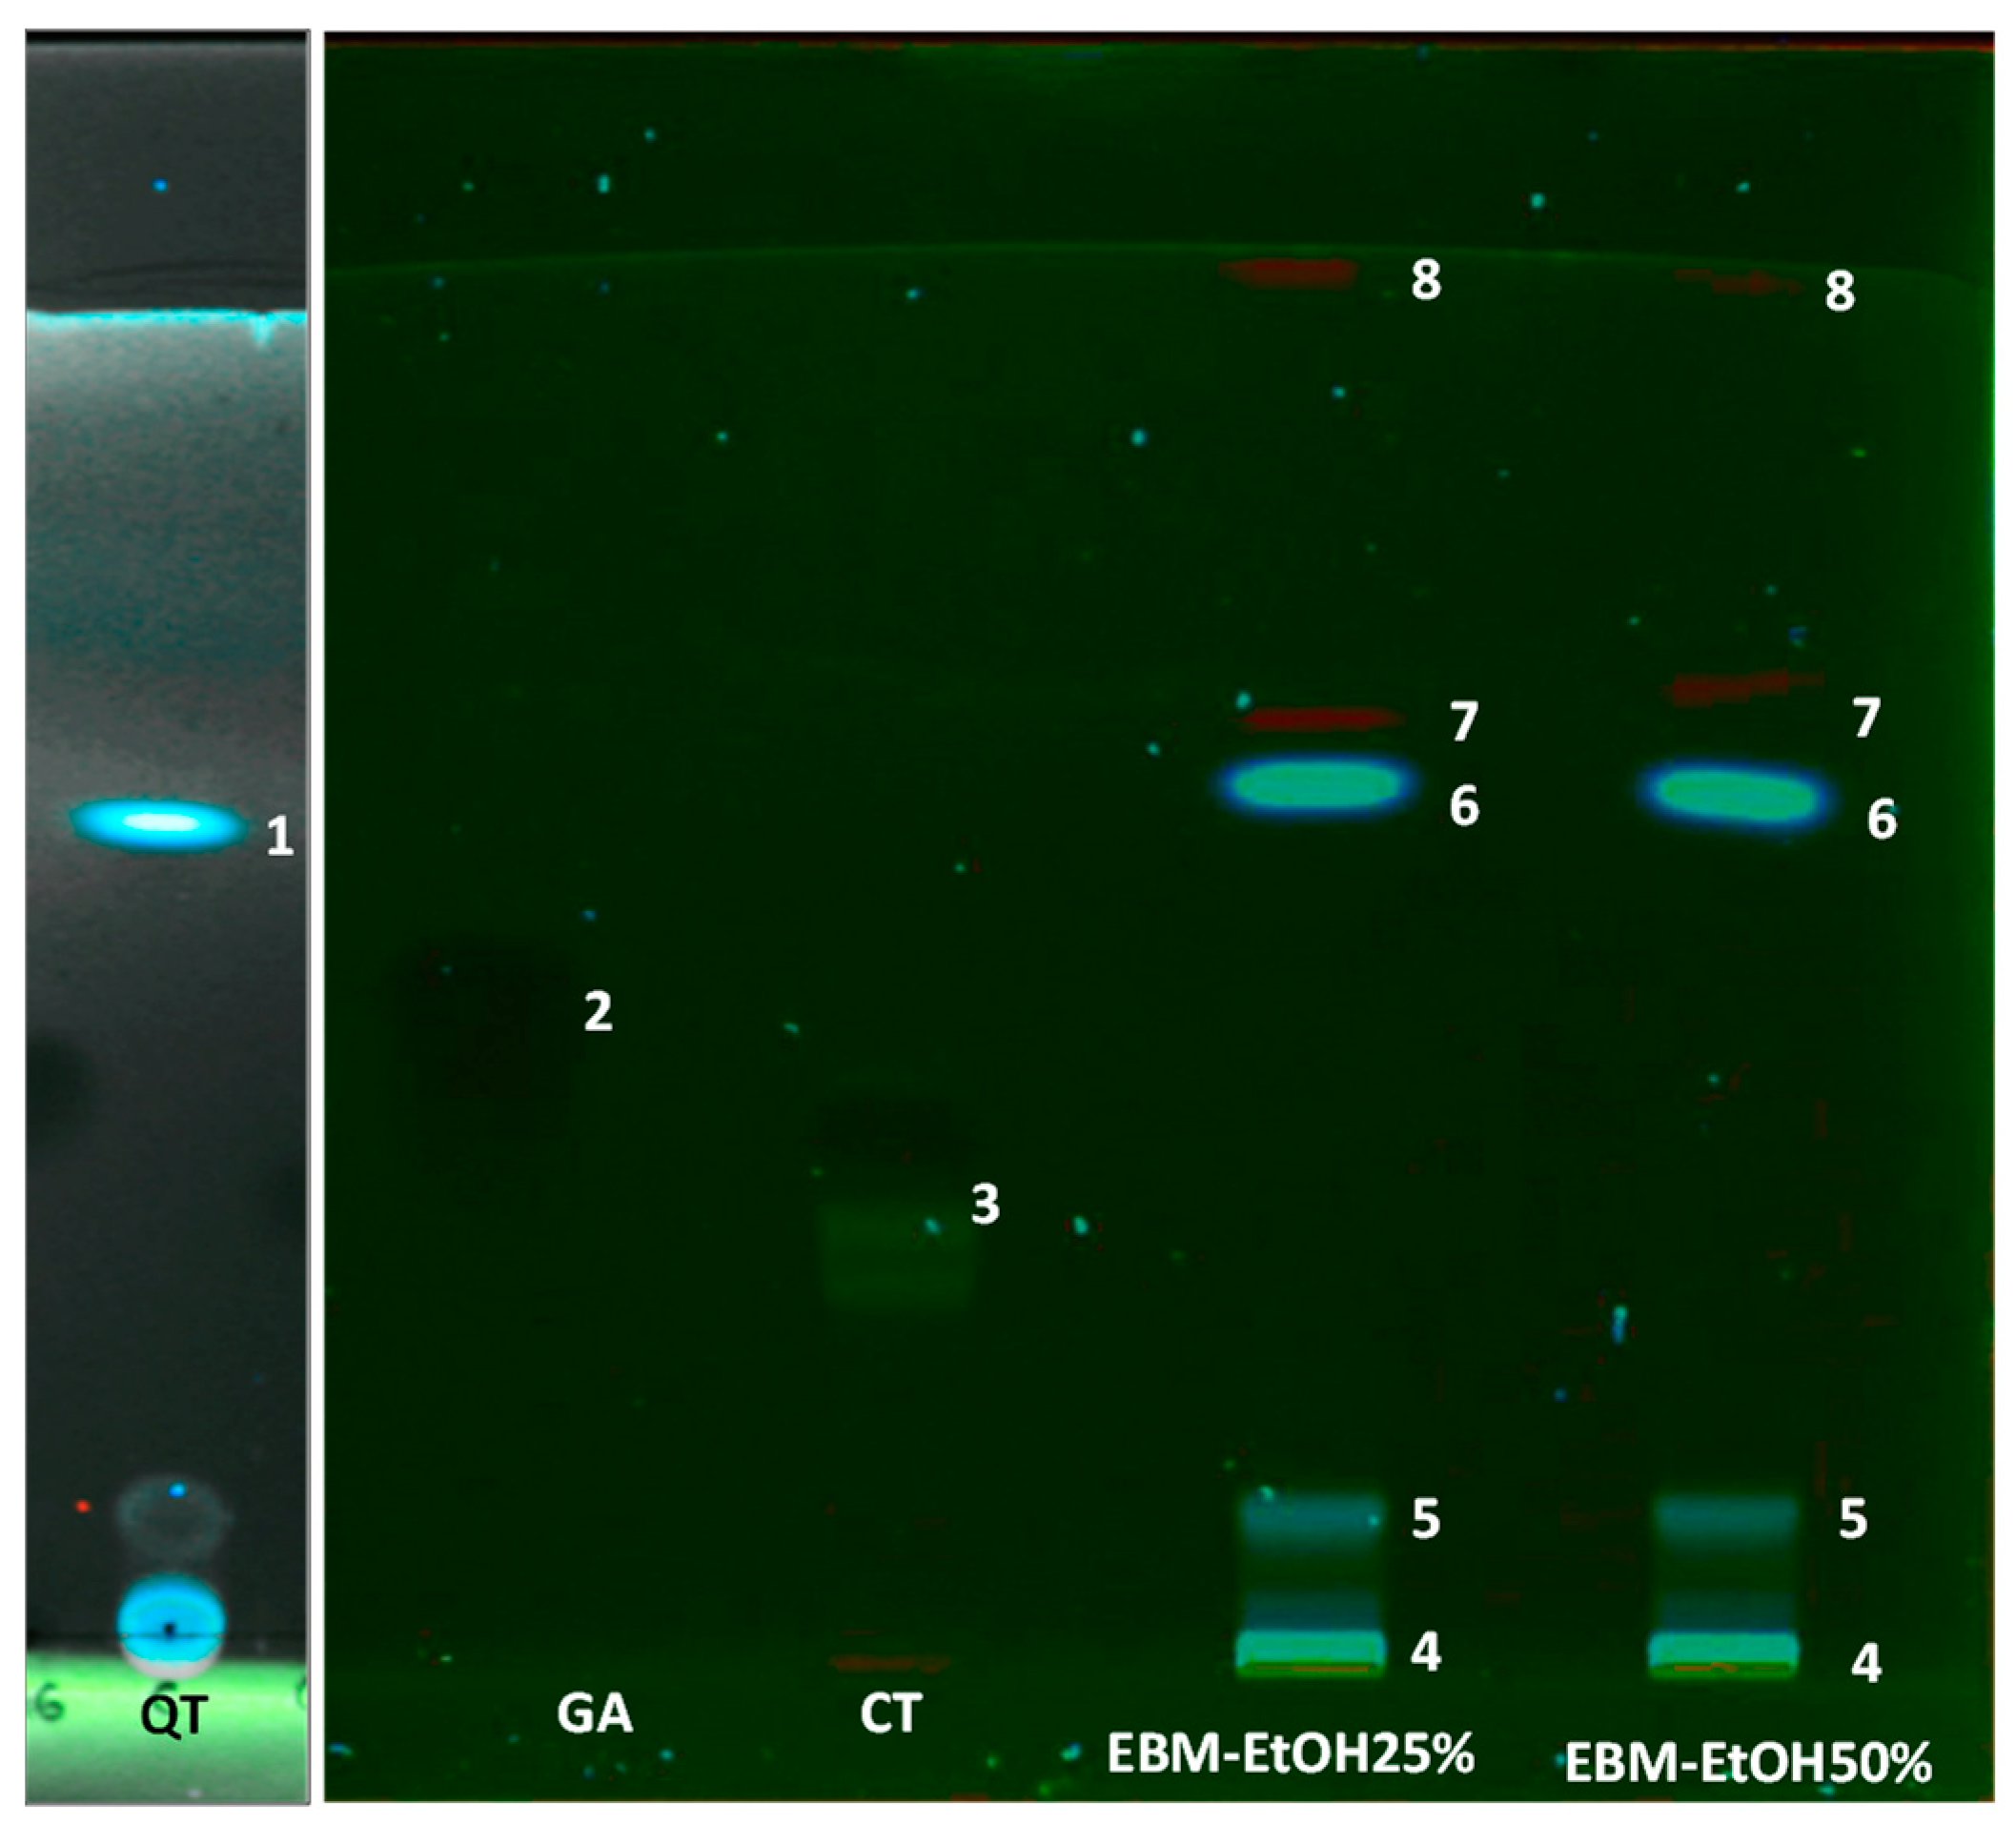
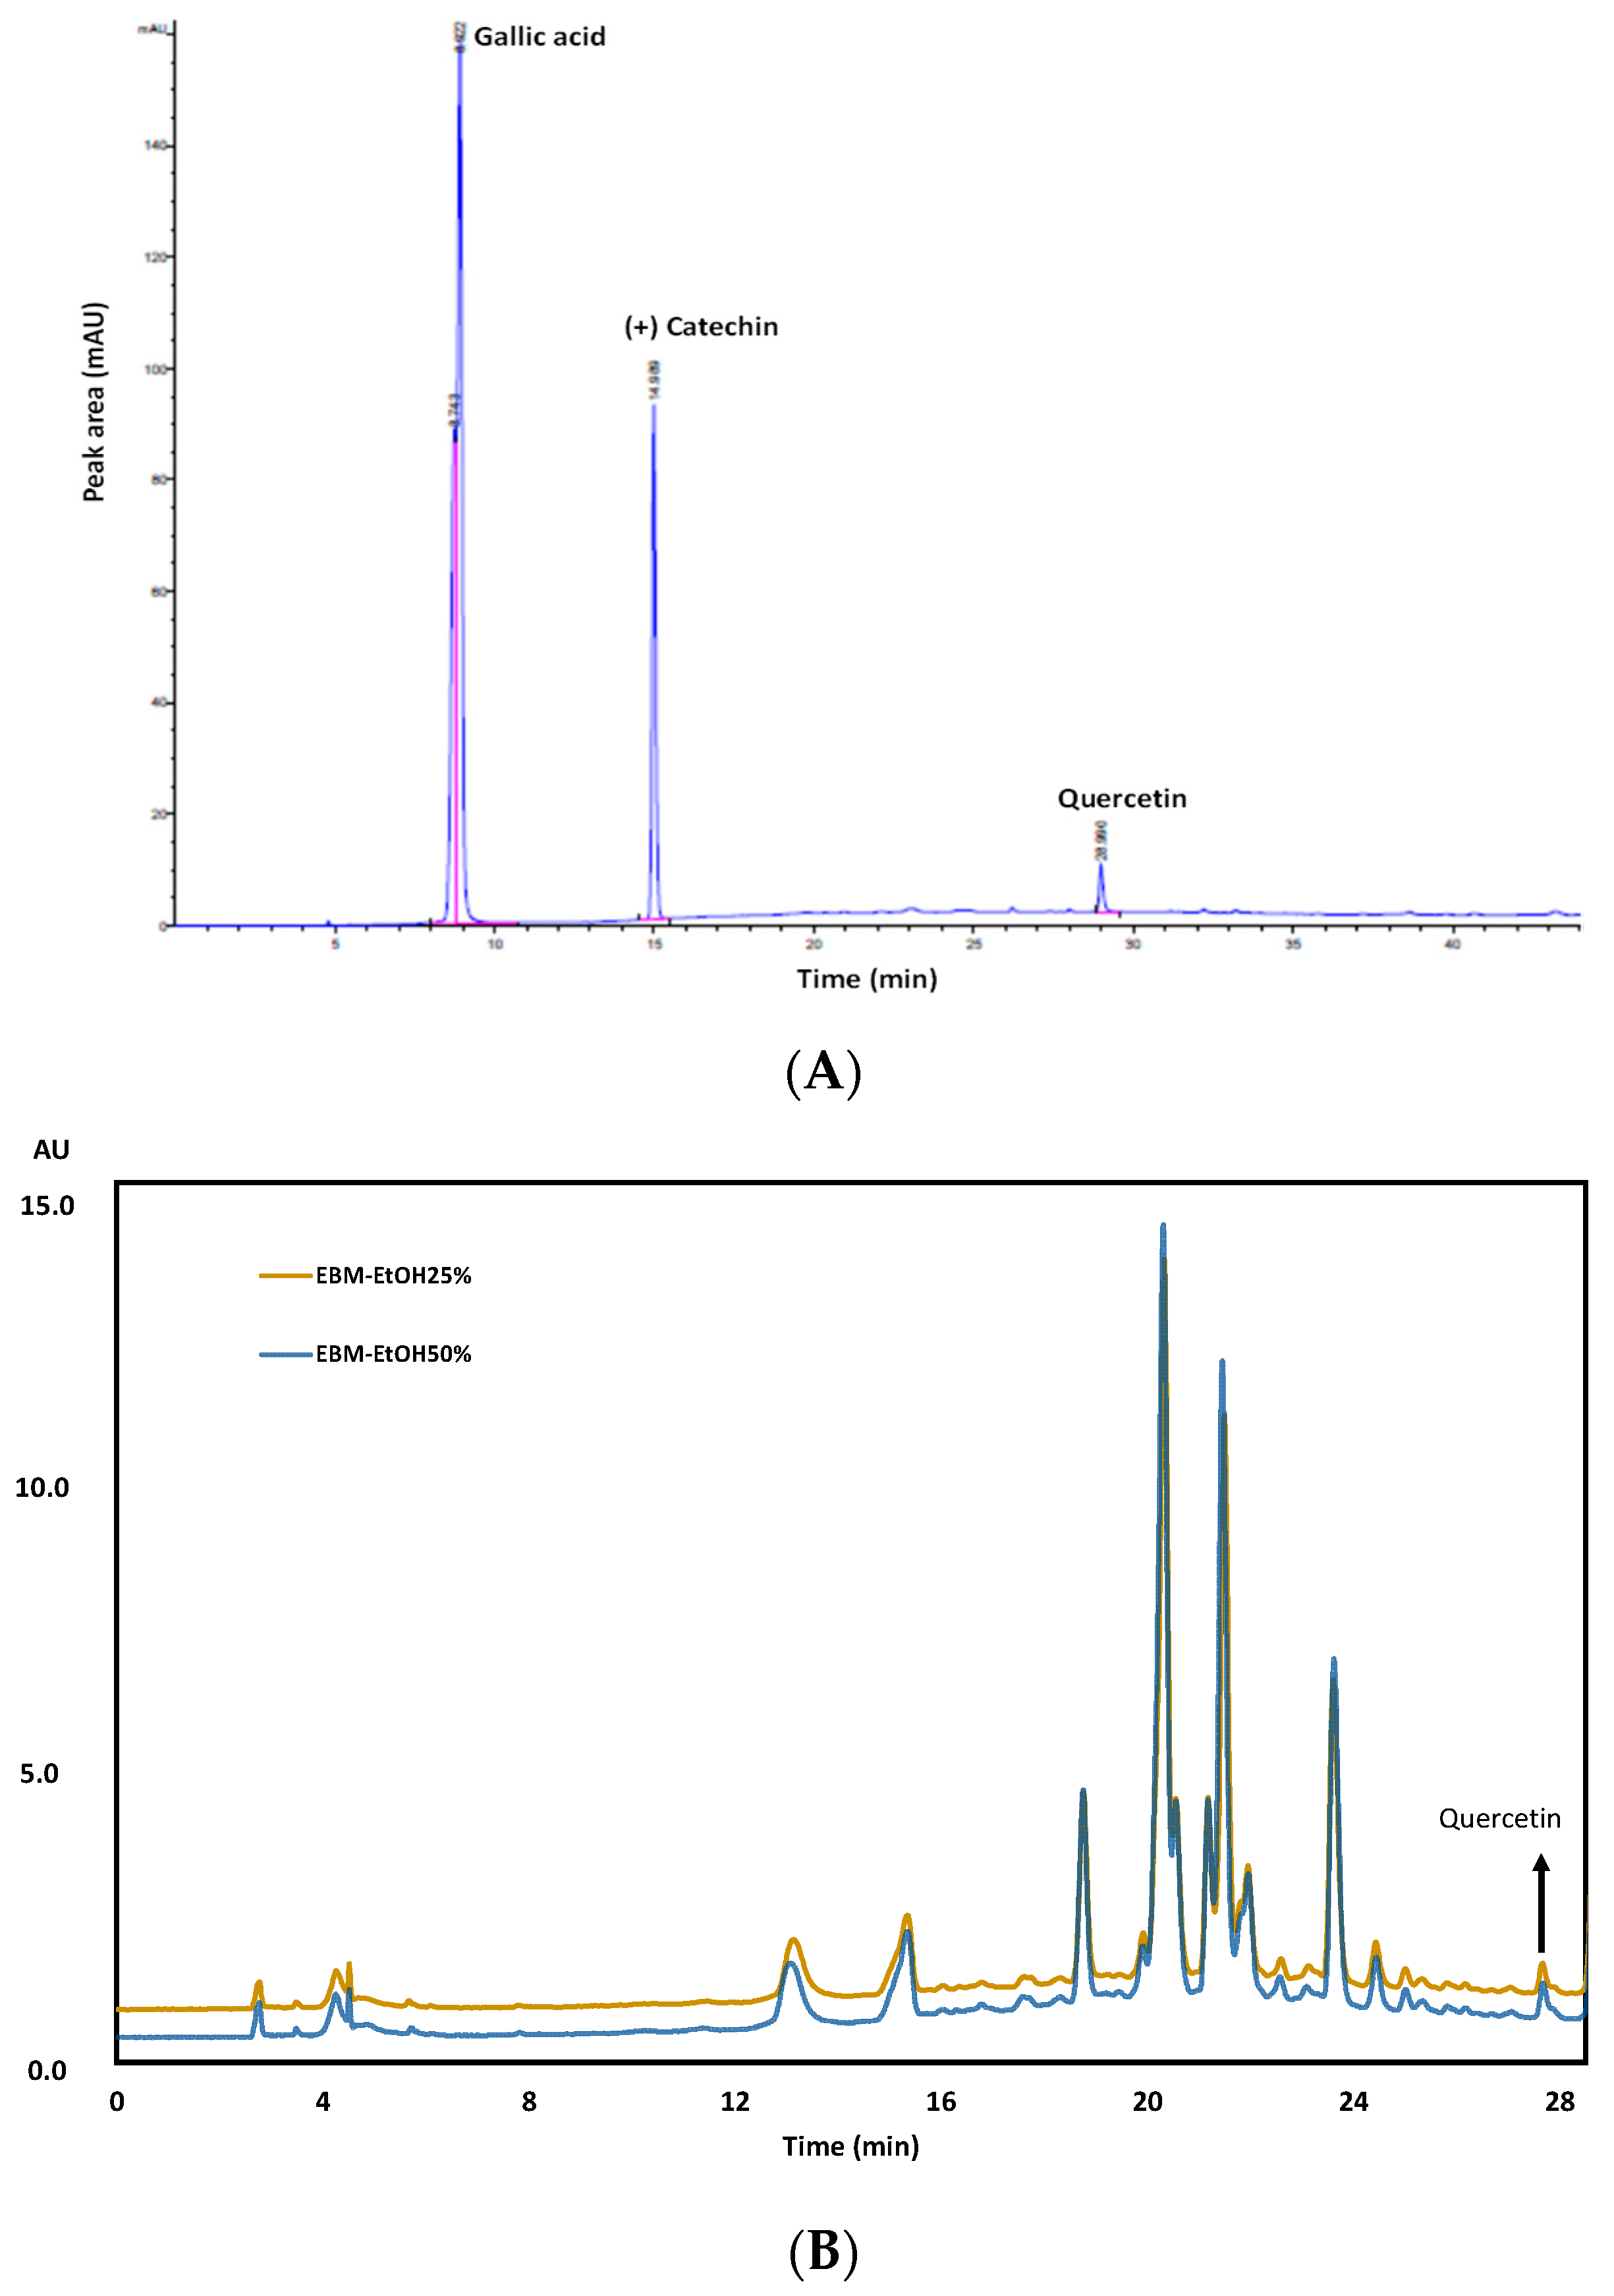
3.7. Characterization of EBM by TLC and UHPLC Analysis
3.8. Quantification of Mineral and Heavy Metals Content in B. macrantha Leaves
4. Conclusions
Author Contributions
Funding
Institutional Review Board Statement
Informed Consent Statement
Data Availability Statement
Acknowledgments
Conflicts of Interest
References
- Biswas, P.; Anand, U.; Saha, S.C.; Kant, N.; Mishra, T.; Masih, H.; Bar, A.; Pandey, D.K.; Jha, N.K.; Majumder, M.; et al. Betelvine (Piper betle L.): A comprehensive insight into its ethnopharmacology, phytochemistry, and pharmacological, biomedical and therapeutic attributes. J. Cell. Mol. Med. 2022, 26, 3083–3119. [Google Scholar] [CrossRef] [PubMed]
- Anand, U.; Jacobo-Herrera, N.; Altemimi, A.; Lakhssassi, N. A comprehensive review on medicinal plants as antimicrobial therapeutics: Potential avenues of biocompatible drug discovery. Metabolites 2019, 9, 258. [Google Scholar] [CrossRef] [PubMed]
- Anand, U.; Nandy, S.; Mundhra, A.; Das, N.; Pandey, D.K.; Dey, A. A review on antimicrobial botanicals, phytochemicals and natural resistance modifying agents from Apocynaceae family: Possible therapeutic approaches against multidrug resistance in pathogenic microorganisms. Drug Resist. Updat. 2020, 51, 100695. [Google Scholar] [CrossRef]
- Przeor, M. Some common medicinal plants with antidiabetic activity, known and available in Europe (A Mini-Review). Pharmaceuticals 2022, 15, 65. [Google Scholar] [CrossRef]
- Otari, S.S.; Patel, S.B.; Lekhak, M.M.; Ghane, S.G. Phytochemical studies on two unexplored endemic medicinal plants of India, Barleria terminalis and Calacanthus grandiflorus. Front. Pharmacol. 2022, 12, 817885. [Google Scholar] [CrossRef]
- Pérez-Escobar, O.P.; Chomicki, G.; Condamine, F.L.; Karremans, A.; Bogarín, D.; Matzke, N.J.; Silvestro, D.; Antonelli, A. Recent origin and rapid speciation of neotropical orchids in the world’s richest plant biodiversity hotspot. New Phytol. 2017, 215, 891–905. [Google Scholar] [CrossRef] [PubMed]
- Ulloa-Ulloa, C.; Acevedo-Rodríguez, P.; Beck, S.; Belgrano, M.J.; Bernal, R.; Berry, P.E.; Brako, L.; Celis, M.; Davidse, G.; Forzza, R.C.; et al. An integrated assessment of the vascular plant species of the Americas. Science 2017, 358, 1614–1617. [Google Scholar] [CrossRef] [PubMed]
- Heiden, G. Nomenclatural novelties in Baccharis subgen. Molina (Asteraceae, Astereae). Phytotaxa 2019, 423, 046–048. [Google Scholar] [CrossRef]
- Heiden, G. Baccharis: Diversity and Distribution. In Baccharis; Fernandes, G.W., Oki, Y., Barbosa, M., Eds.; Springer: Cham, Switzerland, 2021; pp. 23–80. [Google Scholar]
- Heiden, G.; Pirani, J.R. Novelties towards a phylogenetic infrageneric classification of Baccharis (Asteraceae, Astereae). Phytotaxa 2016, 289, 285–290. [Google Scholar] [CrossRef]
- Müller, J. The Alate Species of Baccharis (Compositae-Astereae) of the North Andes. Syst. Bot. 2014, 39, 980–987. [Google Scholar] [CrossRef]
- Corrêa, E.J.A.; Alves, S.N.; Coimbra, M.C.; de Lima, L.H.F. The potential of the genus Baccharis spp. as an insecticide for mosquitoes and non-biting flies of veterinary importance. In New and Future Developments in Microbial Biotechnology and Bioengineering; Singh, H.B., Vaishnav, A., Eds.; Elsevier: Amsterdam, The Netherlands, 2022; pp. 111–129. [Google Scholar]
- Valtierra, M.V.; Marchesi, E.; Heiden, G.; Bonifacino, J.M. Baccharis rectialata (Compositae: Astereae): A new species of carqueja from Uruguay. Phytotaxa 2021, 478, 253–260. [Google Scholar] [CrossRef]
- Valarezo, E.; Rosillo, M.; Cartuche, L.; Malagón, O.; Meneses, M.; Morocho, V. Chemical composition, antifungal and antibacterial activity of the essential oil from Baccharis latifolia (Ruiz & Pav.) Pers. (Asteraceae) from Loja, Ecuador. J. Essent. Oil Res. 2013, 25, 233–238. [Google Scholar]
- Müller, J. A new subspecies of Baccharis L. (Compositae-Astereae) with winged stems from Argentina. Haussknechtia 2006, 11, 143–147. [Google Scholar]
- Abad, M.J.; Bessa, A.L.; Ballarin, B.; Aragón, O.; Gonzales, E.; Bermejo, P. Anti-inflammatory activity of four Bolivian Baccharis species (Compositae). J. Ethnopharmacol. 2006, 103, 338–344. [Google Scholar] [CrossRef] [PubMed]
- Kurdelas, R.R.; López, S.; Lima, B.; Feresin, G.E.; Zygadlo, J.; Zacchino, S.; López, M.L.; Tapia, A.; Freile, M.L. Chemical composition, anti-insect and antimicrobial activity of Baccharis darwinii essential oil from Argentina, Patagonia. Ind. Crops Prod. 2012, 40, 261–267. [Google Scholar] [CrossRef]
- Tene, V.; Malagón, O.; Finzi, P.V.; Vidari, G.; Armijos, C.; Zaragoza, T. An ethnobotanical survey of medicinal plants used in Loja and Zamora-Chinchipe, Ecuador. J. Ethnopharmacol. 2007, 111, 63–81. [Google Scholar] [CrossRef]
- Abad, M.; Bermejo, P. Baccharis (Compositae): A review update. Arkivoc 2007, 7, 76–96. [Google Scholar] [CrossRef]
- Fullas, F.; Hussain, R.A.; Chai, H.B.; Pezzuto, J.M.; Soejarto, D.D.; Kinghorn, A.D. Cytotoxic constituents of Baccharis gaudichaudiana. J. Nat. Prod. 1994, 57, 801–807. [Google Scholar] [CrossRef]
- Moreira, F.P.M.; Voutinho, V.; Montanher, A.B.P.; Caro, M.S.B.; Brighente, I.M.C.; Pizzolatti, M.G.; Delle-Monache, F. Flavonóides e triterpenos de Baccharis pseudotenuifolia–Bioatividade sobre Artemia Salina. Quim. Nova 2003, 26, 309–311. [Google Scholar] [CrossRef]
- Silva-Filho, A.A.; Resende, D.O.; Fukui, M.J.; Santos, F.F.; Pauletti, P.M.; Cunha, W.R.; Silva, M.L.; Gregório, L.E.; Bastos, J.K.; Nanayakkara, N.P. In Vitro antileishmanial, antiplasmodial and cytotoxic activities of phenolics and triterpenoids from Baccharis dracunculifolia D. C. (Asteraceae). Fitoterapia 2009, 80, 478–482. [Google Scholar] [CrossRef]
- Campos, F.R.; Bressan, J.; Jasinski, V.C.G.; Zuccolotto, T.; Silva, L.E.; Cerqueira, L.B. Baccharis (Asteraceae): Chemical constituents and biological activities. Chem. Biodivers. 2016, 13, 1–17. [Google Scholar] [CrossRef] [PubMed]
- Gené, R.M.; Marín, E.; Adzet, T. Anti-inflammatory activity of aqueous extracts of three species of the genus Baccharis. Planta Med. 1992, 58, 565–566. [Google Scholar] [CrossRef] [PubMed]
- Gené, R.M.; Marín, E.; Adzet, T. Anti-inflammatory and analgesic activity of Baccharis trimera: Identification of the active constituents. Planta Med. 1996, 62, 232–235. [Google Scholar] [CrossRef] [PubMed]
- Pérez-García, F.; Marín, E.; Adzet, T.; Cañigueral, S. Activity of plant extracts on the respiratory burst and the stress protein synthesis. Phytomedicine 2001, 8, 31–38. [Google Scholar] [CrossRef] [PubMed]
- De Oliveira, S.Q.; Dal-Pizzol, F.; Gosmann, G.; Guillaume, D.; Moreira, J.C.F.; Schenkel, E.P. Antioxidant activity of Baccharis articulata extracts: Isolation of a new compound with antioxidant activity. Free Rad. Res. 2003, 37, 555–559. [Google Scholar] [CrossRef]
- De Oliveira, S.Q.; Dal-Pizzol, F.; Moreira, J.C.; Schenkel, E.P.; Gosmann, G. Antioxidant activity of Baccharis spicata, Baccharis trimera and Baccharis usterii. Acta Farm. Bonaer. 2004, 23, 365–368. [Google Scholar]
- Jørgensen, P.M.; León-Yánez, S. (Eds.) Catalogue of the Vascular Plants of Ecuador; Missouri Botanical Garden: St. Louis, MO, USA, 1999; Volume 75, pp. 1–1182. [Google Scholar]
- Tungmunnithum, D.; Thongboonyou, A.; Pholboon, A.; Yangsabai, A. Flavonoids and other phenolic compounds from medicinal plants for pharmaceutical and medical aspects: An overview. Medicines 2018, 5, 93. [Google Scholar] [CrossRef]
- Rahman, M.M.; Rahaman, M.S.; Islam, M.R.; Rahman, F.; Mithi, F.M.; Alqahtani, T.; Uddin, M.S. Role of phenolic compounds in human disease: Current knowledge and future prospects. Molecules 2021, 27, 233. [Google Scholar] [CrossRef]
- Li, A.N.; Li, S.; Zhang, Y.J.; Xu, X.R.; Chen, Y.M.; Li, H.B. Resources and biological activities of natural polyphenols. Nutrients 2014, 6, 6020–6047. [Google Scholar] [CrossRef]
- Aguilera, Y.; Benítez, V. Phytochemicals: Dietary sources, innovative extraction, and health benefits. Foods 2021, 11, 72. [Google Scholar] [CrossRef]
- Stagos, D. Antioxidant activity of polyphenolic plant extracts. Antioxidants 2019, 9, 19. [Google Scholar] [CrossRef] [PubMed]
- Tsao, R. Chemistry and biochemistry of dietary polyphenols. Nutrients 2010, 2, 1231–1246. [Google Scholar] [CrossRef] [PubMed]
- Anand, U.; Tudu, C.K.; Nandy, S.; Sunita, K.; Tripathi, V.; Loake, G.J.; Proćków, J. Ethnodermatological use of medicinal plants in India: From ayurvedic formulations to clinical perspectives–A review. J. Ethnopharmacol. 2022, 284, 114744. [Google Scholar] [CrossRef] [PubMed]
- Vasco, C.; Rúales, J.; Kamal-Eldin, A. Total phenolic compounds and antioxidant capacities of major fruits from Ecuador. Food Chem. 2008, 111, 816–823. [Google Scholar] [CrossRef]
- Sakanaka, S.; Tachibana, Y.; Okada, Y. Preparation and antioxidant properties of extracts of Japanese persimmon leaf tea (kakinoha-cha). Food Chem. 2005, 89, 569–575. [Google Scholar] [CrossRef]
- Khatoon, S.; Singh, N.; Srivastava, N.; Rawat, A.K.S.; Mehrotra, S. Chemical evaluation of seven Terminalia species and quantification of important polyphenols by TLC. J. Planar Chromatogr. 2008, 21, 167–171. [Google Scholar] [CrossRef]
- Mena, P.; García-Viguera, C.; Navarro-Rico, J.; Moreno, D.A.; Bartual, J.; Saura, D.; Martí, N. Phytochemical characterization for industrial use of pomegranate (Punica granatum L.) cultivars grown in Spain. J. Sci. Food Agric. 2011, 91, 1893–1906. [Google Scholar] [CrossRef]
- Carrillo, W.; Gómez-Ruiz, J.A.; Miralles, B.; Ramos, M.; Barrio, D.; Recio, I. Identification of antioxidant peptides of hen egg-white lysozyme and evaluation of inhibition of lipid peroxidation and cytotoxicity in the Zebrafish model. Eur. Food Res. Technol. 2016, 242, 1777–1785. [Google Scholar] [CrossRef]
- Kota, K.; Sharma, S.; Tahashildar, J. A scientific validation of In vitro anti-inflammatory activity of Punica granatum L. by human red blood cell membrane stabilization. Int. J. Res. Med. Sci. 2018, 6, 2430–2433. [Google Scholar] [CrossRef]
- Samaniego, I.; Brito, B.; Viera, W.; Cabrera, A.; Llerena, W.; Kannangara, T.; Vilcacundo, R.; Angós, I.; Carrillo, W. Influence of the maturity stage on the phytochemical composition and the antioxidant activity of four Andean blackberry cultivars (Rubus glaucus Benth) from Ecuador. Plants 2020, 9, 1027. [Google Scholar] [CrossRef]
- Boeri, P.; Piñuel, L.; Dalzotto, D.; Monasterio, R.; Fontana, A.; Sharry, S.; Carrillo, W. Argentine Patagonia barberry chemical composition and evaluation of its antioxidant capacity. J. Food Biochem. 2020, 44, e13254. [Google Scholar] [CrossRef] [PubMed]
- Soto, E.; Bustos, L.; Simirgiotis, M.J.; Parra, C. Potential of Baccharis alnifolia Meyen & Walpan (Chilka) from northern Chile used as a medicinal infusion. Ciência Rural 2019, 49, e20190428. [Google Scholar] [CrossRef]
- Brighente, I.M.C.; Dias, M.; Verdi, L.G.; Pizzolatti, M.G. Antioxidant activity and total phenolic content of some Brazilian species. Pharm. Biol. 2007, 45, 156–161. [Google Scholar] [CrossRef]
- Cavalaro, R.I.; Fabricio, L.F.D.F.; Vieira, T.M.F.D.S. Ultrasound-Assisted Extraction of Antioxidants from Baccharis dracunculifolia and Green Propolis. Processes 2020, 8, 1530. [Google Scholar] [CrossRef]
- Gómez, J.; Simirgiotis, M.J.; Lima, B.; Paredes, J.D.; Gabutti, C.M.V.; Gamarra-Luques, C.; Bórquez, J.; Luna, L.; Wendel, G.H.; Maria, A.O.; et al. Antioxidant, gastroprotective, cytotoxic activities and UHPLC PDA-Q orbitrap mass spectrometry identification of metabolites in Baccharis grisebachii decoction. Molecules 2019, 24, 1085. [Google Scholar] [CrossRef]
- Sabir, S.M.; Athayde, M.L.; Boligon, A.A.; Rocha, J.B.T. Antioxidant activities and phenolic profile of Baccharis trimera, a commonly used medicinal plant from Brazil. S. Afr. J. Bot. 2017, 113, 318–323. [Google Scholar] [CrossRef]
- Agudelo, I.J.; Isolabella, S.A.; Filip, R.; Wagner, M.L.; Ricco, R.A. Baccharis spicata (Lam) Baill: Polyphenol screening, determination of their antioxidant activity and their main polyphenolic metabolites. J. Pharmacogn. Phytochem. 2016, 5, 278–285. [Google Scholar]
- Jerman, T.; Trebše, P.; Mozetič Vodopivec, B. Ultrasound-assisted solid liquid extraction (USLE) of olive fruit (Olea europaea) phenolic compounds. Food Chem. 2010, 123, 175–182. [Google Scholar] [CrossRef]
- Yue, T.; Shao, D.; Yuan, Y.; Wang, Z.; Qiang, C. Ultrasound-assisted extraction. HPLC analysis. and antioxidant activity of polyphenols from unripe apple. J. Sep. Sci. 2012, 35, 2138–2145. [Google Scholar] [CrossRef]
- De Oliveira, C.B.; Comunello, L.N.; Lunardelli, A.; Amaral, R.H.; Pires, M.G.; Da Silva, G.L.; Gosmann, G. Phenolic enriched extract of Baccharis trimera presents anti-inflammatory and antioxidant activities. Molecules 2012, 17, 1113–1123. [Google Scholar] [CrossRef]
- Nogueira, N.P.A.; Reis, P.A.; Laranja, G.A.T.; Pinto, A.C.; Aiub, C.A.F.; Felzenszwalb, I.; Coelho, M.G.P. In vitro and in vivo toxicological evaluation of extract and fractions from Baccharis trimera with anti-inflammatory activity. J. Ethnopharmacol. 2011, 138, 513–522. [Google Scholar] [CrossRef] [PubMed]
- Zalewski, C.A.; Passero, L.F.D.; Melo, A.S.; Corbett, C.E.P.; Laurenti, M.D.; Toyama, M.H.; Toyama, D.O.; Romoff, P.; Fávero, O.A.; Lago, J.H.G. Evaluation of anti-inflammatory activity of derivatives from aerial parts of Baccharis uncinella. Pharm. Biol. 2011, 49, 602–607. [Google Scholar] [CrossRef] [PubMed]
- De las Heras, B.; Slowing, K.; Benedí, J.; Carretero, E.; Ortega, T.; Toledo, C.; Bermejo, P.; Iglesias, I.; Abad, M.J.; Gómez-Serranillos, P.; et al. Anti-inflammatory and antioxidant activity of plants used in traditional medicine in Ecuador. J. Ethnopharmacol. 1998, 61, 161–166. [Google Scholar] [CrossRef]
- Tapia, A.; Rodriguez, J.; Theoduloz, C.; Lopez, S.; Feresin, G.E.; Schmeda-Hirschmann, G. Free radical scavengers and antioxidants from Baccharis grisebachii. J. Ethnopharmacol. 2004, 95, 155–161. [Google Scholar] [CrossRef] [PubMed]
- Guimarães, N.S.; Mello, J.C.; Paiva, J.S.; Bueno, P.C.; Berretta, A.A.; Torquato, R.J.; Nantes-Cardoso, I.; Rodrigues, T. Baccharis dracunculifolia, the main source of green propolis, exhibits potent antioxidant activity and prevents oxidative mitochondrial damage. Food Chem. Toxicol. 2012, 50, 1091–1097. [Google Scholar] [CrossRef]
- Parejo, I.; Viladomat, F.; Bastida, J.; Rosas-Romero, A.; Saavedra, G.; Murcia, M.A.; Jiménez, A.M.; Codina, C. Investigation of Bolivian plant extracts for their radical scavenging activity and antioxidant activity. Life Sci. 2003, 73, 1667–1681. [Google Scholar] [CrossRef]
- Yang, S.; Zhou, H.; Wang, G.; Zhong, X.H.; Shen, Q.L.; Zhang, X.J.; Li, R.-Y.; Chen, L.-H.; Zhang, Y.-H.; Wan, Z. Quercetin is protective against short-term dietary advanced glycation end products intake induced cognitive dysfunction in aged ICR mice. J. Food Biochem. 2020, 44, e13164. [Google Scholar] [CrossRef]
- Nakagawa, T.; Itoh, M.; Ohta, K.; Hayashi, Y.; Hayakawa, M.; Yamada, Y.; Akanabe, H.; Chikaishi, T.; Nakagawa, K.; Itoh, Y.; et al. Improvement of memory recall by quercetin in rodent contextual fear conditioning and human early-stage Alzheimer’s disease patients. Neuroreport 2016, 27, 671–676. [Google Scholar] [CrossRef]
- Oyedemi, S.O.; Nwaogu, G.; Chukwuma, C.I.; Adeyemi, O.T.; Matsabisa, M.G.; Swain, S.S.; Aiyegoro, O.A. Quercetin modulates hyperglycemia by improving the pancreatic antioxidant status and enzymes activities linked with glucose metabolism in type 2 diabetes model of rats: In silico studies of molecular interaction of quercetin with hexokinase and catalase. J. Food Biochem. 2020, 44, e13127. [Google Scholar] [CrossRef]
- Wollenweber, E.; Valant-Vetschera, K.M.; Fernandes, G.W. Chemodiversity of exudate flavonoids in Baccharis concinna and three further South-American Baccharis species. Nat. Prod. Commun. 2006, 1, 627–632. [Google Scholar] [CrossRef]
- Kirkham, M.B. Cadmium in plants on polluted soils: Effects of soil factors, hyperaccumulation, and amendments. Geoderma 2006, 137, 19–32. [Google Scholar] [CrossRef]
- Simões-Pires, C.A.; Queiroz, E.F.; Henriques, A.T.; Hostettmann, K. Isolation and on-line identification of antioxidant compounds from three Baccharis species by HPLC-UV-MS/MS with post column derivatisation. Phytochem. Anal. Int. J. Plant Chem. Biochem. Technol. 2005, 16, 307–314. [Google Scholar] [CrossRef] [PubMed]
- Palit, S.; Sharma, A.; Talukder, G. Effects of cobalt on plants. Bot. Rev. 1994, 60, 149–181. [Google Scholar] [CrossRef]
- Chen, C.; Huang, D.; Liu, J. Functions and toxicity of nickel in plants: Recent advances and future prospects. Clean Soil Air Water 2009, 37, 304–313. [Google Scholar] [CrossRef]
- Galán, E.; Romero, A. Contaminación de suelos por metales pesados. Macla 2008, 10, 48–60. [Google Scholar]
- Rojano, B.; Gaviria, C.; Sáez, J. Determinación de la actividad antioxidante en un modelo de peroxidación lipídica de mantequilla inhibida por el isoespintanol. Vitae. Revista De La Facultad De Química Farmacéutica 2008, 15, 212–218. [Google Scholar]
- Malpur, P.P.; Shah, A.S.; Juvekar, A.R. Antioxidant and anti-inflammatory activity of extract obtained from Aspergillus candidus MTCC 2202 broth filtrate. Indian J. Exp. Biol. 2006, 44, 468–473. [Google Scholar]
- Wong, J.W.; Hashimoto, K.; Shibamoto, T. Antioxidant activities of rosemary and sage extracts and vitamin E in a model meat system. J. Agric. Food Chem. 1995, 43, 2707–2712. [Google Scholar] [CrossRef]
- Simon, R.A. Adverse reactions to food and drug additives. Immunol. Allergy Clin. N. Am. 1996, 16, 137–176. [Google Scholar] [CrossRef]
- Esmaeili, A.; Mohabi, N. Experimental and theoretical determination of the antioxidant properties of aromatic monoterpenes of thymol and 2.5.6-trifluorothymol. Int. J. Food Prop. 2014, 17, 1162–1168. [Google Scholar] [CrossRef]
- Kanner, J.; Frankel, E.; Granit, R.; German, B.; Kinsella, J.E. Natural Antioxidants in Grapes and Winess. J. Agric. Food Chem. 1994, 42, 64–69. [Google Scholar] [CrossRef]
- Kris-Etherton, P.M.; Hecker, K.D.; Bonanome, A.; Coval, S.M.; Binkoski, A.E.; Hilpert, K.F.; Griel Med, A.E.; Etherton, T.D. Bioactive compounds in foods: Their role in the prevention of cardiovascular disease and cancer. Am. J. Med. 2002, 113, 71–88. [Google Scholar] [CrossRef]

| Metal | Method | Wavelength (nm) | Calibration Curve (ppm) | Lamp Current (mA) | Type of Flame |
|---|---|---|---|---|---|
| Copper | Flame | 324.79 | 0.1–1.75 | 5.0 | Air/Acetylene |
| Iron | Flame | 248.30 | 0.3–3.00 | 5.0 | Air/Acetylene |
| Magnesium | Flame | 285.20 | 0.04–0.40 | 5.0 | Air/Acetylene |
| Manganese | Flame | 279.50 | 0.2–1.40 | 5.0 | Air/Acetylene |
| Zinc | Flame | 213.90 | 0.1–2.00 | 5.0 | Air/Acetylene |
| Calcium | Flame | 422.70 | 0.5–3.50 | 5.0 | N2O/Acetylene |
| Cobalt | Graphite furnace | 240.70 | 0.015–0.10 | 7.0 | 10 |
| Nickel | Graphite furnace | 232.0 | 0.0375–0.30 | 4.0 | 10 |
| Lead | Graphite furnace | 283.30 | 0.05–0.60 | 3.0 | 10 |
| Cadmium | Graphite furnace | 228.80 | 0.002–0.06 | 5.0 | 10 |
| Solvent (%) | TPC (mg GAE/g EBM, DW) | TFC (mg CT/g EBM, DW) |
|---|---|---|
| Water | 6.25 ± 0.44 b | 2.79 ± 0.02 a |
| EtOH-25% | 11.05 ± 0.42 d | 7.42 ± 0.25 e |
| EtOH-50% | 12.59 ± 0.23 e | 6.89 ± 1.05 d |
| EtOH-75% | 10.54 ± 0.70 d | 6.29 ± 0.23 d |
| EtOH-96% | 7.90 ± 0.38 c | 2.98 ± 0.37 a |
| MetOH-25% | 7.45 ± 0.16 c | 6.48 ± 0.83 d |
| MetOH-50% | 7.05 ± 0.34 c | 5.51 ± 0.53 c |
| MetOH-75% | 10.82 ± 0.76 d | 7.37 ± 0.12 e |
| MetOH-98% | 3.94 ± 0.14 a | 4.11 ± 0.20 b |
| Temperature (°C) | TPC (mg GAE/g EBM-EtOH50%, DW) | TFC (mg CT/g EBM-EtOH25%, DW) |
|---|---|---|
| 30 | 10.83 ± 0.16 a | 5.01 ± 0.38 a |
| 40 | 10.82 ± 0.31 a | 7.18 ± 0.19 b |
| 50 | 12.91 ± 0.77 b | 7.22 ± 0.23 b |
| 60 | 15.23 ± 0.49 c | 9.24 ± 0.24 c |
| Temperature (°C) | Time (min) | TPC (mg GAE/g EBM-EtOH50%, DW) | TFC (mg CT/g EBM-EtOH25%, DW) |
|---|---|---|---|
| 50 | 5 | 12.91 ± 0.77 a | 7.22 ± 0.23 a |
| 10 | 14.68 ± 0.30 b | 8.50 ± 0.49 b | |
| 20 | 14.91 ± 0.63 b | 8.75 ± 0.25 b | |
| 60 | 5 | 15.23 ± 0.49 c | 9.24 ± 0.24 c |
| 10 | 15.41 ± 0.36 c | 9.11 ± 0.13 c | |
| 20 | 17.33 ± 0.40 d | 9.84 ± 0.23 c |
| Sample | ABTS (µmol TE/g, EBM) | FRAP (µmol TE/g, EBM) | DPPH (µmol TE/g, EBM) |
|---|---|---|---|
| EBM-EtOH25% | 1172 ± 16.77 a | 836 ± 37.10 a | 85.70 ± 17.70 b |
| EBM-EtOH50% | 1168 ± 16.70 a | 930 ± 36.98 b | 39.03 ± 17.17 a |
| Gallic acid | 40,000 ± 1790 d | 4541 ± 51.48 e | 7376 ± 360 e |
| Catechin | 27,142 ± 645 b | 1022 ± 40.44 c | 4205 ± 111 c |
| Quercetin | 37,628 ± 711 c | 3471 ± 51.48 d | 6419 ± 284 d |
| Cation | mg Cation/kg, DW |
|---|---|
| Cadmium | 0.09 ± 0.5 |
| Calcium | 8780.83 ± 812.88 |
| Cobalt | 0.52 ± 0.03 |
| Cupper | 8.59 ± 1.98 |
| Iron | 59.71 ± 2.68 |
| Magnesium | 2530.30 ± 386.62 |
| Manganese | 292.25 ± 18.41 |
| Nickel | <0.24 |
| Lead | <0.17 |
| Zinc | 37.78 ± 14.27 |
Publisher’s Note: MDPI stays neutral with regard to jurisdictional claims in published maps and institutional affiliations. |
© 2022 by the authors. Licensee MDPI, Basel, Switzerland. This article is an open access article distributed under the terms and conditions of the Creative Commons Attribution (CC BY) license (https://creativecommons.org/licenses/by/4.0/).
Share and Cite
Rosero, S.; Del Pozo, F.; Simbaña, W.; Álvarez, M.; Quinteros, M.F.; Carrillo, W.; Morales, D. Polyphenols and Flavonoids Composition, Anti-Inflammatory and Antioxidant Properties of Andean Baccharis macrantha Extracts. Plants 2022, 11, 1555. https://doi.org/10.3390/plants11121555
Rosero S, Del Pozo F, Simbaña W, Álvarez M, Quinteros MF, Carrillo W, Morales D. Polyphenols and Flavonoids Composition, Anti-Inflammatory and Antioxidant Properties of Andean Baccharis macrantha Extracts. Plants. 2022; 11(12):1555. https://doi.org/10.3390/plants11121555
Chicago/Turabian StyleRosero, Santiago, Freddy Del Pozo, Walter Simbaña, Mario Álvarez, María Fernanda Quinteros, Wilman Carrillo, and Dayana Morales. 2022. "Polyphenols and Flavonoids Composition, Anti-Inflammatory and Antioxidant Properties of Andean Baccharis macrantha Extracts" Plants 11, no. 12: 1555. https://doi.org/10.3390/plants11121555
APA StyleRosero, S., Del Pozo, F., Simbaña, W., Álvarez, M., Quinteros, M. F., Carrillo, W., & Morales, D. (2022). Polyphenols and Flavonoids Composition, Anti-Inflammatory and Antioxidant Properties of Andean Baccharis macrantha Extracts. Plants, 11(12), 1555. https://doi.org/10.3390/plants11121555