
Biogeochemistry of Dominant Plants and Soils in Shewushan Gold Lateritic Deposit, China

Abstract
:1. Introduction
2. Materials and Method
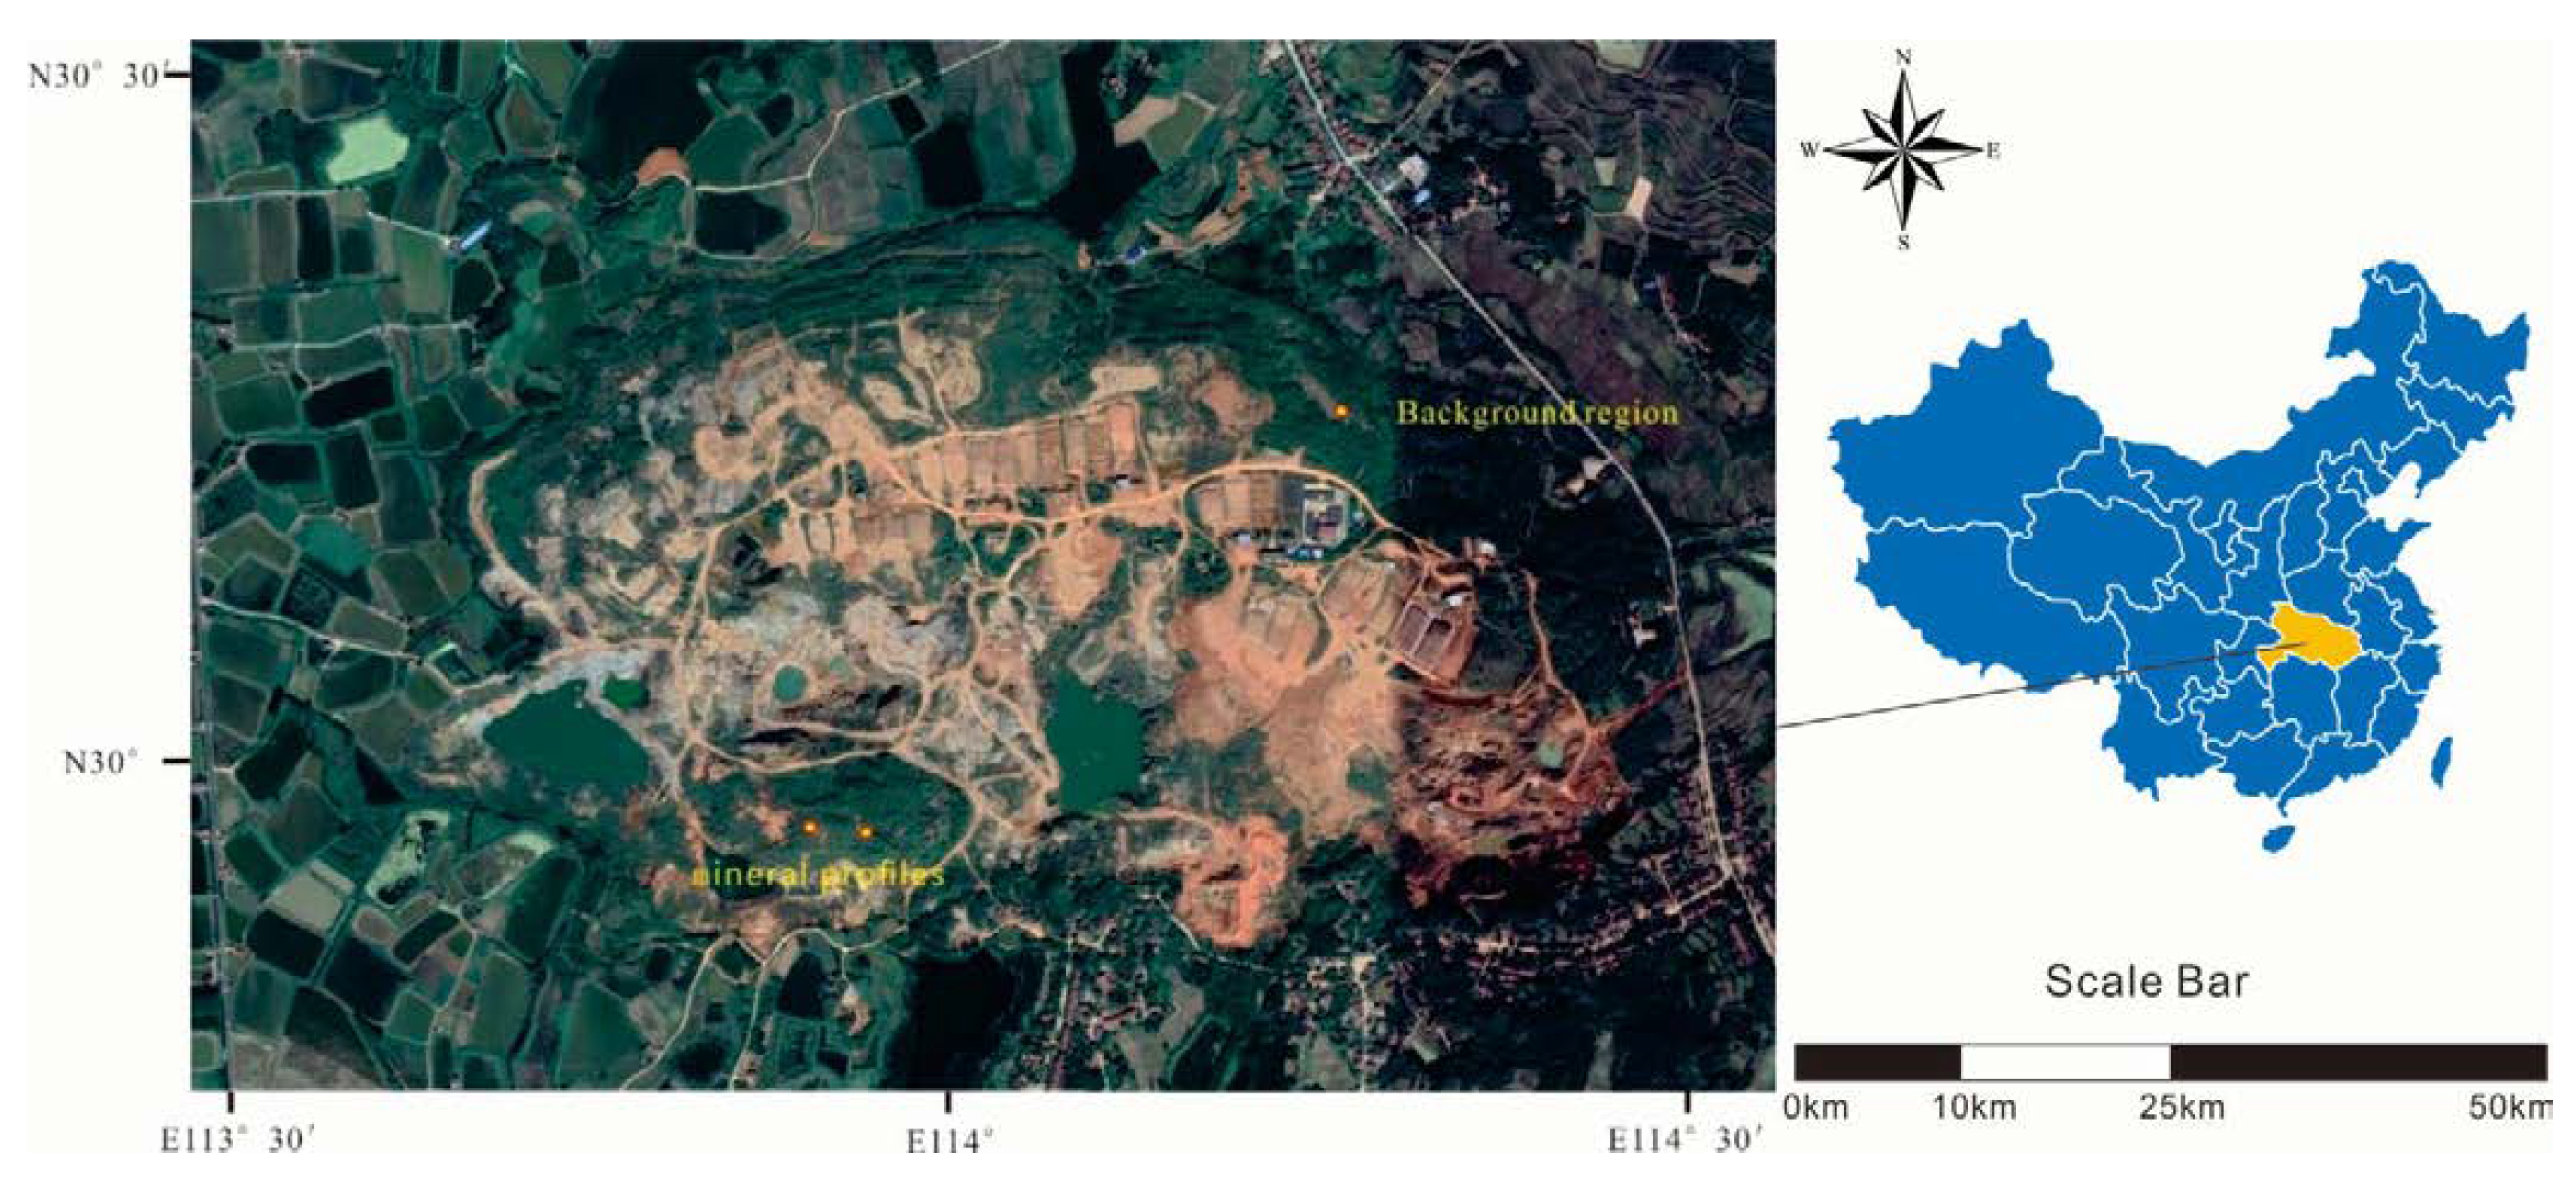
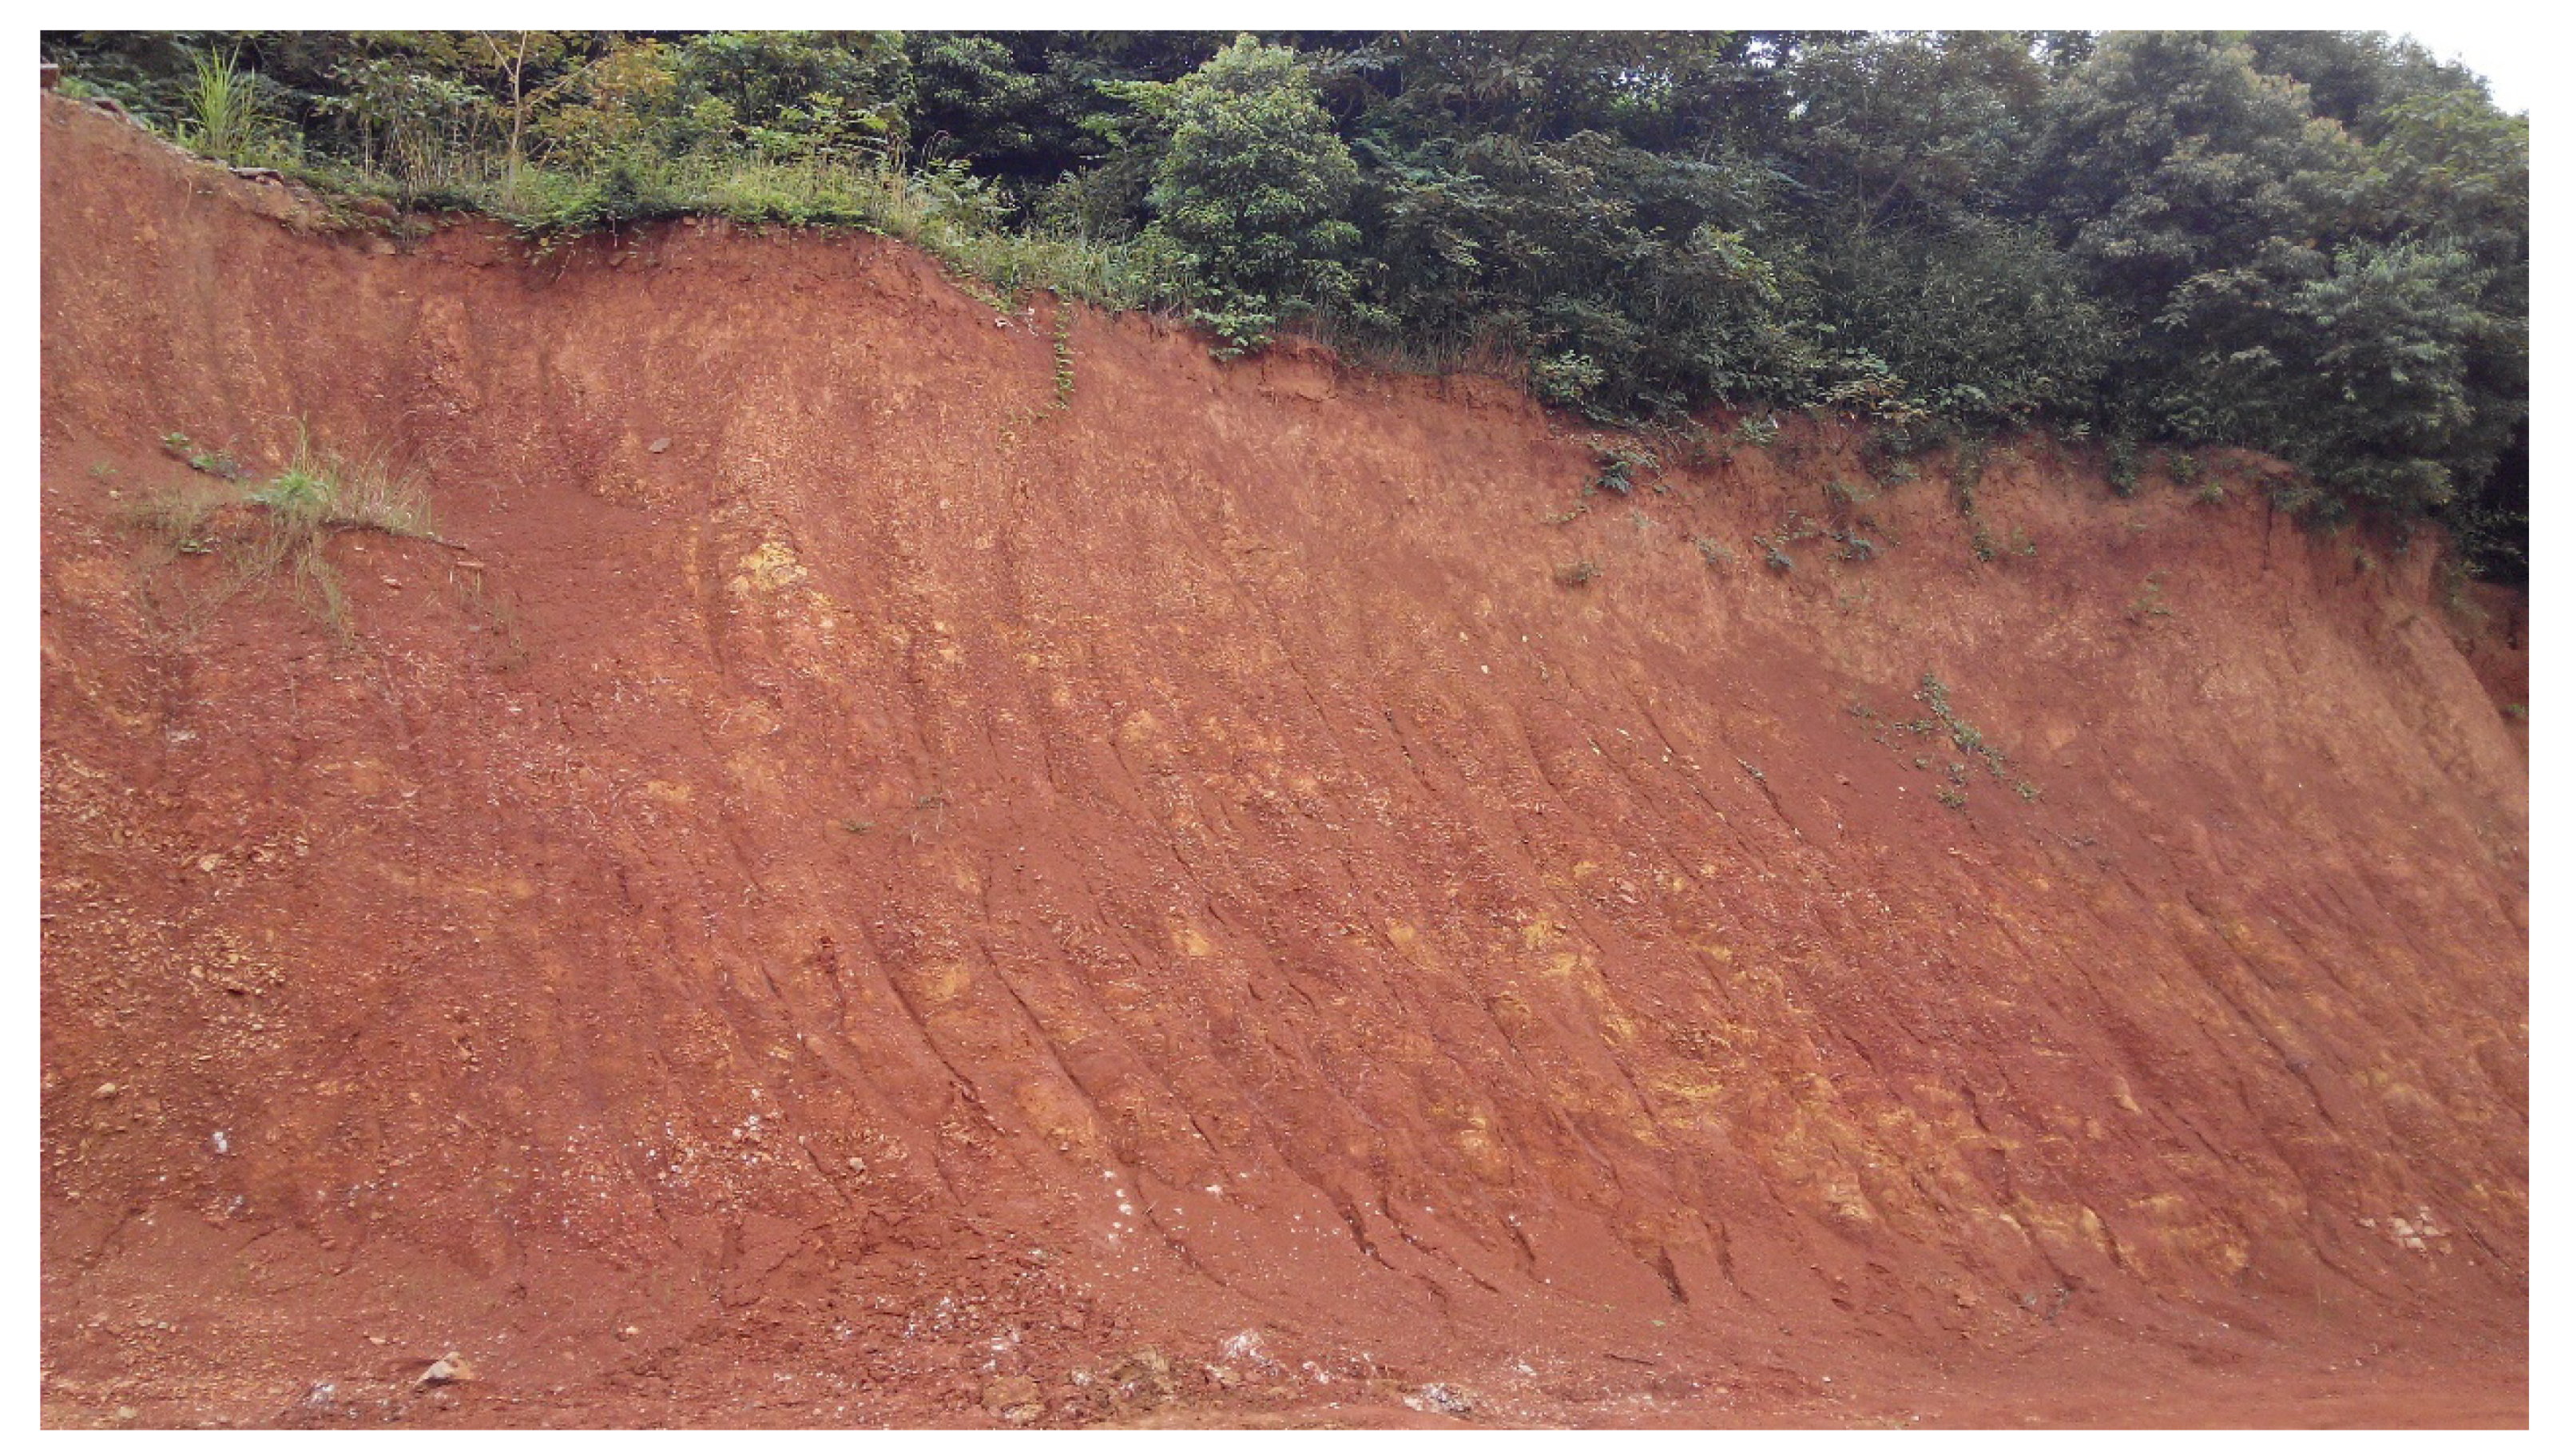
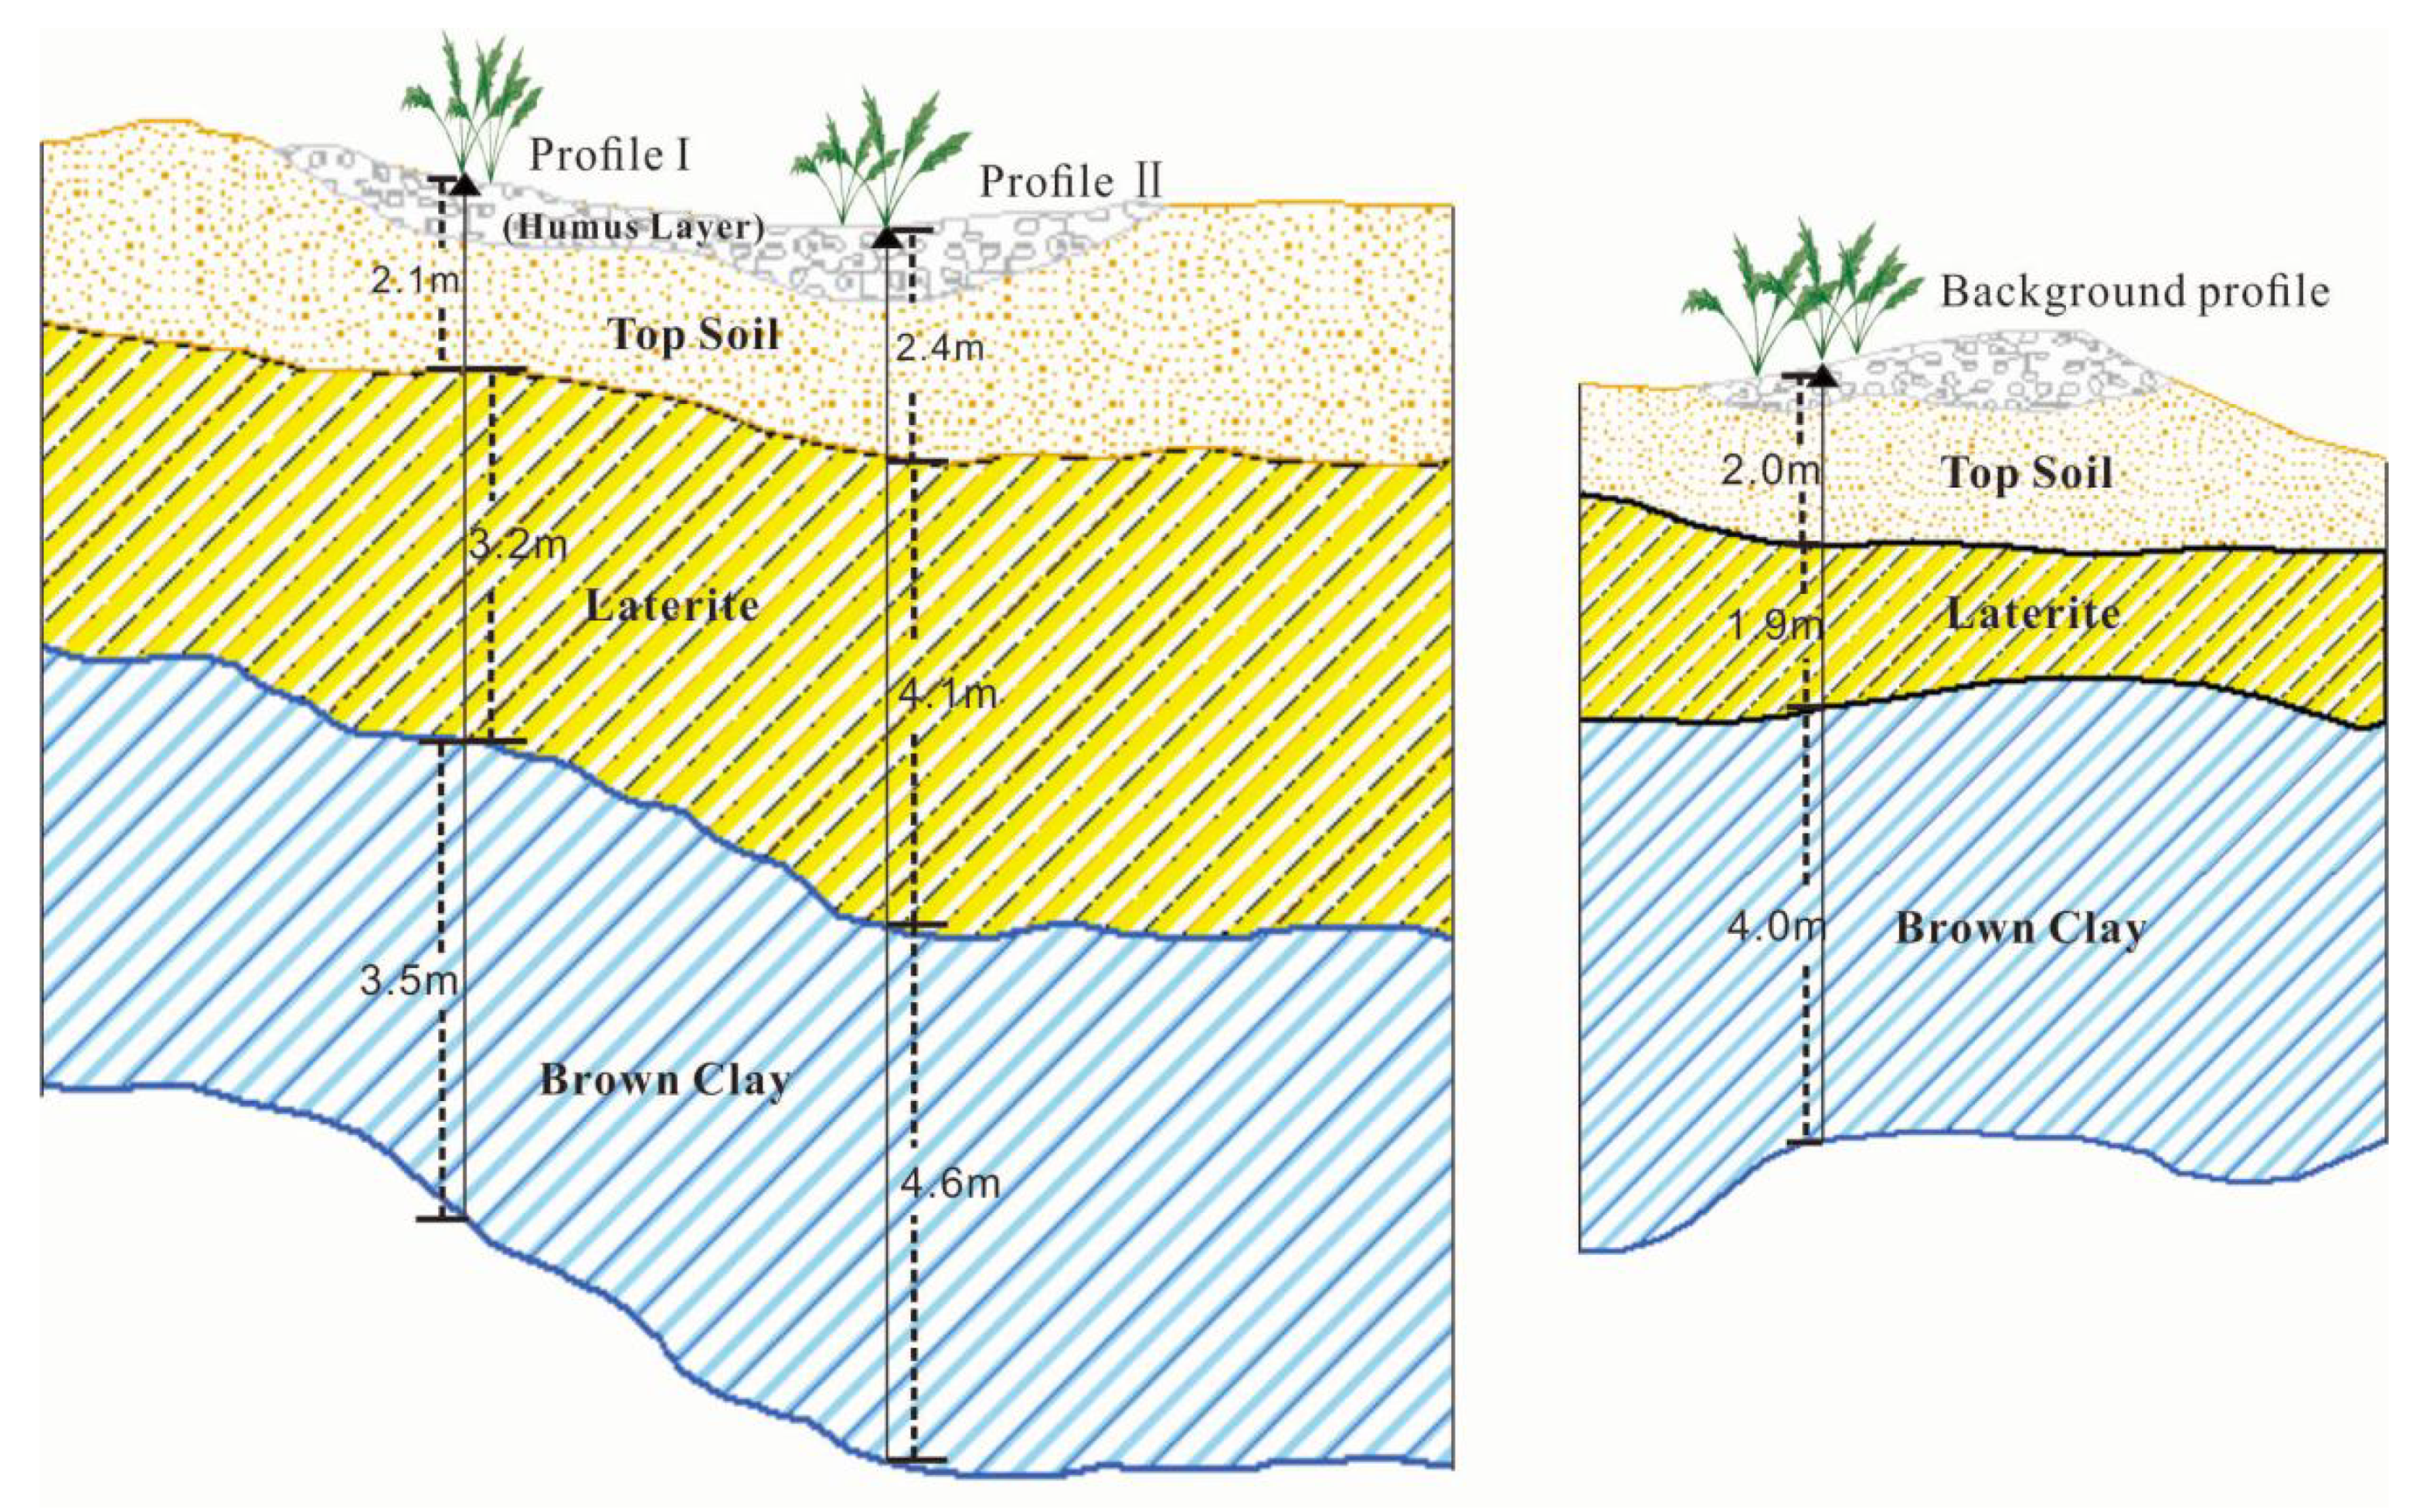
2.1. Study Area and Sampling
2.2. Samples Pretreatment
2.3. Analysis of Physiological Parameter in Soil and Plants
3. Result and Discussion
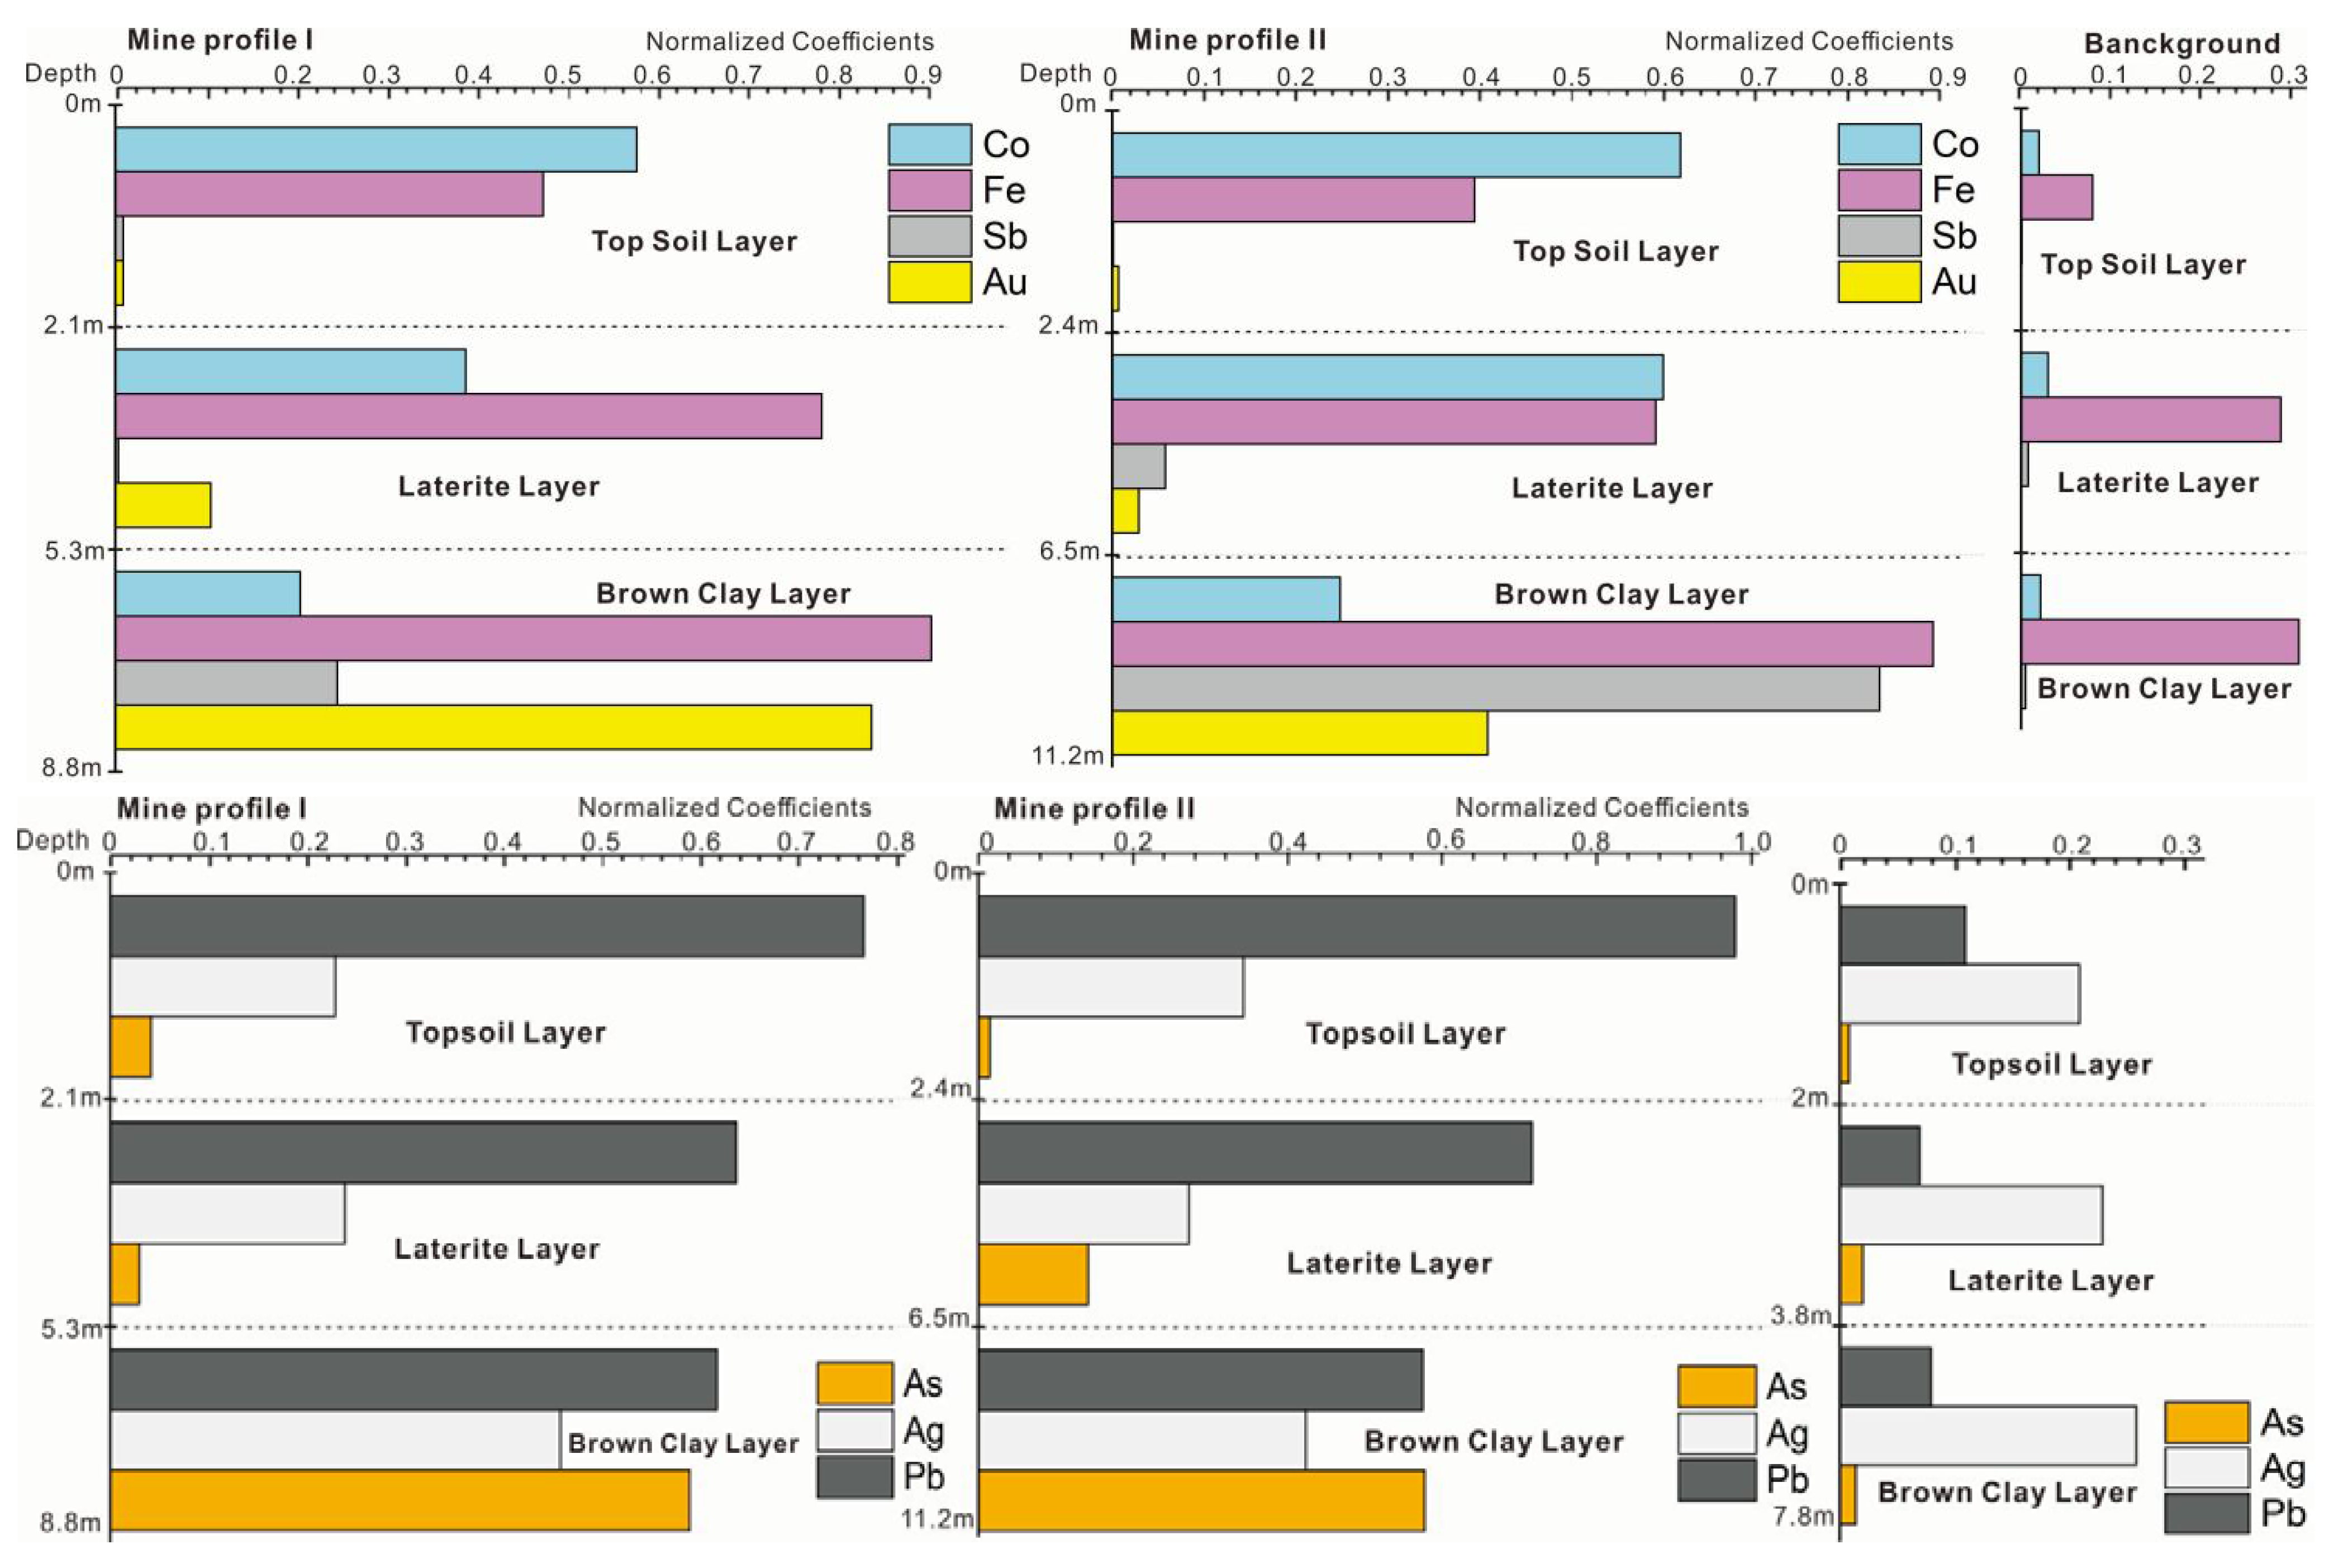
3.1. Geochemical Characteristics of Soil Profile in Mining Area
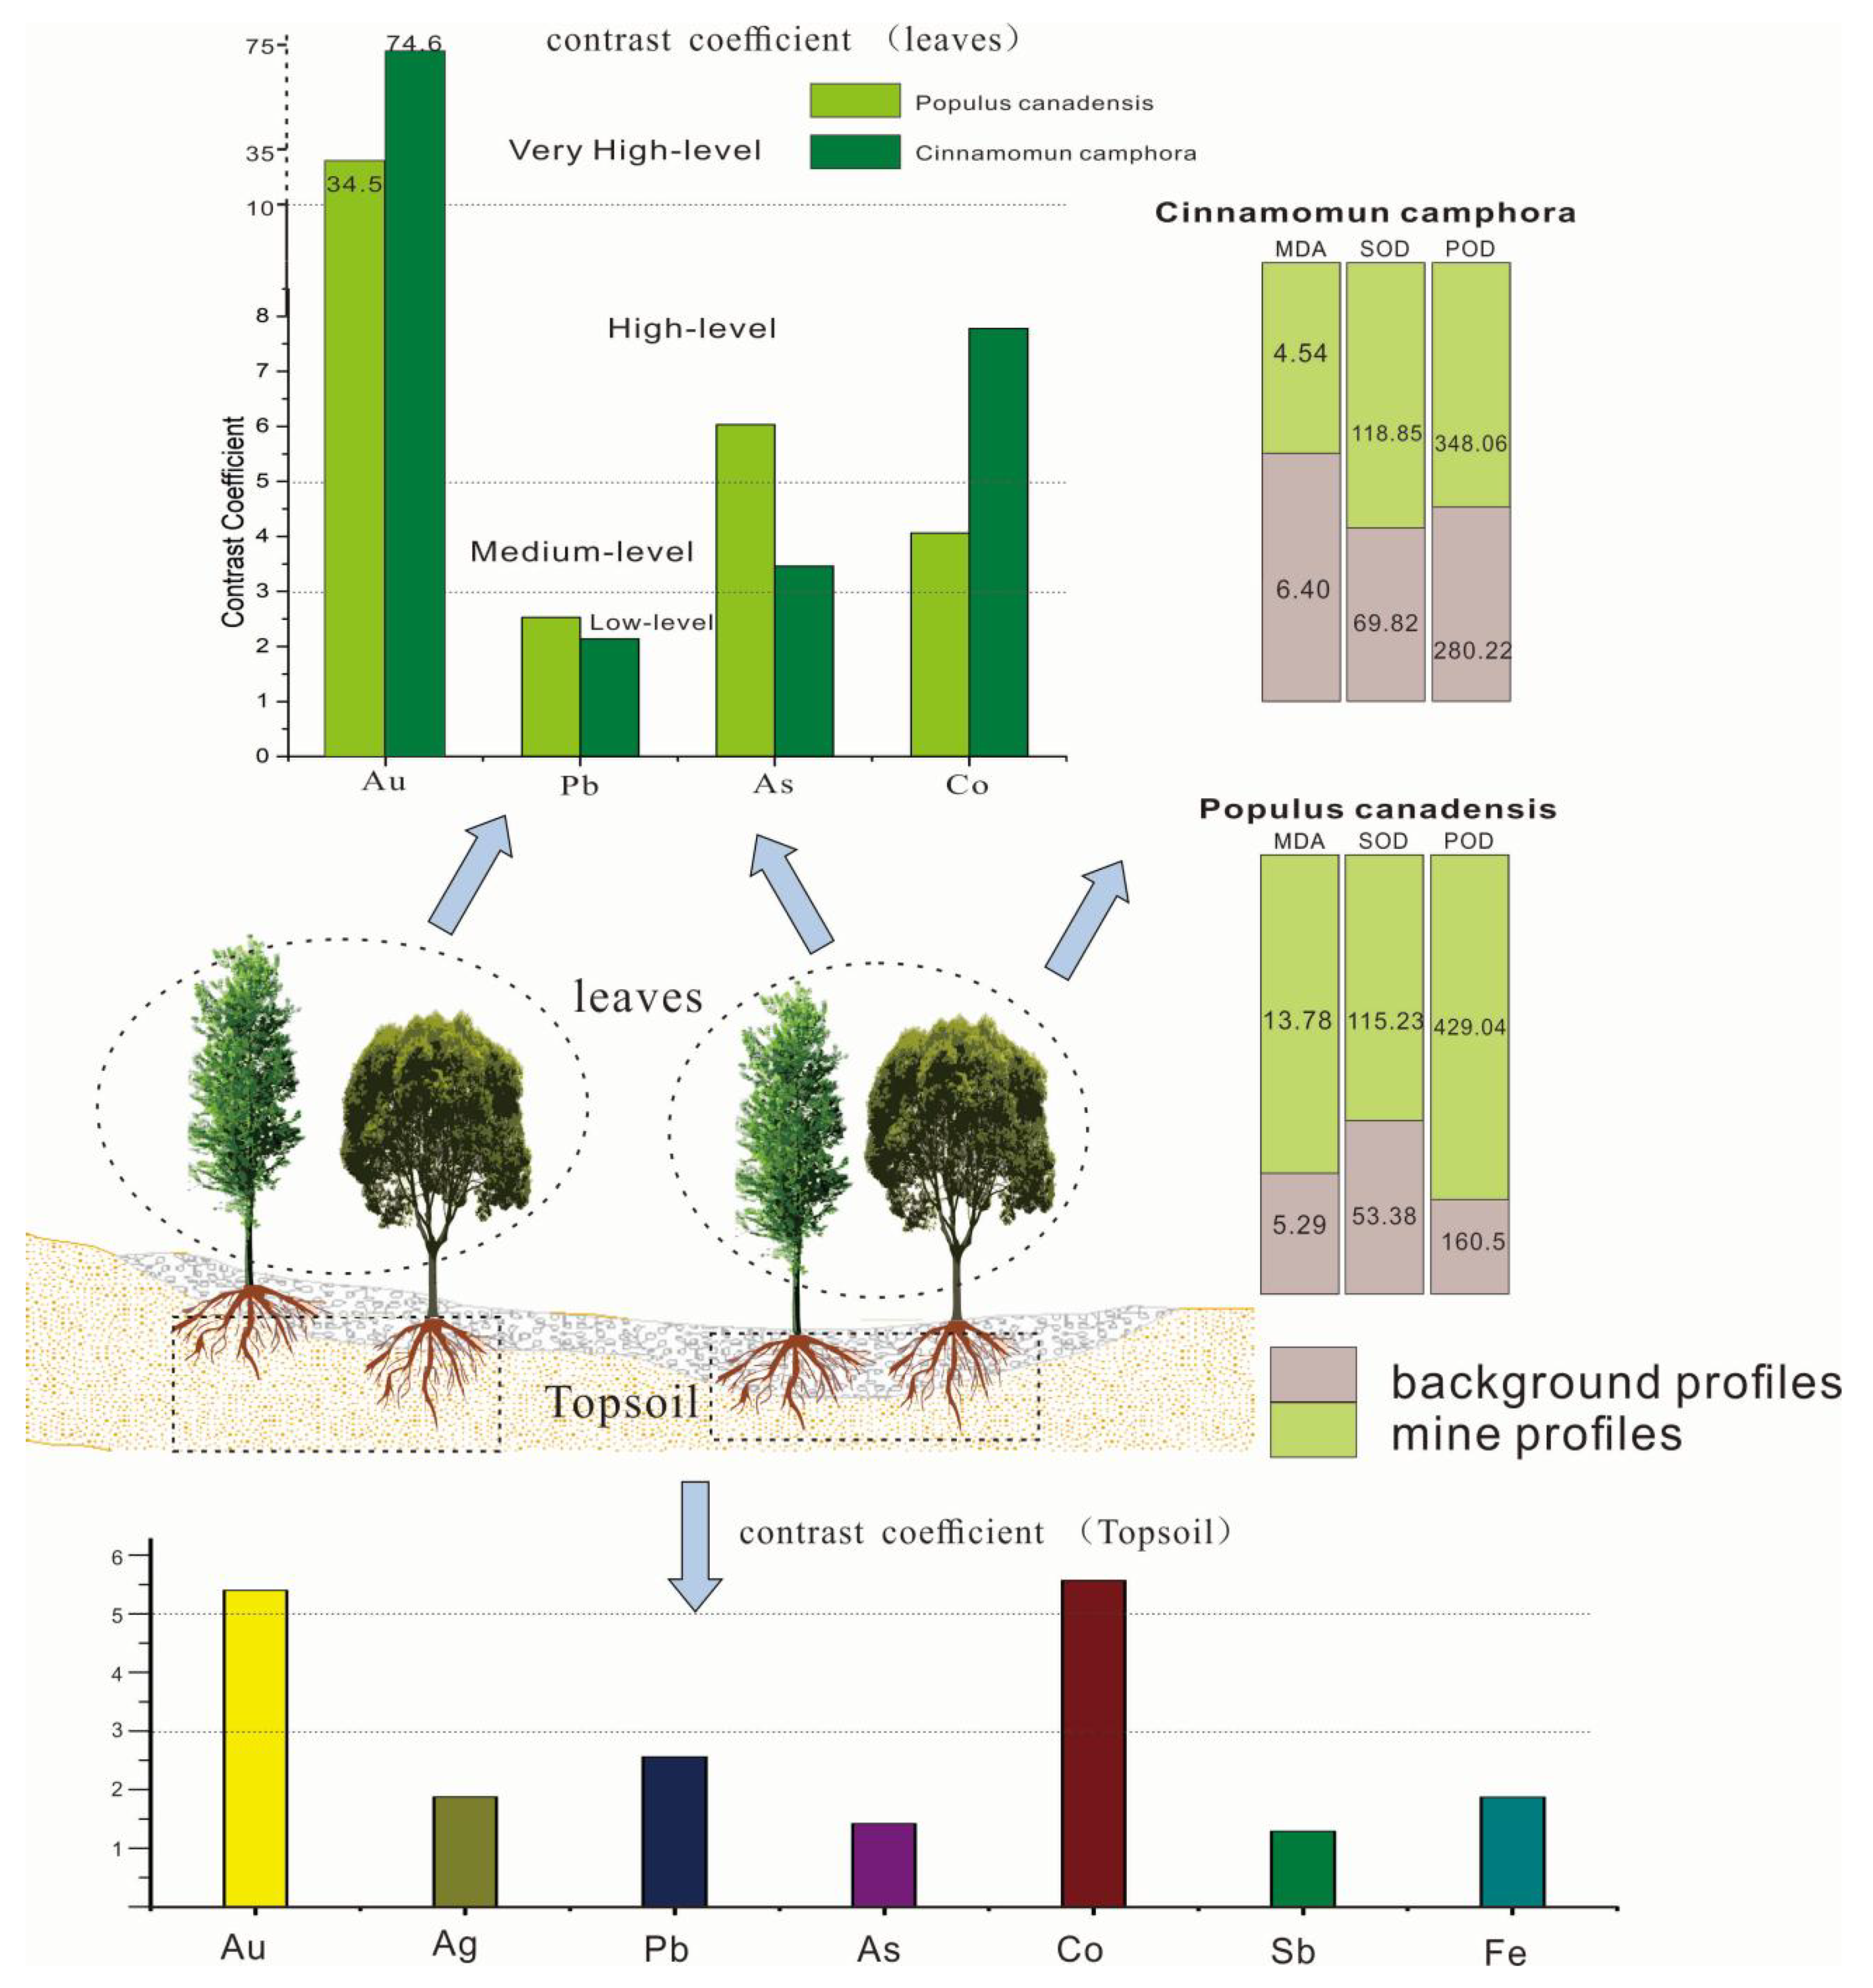
3.2. Enrichment Characteristics of Trace Elements in Soil by Plants
3.3. Effects of Trace Elements on Biochemical Characteristics of Indicator Plants
4. Conclusions
Supplementary Materials
Author Contributions
Funding
Institutional Review Board Statement
Informed Consent Statement
Data Availability Statement
Conflicts of Interest
References
- Lintern, M.; Sheard, N. The gold-in-calcrete anomaly at the ET gold prospect, Gawler Craton, South Australia. Appl. Geochem. 2011, 26, 2043. [Google Scholar] [CrossRef]
- Ha, N.T.H.; Nga, T.T.H.; Minh, N.N.; Anh, B.T.K.; Hang, N.T.A.; Duc, N.A.; Nhuan, M.T.; Kim, K.-W. Uptake of arsenic and heavy metals by native plants growing near Nui Phao multi-metal mine, northern Vietnam. Appl. Geochem. 2019, 108, 104368. [Google Scholar] [CrossRef]
- Cai, P.J.; Ke, R.X.; Ben, J. Review and Prospect of Shewushan Lateritic Gold Deposit, Jiayu, Hubei Province. Geol. Rev. 2016, 62, 243–258. [Google Scholar]
- Weisheng, Z.; Fyfe, W.S.; Yuan, C. A review of laterite gold deposits. Geoscience 2001, 15, 32–39. [Google Scholar]
- Monterroso, C.; Rodríguez, F.; Chaves, R.; Diez, J.; Macías, F. Heavy metal distribution in mine-soils and plants growing in a pb/zn-mining area in NW spain. Appl. Geochem. 2014, 44, 3–11. [Google Scholar] [CrossRef]
- Niazi, N.K.; Singh, B.; Zwieten, L.V.; Kachenko, A.G. A long term study to evaluate the phytoremediation potential of Pteris vittata L. and Pityrogramma calomelanos var. austroamericana. Int. Conf. Phytotechnol. 2014, 21, 3275–3284. [Google Scholar]
- Sun, Z.; Xie, X.; Wang, P.; Hu, Y.; Cheng, H. Heavy metal pollution caused by small-scale metal ore mining activities: A case study from a polymetallic mine in south china. Sci. Total Environ. 2018, 639, 217–227. [Google Scholar] [CrossRef]
- Etesami, H. Bacterial mediated alleviation of heavy metal stress and decreased accumulation of metals in plant tissues: Mechanisms and future prospects. Ecotoxicol. Environ. Saf. 2018, 147, 175–191. [Google Scholar] [CrossRef]
- Hao, Q.; Jiang, C. Heavy metal concentrations in soils and plants in Rongxi Manganese Mine of Chongqing, Southwest of China. Acta Ecol. Sin. 2015, 35, 46–51. [Google Scholar] [CrossRef]
- Adimalla, N. Heavy metals contamination in urban surface soils of Medak province, India, and its risk assessment and spatial distribution. Environ. Geochem. Health 2019, 42, 59–75. [Google Scholar] [CrossRef]
- Yu, R.Y. Geological characteristics and genesis of the weathering type gold deposit in the Shewushan gold ore district, Hubei province, China. Miner. Depos. 1994, 13, 10. [Google Scholar]
- Freyssinet, P.; Roquin, C.; Muller, J.; Paquet, H.; Tardy, Y. Geochemistry and mineralogy of soils covering laterites and their use for gold exploration. Chem. Geol. 1990, 84, 58–60. [Google Scholar] [CrossRef]
- Lintern, M.J.; Anand, R.R. Dispersion of gold and other metals by trees, gravels and soils near Boddington Gold Deposit, Western Australia. J. Geochem. Explor. 2017, 181, 10–21. [Google Scholar] [CrossRef]
- Cho, U.-H.; Park, J.-O. Distribution and phytotoxicity of cadmium in tomato seedlings. J. Plant Biol. 1999, 42, 49–56. [Google Scholar] [CrossRef]
- Chen, Y.; Chi, W.; Huang, T.; Lin, C.; Nguyeh, T.T.Q.; Hsiung, Y.; Chia, L.; Huang, H. Mercury-induced biochemical and proteomic changes in rice roots. Plant Physiol. Biochem. 2012, 55, 23–32. [Google Scholar] [CrossRef]
- Zhou, W.J.; Zhao, D.S.; Lin, X.Q. Effects of water logging onnitrogen accumulation and alleviation of water logging damage by application of nitrogen fertilizer and mixtalol in winter rape (Brassica napes L.). J. Plant Growth Regul. 1997, 16, 47–53. [Google Scholar] [CrossRef]
- Dhindsa, R.S.; Plumb-dhindsa, P.; Thorpe, T.A. Leaf senescence: Correlated with increased leaves of membrane permeability and lipid peroxidation, and decreased levels of superoxide dismutase and catalase. J. Exp. Bot. 1981, 32, 93–101. [Google Scholar] [CrossRef]
- Arnaldos, R.; Conesa, H.M.; Faz, A. Initial studies for the phytostabilization of a mine tailing from the cartagena-la union mining district (se spain). Chemosphere 2007, 66, 44. [Google Scholar]
- Zhu, G.; Xiao, H.; Guo, Q.; Song, B.; Zheng, G.; Zhang, Z. Heavy metal contents and enrichment characteristics of dominant plants in wasteland of the downstream of a lead-zinc mining area in guangxi, southwest china. Ecotoxicol. Environ. Saf. 2018, 151, 266–271. [Google Scholar] [CrossRef] [PubMed]
- Reid, N.; Hill, S.M.; Lewis, D.M. Spinifex biogeochemical expressions of buried gold mineralisation: The great mineral exploration penetrator of transported regolith. Appl. Geochem. 2008, 23, 76–84. [Google Scholar] [CrossRef]
- Reeves, R.D.; Baker, A.; Romero, R. The ultramafic flora of the Santa Elena peninsula, Costa Rica: A biogeochemical reconnaissance. J. Geochem. Explor. 2007, 93, 153–159. [Google Scholar] [CrossRef]
- Clemens, S. Molecular mechanisms of plant metal tolerance and homeostasis. Planta 2001, 212, 475–486. [Google Scholar] [CrossRef]
- Edita, B.; Arvydas, L.; Pranas, B. Use of dynamic factors to assess metal uptake and transfer in plants—Example of trees. Water Air Soil Pollut. 2012, 223, 4297–4306. [Google Scholar]
- Nawab, J.; Khan, S.; Shah, M.T.; Gul, N.; Ali, A.; Khan, K. Heavy metal bioaccumulation in native plants in chromite impacted sites: A search for effective remediating plant species. CLEAN-Soil Air Water 2016, 44, 37–46. [Google Scholar] [CrossRef]
- Batista, M.J.; Abreu, M.M.; Pinto, M.S. Biogeochemistry in Neves Corvo mining region, Iberian Pyrite Belt, Portugal. J. Geochem. Explor. 2007, 92, 159–176. [Google Scholar] [CrossRef]
- Song, C.; Lei, L.; Yang, Q. Pb, Cu botanogeochemical anomalies and toxic effects on plant cells in Pb-Zn(Sn) ore fields, Northeast Guangxi Autonomous Region, China. Chin. J. Geochem. 2007, 26, 329–332. [Google Scholar] [CrossRef]
- Ling, C.; Song, J.; Wu, X.-F.; Liu, D.-Y. Effects of Cu pollution on Medicago lupulina L. seedlings growth and active oxygen metabolism. Chin. J. Ecol. 2006, 25, 1481–1485. [Google Scholar]
- Neumann, D. Silicon and heavy metal tolerance of higher plants. Phytochemistry 2001, 56, 685–692. [Google Scholar] [CrossRef]
- Sun, X.; Xu, Y.; Zhang, Q.; Li, X.; Yan, Z. Combined effect of water inundation and heavy metals on the photosynthesis and physiology of Spartina alterniflora. Ecotoxicol. Environ. Saf. 2018, 153, 248–258. [Google Scholar] [CrossRef]


| Profile I | Layer | Au | Ag | Pb | As | Sb | Fe (%) | Co |
|---|---|---|---|---|---|---|---|---|
| Depth (m) | μg/g | mg/kg | ||||||
| 0.7 | Top soil | 0.018 | 0.07 | 37.7 | 36.6 | 3.7 | 3.87 | 20.6 |
| 1.4 | 0.010 | 0.03 | 34.1 | 22.8 | 2.24 | 4.32 | 26.2 | |
| 2.1 | 0.012 | 0.02 | 35.3 | 30.9 | 2.78 | 3.65 | 21.3 | |
| 2.8 | Laterite | 0.009 | 0.04 | 32.4 | 25.4 | 2.43 | 4.82 | 22.3 |
| 3.5 | 0.028 | 0.05 | 32.6 | 24.7 | 2.32 | 4.87 | 16.2 | |
| 4.5 | 0.077 | 0.02 | 31.6 | 24.3 | 2.24 | 5.14 | 15.5 | |
| 5.3 | 0.115 | 0.06 | 30.3 | 28.2 | 2.06 | 6.13 | 11.4 | |
| 5.6 | Brown clay | 0.161 | 0.08 | 25.9 | 27.5 | 2.86 | 5.89 | 9.5 |
| 6.6 | 0.433 | 0.06 | 30 | 75.7 | 4.68 | 5.77 | 7.5 | |
| 7.6 | 0.613 | 0.17 | 28 | 190.6 | 33.7 | 5.29 | 4.3 | |
| 8.2 | 0.937 | 0.11 | 36.2 | 299.8 | 45.1 | 5.96 | 5.4 | |
| 8.8 | 0.876 | 0.14 | 35.7 | 314.5 | 41.3 | 5.92 | 5.8 | |
| Profile II | layer | Au | Ag | Pb | As | Sb | Fe (%) | Co |
| Depth (m) | μg/g | mg/kg | ||||||
| 0.8 | Top soil | 0.005 | 0.09 | 41 | 25 | 2.3 | 3.66 | 21.2 |
| 1.5 | 0.015 | 0.08 | 42.2 | 24.6 | 1.97 | 4.36 | 24.3 | |
| 2.4 | 0.022 | 0.09 | 42.7 | 18.1 | 1.83 | 4.95 | 23.6 | |
| 2.8 | Laterite | 0.008 | 0.05 | 36.8 | 18.4 | 1.83 | 4.25 | 34.7 |
| 3.5 | 0.006 | 0.03 | 39.6 | 17.9 | 1.79 | 4.15 | 44.8 | |
| 4.2 | 0.008 | 0.04 | 38 | 20.4 | 1.96 | 4.37 | 31.3 | |
| 4.9 | 0.017 | 0.04 | 21 | 15.4 | 3.76 | 3.58 | 7 | |
| 5.6 | 0.015 | 0.08 | 30.8 | 16.3 | 4.72 | 3.77 | 40.3 | |
| 6.5 | 0.026 | 0.05 | 27.1 | 14.4 | 6.53 | 3.48 | 13.3 | |
| 7 | Brown clay | 0.025 | 0.03 | 34.5 | 37.9 | 20.9 | 4.53 | 16.5 |
| 7.7 | 0.037 | 0.02 | 31.2 | 83.5 | 10.89 | 3.9 | 21.4 | |
| 8.4 | 0.055 | 0.02 | 19.7 | 170.1 | 52.15 | 4.73 | 23 | |
| 9.1 | 0.105 | 0.01 | 33.2 | 137.6 | 74 | 5.39 | 6.2 | |
| 9.8 | 0.252 | 0.11 | 16.6 | 174.3 | 94.1 | 6.62 | 5.1 | |
| 10.5 | 0.490 | 0.22 | 14.3 | 361.2 | 130 | 4.78 | 8.1 | |
| 11.2 | 0.763 | 0.19 | 21.2 | 258.6 | 122 | 6.17 | 4.6 | |
| Background Profile | Layer | Au | Ag | Pb | As | Sb | Fe (%) | Co |
|---|---|---|---|---|---|---|---|---|
| m | μg/g | mg/kg | ||||||
| 1 | Top soil | <0.005 | 0.08 | 20.1 | 17.5 | 1.9 | 2.78 | 3.3 |
| 1.5 | <0.005 | 0.09 | 13.2 | 18.3 | 2.08 | 1.85 | 4.7 | |
| 2 | <0.005 | 0.07 | 11.8 | 19.4 | 1.76 | 1.98 | 4.3 | |
| 3 | Laterite | <0.005 | 0.05 | 13.1 | 21.2 | 2.23 | 2.46 | 3.9 |
| 3.8 | <0.005 | 0.02 | 15.4 | 23.8 | 2.64 | 3.52 | 4.2 | |
| 5 | Brown clay | <0.005 | 0.11 | 13.4 | 24.5 | 3.51 | 2.85 | 5.1 |
| 6.5 | <0.005 | 0.09 | 12.4 | 22.8 | 2.29 | 3.44 | 4.3 | |
| 7 | <0.005 | 0.06 | 16.9 | 20.6 | 2.88 | 2.97 | 3.6 | |
| 7.8 | <0.005 | 0.07 | 14.2 | 17.4 | 2.14 | 3.71 | 4.6 | |
| Elements | Au (SD) | Zn (SD) | Cu (SD) | Co (SD) | As (SD) | Fe (SD) | Al (SD) |
|---|---|---|---|---|---|---|---|
| Populus canadensis | 0.08 (0.02) | 1.37 (0.34) | 0.33 (0.07) | 0.25 (0.03) | 0.03 (0.01) | 0.01 (0.01) | 0.01 (0.01) |
| Cinnamomun camphora | 0.04 (0.01) | 0.37 (0.25) | 0.25 (0.08) | 0.01 (0.01) | 0.21 (0.03) | 0.01 (0.01) | 0.01 (0.01) |
| Species | Elements | Background (Average) | SD | Mine Profile (Average) | Contrast Coefficient |
|---|---|---|---|---|---|
| Populus canadensis | Au | 0.002 | 0.08 | 0.069 | 34.50 |
| Ag | 0.015 | 0.01 | 0.038 | 2.53 | |
| Pb | 1.97 | 2.69 | 3.03 | 1.54 | |
| Ca | 2.36 | 1.48 | 2.50 | 1.06 | |
| K | 2.77 | 1.05 | 4.76 | 1.72 | |
| Mg | 1.88 | 0.39 | 3.35 | 1.78 | |
| Zn | 22.24 | 0.44 | 15.91 | 0.72 | |
| Cu | 5.23 | 0.72 | 8.11 | 1.55 | |
| Co | 0.87 | 0.56 | 3.53 | 4.06 | |
| As | 0.72 | 1.48 | 4.34 | 6.03 | |
| Fe | 5.67 | 3.3 | 6.58 | 1.16 | |
| Al | 3.42 | 2.57 | 4.34 | 1.27 | |
| S | 2.45 | 1.24 | 2.01 | 0.82 | |
| Species | Elements | Background Values | SD | Mine Profile (Average) | Contrast Coefficient |
| Cinnamomun camphora | Au | 0.006 | 0.14 | 0.448 | 74.60 |
| Ag | 0.011 | 0.01 | 0.029 | 2.64 | |
| Pb | 1.89 | 1.05 | 4.04 | 2.14 | |
| Ca | 1.36 | 4.32 | 1.43 | 1.05 | |
| K | 2.67 | 2.09 | 5.69 | 2.13 | |
| Mg | 3.88 | 1.35 | 2.64 | 0.68 | |
| Zn | 17.52 | 3.33 | 20.71 | 1.18 | |
| Cu | 5.12 | 0.87 | 8.03 | 1.57 | |
| Co | 0.23 | 0.64 | 1.79 | 7.78 | |
| As | 1.52 | 1.32 | 5.26 | 3.46 | |
| Fe | 7.67 | 1.81 | 7.82 | 1.02 | |
| Al | 2.32 | 2.14 | 2.06 | 0.89 | |
| S | 2.05 | 1.65 | 2.69 | 1.31 |
| Sampling Area | Species | MDA (SD) | SOD (SD) | POD (SD) |
|---|---|---|---|---|
| Mine soil profile | Populus canadensis | 13.78 (3.21) | 115.23 (30.67) | 429.04 (83.34) |
| Cinnamomun camphora | 4.54 (1.05) | 118.85 (27.97) | 348.06 (75.79) | |
| Background region | Cinnamomun camphora | 6.4 (1.29) | 69.82 (10.93) | 280.22 (58.27) |
| Populus canadensis | 5.29 (0.89) | 53.38 (11.58) | 160.5 (21.94) |
| Sample Location | Species (Sample Size) | Cholophyll a + b (SD) | Au (SD) | Co (SD) | As (SD) |
|---|---|---|---|---|---|
| mg/g | μg/g | mg/kg | |||
| Mine profile | Populus canadensis (17) | 1.91 (0.42) | 0.069 (0.08) | 3.53 (0.56) | 4.34 (1.48) |
| Cinnamomun camphora (14) | 1.38 (0.27) | 0.448 (0.14) | 1.79 (0.64) | 5.26 (1.32) | |
| Background profile | Populus canadensis (5) | 2.88 (0.72) | 0.002 (-) | 0.87 (0.22) | 0.72 (0.26) |
| Cinnamomun camphora (4) | 2.03 (0.76) | 0.006 (0.005) | 0.23 (0.09) | 1.52 (0.34) | |
Publisher’s Note: MDPI stays neutral with regard to jurisdictional claims in published maps and institutional affiliations. |
© 2021 by the authors. Licensee MDPI, Basel, Switzerland. This article is an open access article distributed under the terms and conditions of the Creative Commons Attribution (CC BY) license (https://creativecommons.org/licenses/by/4.0/).
Share and Cite
Qin, H.; Wang, Z. Biogeochemistry of Dominant Plants and Soils in Shewushan Gold Lateritic Deposit, China. Plants 2022, 11, 38. https://doi.org/10.3390/plants11010038
Qin H, Wang Z. Biogeochemistry of Dominant Plants and Soils in Shewushan Gold Lateritic Deposit, China. Plants. 2022; 11(1):38. https://doi.org/10.3390/plants11010038
Chicago/Turabian StyleQin, Haoyang, and Zhenghai Wang. 2022. "Biogeochemistry of Dominant Plants and Soils in Shewushan Gold Lateritic Deposit, China" Plants 11, no. 1: 38. https://doi.org/10.3390/plants11010038
APA StyleQin, H., & Wang, Z. (2022). Biogeochemistry of Dominant Plants and Soils in Shewushan Gold Lateritic Deposit, China. Plants, 11(1), 38. https://doi.org/10.3390/plants11010038