
Optimization of Protein Isolation and Label-Free Quantitative Proteomic Analysis in Four Different Tissues of Korean Ginseng

 ,
,  , , , , and
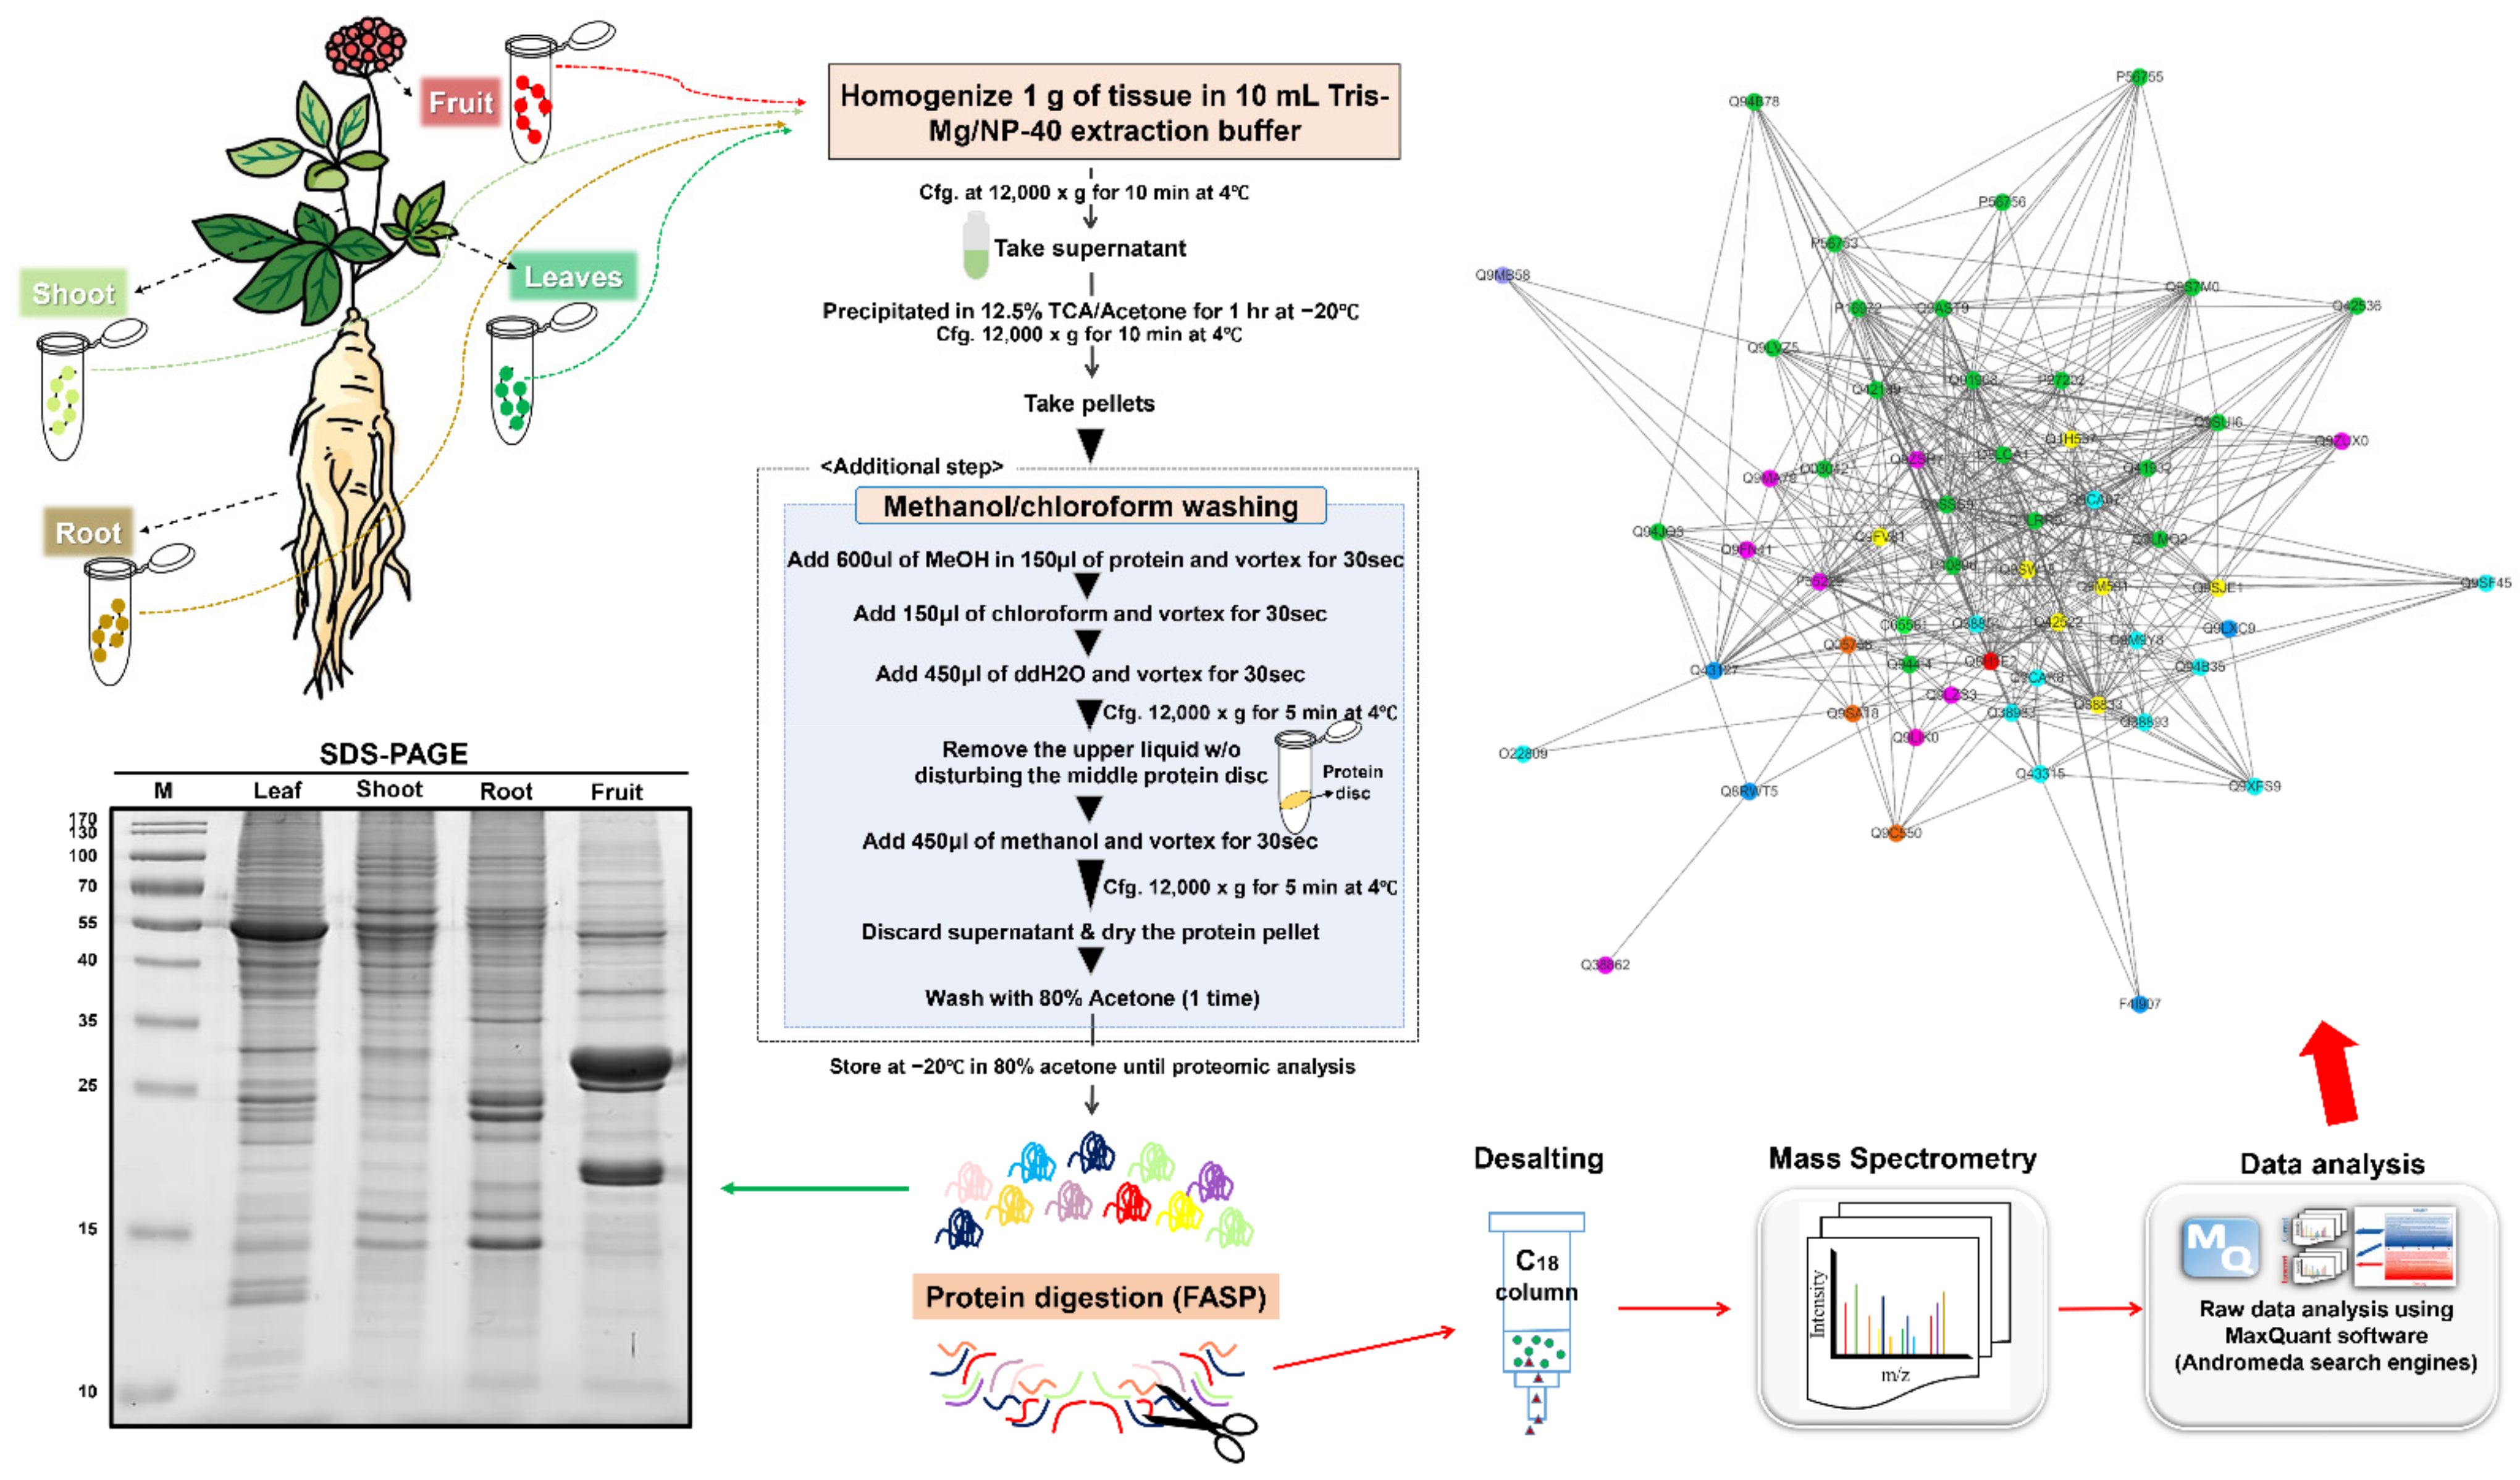
Abstract
:1. Introduction
2. Results and Discussion
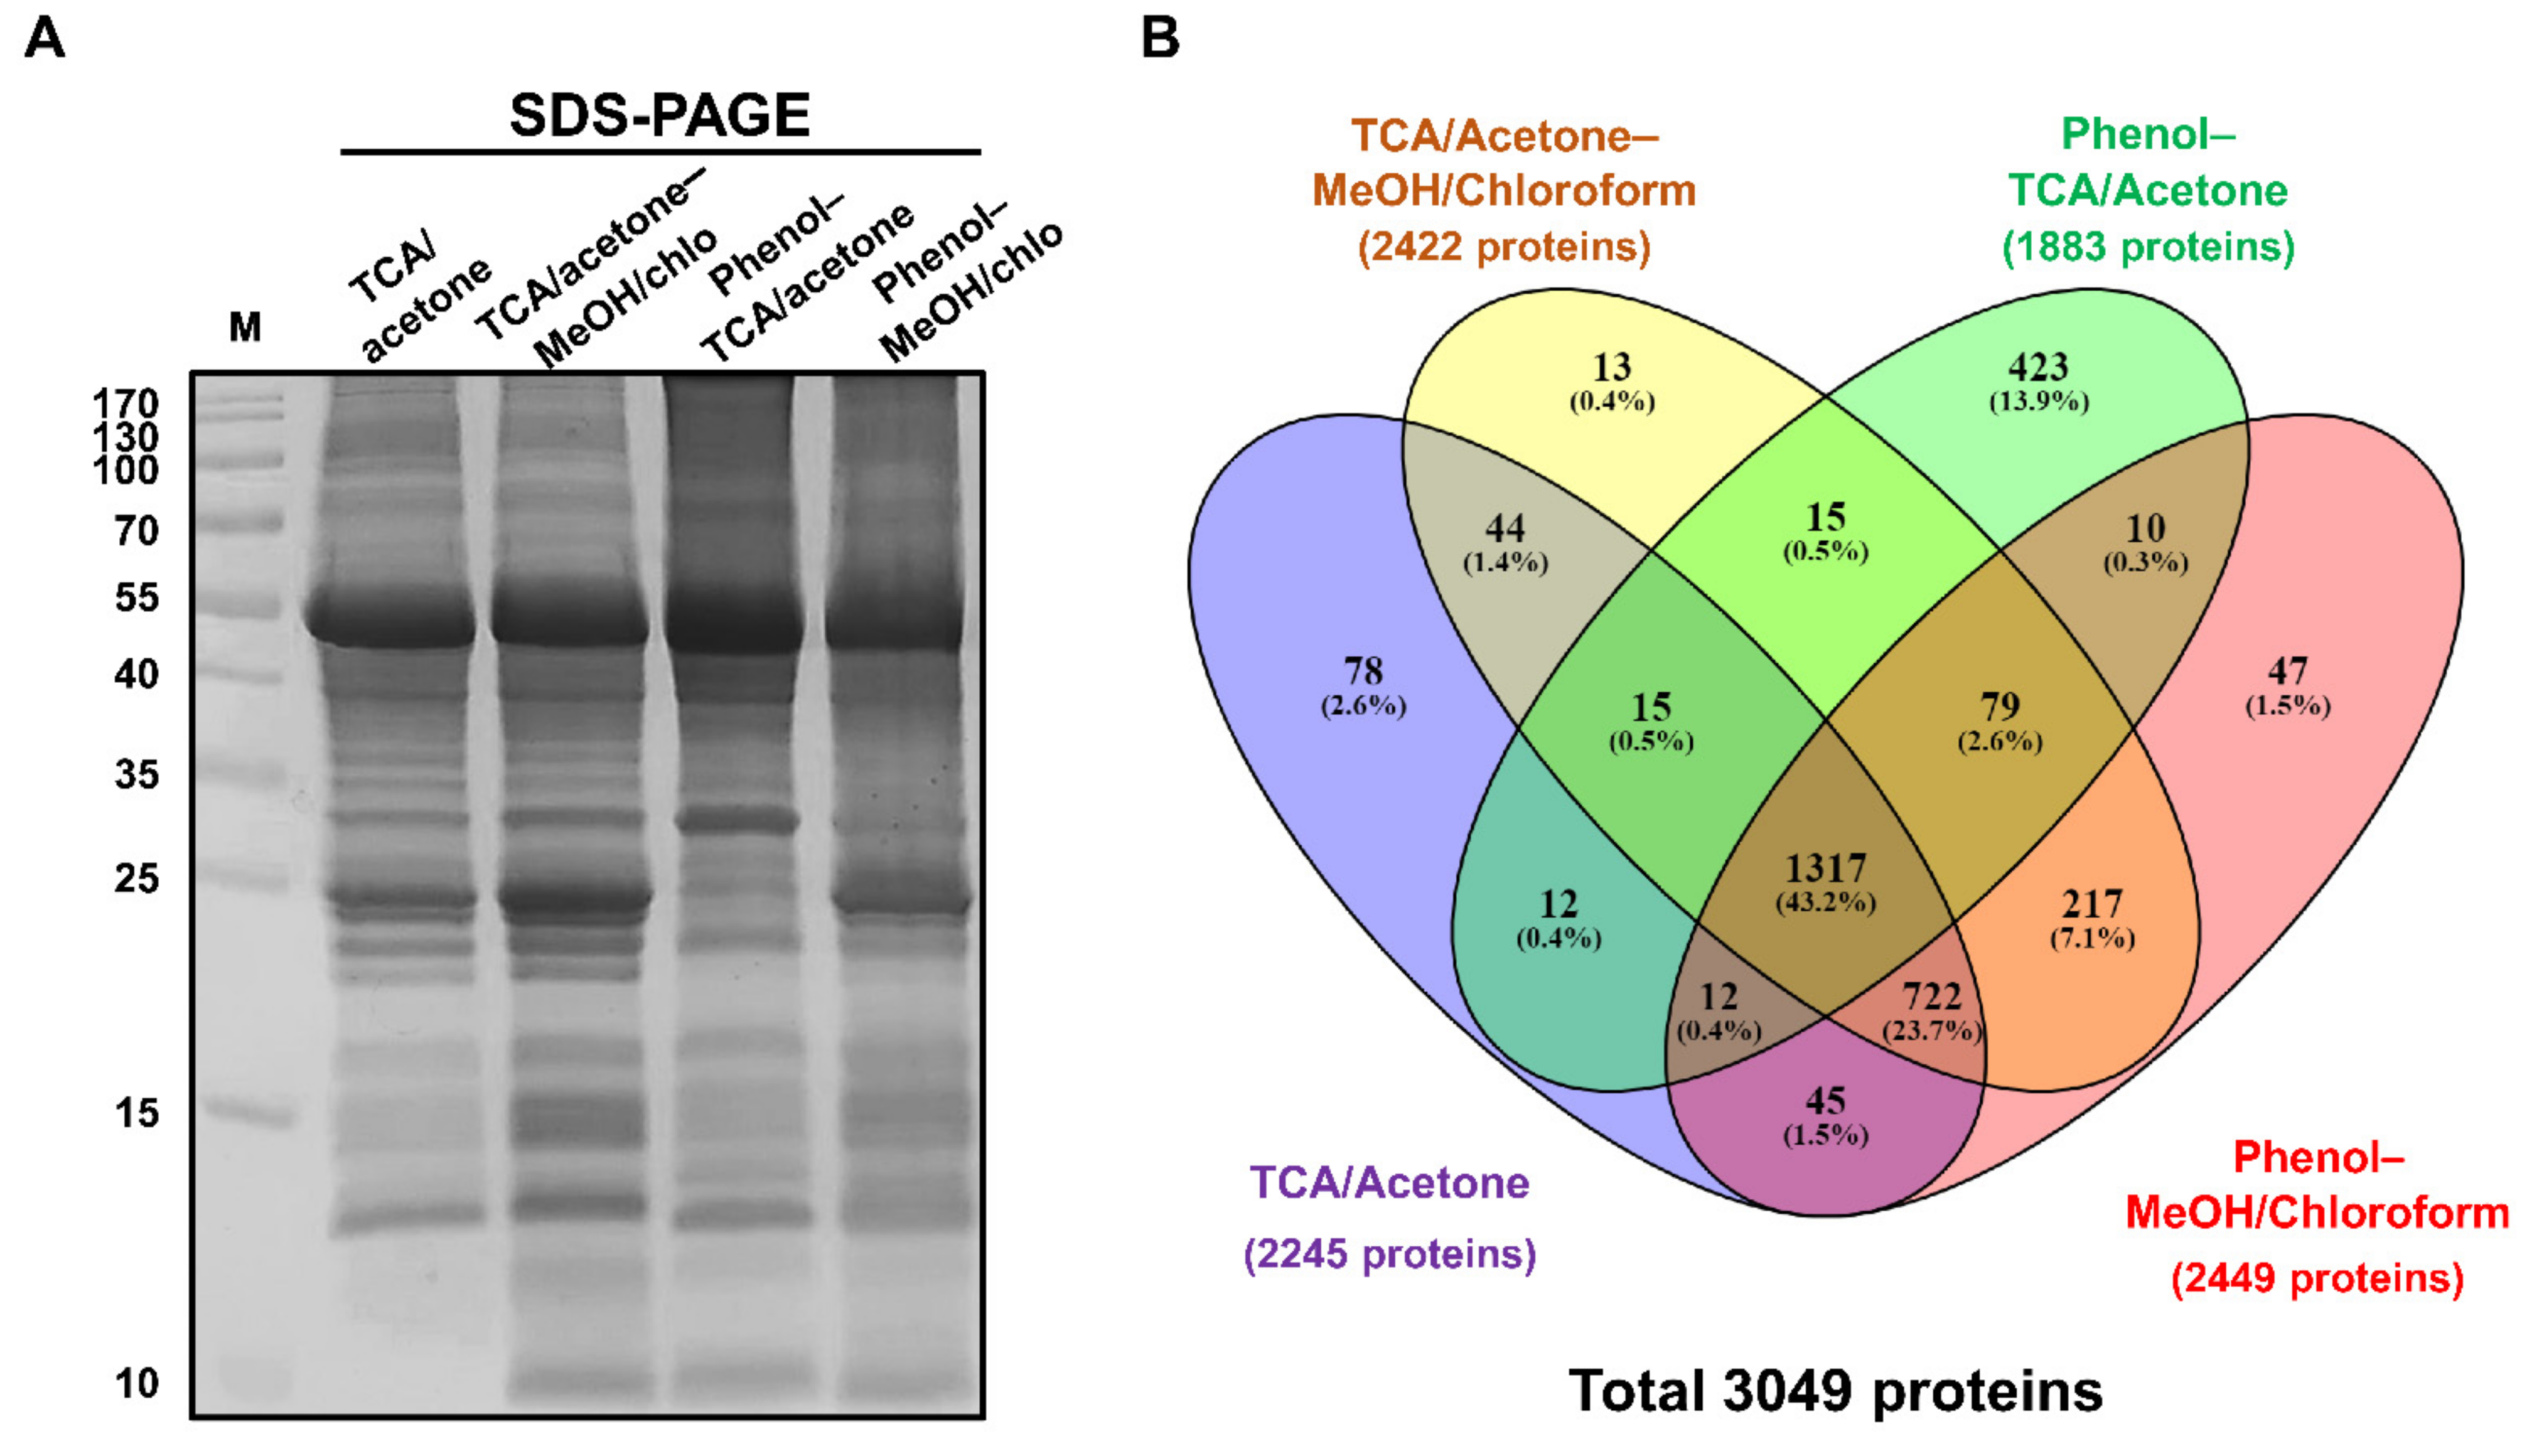
2.1. Optimization of Ginseng Protein Extraction Method
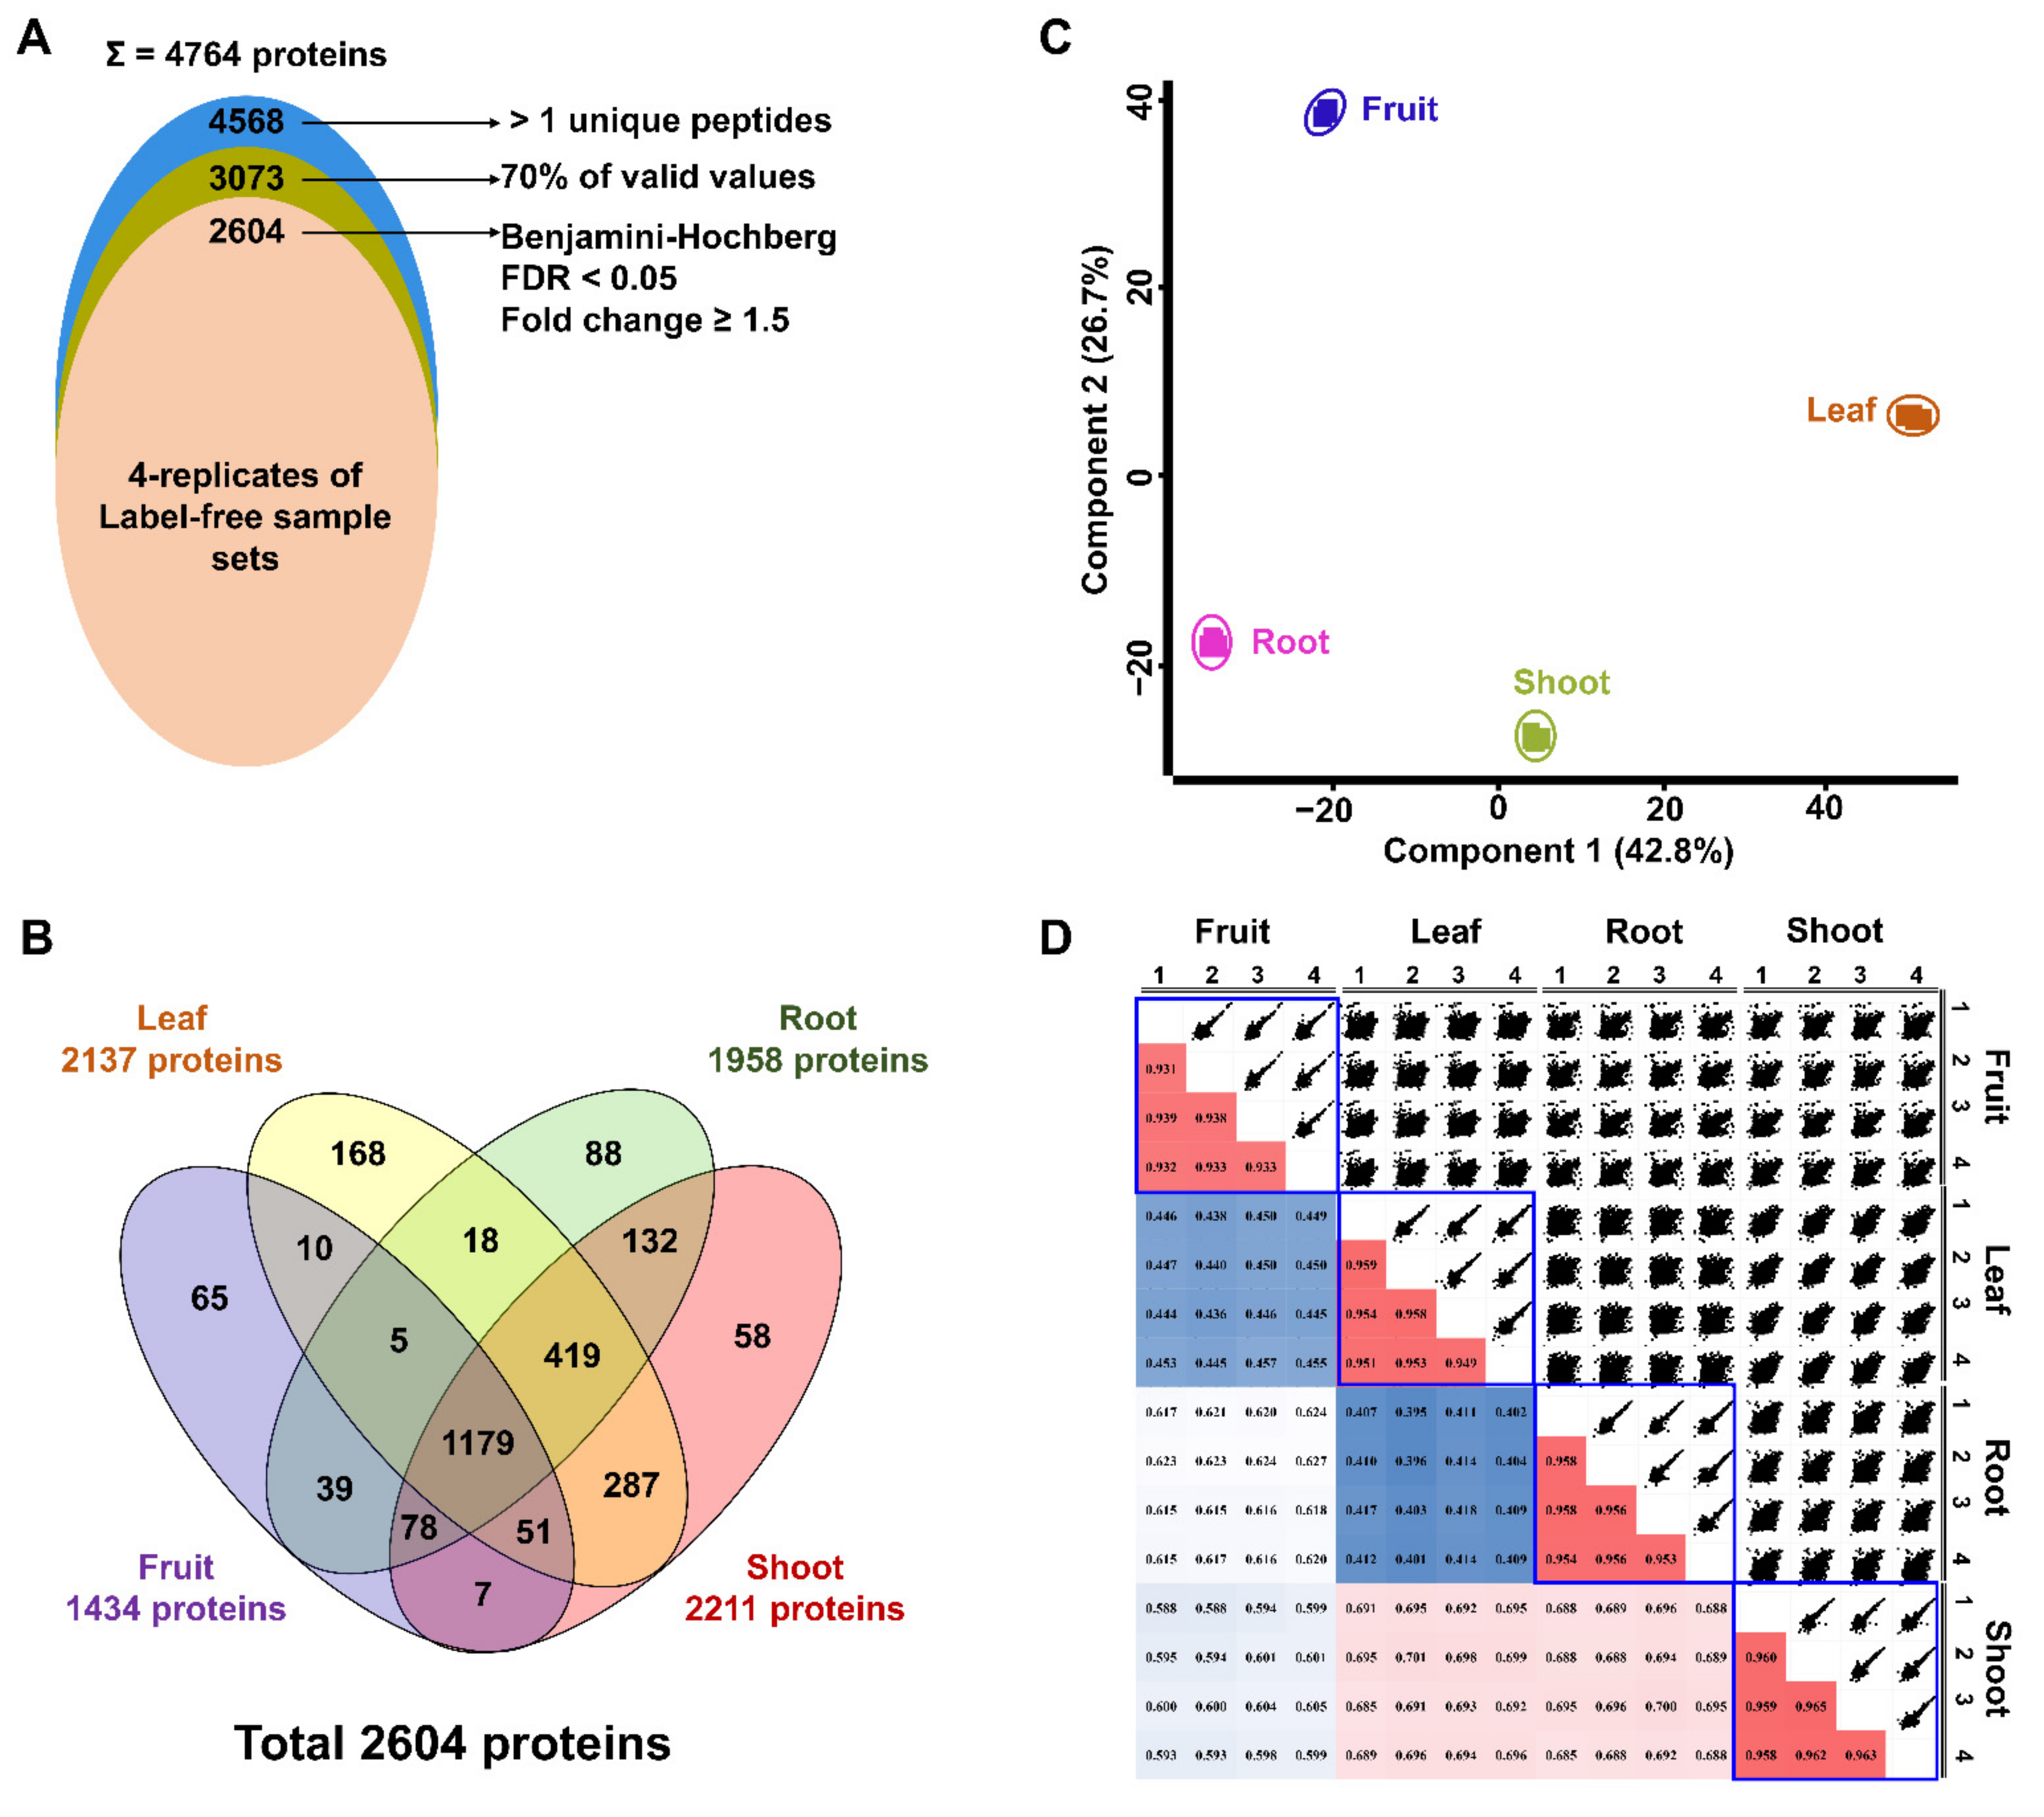
2.2. Label-Free Quantification Using Four Different Ginseng Tissues
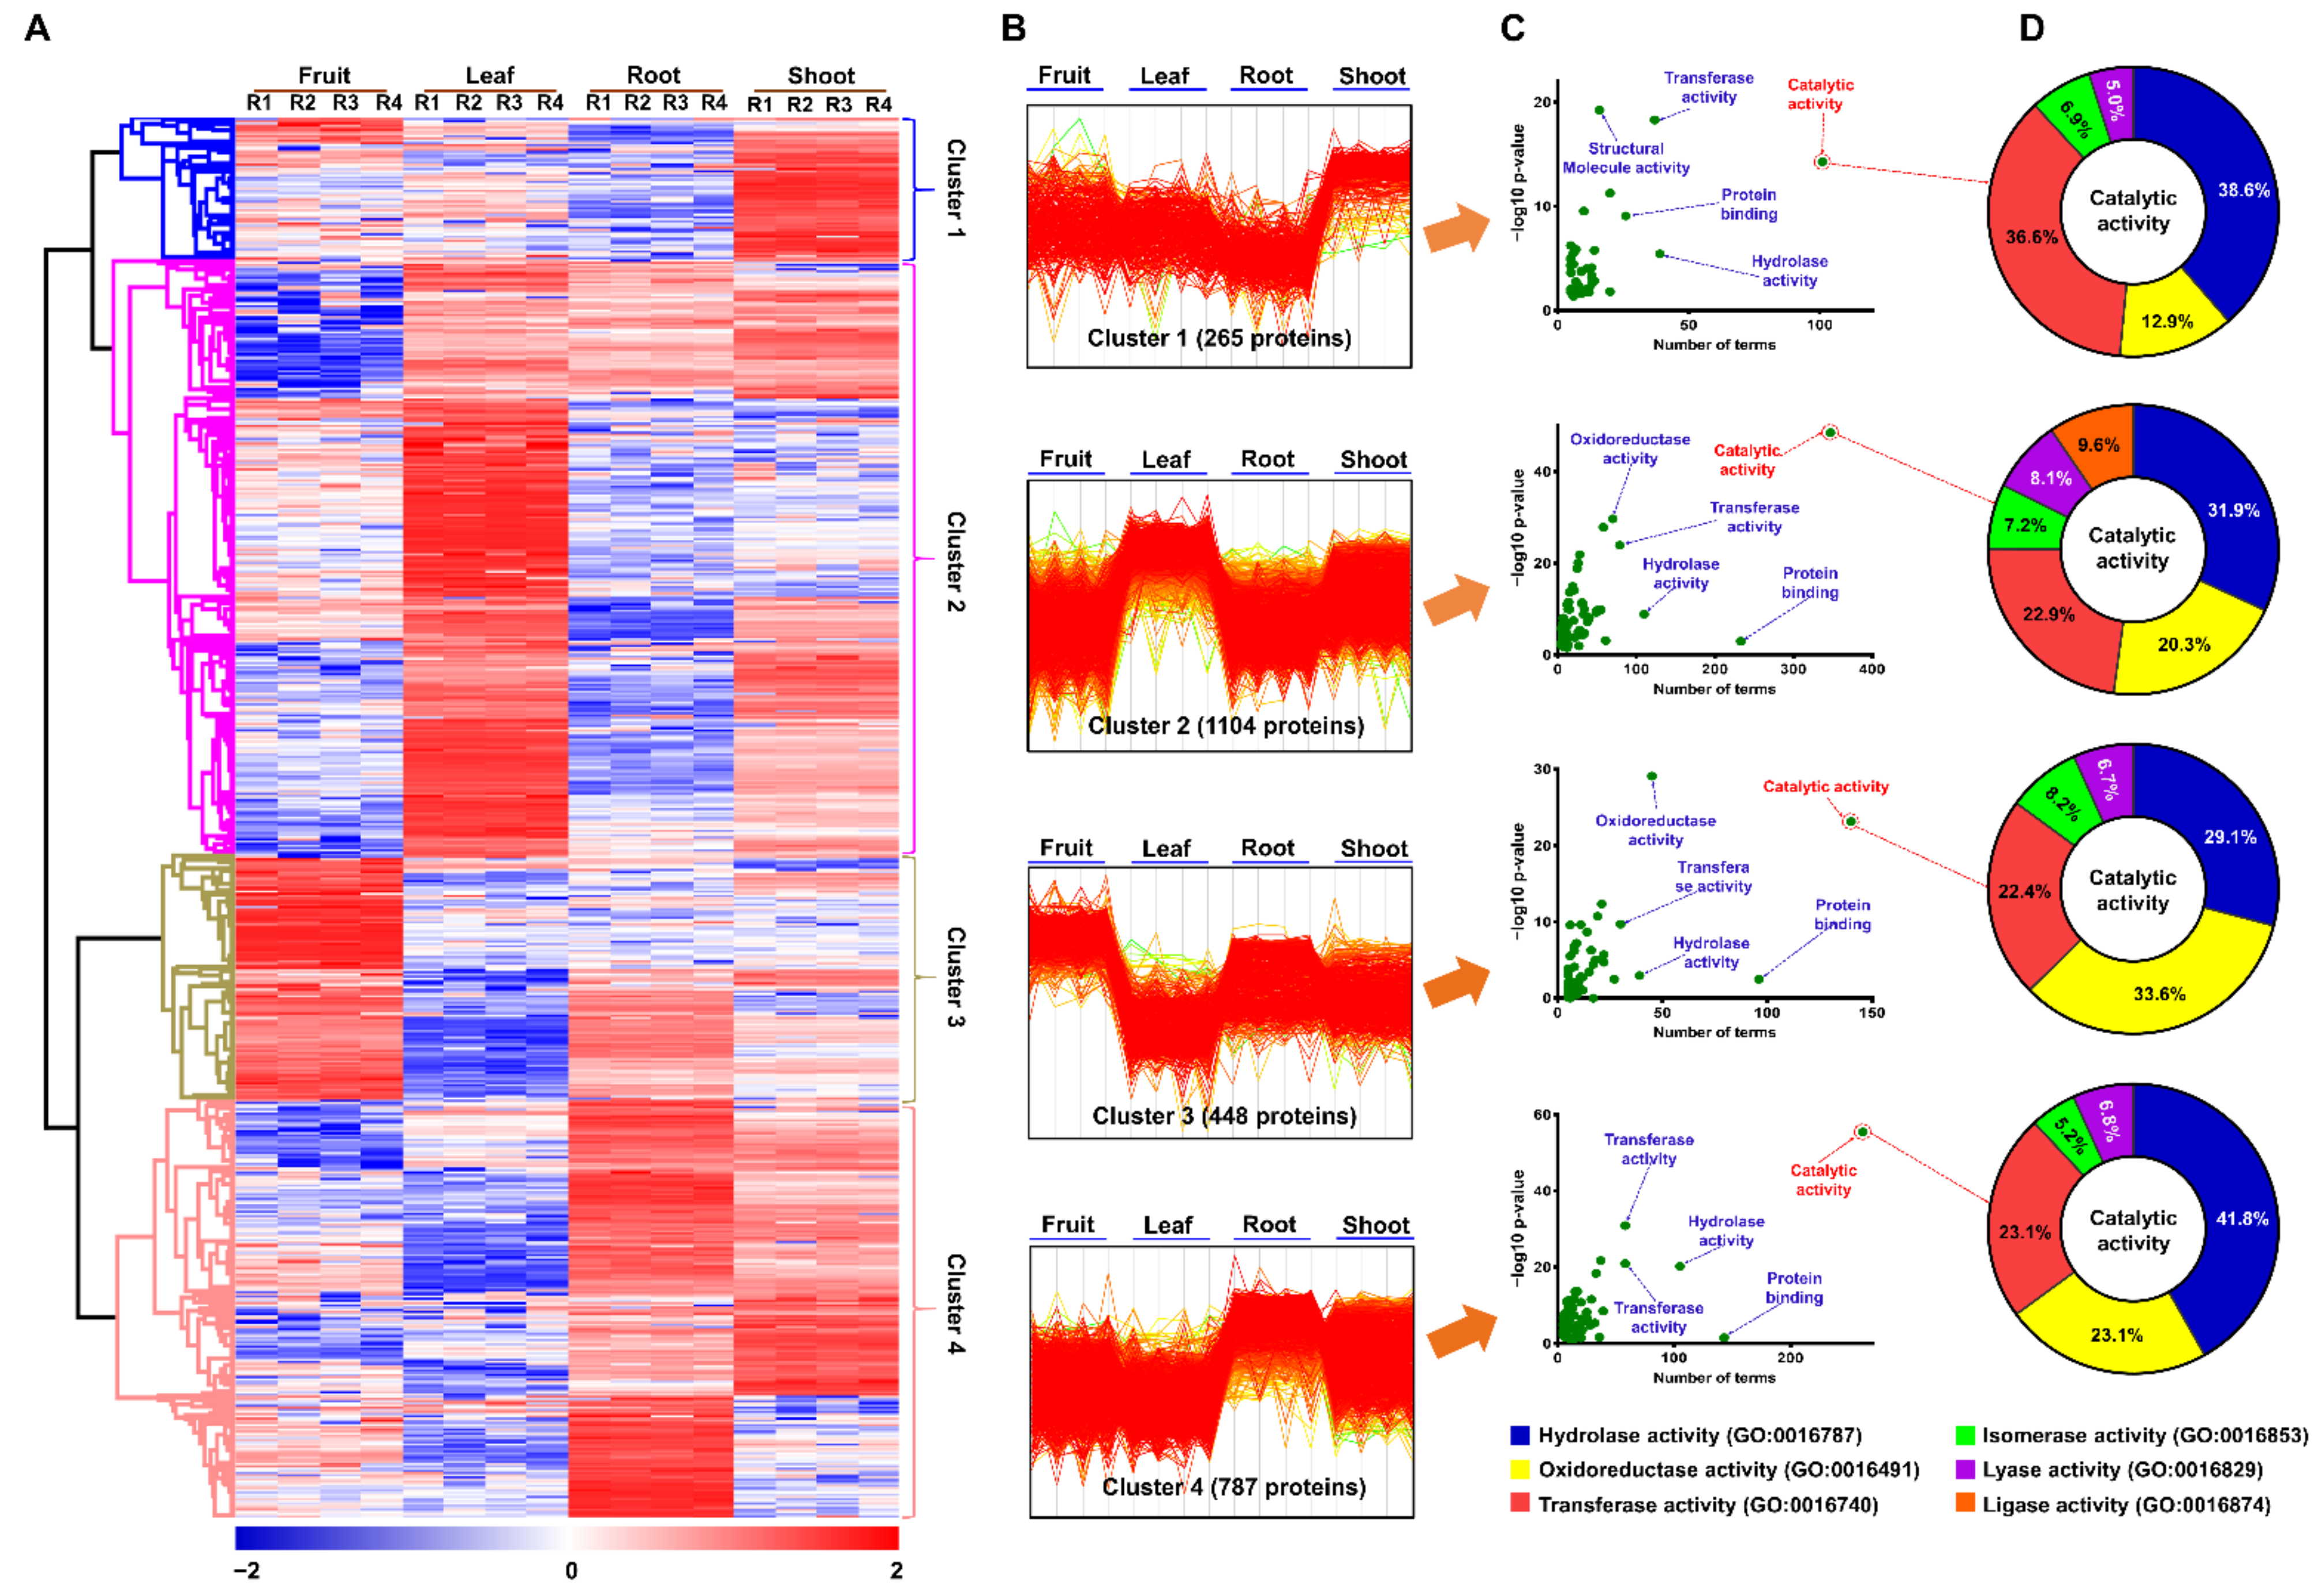
2.3. Functional Classification of Identified Proteins
2.3.1. Functions of Commonly Identified Proteins among Four Tissues
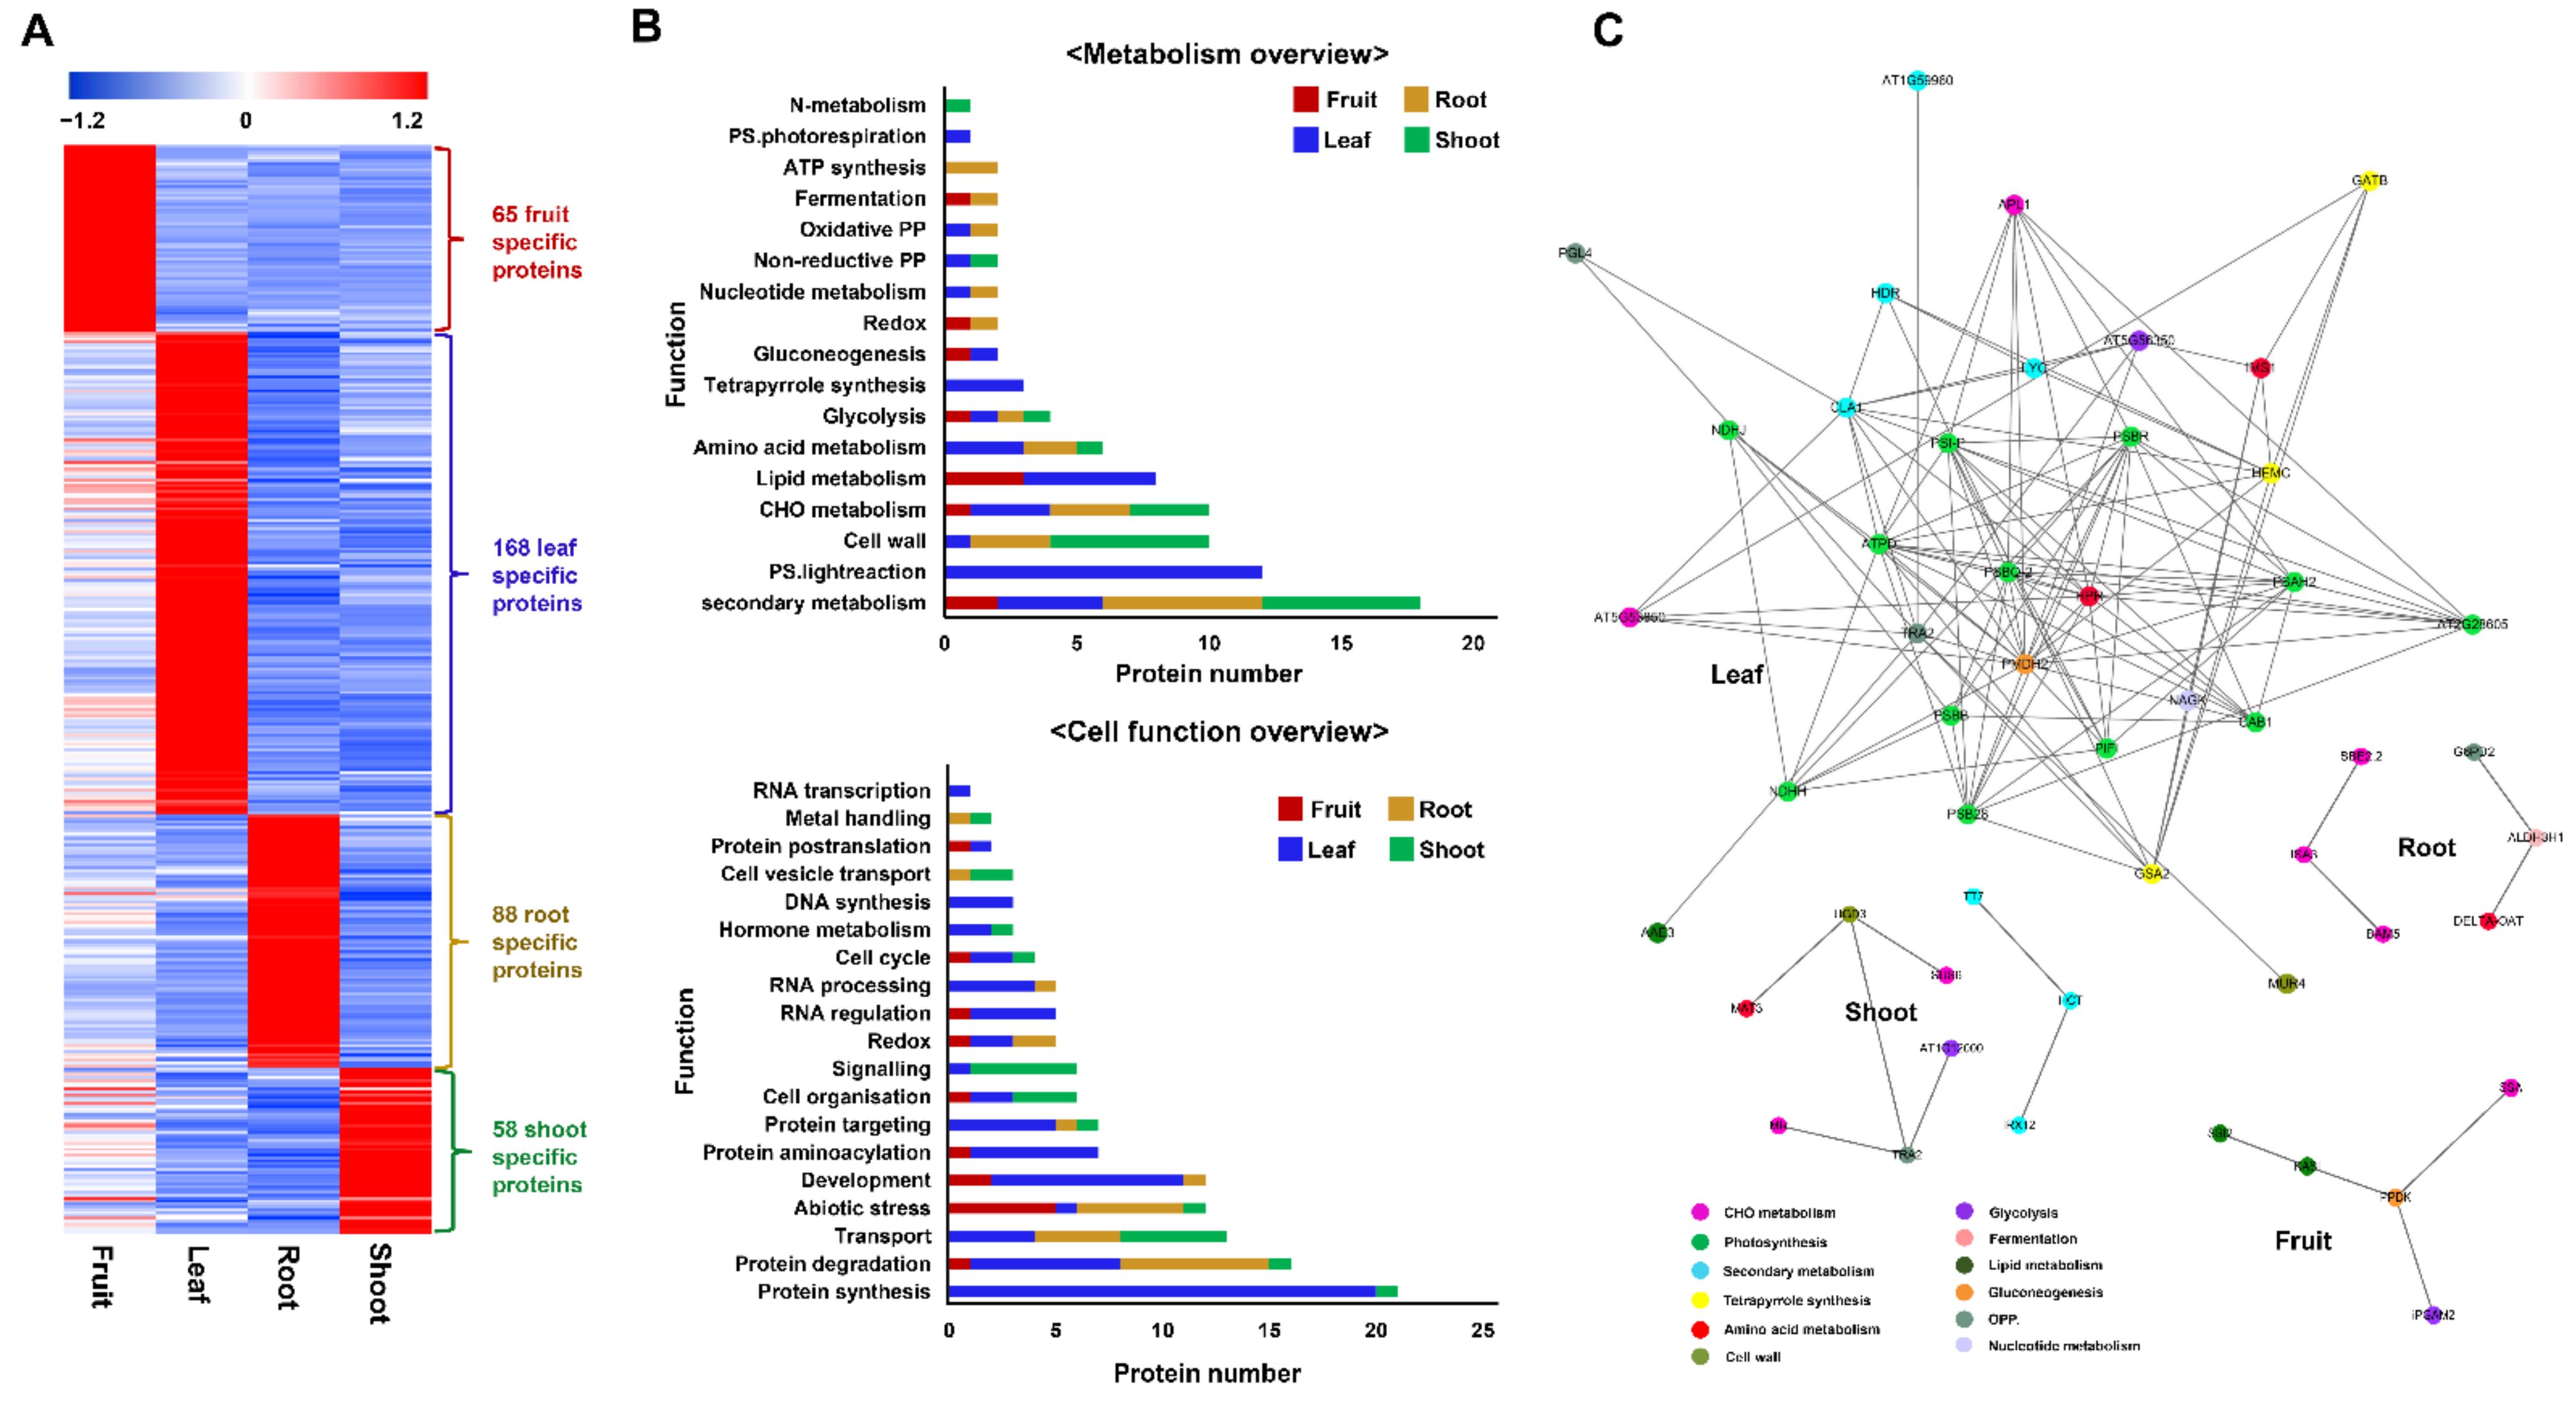
2.3.2. Functions of Tissue-Specific Proteins
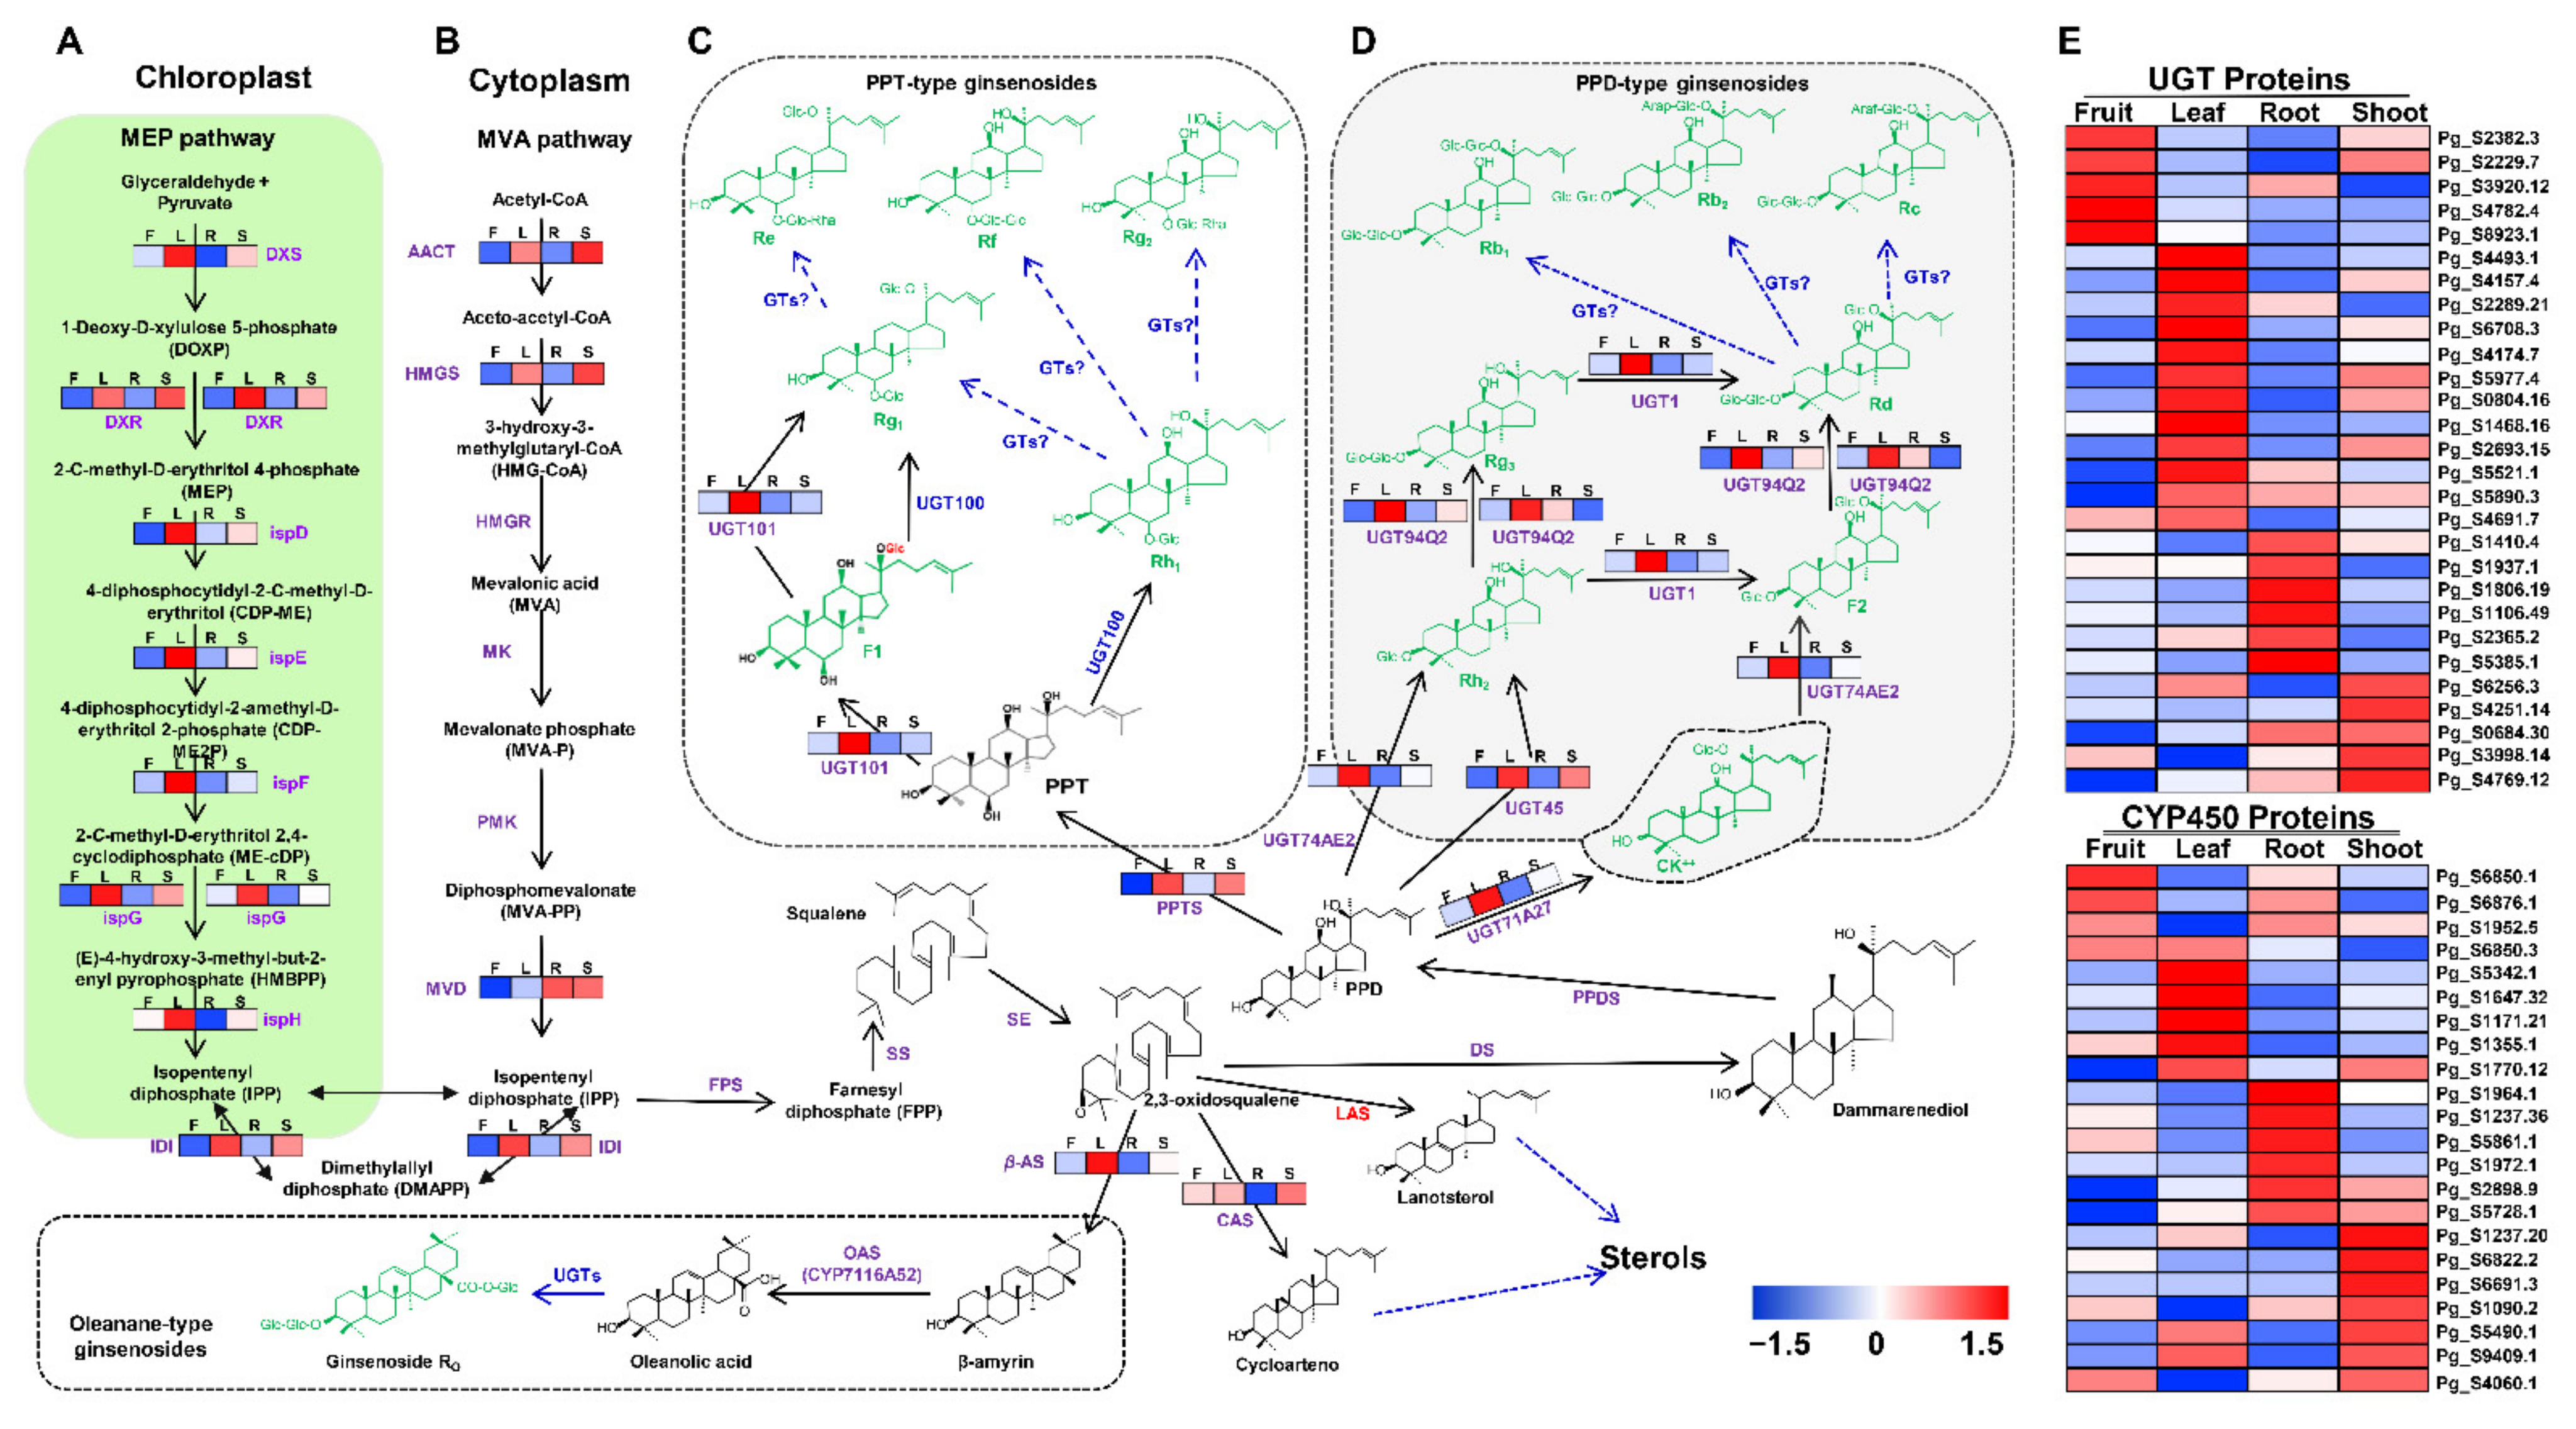
2.4. Decoding the Proteome Modulations in Association with Ginsenoside Biosynthesis
3. Materials and Methods
3.1. Plant Materials
3.2. Total Protein Extraction
3.3. Label-Free Quantitative Proteome Analysis Using Q-Exactive Mass Spectrometer
3.4. Data Processing Using MaxQuant Software
4. Conclusions
Supplementary Materials
Author Contributions
Funding
Institutional Review Board Statement
Informed Consent Statement
Data Availability Statement
Conflicts of Interest
References
- Wee, J.J.; Park, K.M.; Chung, A.S. Biological activities of ginseng and its application to human health. In Herbal Medicine: Biomolecular and Clinical Aspects, 2nd ed.; Benzie, I.F.F., Wachtel, G., Eds.; CRC Press/Taylor & Francis: Oxfordshire, UK, 2011; pp. 157–174. [Google Scholar] [CrossRef]
- Baeg, I.H.; So, S.H. The world ginseng market and the ginseng (Korea). J. Ginseng Res. 2013, 37, 1–7. [Google Scholar] [CrossRef] [PubMed] [Green Version]
- Ru, W.; Wang, D.; Xu, Y.; He, X.; Sun, Y.E.; Qian, L.; Zhou, X.; Qin, Y. Chemical constituents and bioactivities of Panax ginseng (C. A. Mey.). Drug Discov. Ther. 2011, 9, 23–32. [Google Scholar] [CrossRef] [Green Version]
- Jayakodi, M.; Choi, B.S.; Lee, S.C.; Kim, N.H.; Park, J.Y.; Jang, W.; Lakshmanan, M.; Mohan, S.V.G.; Lee, D.Y.; Yang, T.J. Ginseng Genome Database: An open-access platform for genomics of Panax ginseng. BMC Plant Biol. 2018, 18, 1–7. [Google Scholar] [CrossRef]
- Lee, Y.S.; Park, H.S.; Lee, D.K.; Jayakodi, M.; Kim, N.H.; Koo, H.J.; Lee, S.C.; Kim, Y.J.; Kwon, S.W.; Yang, T.J. Integrated transcriptomic and metabolomic analysis of five Panax ginseng cultivars reveals the dynamics of ginsenoside biosynthesis. Front. Plant Sci. 2017, 8, 1048. [Google Scholar] [CrossRef] [Green Version]
- Lei, X.; Wang, Z.; Song, J.; Liang, S.; Yao, L.; Hou, Z.; Wang, Y. Comparative Proteomic Analysis of Panax ginseng C. A. Meyer × Panax quinquefolius L. Leaves and Parental Lines. In Active Ingredients from Aromatic and Medicinal Plants, 1st ed.; El-Shemy, H., Ed.; InTechOpen: Rijeka, Croatia, 2017; pp. 127–142. [Google Scholar] [CrossRef] [Green Version]
- Kim, S.W.; Gupta, R.; Min, C.W.; Lee, S.H.; Cheon, Y.E.; Meng, Q.F.; Jang, J.W.; Hong, C.E.; Lee, J.Y.; Jo, I.H.; et al. Label-free quantitative proteomic analysis of Panax ginseng leaves upon exposure to heat stress. J. Ginseng Res. 2019, 43, 143–153. [Google Scholar] [CrossRef]
- Li, X.; Cheng, X.; Liao, B.; Xu, J.; Han, X.; Zhang, J.; Lin, Z.; Hu, L. Spatial protein expression of Panax ginseng by in-depth proteomic analysis for ginsenoside biosynthesis and transportation. J. Ginseng Res. 2020, 1–8. [Google Scholar] [CrossRef]
- Nam, M.H.; Kim, S.I.; Liu, J.R.; Yang, D.C.; Lim, Y.P.; Kwon, K.H.; Yoo, J.S.; Park, Y.M. Proteomic analysis of Korean ginseng (Panax ginseng C.A. Meyer). J. Chromatogr. B Anal. Technol. Biomed. Life Sci. 2005, 815, 147–155. [Google Scholar] [CrossRef]
- Amer, H.E.A. Purification of Proteins: Between Meaning and Different Methods. In Proteomics Technologies and Applications, 1st ed.; Abdurakhmonov, I.Y., Ed.; InTechOpen: London, UK, 2019; pp. 1–13. [Google Scholar] [CrossRef] [Green Version]
- Jiang, L.; He, L.; Fountoulakis, M. Comparison of protein precipitation methods for sample preparation prior to proteomic analysis. J. Chromatogr. A 2004, 1023, 317–320. [Google Scholar] [CrossRef] [PubMed]
- Wu, X.; Gong, F.; Wang, W. Protein extraction from plant tissues for 2DE and its application in proteomic analysis. Proteomics 2014, 14, 645–658. [Google Scholar] [CrossRef] [PubMed]
- Wessel, D.; Flügge, U.I. A method for the quantitative recovery of protein in dilute solution in the presence of detergents and lipids. Anal. Biochem. 1984, 138, 141–143. [Google Scholar] [CrossRef]
- Wu, X.; Xiong, E.; Wang, W.; Scali, M.; Cresti, M. Universal sample preparation method integrating trichloroacetic acid/acetone precipitation with phenol extraction for crop proteomic analysis. Nat. Protoc. 2014, 9, 362–374. [Google Scholar] [CrossRef]
- Ashwin, N.M.R.; Barnabas, L.; Ramesh Sundar, A.; Malathi, P.; Viswanathan, R.; Masi, A.; Agrawal, G.K.; Rakwal, R. Advances in proteomic technologies and their scope of application in understanding plant–pathogen interactions. J. Plant Biochem. Biotechnol. 2017, 26, 371–386. [Google Scholar] [CrossRef]
- Ma, R.; Sun, L.; Chen, X.; Mei, B.; Chang, G.; Wang, M.; Zhao, D. Proteomic analyses provide novel insights into plant growth and ginsenoside biosynthesis in forest cultivated Panax ginseng (F. Ginseng). Front. Plant Sci. 2016, 7, 1–16. [Google Scholar] [CrossRef] [PubMed] [Green Version]
- Sun, L.W.; Ma, P.T.; Li, D.N.; Lei, X.J.; Ma, R.; Qi, C. Protein extraction from the stem of Panax ginseng C. A. Meyer: A tissue of lower protein extraction efficiency for proteomic analysis. Afr. J. Biotechnol. 2011, 10, 4328–4333. [Google Scholar] [CrossRef]
- Wang, K.; Jiang, S.; Sun, C.; Lin, Y.; Yin, R.; Wang, Y.; Zhang, M. The spatial and temporal transcriptomic landscapes of ginseng, Panax ginseng C. A. Meyer. Sci. Rep. 2015, 5, 1–12. [Google Scholar] [CrossRef] [PubMed]
- Wang, H.; Peng, D.; Xie, J. Ginseng leaf-stem: Bioactive constituents and pharmacological functions. Chin. Med. 2009, 4, 20. [Google Scholar] [CrossRef] [Green Version]
- Niu, L.; Zhang, H.; Wu, Z.; Wang, Y.; Liu, H.; Wu, X.; Wang, W. Modified TCA/acetone precipitation of plant proteins for proteomic analysis. PLoS ONE 2018, 13, 1–13. [Google Scholar] [CrossRef] [PubMed] [Green Version]
- Mikulášek, K.; Konečná, H.; Potěšil, D.; Holánková, R.; Havliš, J.; Zdráhal, Z. SP3 Protocol for Proteomic Plant Sample Preparation Prior LC-MS/MS. Front. Plant Sci. 2021, 12, 635550. [Google Scholar] [CrossRef]
- Sielaff, M.; Kuharev, J.; Bohn, T.; Hahlbrock, J.; Bopp, T.; Tenzer, S.; Distler, U. Evaluation of FASP, SP3, and iST Protocols for Proteomic Sample Preparation in the Low Microgram Range. J. Proteome Res. 2017, 16, 4060–4072. [Google Scholar] [CrossRef]
- Ameni, G.; Pieper, R.; Yu, Y. S-Trap, an Ultrafast Sample-Preparation Approach for Shotgun Proteomics. J. Proteome Res. 2018, 17, 2917–2924. [Google Scholar] [CrossRef]
- Jo, I.H.; Lee, J.; Hong, C.E.; Lee, D.J.; Bae, W.; Park, S.G.; Ahn, Y.J.; Kim, Y.C.; Kim, J.U.; Lee, J.W.; et al. Isoform sequencing provides a more comprehensive view of the Panax ginseng transcriptome. Genes 2017, 8, 228. [Google Scholar] [CrossRef] [Green Version]
- Heldt, H.W. Plant Biochemistry, 3rd ed.; Elsevier Academic Press: San Diego, CA, USA, 2005; pp. 45–100. [Google Scholar]
- Mooney, B.P.; Miernyk, J.A.; Michael Greenlief, C.; Thelen, J.J. Using quantitative proteomics of Arabidopsis roots and leaves to predict metabolic activity. Physiol. Plant 2006, 128, 237–250. [Google Scholar] [CrossRef]
- Marcon, C.; Malik, W.A.; Walley, J.W.; Shen, Z.; Paschold, A.; Smith, L.G.; Piepho, H.P.; Briggs, S.P.; Hochholdinger, F. A high-resolution tissue-specific proteome and phosphoproteome atlas of maize primary roots reveals functional gradients along the root axes. Plant Physiol. 2015, 168, 233–246. [Google Scholar] [CrossRef] [PubMed]
- Seung, I.K.; Kweon, S.M.; Kim, E.A.; Jin, Y.K.; Kim, S.; Jong, S.Y.; Young, M.P. Characterization of RNase-like major storage protein from the ginseng root by proteomic approach. J. Plant Physiol. 2004, 161, 837–845. [Google Scholar] [CrossRef]
- Kim, Y.J.; Zhang, D.; Yang, D.C. Biosynthesis and biotechnological production of ginsenosides. Biotechnol. Adv. 2015, 33, 717–735. [Google Scholar] [CrossRef] [PubMed]
- Yang, J.L.; Hu, Z.F.; Zhang, T.T.; Gu, A.D.; Gong, T.; Zhu, P. Progress on the studies of the key enzymes of ginsenoside biosynthesis. Molecules 2018, 23, 589. [Google Scholar] [CrossRef] [Green Version]
- Zhao, S.; Wang, L.; Liu, L.; Liang, Y.; Sun, Y.; Wu, J. Both the mevalonate and the non-mevalonate pathways are involved in ginsenoside biosynthesis. Plant Cell Rep. 2014, 33, 393–400. [Google Scholar] [CrossRef]
- Kang, O.J.; Kim, J.S. Comparison of ginsenoside contents in different parts of Korean ginseng (Panax ginseng C.A. Meyer). Prev. Nutr. Food Sci. 2016, 21, 389–392. [Google Scholar] [CrossRef] [Green Version]
- Hoshino, Y.; Gaucher, E.A. On the origin of isoprenoid biosynthesis. Mol. Biol. Evol. 2018, 35, 2185–2197. [Google Scholar] [CrossRef] [Green Version]
- Chen, S.; Luo, H.; Li, Y.; Sun, Y.; Wu, Q.; Niu, Y.; Song, J.; Lv, A.; Zhu, Y.; Sun, C.; et al. 454 EST analysis detects genes putatively involved in ginsenoside biosynthesis in Panax ginseng. Plant Cell Rep. 2011, 30, 1593–1601. [Google Scholar] [CrossRef]
- Xue, L.; He, Z.; Bi, X.; Xu, W.; Wei, T.; Wu, S.; Hu, S. Transcriptomic profiling reveals MEP pathway contributing to ginsenoside biosynthesis in Panax ginseng. BMC Genom. 2019, 20, 1–14. [Google Scholar] [CrossRef] [PubMed]
- Zhao, M.; Lin, Y.; Wang, Y.; Li, X.; Han, Y.; Wang, K.; Sun, C.; Wang, Y.; Zhang, M. Transcriptome analysis identifies strong candidate genes for ginsenoside biosynthesis and reveals its underlying molecular mechanism in Panax ginseng C.A. Meyer. Sci. Rep. 2019, 9, 1–10. [Google Scholar] [CrossRef] [PubMed]
- Kang, K.B.; Jayakodi, M.; Lee, Y.S.; Nguyen, V.B.; Park, H.S.; Koo, H.J.; Choi, I.Y.; Kim, D.H.; Chung, Y.J.; Ryu, B.; et al. Identification of candidate UDP-glycosyltransferases involved in protopanaxadiol-type ginsenoside biosynthesis in Panax ginseng. Sci. Rep. 2018, 8, 11744. [Google Scholar] [CrossRef] [PubMed]
- Jung, S.C.; Kim, W.; Park, S.C.; Jeong, J.; Park, M.K.; Lim, S.; Lee, Y.; Im, W.T.; Lee, J.H.; Choi, G.; et al. Two ginseng UDP-glycosyltransferases synthesize ginsenoside Rg3 and Rd. Plant Cell Physiol. 2014, 55, 2177–2188. [Google Scholar] [CrossRef] [PubMed] [Green Version]
- Wang, P.; Wei, Y.; Fan, Y.; Liu, Q.; Wei, W.; Yang, C.; Zhang, L.; Zhao, G.; Yue, J.; Yan, X.; et al. Production of bioactive ginsenosides Rh2 and Rg3 by metabolically engineered yeasts. Metab. Eng. 2015, 29, 97–105. [Google Scholar] [CrossRef] [PubMed]
- Wei, W.; Wang, P.; Wei, Y.; Liu, Q.; Yang, C.; Zhao, G.; Yue, J.; Yan, X.; Zhou, Z. Characterization of Panax ginseng UDP-glycosyltransferases catalyzing protopanaxatriol and biosyntheses of bioactive ginsenosides F1 and Rh1 in metabolically engineered yeasts. Mol. Plant 2015, 8, 1412–1424. [Google Scholar] [CrossRef] [Green Version]
- Gupta, R.; Min, C.W.; Kim, S.W.; Wang, Y.; Agrawal, G.K.; Rakwal, R.; Kim, S.G.; Lee, B.W.; Ko, J.M.; Baek, I.Y.; et al. Comparative investigation of seed coats of brown- versus yellow-colored soybean seeds using an integrated proteomics and metabolomics approach. Proteomics 2015, 15, 1706–1716. [Google Scholar] [CrossRef]
- Wiśniewski, J.R.; Zougman, A.; Nagaraj, N.; Mann, M. Universal sample preparation method for proteome analysis. Nat. Methods 2009, 6, 359–362. [Google Scholar] [CrossRef]
- Min, C.W.; Jung, W.Y.; Park, H.J.; Moon, K.B.; Ko, H.; Sohn, J.H.; Jeon, J.H.; Kim, H.S.; Gupta, R.; Kim, S.T.; et al. Label-free quantitative proteomic analysis determines changes in amino acid and carbohydrate metabolism in three cultivars of Jerusalem artichoke tubers. Plant Biotechnol. Rep. 2019, 13, 111–122. [Google Scholar] [CrossRef]
- Perez-Riverol, Y.; Csordas, A.; Bai, J.; Bernal-Llinares, M.; Hewapathirana, S.; Kundu, D.J.; Inuganti, A.; Griss, J.; Mayer, G.; Eisenacher, M.; et al. The PRIDE database and related tools and resources in 2019: Improving support for quantification data. Nucleic Acids Res. 2019, 47, D442–D450. [Google Scholar] [CrossRef]
- Tyanova, S.; Temu, T.; Cox, J. The MaxQuant computational platform for mass spectrometry-based shotgun proteomics. Nat. Protoc. 2016, 11, 2301–2319. [Google Scholar] [CrossRef] [PubMed]
- Tyanova, S.; Temu, T.; Sinitcyn, P.; Carlson, A.; Hein, M.Y.; Geiger, T.; Mann, M.; Cox, J. The Perseus computational platform for comprehensive analysis of (prote)omics data. Nat. Methods 2016, 731–740. [Google Scholar] [CrossRef]
- Usadel, B.; Poree, F.; Nagel, A.; Lohse, M.; Czedik-Eysenberg, A.; Stitt, M. A guide to using MapMan to visualize and compare Omics data in plants: A case study in the crop species, Maize. Plant Cell Environ. 2009, 32, 1211–1229. [Google Scholar] [CrossRef] [PubMed]
- Tian, T.; Liu, Y.; Yan, H.; You, Q.; Yi, X.; Du, Z.; Xu, W.; Su, Z. AgriGO v2.0: A GO analysis toolkit for the agricultural community, 2017 update. Nucleic Acids Res. 2017, 45, W122–W129. [Google Scholar] [CrossRef] [PubMed]
- Doncheva, N.T.; Morris, J.H.; Gorodkin, J.; Jensen, L.J. Cytoscape StringApp: Network Analysis and Visualization of Proteomics Data. J. Proteome Res. 2019, 18, 623–632. [Google Scholar] [CrossRef] [PubMed]
- Yu, C.S.; Cheng, C.W.; Su, W.C.; Chang, K.C.; Huang, S.W.; Hwang, J.K.; Lu, C.H. CELLO2GO: A Web Server for Protein Subcellular Localization Prediction with Functional Gene Ontology Annotation. PLoS ONE 2014, 9, e99368. [Google Scholar] [CrossRef] [PubMed] [Green Version]


Publisher’s Note: MDPI stays neutral with regard to jurisdictional claims in published maps and institutional affiliations. |
© 2021 by the authors. Licensee MDPI, Basel, Switzerland. This article is an open access article distributed under the terms and conditions of the Creative Commons Attribution (CC BY) license (https://creativecommons.org/licenses/by/4.0/).
Share and Cite
Van Nguyen, T.; Kim, S.-W.; Min, C.-W.; Gupta, R.; Lee, G.-H.; Jang, J.-W.; Rathi, D.; Shin, H.-W.; Jung, J.-Y.; Jo, I.-H.; et al. Optimization of Protein Isolation and Label-Free Quantitative Proteomic Analysis in Four Different Tissues of Korean Ginseng. Plants 2021, 10, 1409. https://doi.org/10.3390/plants10071409
Van Nguyen T, Kim S-W, Min C-W, Gupta R, Lee G-H, Jang J-W, Rathi D, Shin H-W, Jung J-Y, Jo I-H, et al. Optimization of Protein Isolation and Label-Free Quantitative Proteomic Analysis in Four Different Tissues of Korean Ginseng. Plants. 2021; 10(7):1409. https://doi.org/10.3390/plants10071409
Chicago/Turabian StyleVan Nguyen, Truong, So-Wun Kim, Cheol-Woo Min, Ravi Gupta, Gi-Hyun Lee, Jeong-Woo Jang, Divya Rathi, Hye-Won Shin, Ju-Young Jung, Ick-Hyun Jo, and et al. 2021. "Optimization of Protein Isolation and Label-Free Quantitative Proteomic Analysis in Four Different Tissues of Korean Ginseng" Plants 10, no. 7: 1409. https://doi.org/10.3390/plants10071409
APA StyleVan Nguyen, T., Kim, S.-W., Min, C.-W., Gupta, R., Lee, G.-H., Jang, J.-W., Rathi, D., Shin, H.-W., Jung, J.-Y., Jo, I.-H., Hong, W.-J., Jung, K.-H., Kim, S., Kim, Y.-J., & Kim, S.-T. (2021). Optimization of Protein Isolation and Label-Free Quantitative Proteomic Analysis in Four Different Tissues of Korean Ginseng. Plants, 10(7), 1409. https://doi.org/10.3390/plants10071409