
Different Rhizospheric pH Conditions Affect Nutrient Accumulations in Rice under Salinity Stress


Abstract
:1. Introduction
2. Results
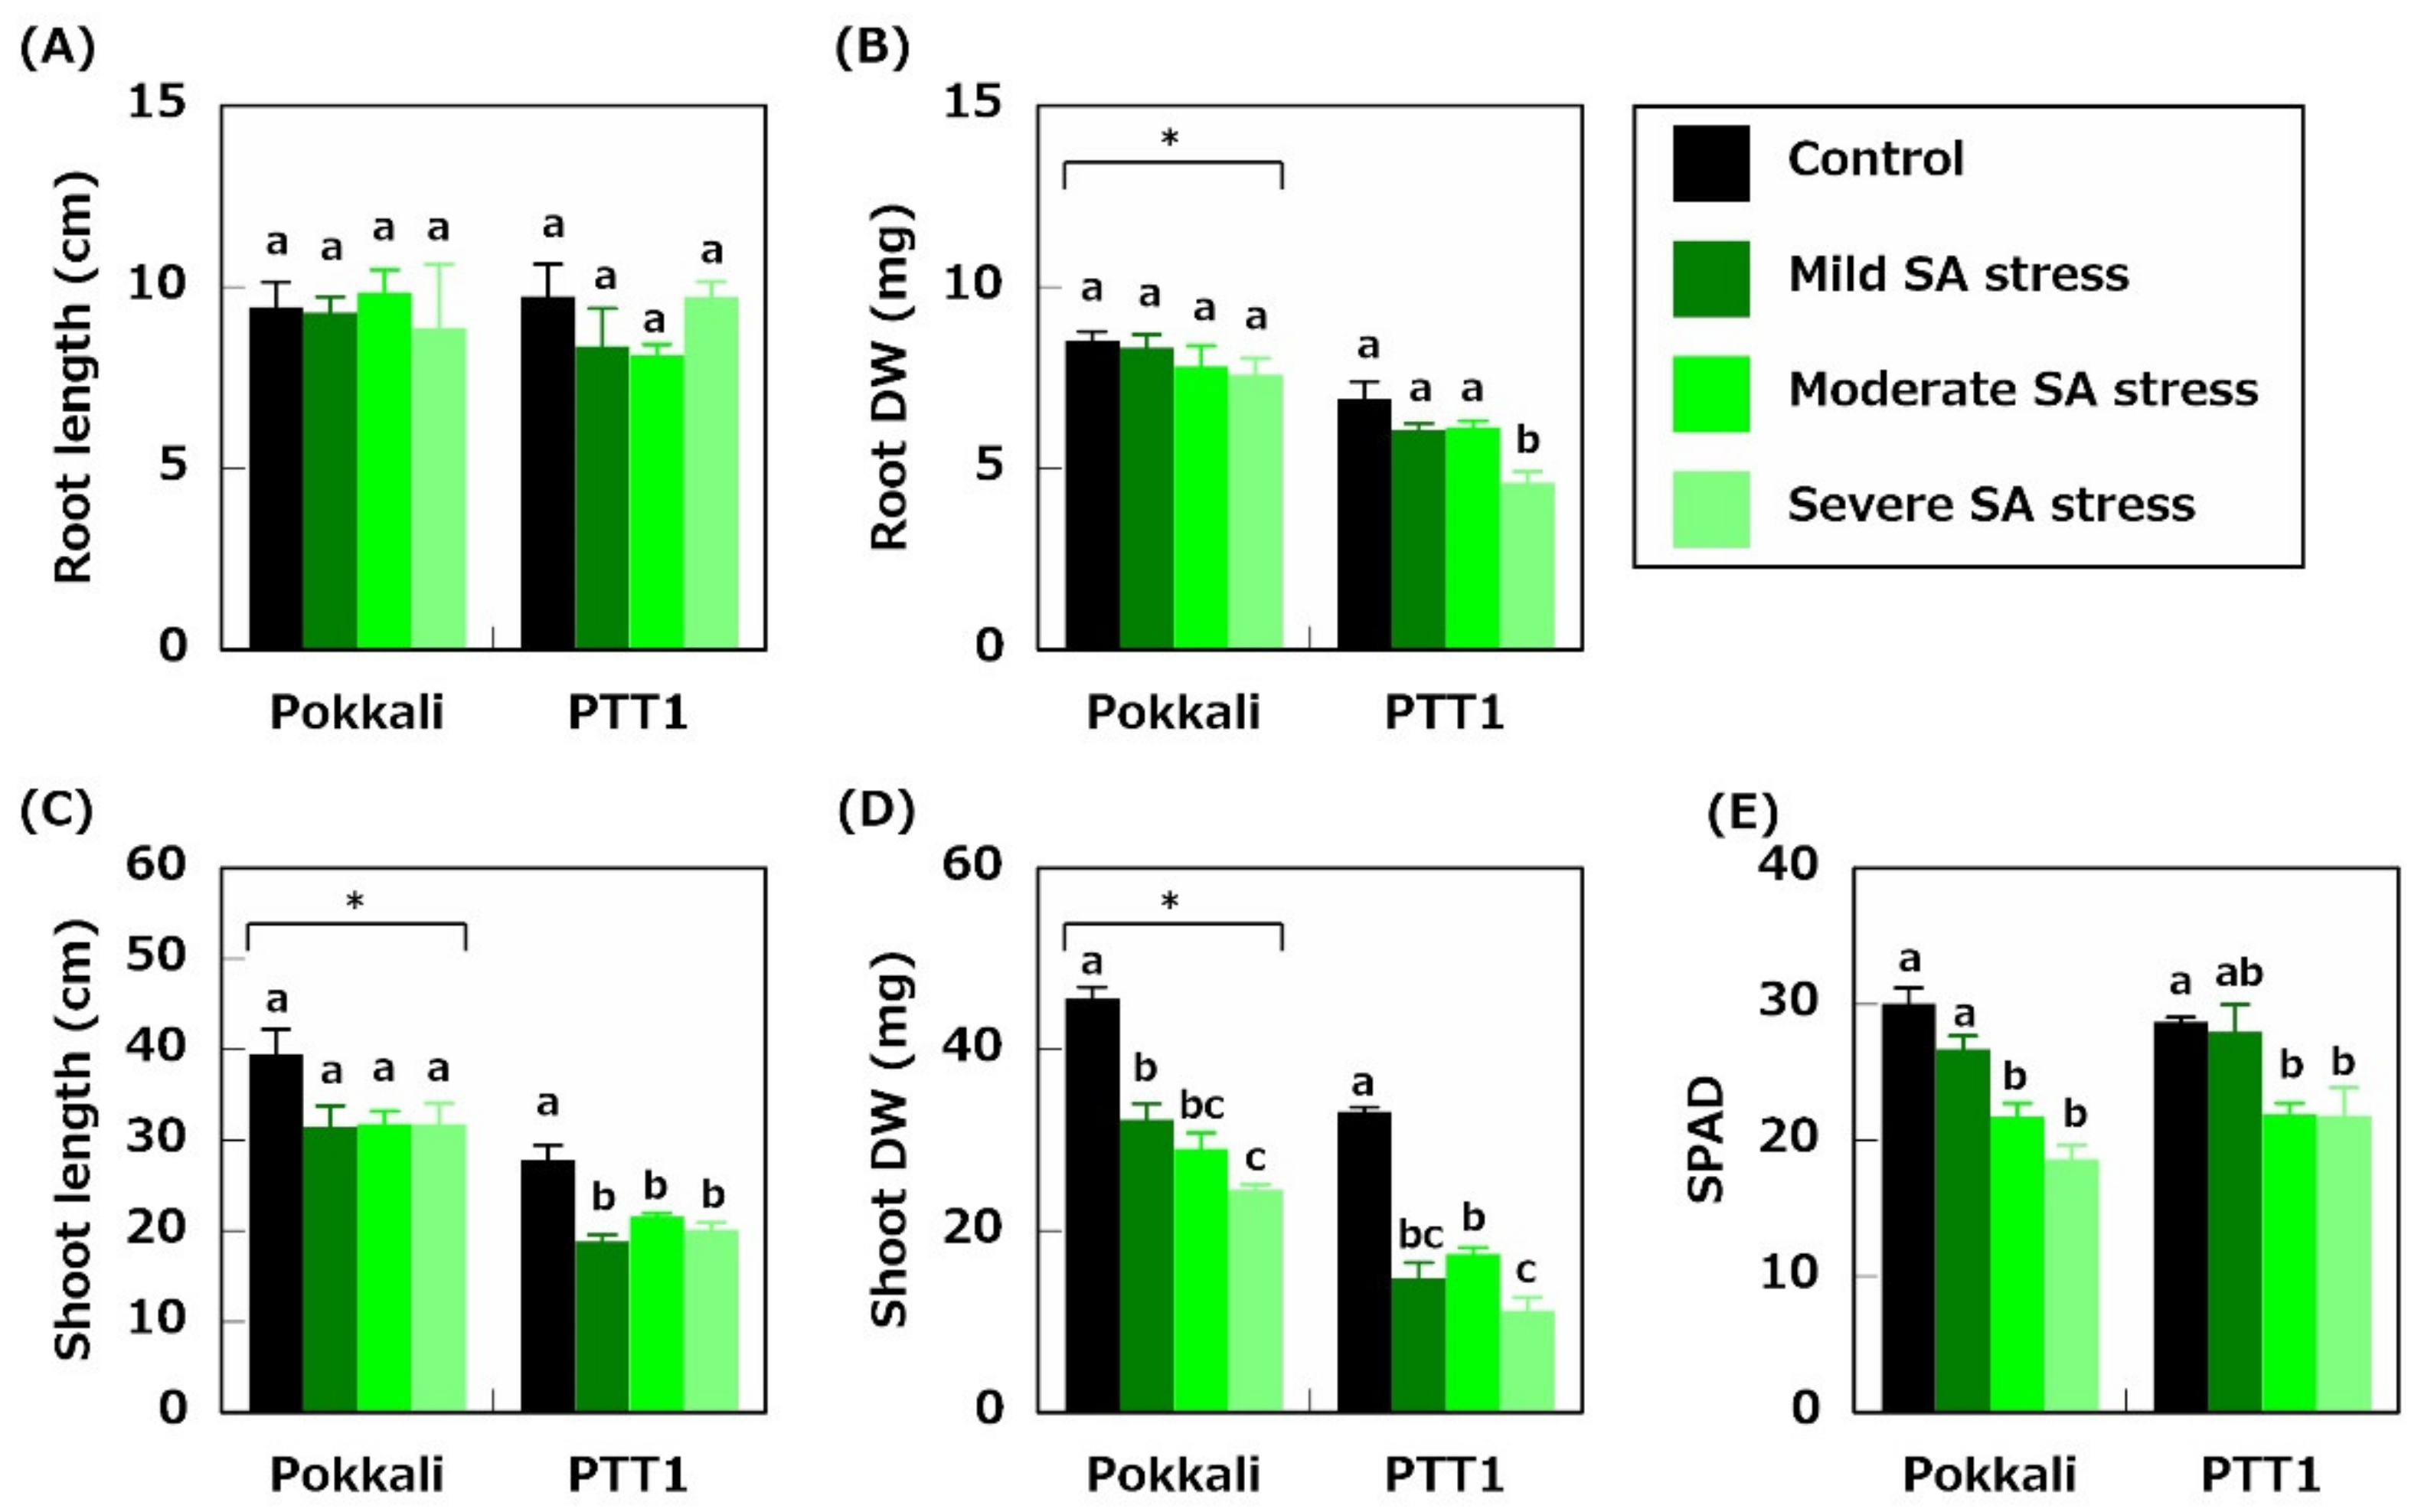
2.1. Plant Growth
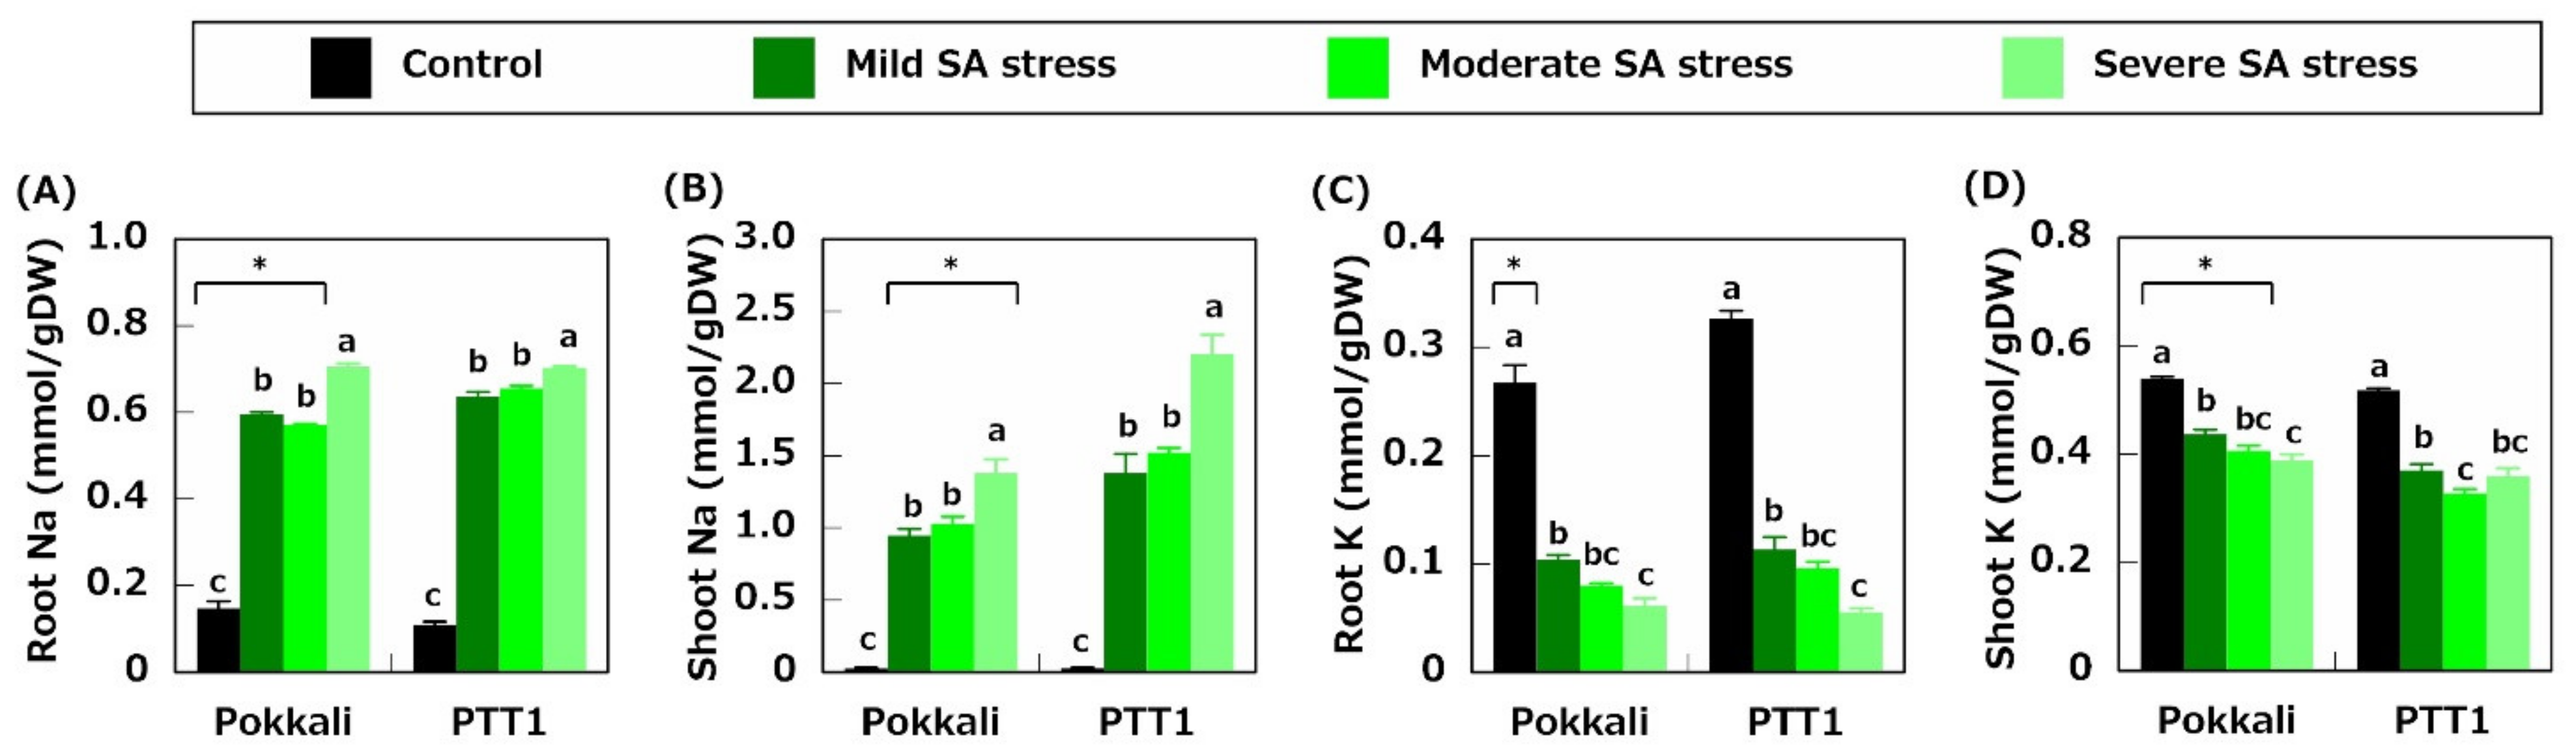
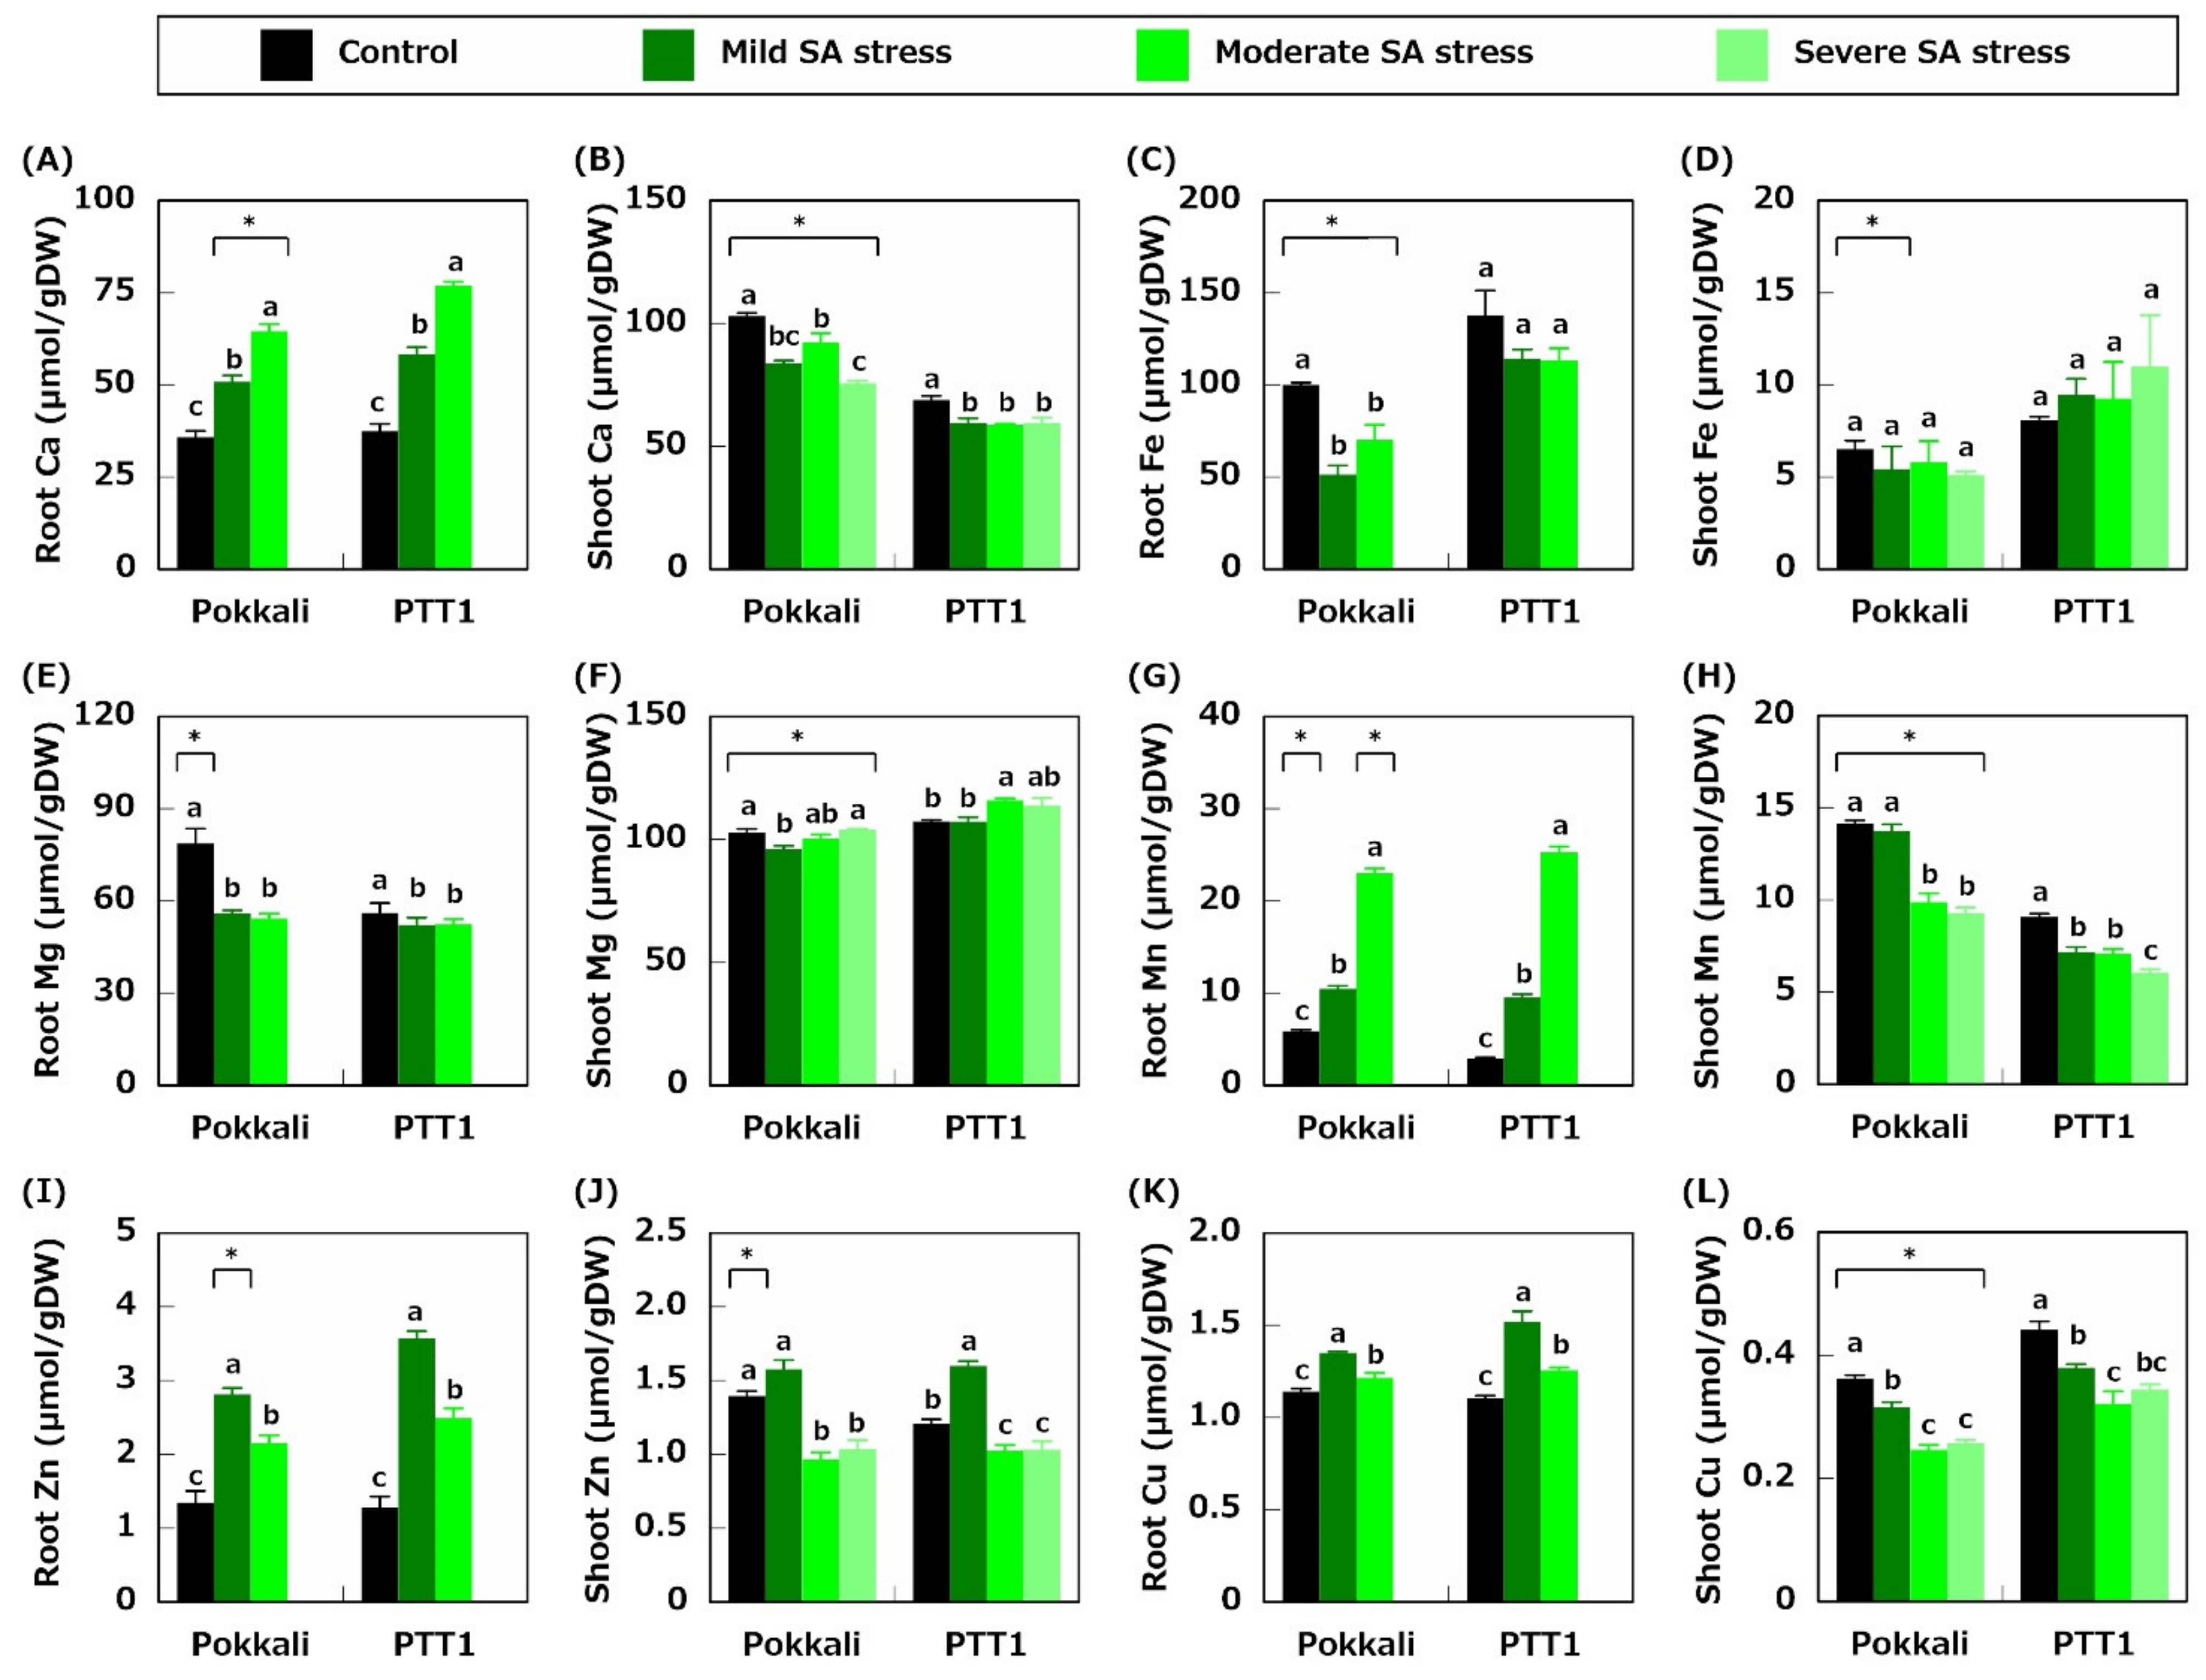
2.2. Ion Concentration
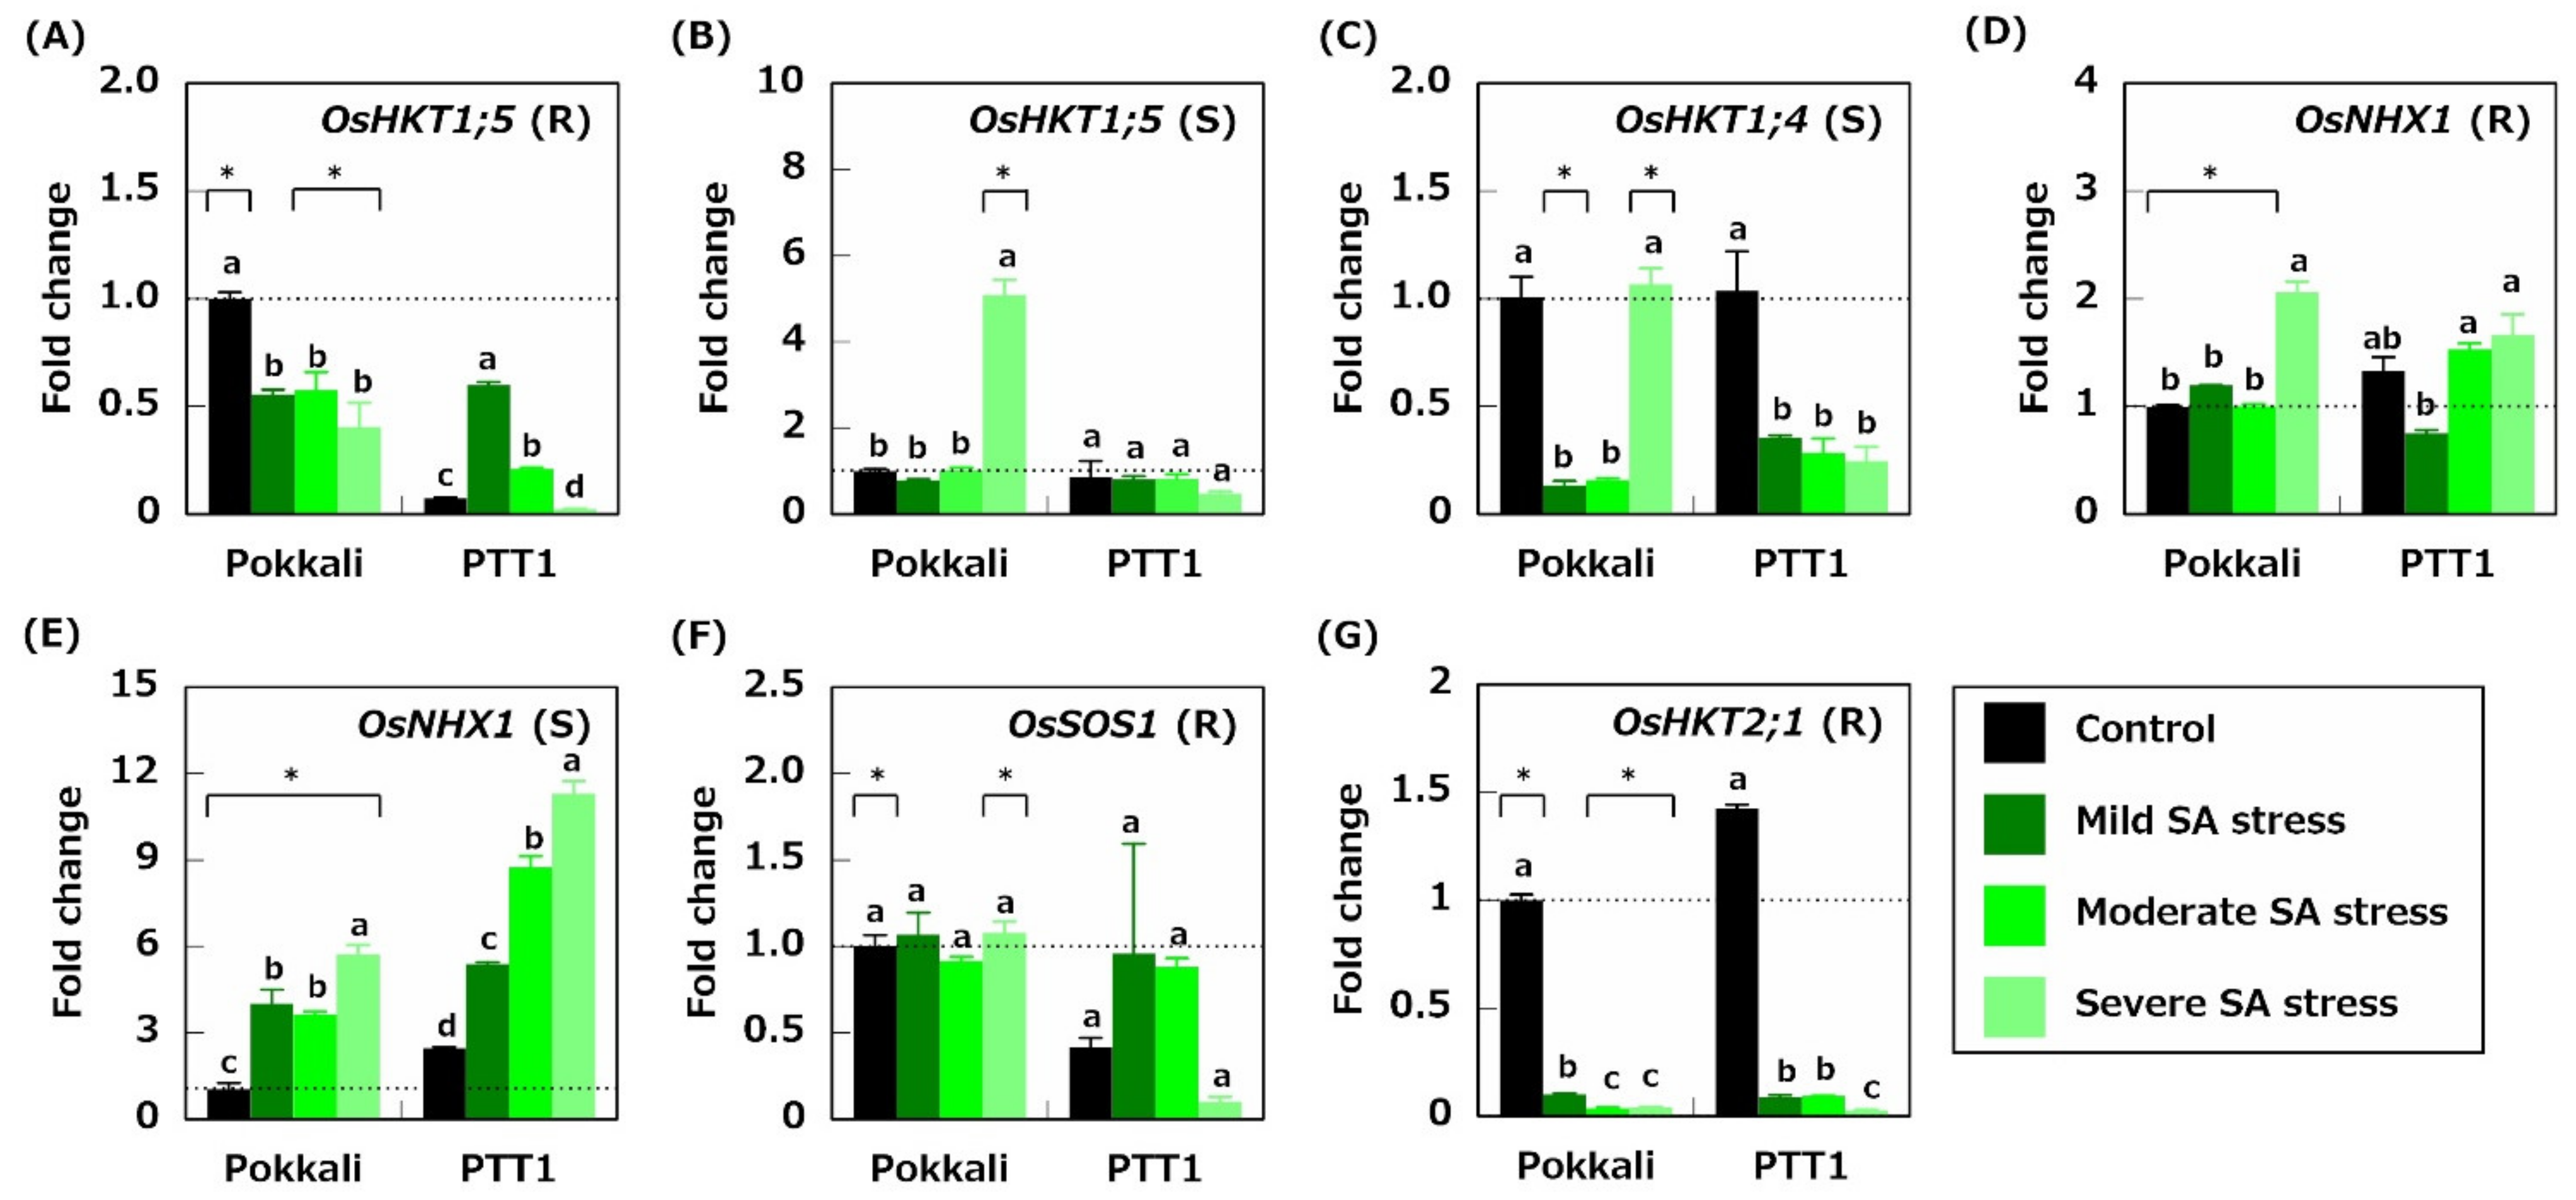
2.3. Gene Expression Related to Na+ Transport
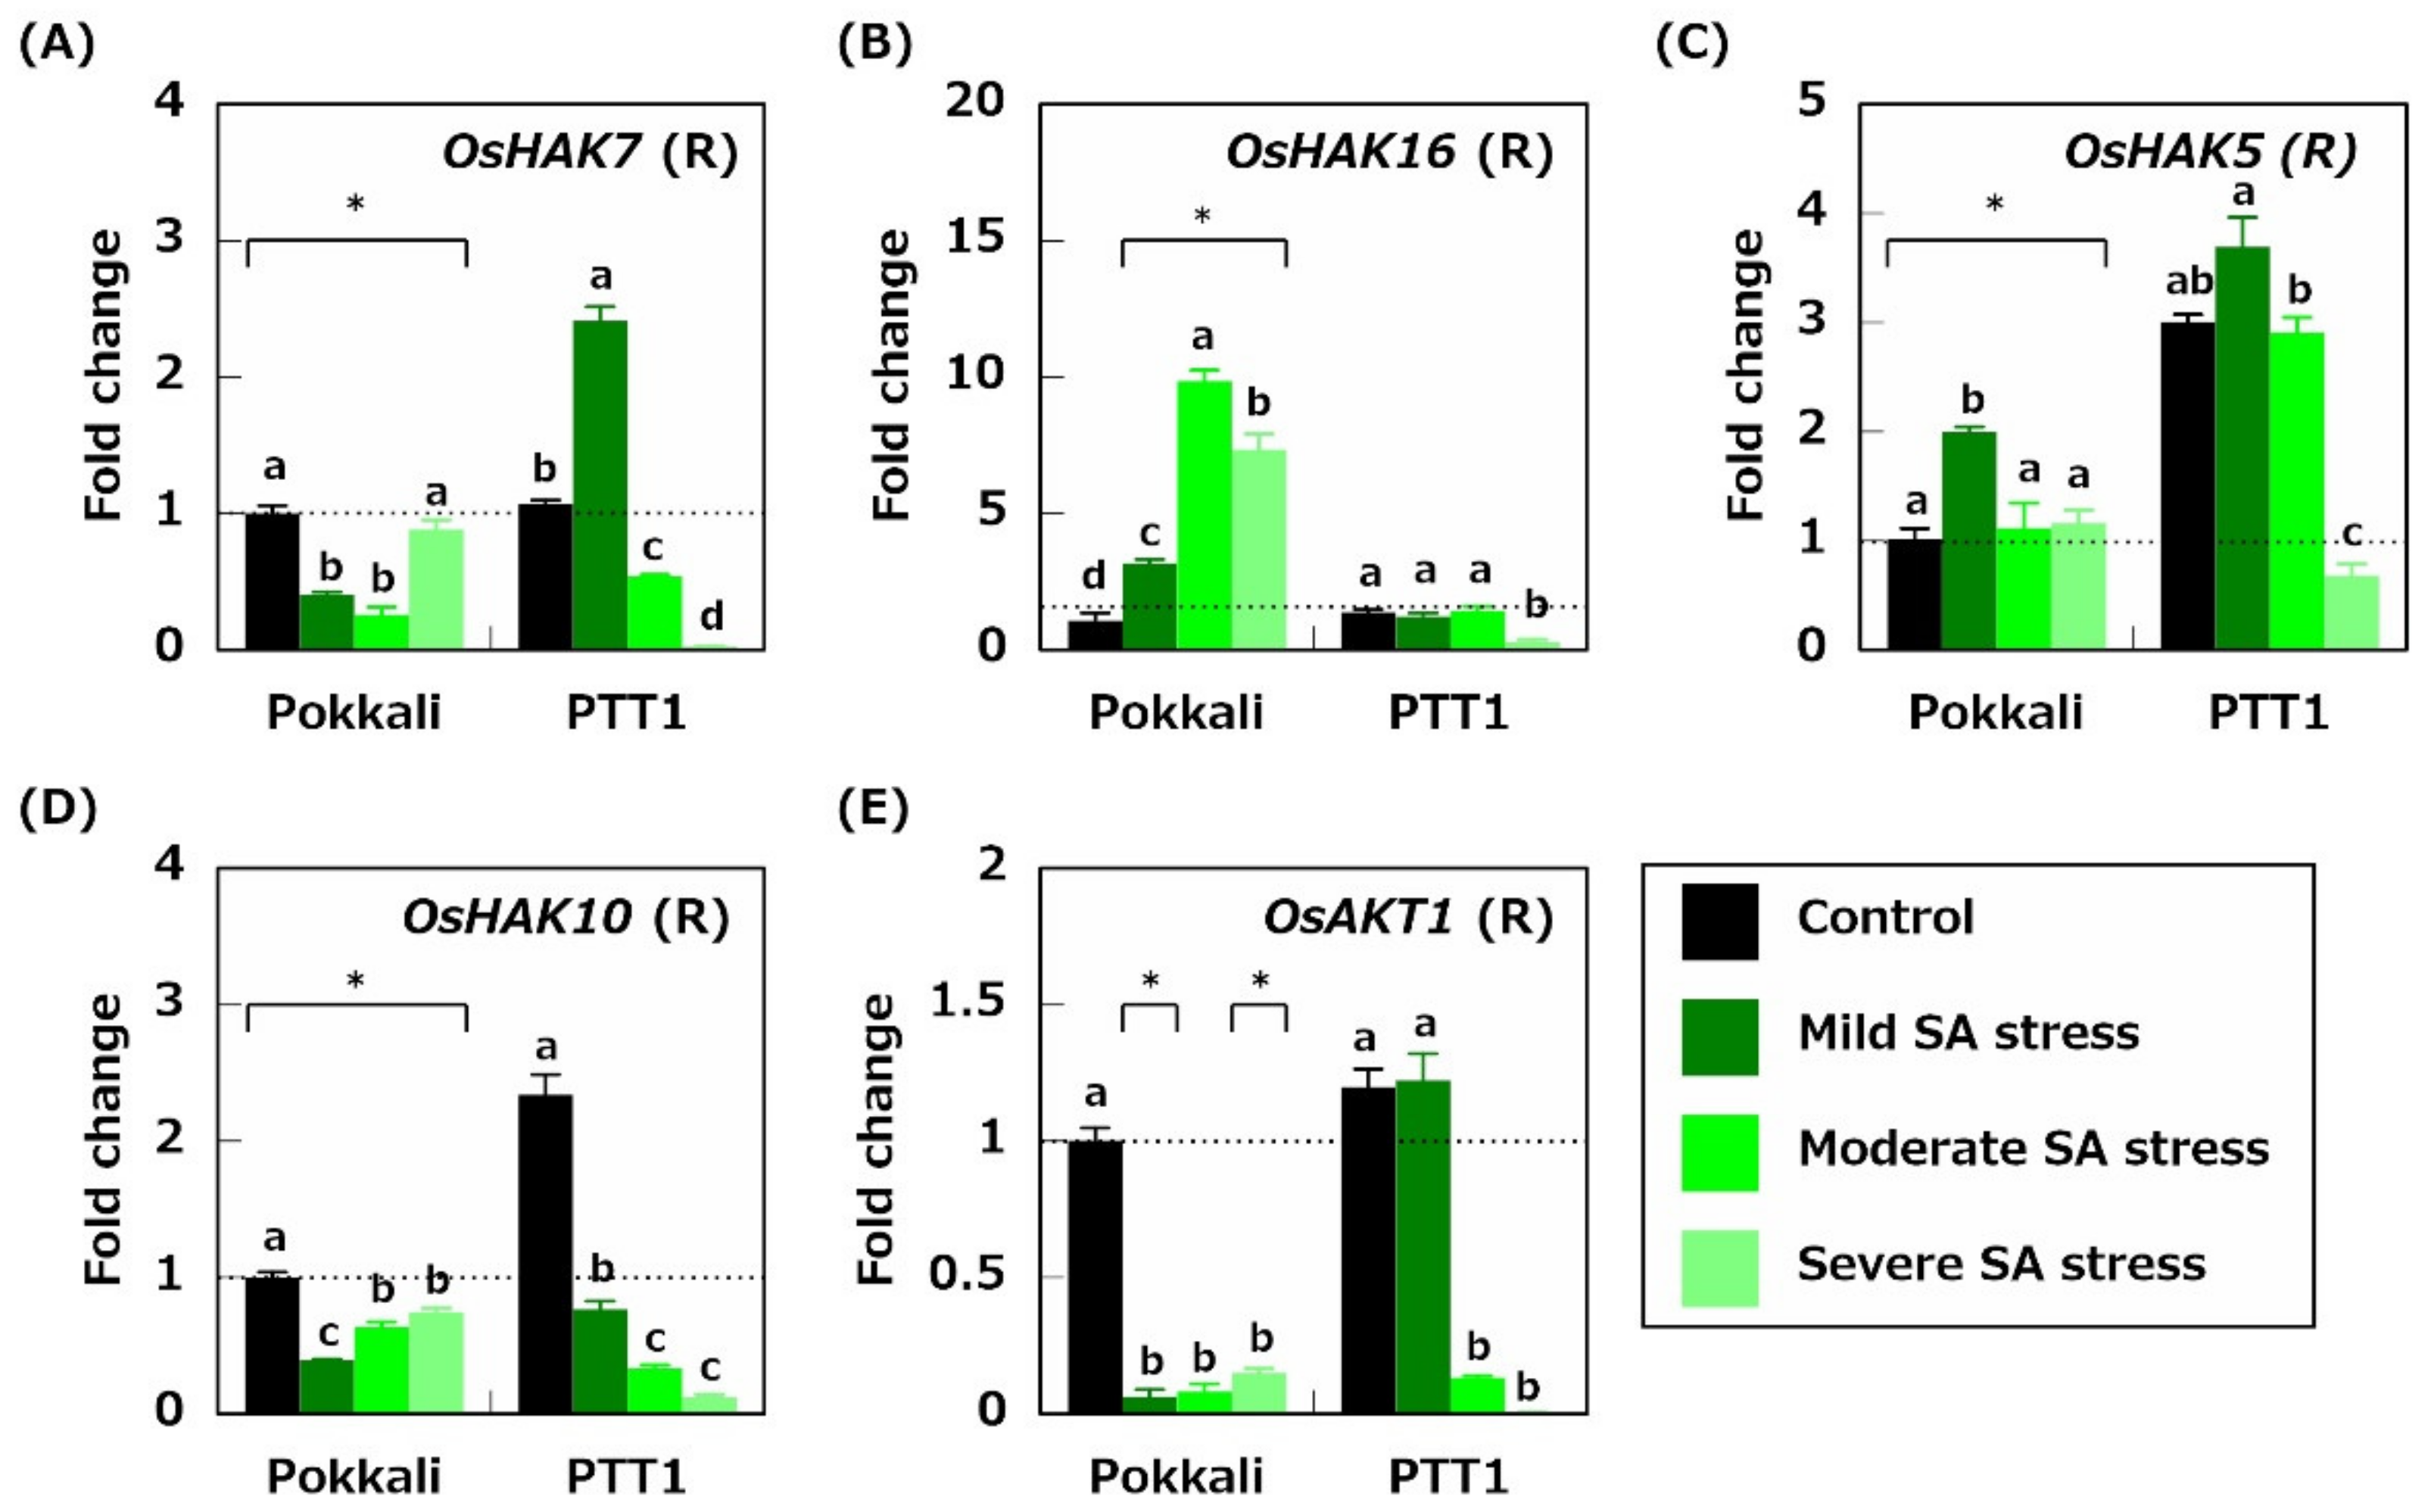
2.4. Gene Expression Related to K+ Acquisition and Transport
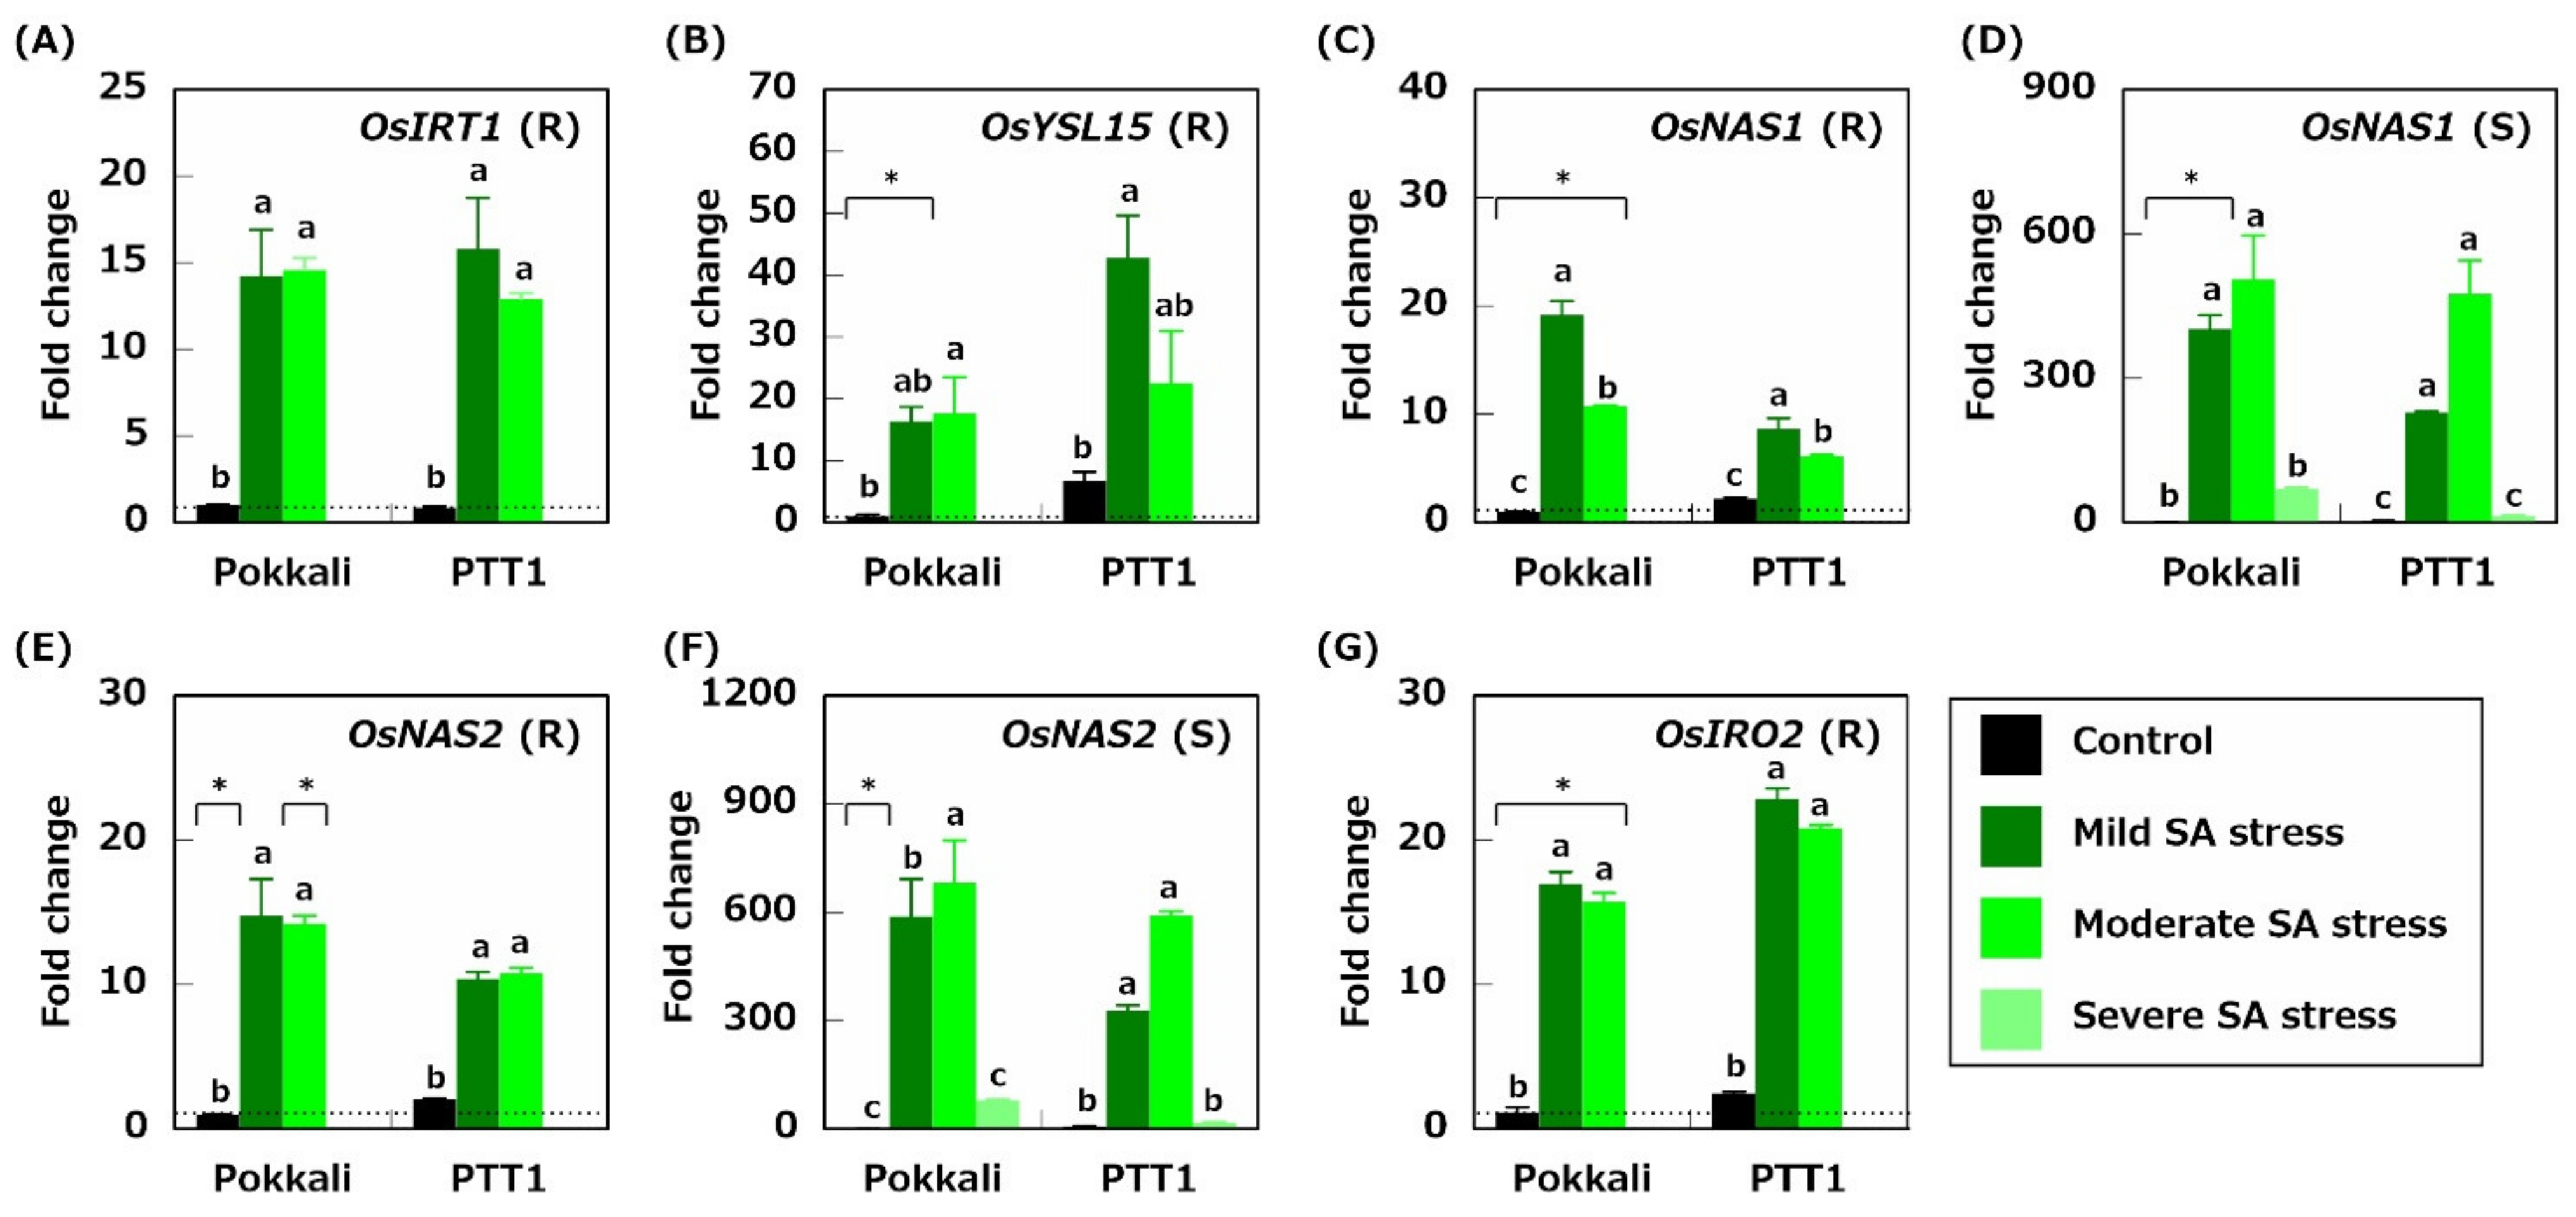
2.5. Genes Related to Fe Acquisition
3. Discussion
4. Materials and Methods
4.1. Plant Materials and Methods
4.2. Sampling
4.3. Element Analysis
4.4. Extraction of Total RNA, Reverse Transcription Reaction, qRT-PCR Using SYBR Green
4.5. Statistical Analysis
5. Conclusions
Author Contributions
Funding
Institutional Review Board Statement
Informed Consent Statement
Data Availability Statement
Conflicts of Interest
References
- Omuto, C.T.; Vargas, R.R.; El Mobarak, A.M.; Mohamed, N.; Viatkin, K.; Yigini, Y. Mapping of Salt-Affected Soils—Technical Manual; FAO: Rome, Italy, 2020. [Google Scholar]
- Munns, R.; Tester, M. Mechanisms of Salinity Tolerance. Annu. Rev. Plant Biol. 2008, 59, 651–681. [Google Scholar] [CrossRef] [Green Version]
- Yeo, A.R.; Lee, À.S.; Izard, P.; Boursier, P.J.; Flowers, T.J. Short- and long-term effects of salinity on leaf growth in rice (Oryza sativa L.). J. Exp. Bot. 1991, 42, 881–889. [Google Scholar] [CrossRef]
- Shi, H.; Ishitani, M.; Kim, C.; Zhu, J.-K. The Arabidopsis thaliana salt tolerance gene SOS1 encodes a putative Na+/H+ antiporter. Proc. Natl. Acad. Sci. USA 2000, 97, 6896–6901. [Google Scholar] [CrossRef] [Green Version]
- Zhu, J.K. Regulation of ion homeostasis under salt stress. Curr. Opin. Plant Biol. 2003, 6, 441–445. [Google Scholar] [CrossRef]
- Hauser, F.; Horie, T. A conserved primary salt tolerance mechanism mediated by HKT transporters: A mechanism for sodium exclusion and maintenance of high K+/Na+ ratio in leaves during salinity stress. Plant Cell Environ. 2010, 33, 552–565. [Google Scholar] [CrossRef]
- Kobayashi, N.I.; Yamaji, N.; Yamamoto, H.; Okubo, K.; Ueno, H.; Costa, A.; Tanoi, K.; Matsumura, H.; Fujii-Kashino, M.; Horiuchi, T.; et al. OsHKT1;5 mediates Na+ exclusion in the vasculature to protect leaf blades and reproductive tissues from salt toxicity in rice. Plant J. 2017, 91, 657–670. [Google Scholar] [CrossRef] [Green Version]
- Ren, Z.-H.; Gao, J.-P.; Li, L.-G.; Cai, X.-L.; Huang, W.; Chao, D.-Y.; Zhu, M.-Z.; Wang, Z.-Y.; Luan, S.; Lin, H.-X. A rice quantitative trait locus for salt tolerance encodes a sodium transporter. Nat. Genet. 2005, 37, 1141–1146. [Google Scholar] [CrossRef] [PubMed]
- Cotsaftis, O.; Plett, D.; Shirley, N.; Tester, M.; Hrmova, M. A Two-Staged Model of Na+ Exclusion in Rice Explained by 3D Modeling of HKT Transporters and Alternative Splicing. PLoS ONE 2012, 7, e39865. [Google Scholar] [CrossRef] [Green Version]
- Suzuki, K.; Yamaji, N.; Costa, A.; Okuma, E.; Kobayashi, N.I.; Kashiwagi, T.; Katsuhara, M.; Wang, C.; Tanoi, K.; Murata, Y.; et al. OsHKT1;4-mediated Na+ transport in stems contributes to Na+ exclusion from leaf blades of rice at the reproductive growth stage upon salt stress. BMC Plant Biol. 2016, 16, 22. [Google Scholar] [CrossRef] [PubMed] [Green Version]
- Fukuda, A.; Nakamura, A.; Tanaka, Y. Molecular cloning and expression of the Na+/H+ exchanger gene in Oryza sativa. Biochim Biophys. Acta 1999, 1446, 149–155. [Google Scholar] [CrossRef]
- Gaxiola, R.A.; Rao, R.; Sherman, A.; Grisafi, P.; Alper, S.L.; Fink, G.R. The Arabidopsis thaliana proton transporters, AtNhx1 and Avp1, can function in cation detoxification in yeast. Genetics 1999, 96, 1480–1485. [Google Scholar] [CrossRef] [Green Version]
- Yokoi, S.; Quintero, F.J.; Cubero, B.; Ruiz, M.T.; Bressan, R.A.; Hasegawa, P.M.; Pardo, J.M. Differential expression and function of Arabidopsis thaliana NHX Na+/H+ antiporters in the salt stress response. Plant J. 2002, 30, 529–539. [Google Scholar] [CrossRef] [Green Version]
- Fukuda, A.; Nakamura, A.; Hara, N.; Toki, S.; Tanaka, Y. Molecular and functional analyses of rice NHX-type Na+ /H+ antiporter genes. Planta 2010, 233, 175–188. [Google Scholar] [CrossRef]
- Huong, C.T.; Anh, T.T.T.; Dat, T.D.; Khanh, T.D.; Xuan, T.D. Uniparental inheritance of salinity tolerance and beneficial phytochemicals in rice. Agronomy 2020, 10, 1032. [Google Scholar] [CrossRef]
- Thomson, M.J.; de Ocampo, M.; Egdane, J.; Akhlasur Rahman, M.; Godwin Sajise, A.; Adorada, D.L.; Tumimbang-Raiz, E.; Blumwald, E.; Seraj, Z.I.; Singh, R.K.; et al. Characterizing the Saltol Quantitative Trait Locus for Salinity Tolerance in Rice. Rice 2010, 3, 148–160. [Google Scholar] [CrossRef] [Green Version]
- Pardo, J.M.; Cubero, B.; Leidi, E.O.; Quintero, F.J. Alkali cation exchangers: Roles in cellular homeostasis and stress tolerance. J. Exp. Bot. 2006, 57, 1181–1199. [Google Scholar] [CrossRef] [PubMed] [Green Version]
- Feng, H.; Tang, Q.; Cai, J.; Xu, B.; Xu, G.; Yu, L. Rice OsHAK16 functions in potassium uptake and translocation in shoot, maintaining potassium homeostasis and salt tolerance. Planta 2019, 250, 549–561. [Google Scholar] [CrossRef] [PubMed]
- Serrano, R.; Rodriguez-Navarro, A. Ion homeostasis during salt stress in plants. Curr. Opin. Cell Biol. 2001, 13, 399–404. [Google Scholar] [CrossRef]
- Yang, T.; Zhang, S.; Hu, Y.; Wu, F.; Hu, Q.; Chen, G.; Cai, J.; Wu, T.; Moran, N.; Yu, L.; et al. The role of a potassium transporter oshak5 in potassium acquisition and transport from roots to shoots in rice at low potassium supply levels. Plant Physiol. 2014, 166, 945–959. [Google Scholar] [CrossRef] [Green Version]
- Okada, T.; Yamane, S.; Yamaguchi, M.; Kato, K.; Shinmyo, A.; Tsunemitsu, Y.; Iwasaki, K.; Ueno, D.; Demura, T. Characterization of rice KT/HAK/KUP potassium transporters and K+ uptake by HAK1 from Oryza sativa. Plant Biotechnol. 2018, 35, 101–111. [Google Scholar] [CrossRef] [PubMed] [Green Version]
- Masuda, H.; Aung, M.S.; Kobayashi, T.; Hamada, T.; Nishizawa, N.K. Enhancement of Iron Acquisition in Rice by the Mugineic Acid Synthase Gene With Ferric Iron Reductase Gene and OsIRO2 Confers Tolerance in Submerged and Nonsubmerged Calcareous Soils. Front. Plant. Sci. 2019, 10, 1179. [Google Scholar] [CrossRef]
- Römheld, V.; Marschner, H. Evidence for a Specific Uptake System for Iron Phytosiderophores in Roots of Grasses. Plant Physiol. 1986, 80, 175–180. [Google Scholar] [CrossRef] [Green Version]
- Ishimaru, Y.; Suzuki, M.; Tsukamoto, T.; Suzuki, K.; Nakazono, M.; Kobayashi, T.; Wada, Y.; Watanabe, S.; Matsuhashi, S.; Takahashi, M.; et al. Rice plants take up iron as an Fe3+ -phytosiderophore and as Fe2+. Plant J. 2006, 45, 335–346. [Google Scholar] [CrossRef]
- Kobayashi, T.; Nakanishi Itai, R.; Nishizawa, N.K. Iron deficiency responses in rice roots. Rice 2014, 7, 1–11. [Google Scholar] [CrossRef] [Green Version]
- Curie, C.; Panaviene, Z.; Loulergue, C.; Dellaporta, S..L.; Briat, J.F.; Walker, E.L. Maize yellow stripe1 encodes a membrane protein directly involved in Fe(III) uptake. Nature 2001, 409, 346–349. [Google Scholar] [CrossRef]
- Kobayashi, T.; Nishizawa, N.K. Iron Uptake, Translocation, and Regulation in Higher Plants. Annu. Rev. Plant Biol. 2012, 63, 131–152. [Google Scholar] [CrossRef] [PubMed] [Green Version]
- Inoue, H.; Kobayashi, T.; Nozoye, T.; Takahashi, M.; Kakei, Y.; Suzuki, K.; Nakazono, M.; Nakanishi, H.; Mori, S.; Nishizawa, N.K. Rice OsYSL15 is an iron-regulated iron (III)-deoxymugineic acid transporter expressed in the roots and is essential for iron uptake in early growth of the seedlings. J. Biol. Chem. 2009, 284, 3470–3479. [Google Scholar] [CrossRef] [Green Version]
- Eide, D.; Broderius, M.; Fettt, J.; Guerinott, M.L. A novel iron-regulated metal transporter from plants identified by functional expression in yeast [Fe(II) transport/iron deficiency/strategy I response]. Biochemistry 1996, 93, 5624–5628. [Google Scholar]
- Vert, G.; Grotz, N.; Dédaldéchamp, F.; Gaymard, F.; Guerinot, M.L.; Briat, J.-F.; Curie, C. IRT1, an Arabidopsis Transporter Essential for Iron Uptake from the Soil and for Plant Growth. Plant Cell 2002, 14, 1223–1233. [Google Scholar] [CrossRef] [PubMed] [Green Version]
- Chuamnakthong, S.; Nampei, M.; Ueda, A. Characterization of Na+ exclusion mechanism in rice under saline-alkaline stress conditions. Plant Sci. 2019, 287, 110171. [Google Scholar] [CrossRef] [PubMed]
- Li, Q.; Yang, A.; Zhang, W.H.; Küpper, H. Efficient acquisition of iron confers greater tolerance to Saline-Alkaline stress in rice (Oryza sativa L.). J. Exp. Bot. 2016, 67, 6431–6444. [Google Scholar] [CrossRef] [PubMed] [Green Version]
- Chen, G.; Feng, H.; Hu, Q.; Qu, H.; Chen, A.; Yu, L.; Xu, G. Improving rice tolerance to potassium deficiency by enhancing OsHAK16p: WOX11-controlled root development. Plant Biotechnol. J. 2015, 13, 833–848. [Google Scholar] [CrossRef] [PubMed]
- Higuchi, K.; Suzuki, K.; Nakanishi, H.; Yamaguchi, H.; Nishizawa, N.-K.; Mori, S. Cloning of Nicotianamine Synthase Genes, Novel Genes Involved in the Biosynthesis of Phytosiderophores. Plant Physiol. 1999, 119, 471–479. [Google Scholar] [CrossRef] [PubMed] [Green Version]
- Inoue, H.; Higuchi, K.; Takahashi, M.; Nakanishi, H.; Mori, S.; Nishizawa, N.K. Three rice nicotianamine synthase genes, OsNAS1, OsNAS2, and OsNAS3 are expressed in cells involved in long-distance transport of iron and differentially regulated by iron. Plant J. 2003, 36, 366–381. [Google Scholar] [CrossRef]
- Camacho-Sanchez, M.; Burraco, P.; Gomez-Mestre, I.; Leonard, J.A. Preservation of RNA and DNA from mammal samples under field conditions. Mol. Ecol. Resour. 2013, 13, 663–673. [Google Scholar] [CrossRef] [PubMed] [Green Version]


| Treatment | Cultivar | Root | Shoot |
|---|---|---|---|
| Control | Pokkali PTT1 | 0.56 ± 0.02 c * 0.34 ± 0.01 c | 0.05 ± 0.01 c 0.06 ± 0.00 c |
| Mild SA stress (50 mM Na + pH 7.0) | Pokkali PTT1 | 5.76 ± 0.17 b 5.80 ± 0.71 b | 2.16 ± 0.08 b * 3.76 ± 0.48 b |
| Moderate SA stress (50 mM Na + pH 8.0) | Pokkali PTT1 | 7.14 ± 0.15 b 6.87 ± 0.34 b | 2.53 ± 0.14 b * 4.66 ± 0.19 ab |
| Sever SA stress (50 mM Na + pH 9.0) | Pokkali PTT1 | 11.80 ± 0.89 a * 12.85 ± 0.72 a | 3.55 ± 0.24 a * 6.19 ± 0.64 a |
Publisher’s Note: MDPI stays neutral with regard to jurisdictional claims in published maps and institutional affiliations. |
© 2021 by the authors. Licensee MDPI, Basel, Switzerland. This article is an open access article distributed under the terms and conditions of the Creative Commons Attribution (CC BY) license (https://creativecommons.org/licenses/by/4.0/).
Share and Cite
Nampei, M.; Jiadkong, K.; Chuamnakthong, S.; Wangsawang, T.; Sreewongchai, T.; Ueda, A. Different Rhizospheric pH Conditions Affect Nutrient Accumulations in Rice under Salinity Stress. Plants 2021, 10, 1295. https://doi.org/10.3390/plants10071295
Nampei M, Jiadkong K, Chuamnakthong S, Wangsawang T, Sreewongchai T, Ueda A. Different Rhizospheric pH Conditions Affect Nutrient Accumulations in Rice under Salinity Stress. Plants. 2021; 10(7):1295. https://doi.org/10.3390/plants10071295
Chicago/Turabian StyleNampei, Mami, Kamonthip Jiadkong, Sumana Chuamnakthong, Thanakorn Wangsawang, Tanee Sreewongchai, and Akihiro Ueda. 2021. "Different Rhizospheric pH Conditions Affect Nutrient Accumulations in Rice under Salinity Stress" Plants 10, no. 7: 1295. https://doi.org/10.3390/plants10071295
APA StyleNampei, M., Jiadkong, K., Chuamnakthong, S., Wangsawang, T., Sreewongchai, T., & Ueda, A. (2021). Different Rhizospheric pH Conditions Affect Nutrient Accumulations in Rice under Salinity Stress. Plants, 10(7), 1295. https://doi.org/10.3390/plants10071295