Review

Recent 1D and 2D TD–NMR Pulse Sequences for Plant Science

by
Tatiana Monaretto
1,2,
Tiago Bueno Moraes
3 and
Luiz Alberto Colnago
2,*
1
Instituto de Química de São Carlos, Universidade de São Paulo, Av. Trabalhador São-Carlense, 400, São Carlos 13566-590, SP, Brazil
2
Embrapa Instrumentação, Rua XV de Novembro, 1452, São Carlos 13560-970, SP, Brazil
3
Departamento de Química, Instituto de Ciências Exatas, Universidade Federal de Minas Gerais, Av. Antônio Carlos, 6627, Belo Horizonte 31270-901, MG, Brazil
*
Author to whom correspondence should be addressed.
Plants 2021, 10(5), 833; https://doi.org/10.3390/plants10050833
Submission received: 23 March 2021 / Revised: 13 April 2021 / Accepted: 19 April 2021 / Published: 21 April 2021
(This article belongs to the Special Issue Applied Time-Domain NMR and MRI to Plants Research)

Abstract

:
Time domain nuclear magnetic resonance (TD–NMR) has been widely applied in plant science in the last four decades. Several TD–NMR instruments and methods have been developed for laboratory, green-house, and field studies. This mini-review focuses on the recent TD–NMR pulse sequences applied in plant science. One of the sequences measures the transverse relaxation time (T2) with minimal sample heating, using a lower refocusing flip angle and consequently lower specific absorption rate than that of conventional CPMG. Other sequences are based on a continuous wave free precession (CWFP) regime used to enhance the signal-to-noise ratio, to measure longitudinal (T1) and transverse relaxation time in a single shot experiment, and as alternative 2D pulse sequences to obtain T1–T2 and diffusion-T1 correlation maps. This review also presents some applications of these sequences in plant science.

1. Introduction

The fast and non-invasive methods to determine oil content in oilseeds were the first applications of time domain nuclear magnetic resonance (TD–NMR) in plant science, and they have since been used in germplasm evaluation and plant breeding programs [1]. The analyses of oilseeds, with low moisture content, are performed by measuring the intensity of free induction decay (FID) after a radiofrequency (rf) pulse. The measurements are performed at 50 μs to avoid interference of solid components (proteins, carbohydrates). Spin-echo sequence has been used to measure moisture and oil content. The oil content is calculated by the echo intensity at 7 ms and the moisture content by the difference between the FID (at 50 μs) and echo intensities [2].
Pulse sequences to measure longitudinal (T1) and transverse (T2) relaxation times, the self-diffusion coefficient (D), and flow [3] have been used in plant science for approximately four decades. Saturation-recovery (SR) or inversion-recovery (IR) sequences measure T1 [4], the Carr-Purcell-Meiboom-Gill (CPMG) sequence measures T2 [5], while pulse field gradient (PFG) sequences measure diffusion or flow [6,7,8,9].
Two-dimension (2D) experiments are also used in plant science to reduce peak overlap and obtain correlation between relaxation times (T1–T2) and between diffusion and T2 (T2–D) [3,10,11,12,13]. The 2D T1–T2 measurements are performed combining sequences to measure T1 (SR or IR), followed by the CPMG sequence, called SR–CPMG and IR–CPMG sequences, respectively. T2–D measurements are conducted with CPMG preceded by pulses gradient spin echo sequence (PGSG–CPMG) [11].
In the lasts two decades, one-dimensional (1D) and two-dimension (2D) pulses sequences have been proposed for TD–NMR [3,12,13,14,15]. This mini-review focuses on sequences, such as CPMG with low refocusing pulses, which minimize the sample-heating problem, and 1D and 2D sequences based on a special regime of steady state free precession, known as continuous wave free precession (CWFP).

2. One-Dimensional (1D) Pulse Sequences

2.1. CPMG with Low Refocusing Pulses

Most TD–NMR studies in plants are based on the measurement of T2 relaxation time obtained by the CPMG pulse sequence, which consists of a π/2 pulse in the x axis followed by time (τ) and a train of refocusing π pulses in the y axis separated by time 2τ (Figure 1 using θ = π ) [5]. The CPMG pulse sequence is very robust with negligible dependence on pulse imperfections and magnetic field inhomogeneity; in addition, a single scan provides the full relaxation decay [5,10,16].
The CPMG signals have been used to study plants in laboratories, greenhouses, and in the field [17,18,19,20,21,22]. Normally, the CPMG decay is measured for 5T2 to obtain suitable discrete or continuous fitting. Since T1 and T2 are similar in low field TD–NMR spectrometers, the scans can be performed without signal saturation, even with a recycle delay (RD) of a few milliseconds. This procedure is important to being able to carry out experiments in short measuring times for static samples or in moving samples on a conveyor belt. When RD is in the order of milliseconds, the π pulses are applied almost continuously, which can cause probe and power amplifier overheating [17]. In some cases, mainly for living tissues, a continuous high power rf pulse train may exceed the specific absorption rate (SAR), which can damage the sample by excessive heating and also lead to erroneous T2 values. The sample heating problem is a critical issue, for example, for oilseeds, as T2 varies exponentially with temperature [19,23].
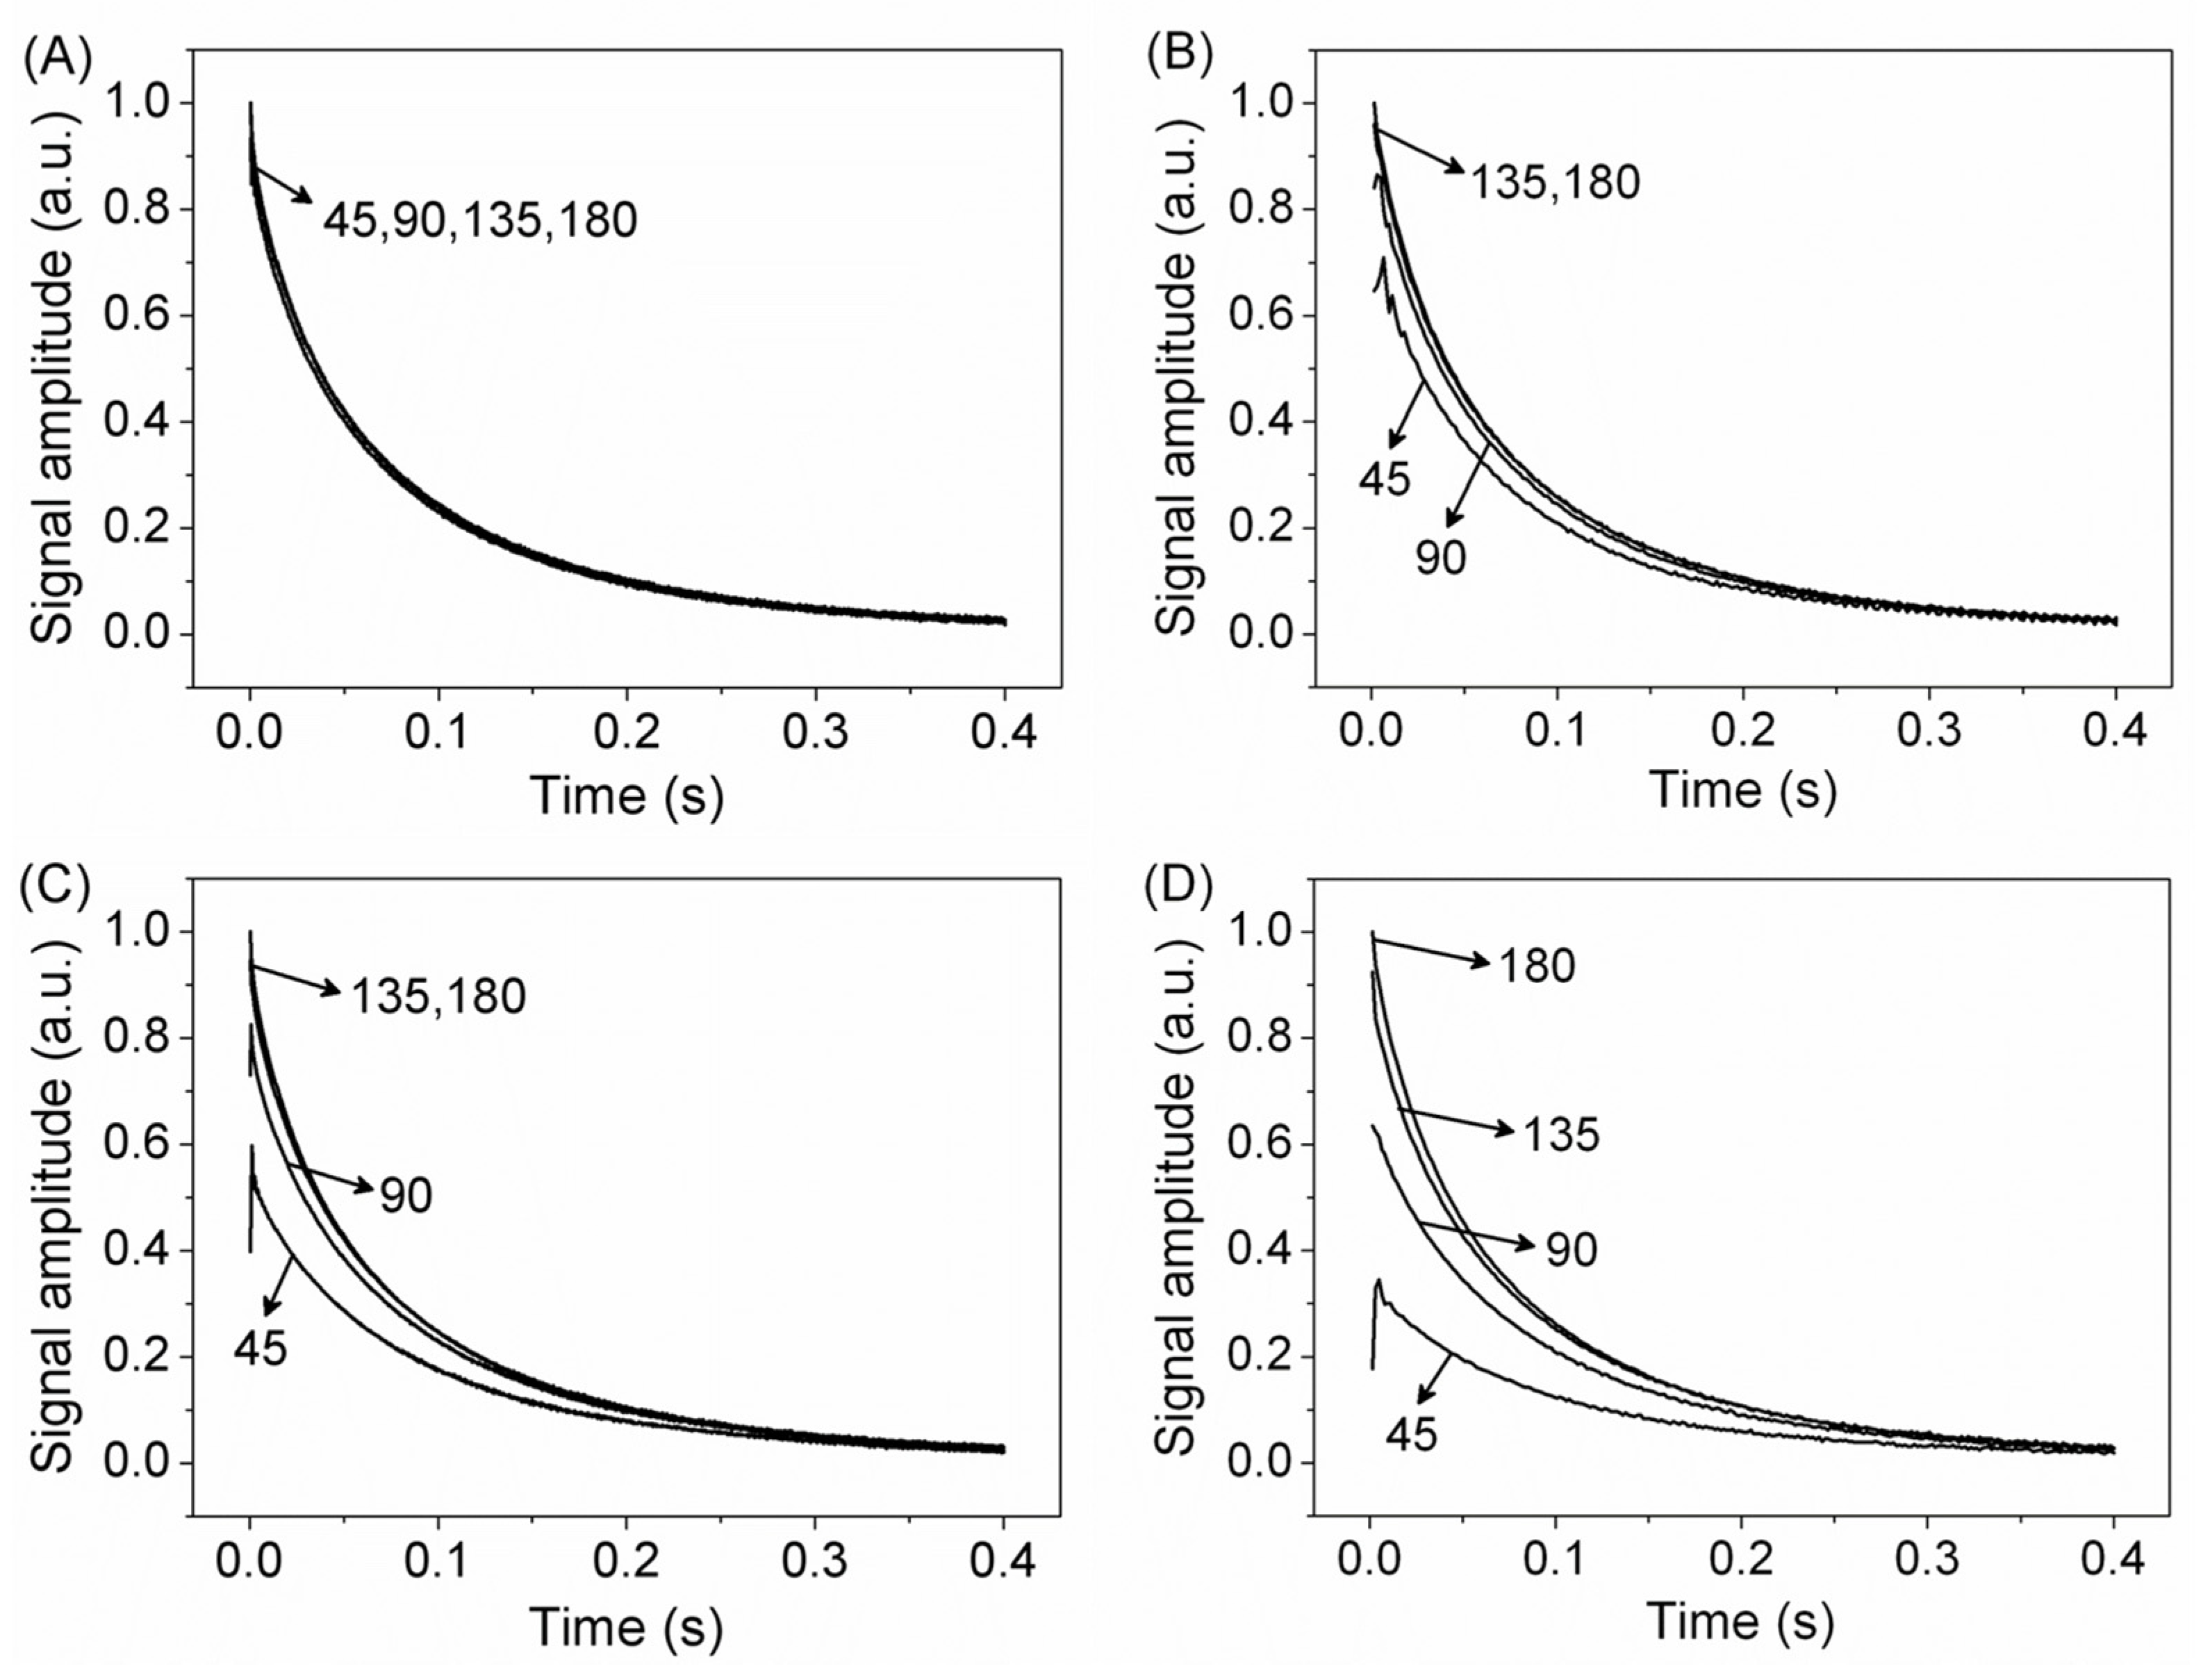
To minimize instrumental or sample-heating problems, T2 measurements have shown accuracy using CPMG with a low refocusing flip angle (LRFA–CPMG) (Figure 1 using θ << π), which may lower rf power by up to one order of magnitude [16]. In LRFA–CPMG, T2 accuracy depends on experimental parameters, such as τ value and magnetic field inhomogeneity. Figure 2 shows the experimental CPMG decay using π, 3π/2, π/2, and π/4 refocusing pulses, for a soybean oil sample, using two τ values in two magnetic fields with different field homogeneity. Figure 2A,B show CPMG signals for a signal with 15 Hz line width and τ values of 0.1 (A) and 0.4 ms (B). Figure 2C,D show CPMG signals for a signal with 100 Hz line width and τ values of 0.1 ms (Figure 2C) and 0.4 ms (Figure 2D). These results show that for a quite homogeneous magnet, a very low refocusing pulse with short τ values gives a signal with the same intensity and T2 values as that of classical CPMG with π pulses. Signal intensity decays for longer τ values and magnetic field inhomogeneity; however, T2 values are still rather accurate [16].
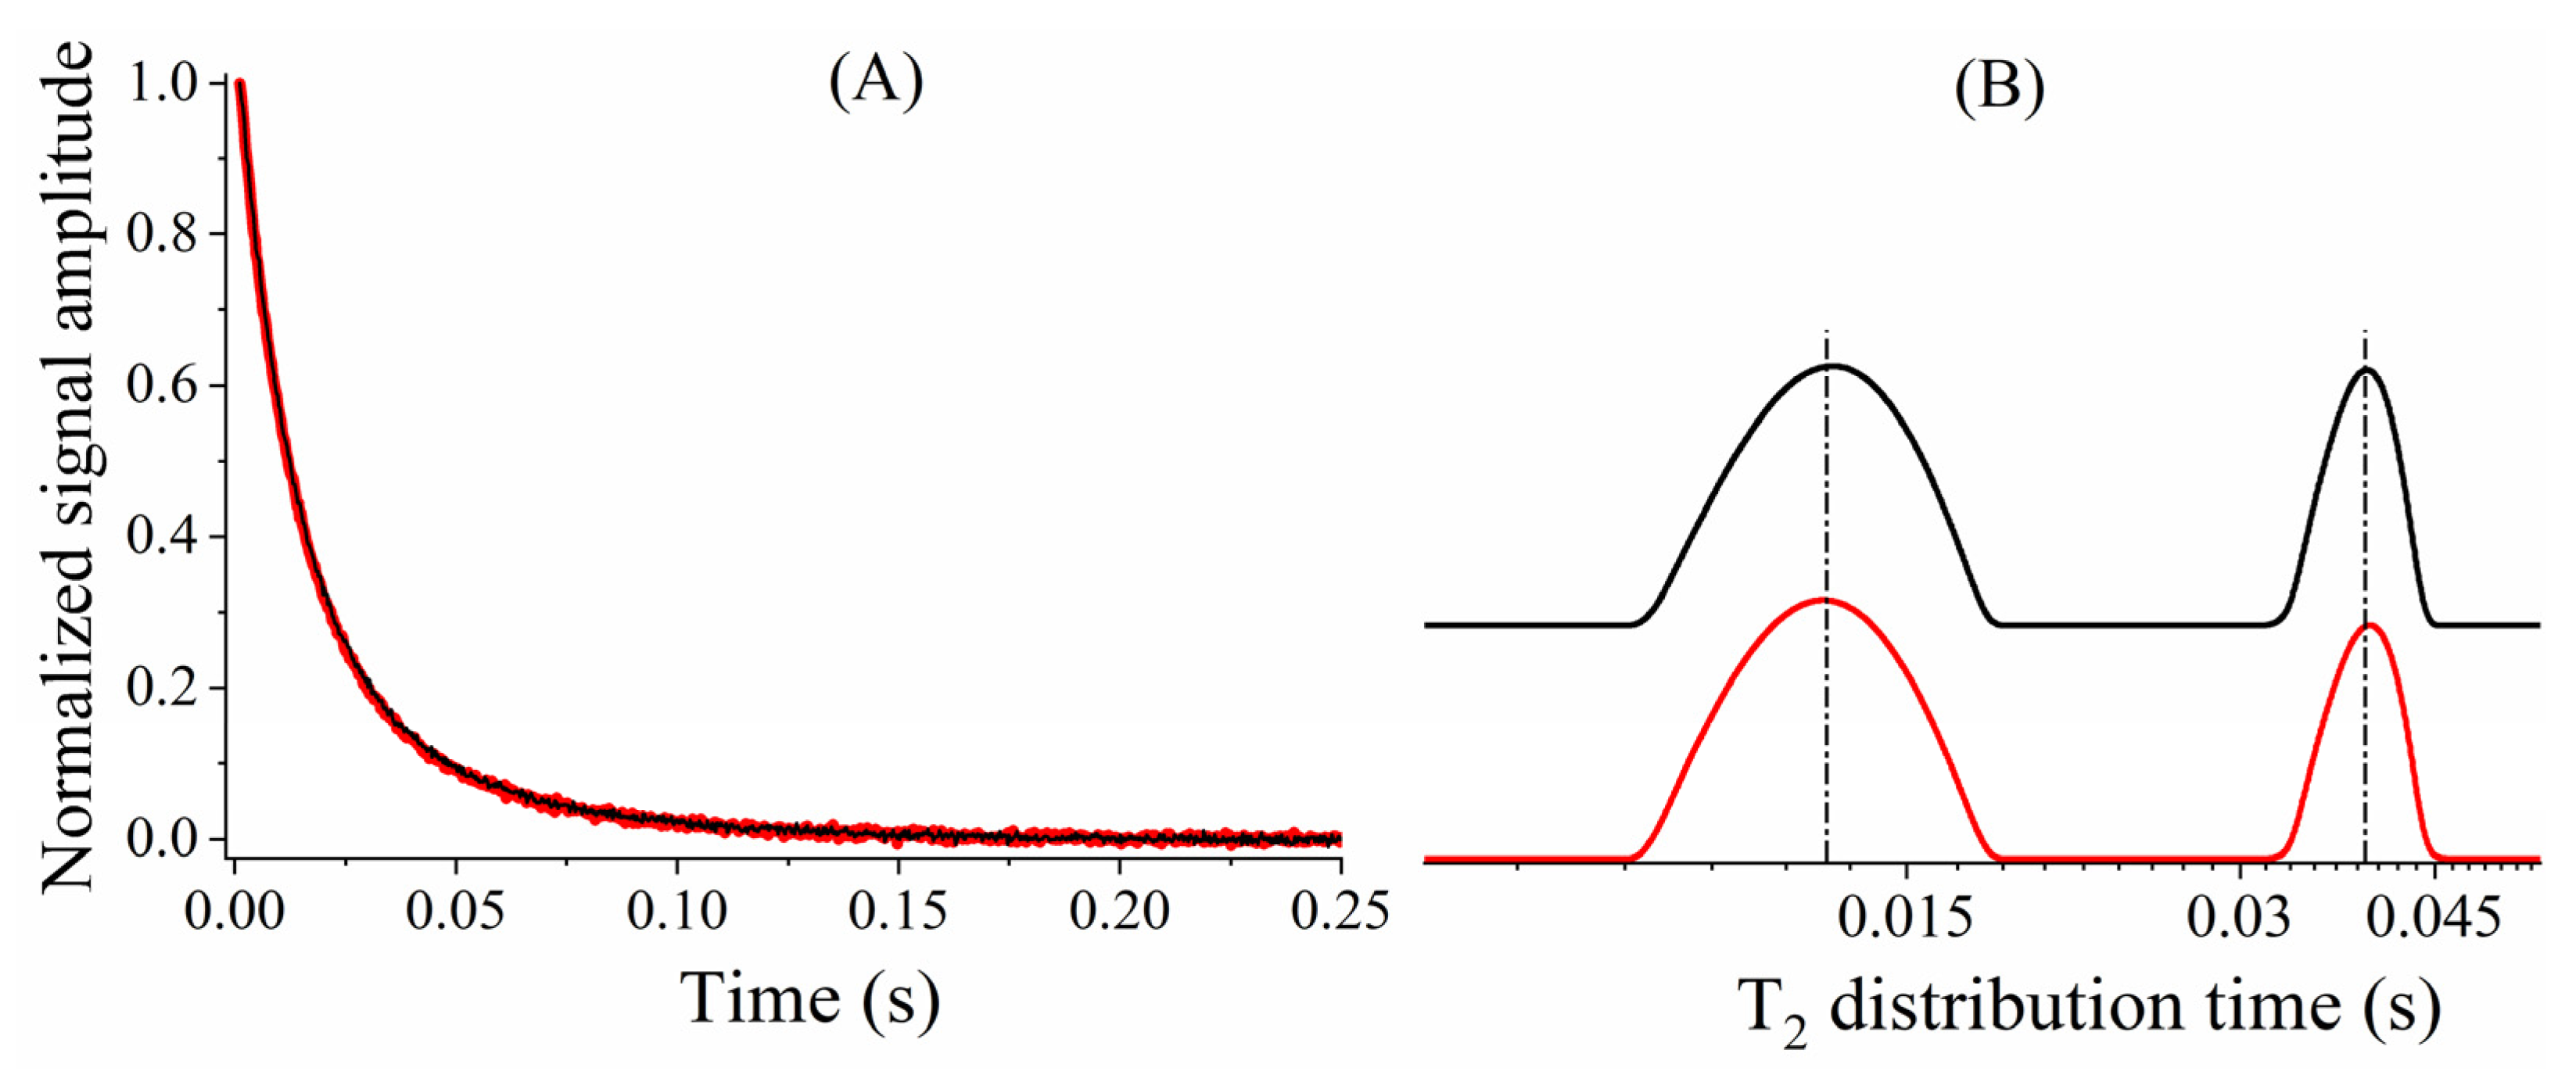
Figure 3A shows CPMG decays of a castor bean seed (oil signal) obtained with the CPMG pulse sequence with π (red line) and π/2 (black line) refocusing pulses. These experiments were performed in a Minispec instrument (Bruker 20 MHz for 1H) using τ = 0.5 ms. Figure 3B shows the continuous T2 distribution of Figure 3A signals, obtained by inverse Laplace transform (ILT) [24]. These figures show that LRFA–CPMG, with π/2 refocusing pulses, shows identical T2 values when compared with those of the standard CPMG sequence. As B1∼P1/2, where P is the rf power and B1 the amplitude of the magnetic field of the applied pulse, the LRFA–CPMG with π/2 pulses reduced to one quarter of the energy deposited in the sample [16] and also obtained similar T2 results to those obtained by the conventional CPMG method (Figure 3).
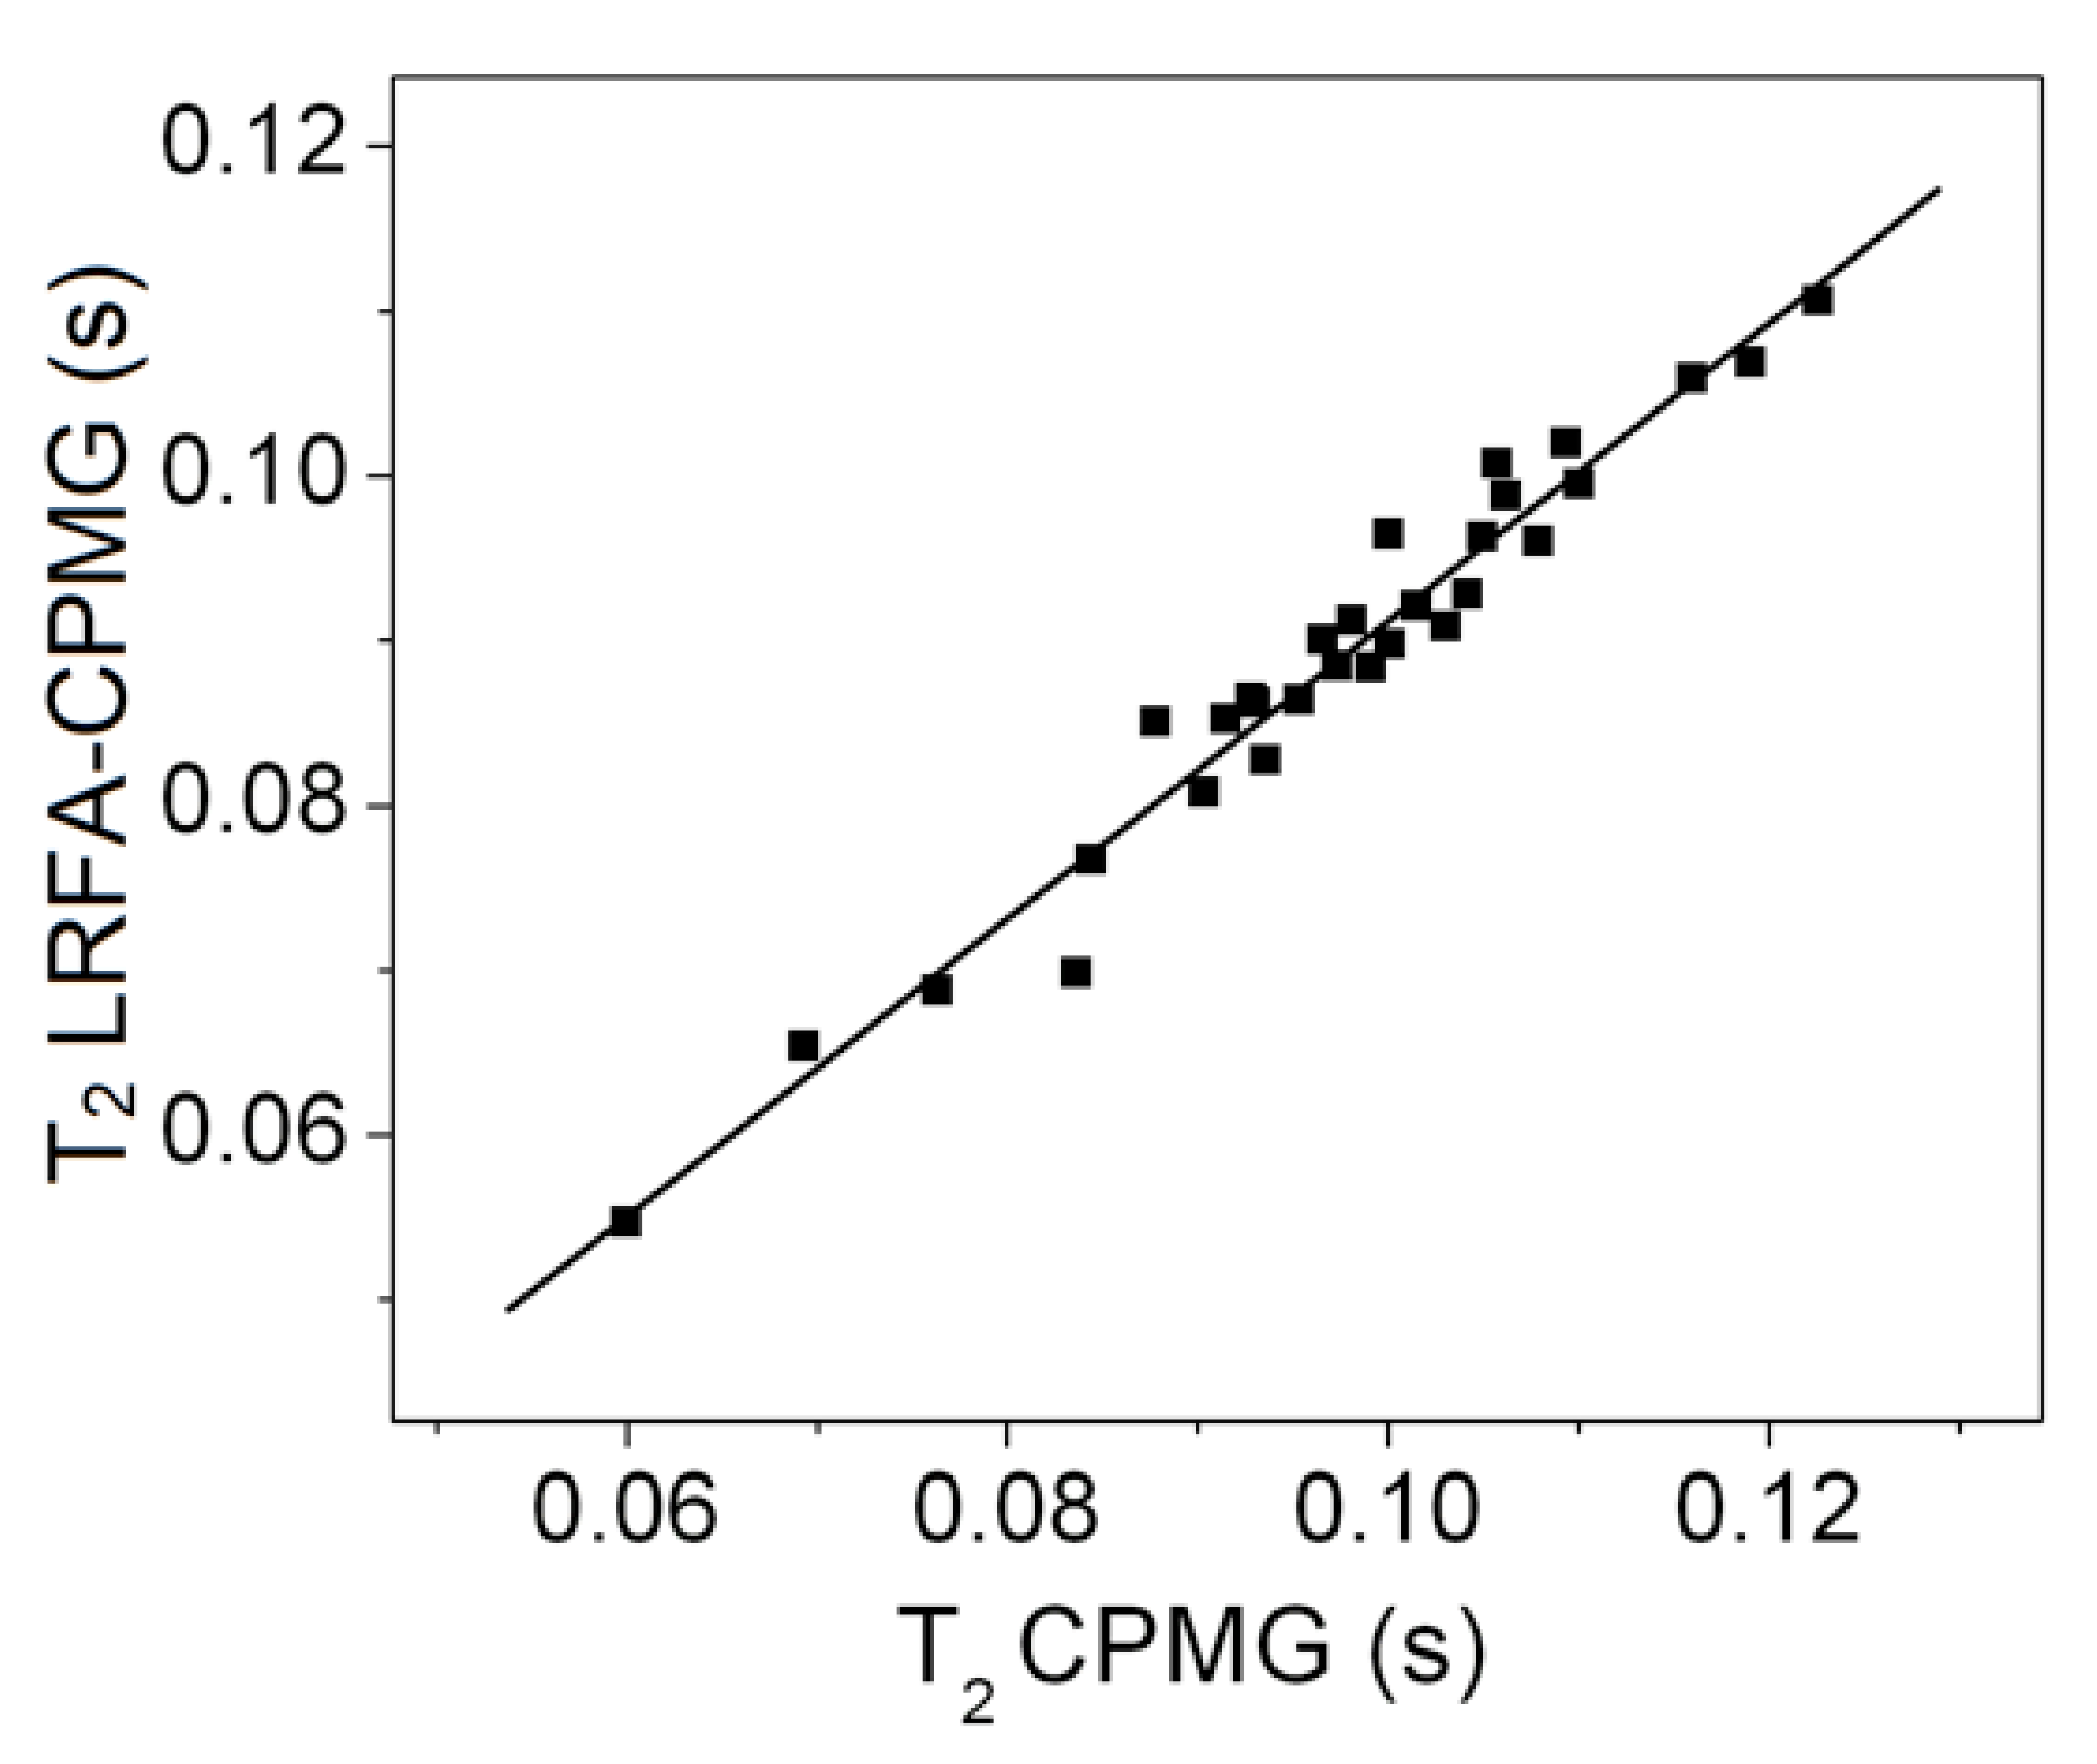
Figure 4 shows the high correlation (r = 0.98) between T2 obtained by LRFA–CPMG performed with a π/2 refocusing flip angle with T2 measured by conventional CPMG for oil seeds of 30 plant species [16].

2.2. Continuous Wave Free Precession (CWFP) Sequences

2.2.1. Quantitative Analyses

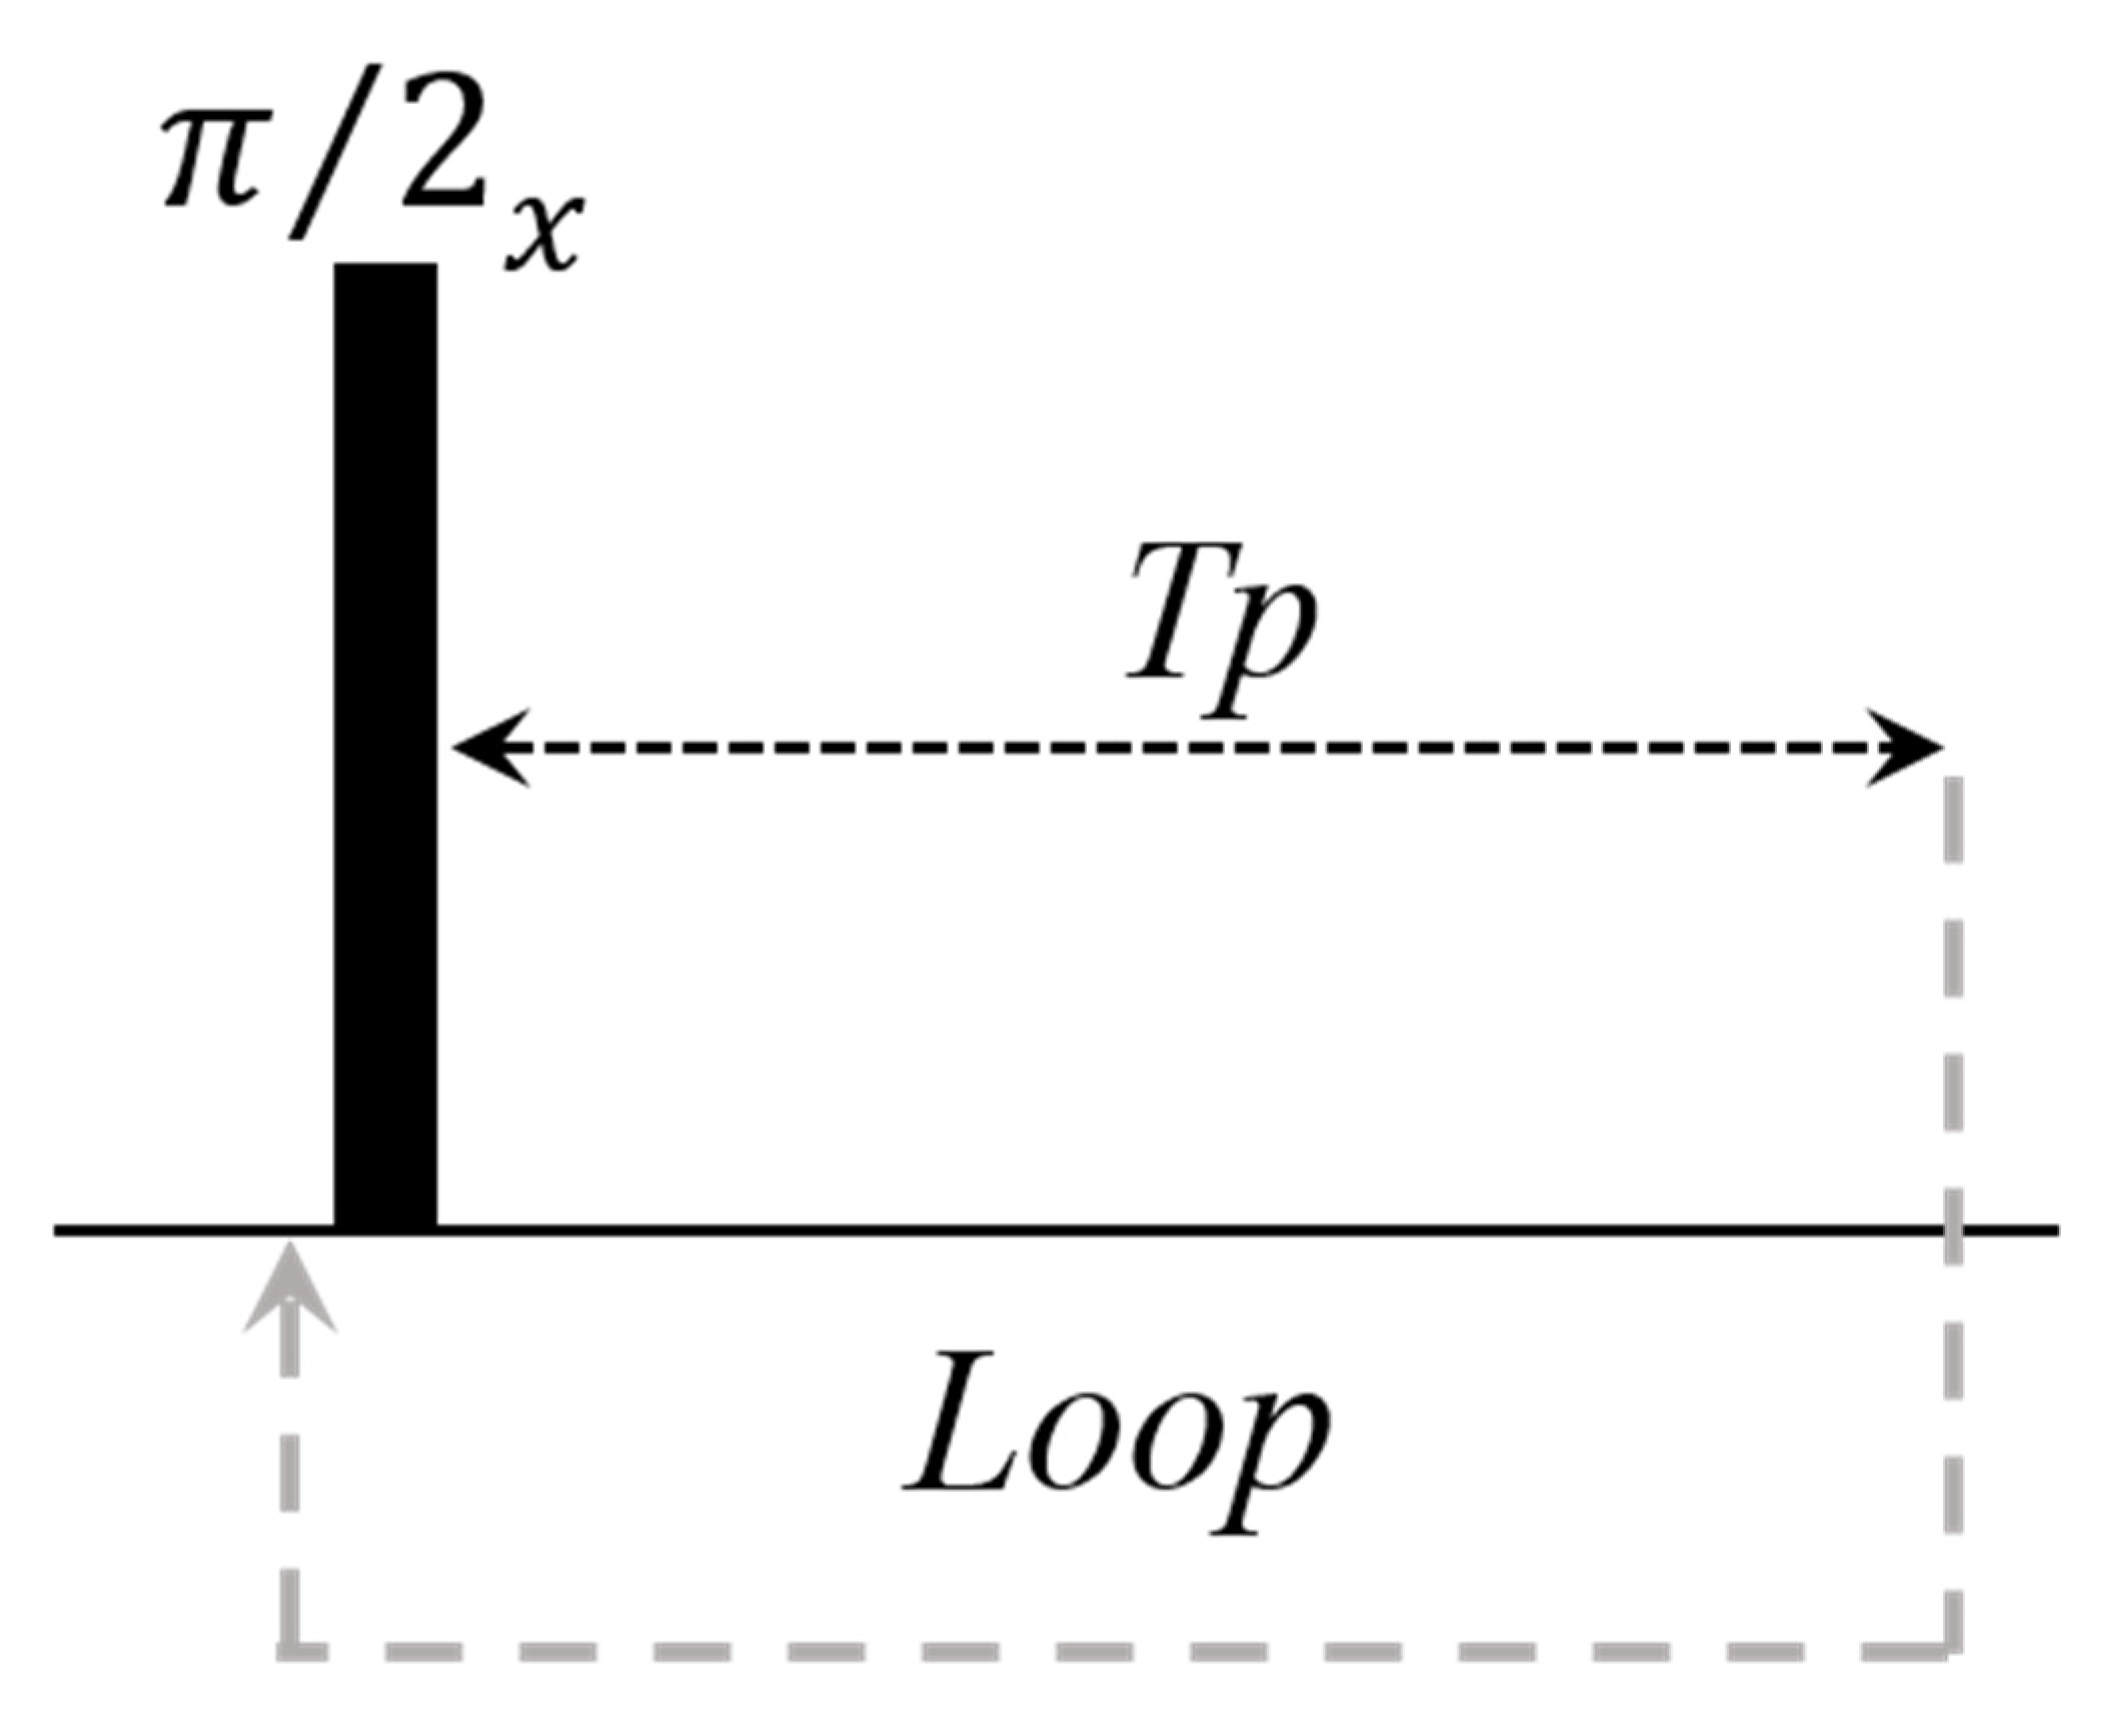
Continuous wave free precession (CWFP) is a special regime of the steady-state free precession (SSFP) condition [24,25,26,27,28,29,30]. The CWFP sequence consists of an equally spaced rf pulse train separated by a time interval (Tp) shorter than T2 [25] and shorter than T2* [26,27] (Figure 5). Ernest and Anderson described the analytical solution for SSFP/CWFP regimes and this can be found elsewhere [28,29,30].
Figure 6 shows the numerical simulations of the real SSFP/CWFP signals using Block equations [31], T1 = 150 ms, T2 = 50 ms, T2* = 0.5 ms, and different time between pulses, Tp values, and offset frequencies. The standard SSFP regime (Figure 6A) is obtained when a train of rf pulses (gray vertical lines) with the same phase, separated by a time interval (Tp =1.45 ms), is shorter than T2 and longer than T2*, that is, T2 > Tp > T2*. In this condition, FID (blue arrows) and echo (red arrows) signals, dephased in π (180°), are observed immediately after a π/2 pulse and before the next π/2 pulse, respectively [26,27,32].
The CWFP regime is obtained when Tp is shorter than T2 and T2* (T2 >> Tp < T2*). In the CWFP regime (Figure 6B,C) FID and echo signals are overlapped and the interaction is constructive (B) or destructive (C), depending on the precession angle ψ = ϖ0Tp (ϖ0 is the frequency offset from resonance), flip angle θ, and T1 and T2 relaxation times according to Equation (1). For Tp = 0.3 ms, θ = π/2, and ψ = (2n+1)π = 8.333 kHz, the interaction is constructive, yielding a CWFP signal with maximum amplitude (Figure 6B). However, when θ = π/2 and ψ = 2nπ = 6.666 kHz, FID and echo interaction is destructive and a minimal signal is observed (Figure 6C) [28].
| M SS | = M 0 | s i n θ | 2 2 c o s ψ ( 1 + c o s θ ) ( 1 c o s ψ ) + ( 1 c o s θ ) 2 T 1 / T 2 )
The magnitude of the CWFP signal (|Mss|) is constant (dashed red line on top of the CWFP signal in Figure 6B) and for ψ = (2n+1)π, it is dependent on M0, T1, and T2 according to Equation (2). Equation (2) also shows that (|Mss|) is not dependent only on T1, as observed in conventional NMR sequences, but on T1/T2. For example, when T1 = T2 (|Mss|) = 0.5M0.
| M SS | = M 0 1 + T 1 / T 2
Therefore, in the CWFP sequence, the pulse interval can be as short as possible (Tp < T2*), which allows the acquisition of thousands of scans per second [26,27]. Consequently, the CWFP sequence is used to enhance the signal-to-noise ratio (SNR) for more than one order of magnitude in the TD–NMR, without increasing the experimental time [26,27]. The CWFP signal also shows linear correlation with concentration for a sample with similar T1/T2, allowing fast quantitative measurements [27]. The CWFP sequence has been used to measure oil content in seeds with low oil content, such as peas and maize, without increasing measuring time [26,33].
The CWFP sequence is also used to determine the oil content in seeds moving at 13 cm/s on a conveyor belt. In this experiment, each seed gives a signal where the intensity is proportional to the oil content. Therefore, it is a high-throughput method to determine oil content in more than 20,000 seeds per hour [33].

2.2.2. CWFP Sequence to Measure T1 and T2 in a Single Experiment

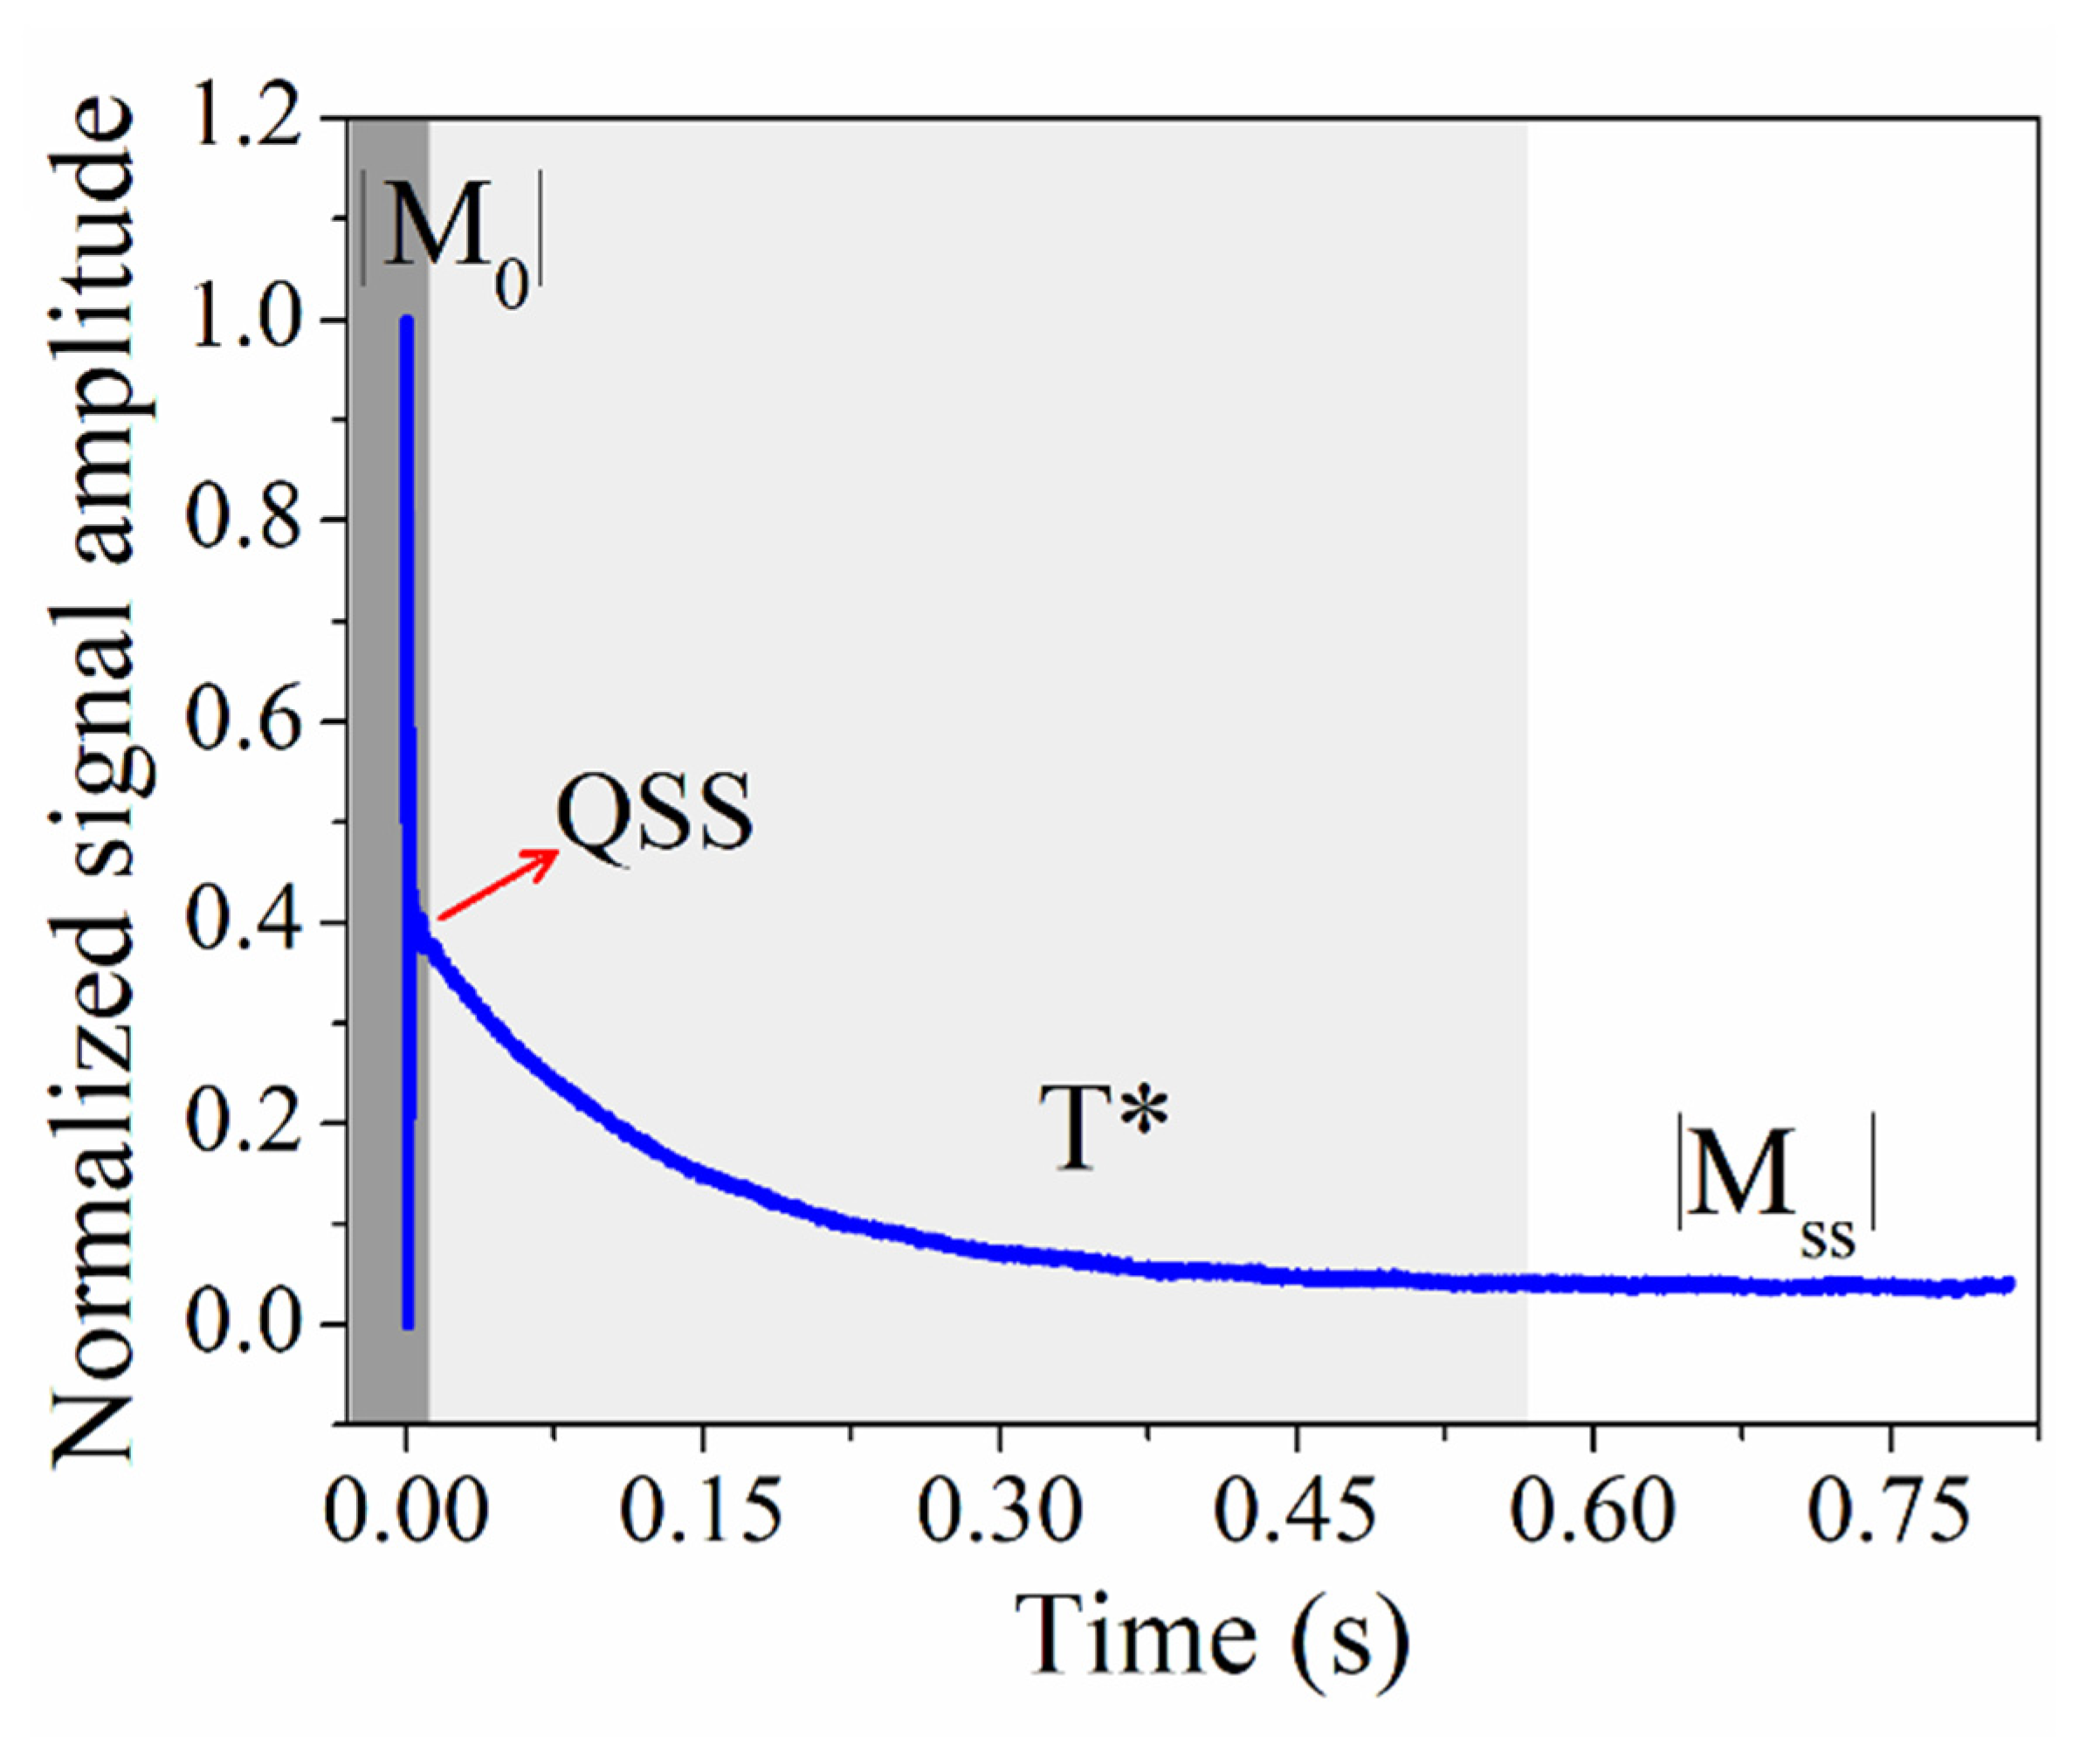
The CWFP sequence can also be used to measure both relaxation times (T1 and T2) in a single shot sequence [15,26,27,32,34]. These measurements require acquiring the amplitude of the NMR signal from the first pulse to the CWFP regime, using θ = π/2 and ψ = (2n+1)π (Figure 7). After the first π/2 pulse, the signal magnitude is at a maximum and is proportional to M0. After the following pulses, the signal oscillates in a transient period depending on T2* (Figure 7, dark gray region). When oscillation stops, the signal reaches a quasi-stationary state (QSS), indicated by a red arrow in Figure 7. From the QSS, the signal decays to the CWFP regime with a time constant T* that depends on θ and on relaxation times, according to Equation (3).
  T * = 2 T 1 T 2 T 1 ( 1 c o s θ ) + T 2 ( 1 + c o s θ )
For θ= π/2, Equation (3) becomes Equation (4) [32].
  T * = 2 T 1 T 2 T 1 + T 2
Equations (2) and (4) can be rearranged to Equations (5) and (6), respectively, to determine T1 and T2 using values of T*, |Mss|, and M0, of a single CWFP experiment (Figure 7).
T 1 = T * / 2 | M ss | / M 0
T 2 = T * / 2 1 | M ss | / M 0
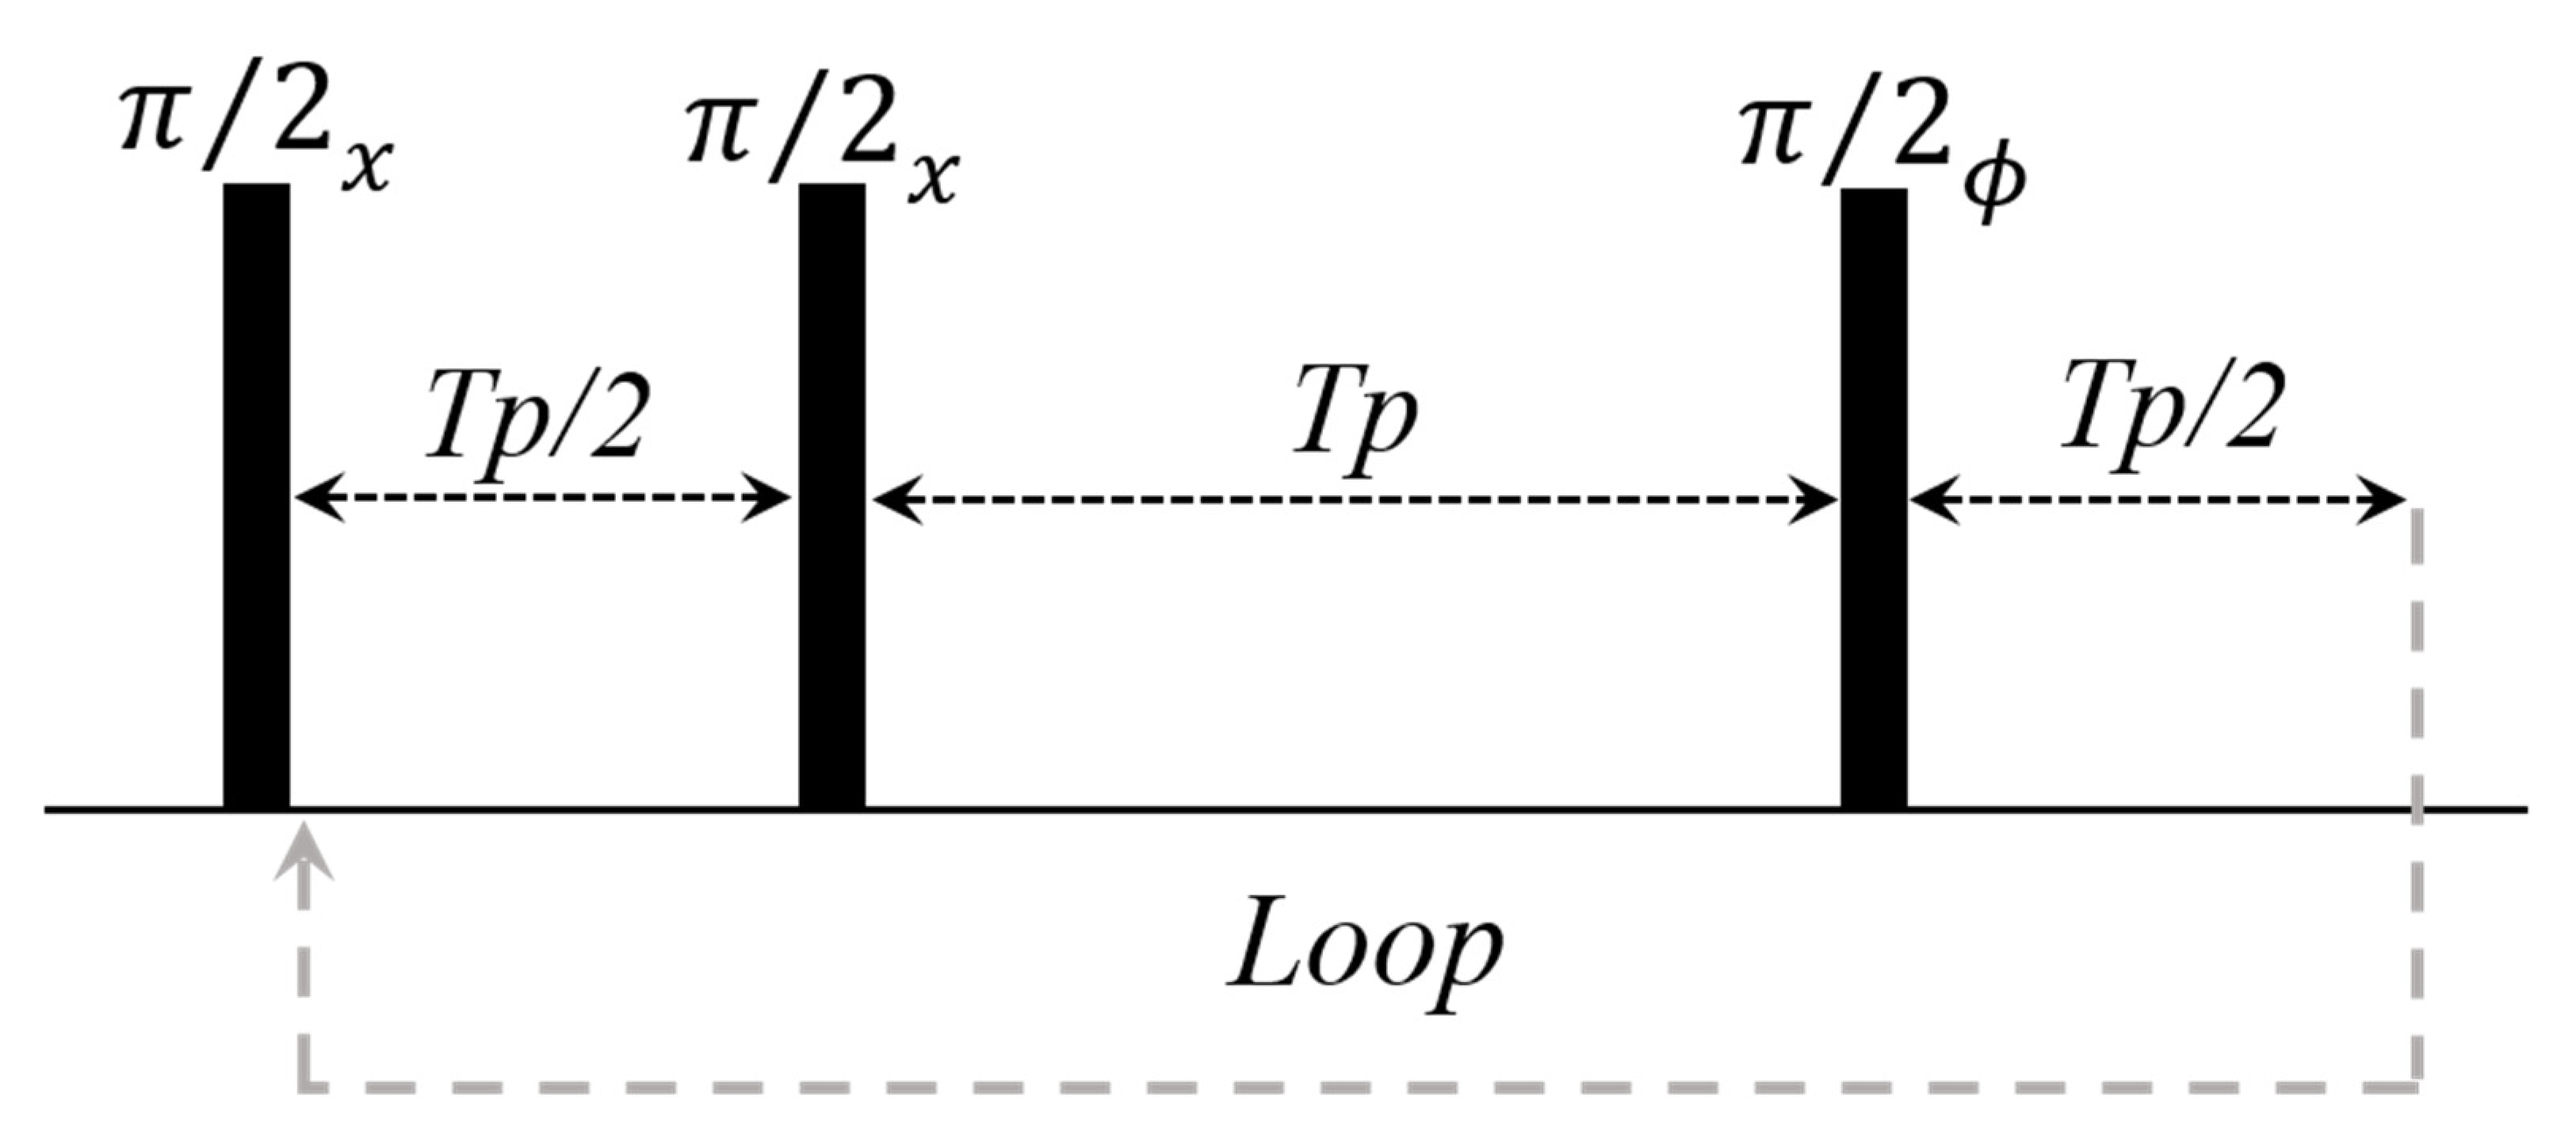
The CWFP sequence results in signals with the highest variation in T* amplitude or the highest dynamic range (DR) for samples with T1 >> T2. On the other hand, DR is minimal when T1~T2, which makes it difficult to determine T* in low SNR signals. To overcome this situation, a second CWPF sequence was developed to measure T1 and T2 for samples with T1~T2 [35]. This sequence has a π/2 pulse separated by a Tp/2 before the CWFP pulse train (ϕ = x) (Figure 8). It is a Carr–Purcell sequence with π/2 refocusing pulses and it is named CP–CWFP [35]. Recently, the use of a π phase alternation, on the CWFP loop of pulses (ϕ = −x), has been proposed (Figure 8) [15]. This sequence, known as CP–CWFPx−x, has been the best CWFP sequence due to its highest DR for both conditions T1~T2 and T1 > T2 and the signal can also be measured on resonance (ψ = 0) [15].

2.2.3. CWFP Sequence to Measure T1 in a Single Shot Experiment

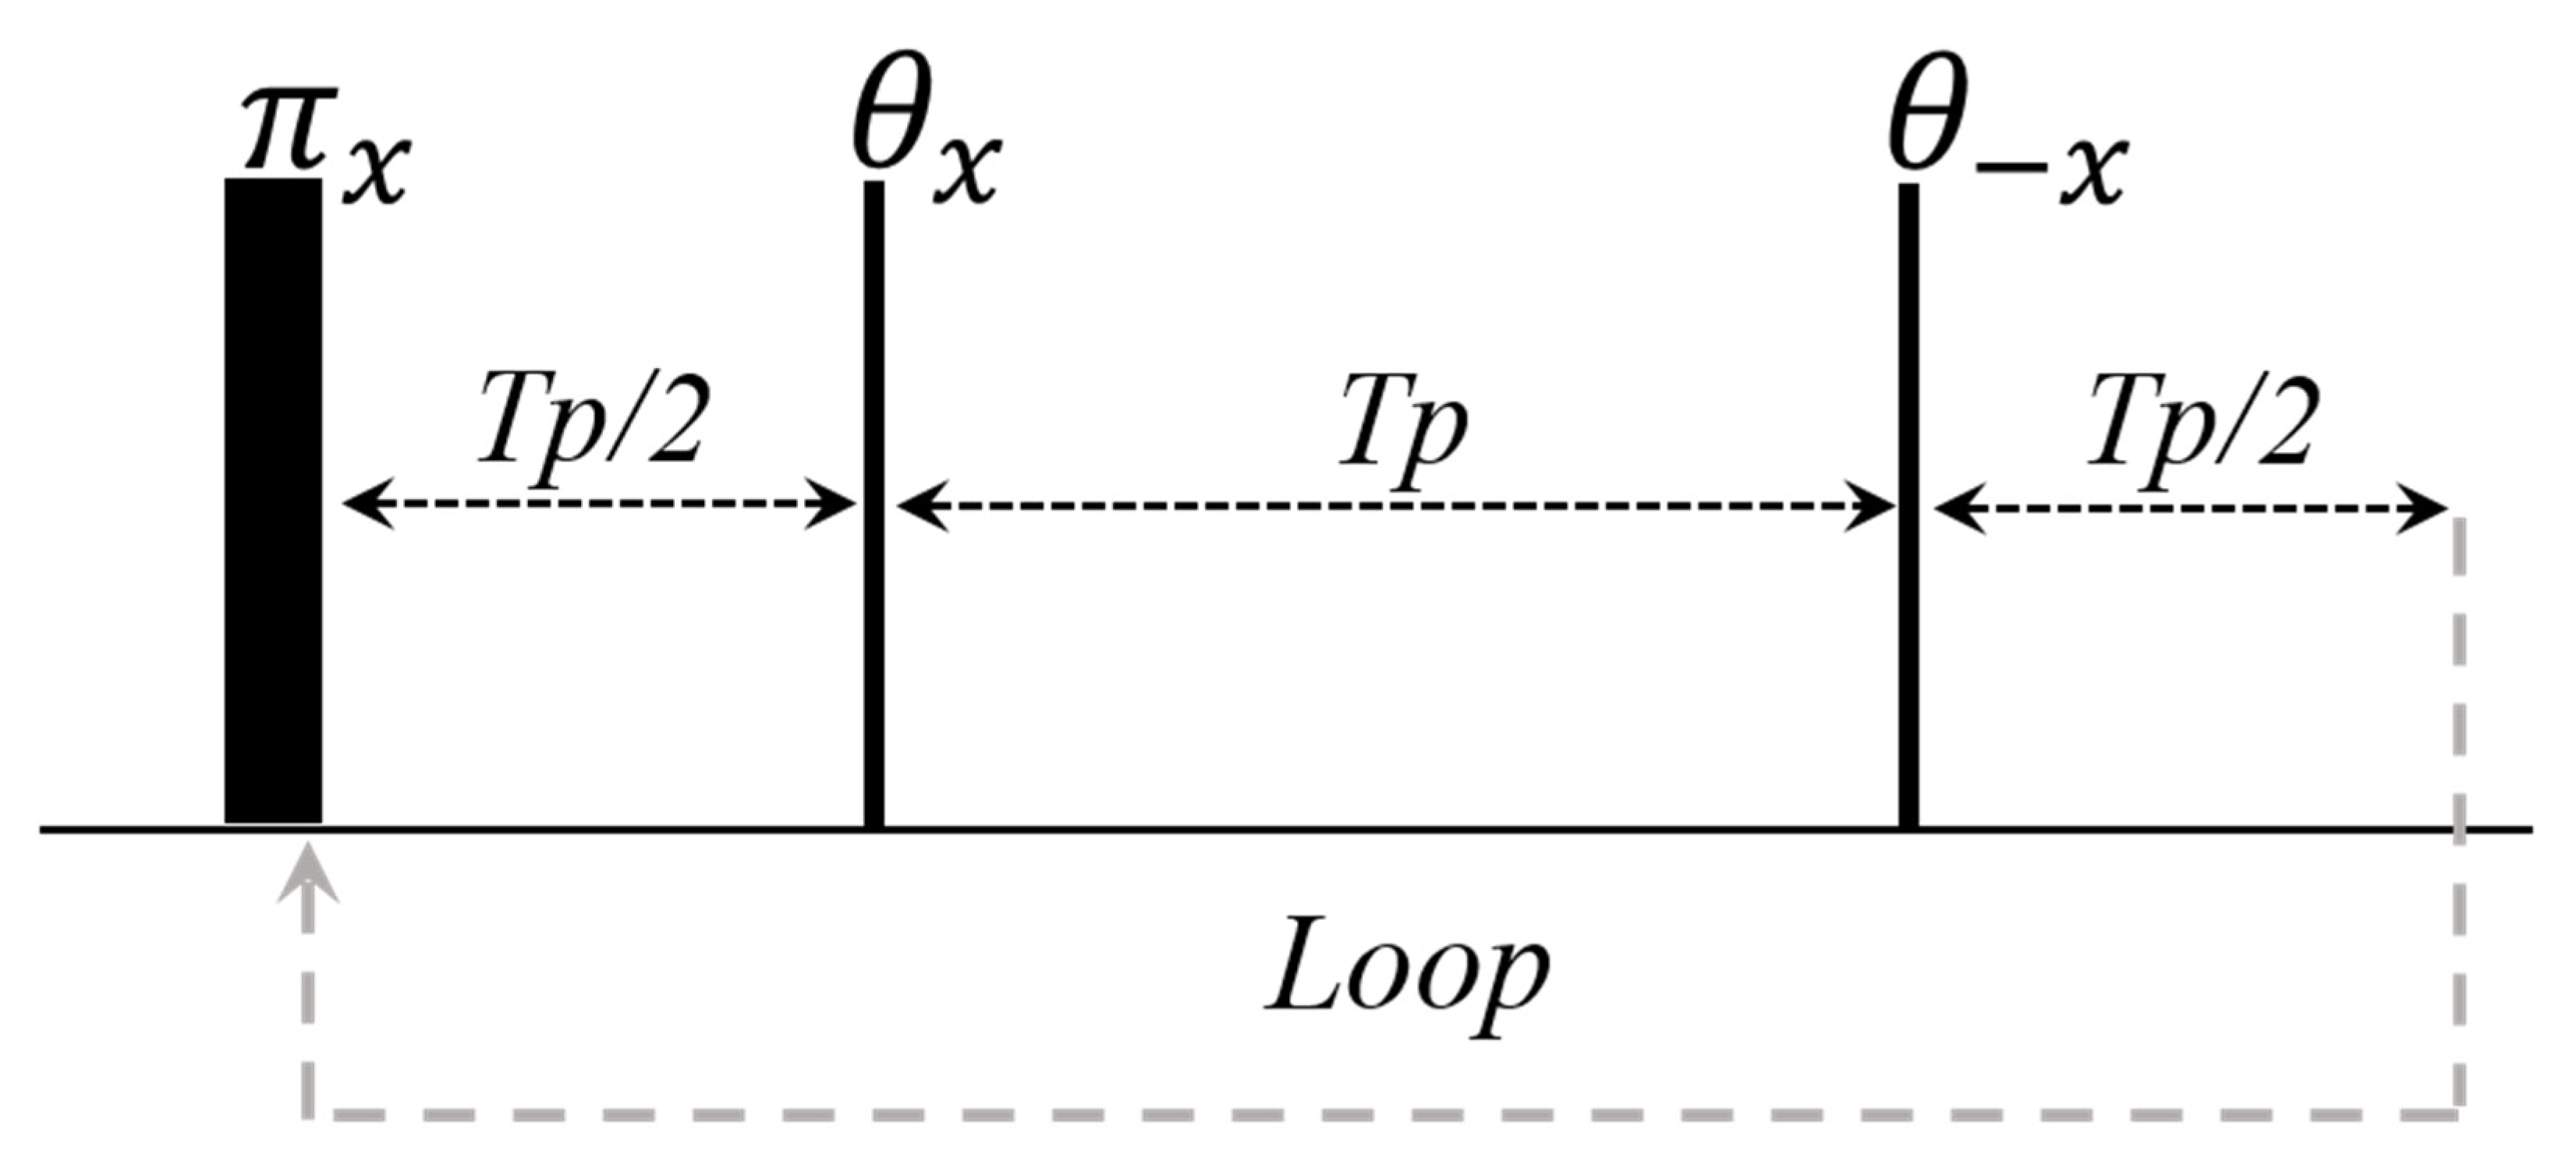
CWFP sequences have also been used to measure T1 in a single shot experiment [14]. According to Equation (3), T*, of the CWFP signal, can be used to measure T1, when very low flip angles are used. To obtain the maximum DR, the CWFP–T1 sequence (Figure 9) starts with a π pulse, which inverts the magnetization, and it is followed by a train of low flip angle pulses [14].
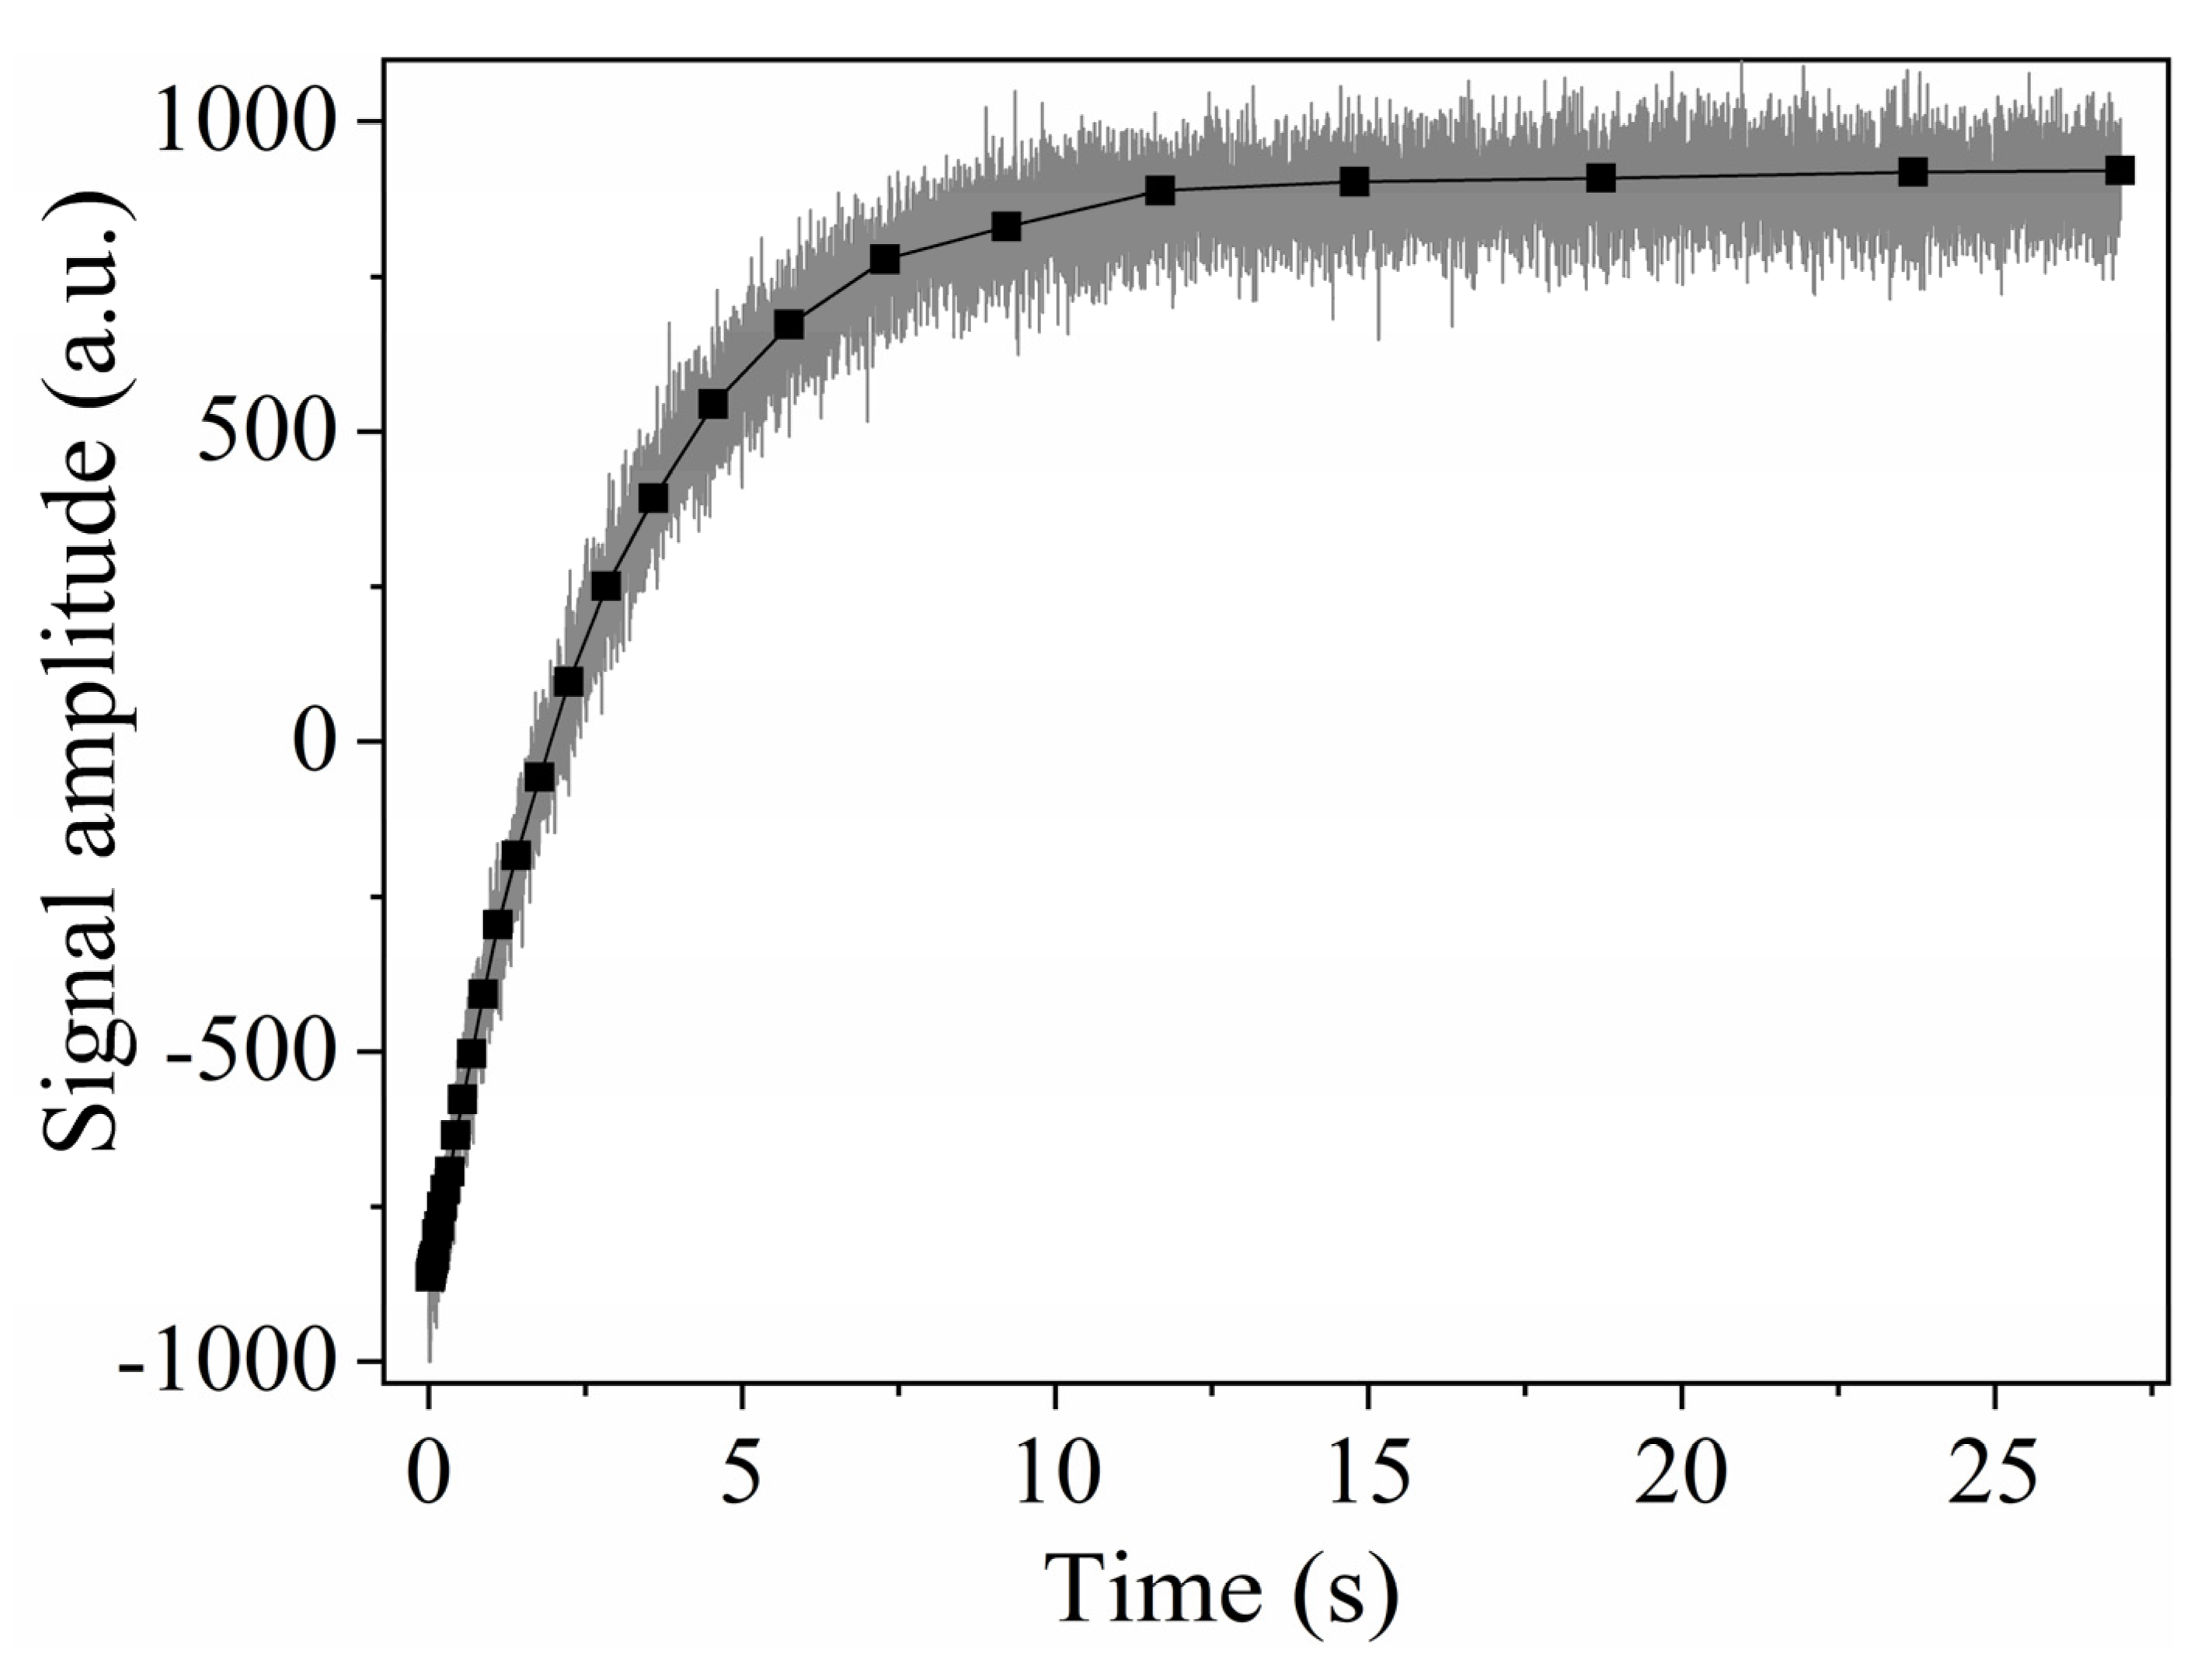
Figure 10 shows that the single shot CWFP–T1 signal (θ~π/20) has a profile similar to the IR experiment (square symbols) [14]. The low SNR in the CWFP–T1 signal is due to the small flip angles in the pulse sequence. However, the SNR of the CWFP–T1 signals can be enhanced using post-acquisition digital filters, such as Savistky–Golay or wavelet filters [36]. Figure 10 shows that the CWFP–T1 signal has similar results to those obtained with the standard IR method; however, in a shorter measuring time [14].

3. Two-Dimensional Methods Using the CWFP–T1 Sequence

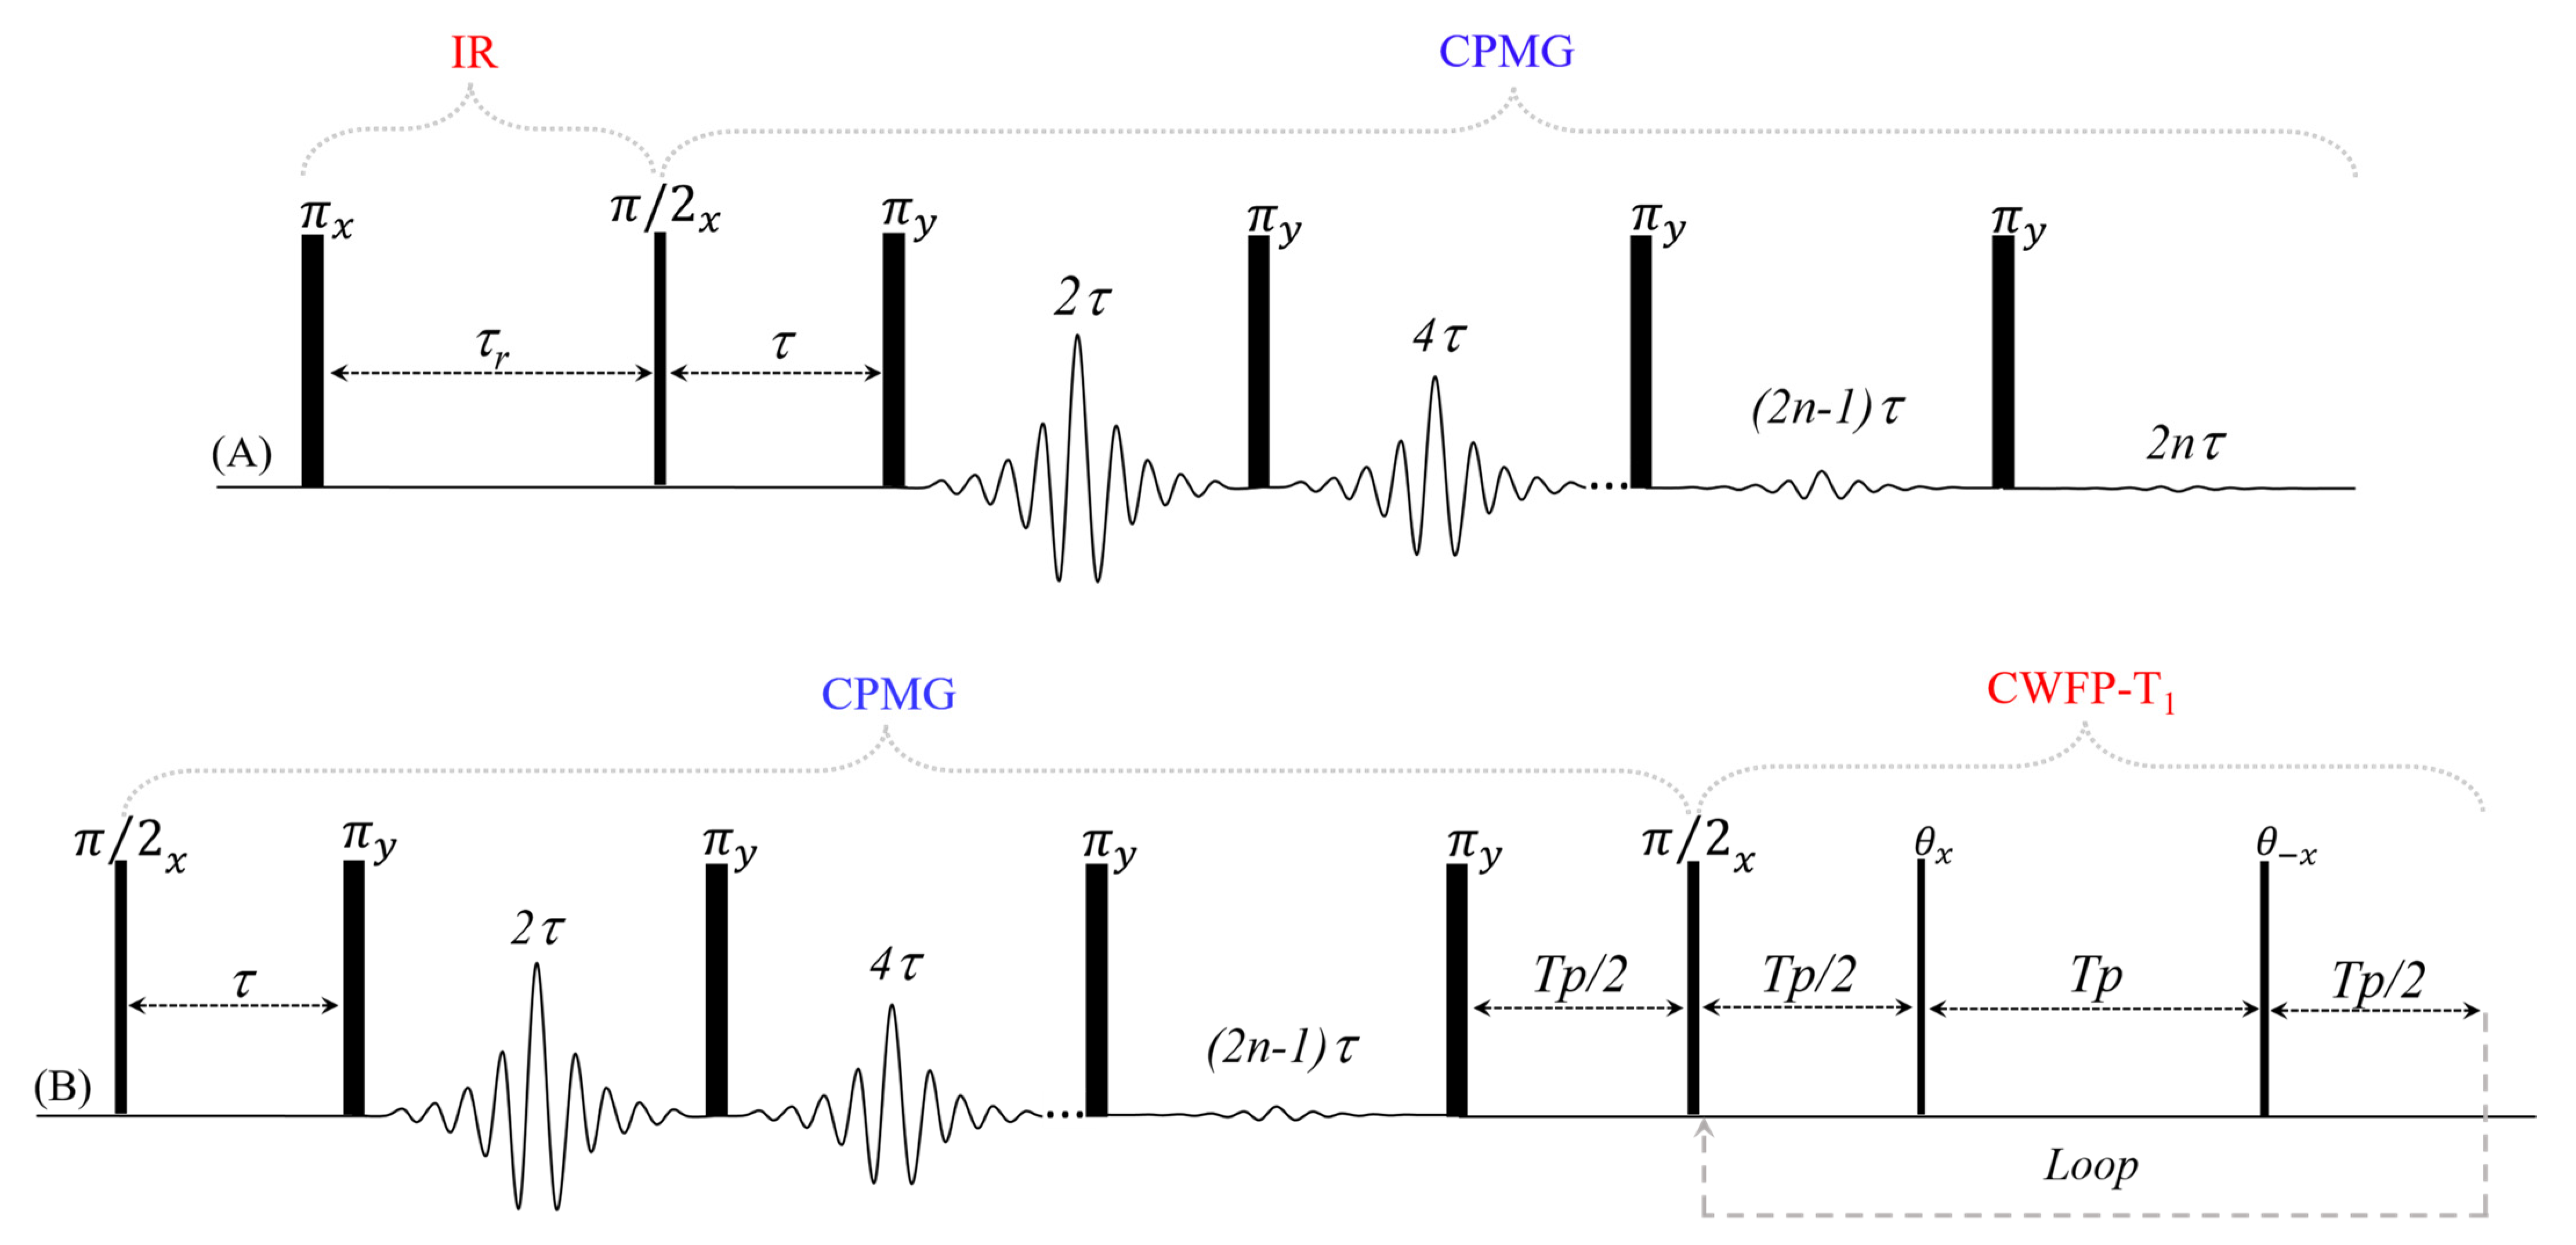
Two-dimension (2D) experiments are used in TD–NMR to reduce peak overlap and obtain a correlation between relaxation times (T1–T2) [37,38,39] and between diffusion and T2 (D–T2) [40,41]. Most 2D sequences use the CPMG (T2) to detect the direct dimension (Figure 11A) signal, which is modulated by T1, T2, or D sequences.
Recently, it has been demonstrated that a single shot T1 method can also be used in the direct dimension of the 2D T1–T2 TD–NMR experiment, using the CWFP–T1 sequence [13]. This sequence was denominated CPMG–CWFP–T1 and the pulse diagram is as shown in Figure 11B. The 2D-CPMG–CWFP–T1 maps show higher resolution in the T1 dimension than do methods that use CPMG as a direct dimension. Moreover, the CPMG–CWFP–T1 method has a shorter experimental time (up to an order of magnitude) than does IR–CPMG for the samples with T1~T2 [13].
Figure 12 shows the T1–T2 correlation maps of the signals acquired with castor bean oil at 40 °C (Figure 12A,B) and green banana at 22 °C (Figure 12C,D) inverted by a fast multi-dimensional Laplace inversion (FLI) [37,38] algorithm. IR–CPMG maps were obtained using 32 logarithmically spaced T1 recovery intervals, from 0.05 to 900 ms for the castor bean oil sample and from 3 to 4,500 ms for the banana sample. The CPMG data were collected using echo numbers (n-Figure 11A) equal to 2400 and 12,000 echoes for the castor bean oil and banana, respectively. For both samples, the τ used on the CPMG method was 0.3 ms. The T2–T1 map measured with the CPMG–CWFP–T1 sequence used 32 logarithmically spaced CPMG echoes from 2 to 2400 for the castor bean oil and from 2 to 12,000 for the banana sample. CWFP–T1 Tp was 0.3 ms, for both samples, and the number of CWFP–T1 loops was 1500 for castor bean oil and 7500 for banana. Using these experimental parameters, for both samples, the CPMG–CWFP–T1 method (Figure 12A,C) provides T1–T2 maps with higher resolution in a shorter experimental time (up to an order of magnitude) than those produced with the IR–CPMG sequence (Figure 12B,D).
Figure 12A shows two peaks of the castor bean oil, which were assigned to the two distinct pools of protons on the fatty acid chain with different mobility or inhomogeneous structural organizations [42,43]. In the CPMG–CWFP–T1 map (Figure 12A), the population of protons with the highest mobility (T1–T2 = 0.19–0.14 s) represents 15.2%, while the signal of the proton with the lowest mobility (T1–T2 = 0.067–0.038 s) corresponds to the greater 2D map proportion of 84.8%. The IR–CPMG map (Figure 12B) does not allow this same quantification because of its poor resolution.
In the CPMG–CWFP–T1 map of a banana, the strongest signal (Figure 12C: T1–T2 = 0.55–0.39 s) was assigned to water in the vacuole and corresponds to 78.1% of the signals. The intermediary intensity signal (Figure 12C: T1–T2 = 0.19–0.14 s) is attributed to water in the cytoplasm and corresponds to 19.3% of the signal. The 2D map of banana obtained by the IR–CPMG method showed no separation between water signals in the vacuole and cytoplasm. The other signals with low intensity, in IR–CPMG and CPMG–CWFP–T1 bananas maps, can be related to water in the cell walls or inside the starch granule [34].
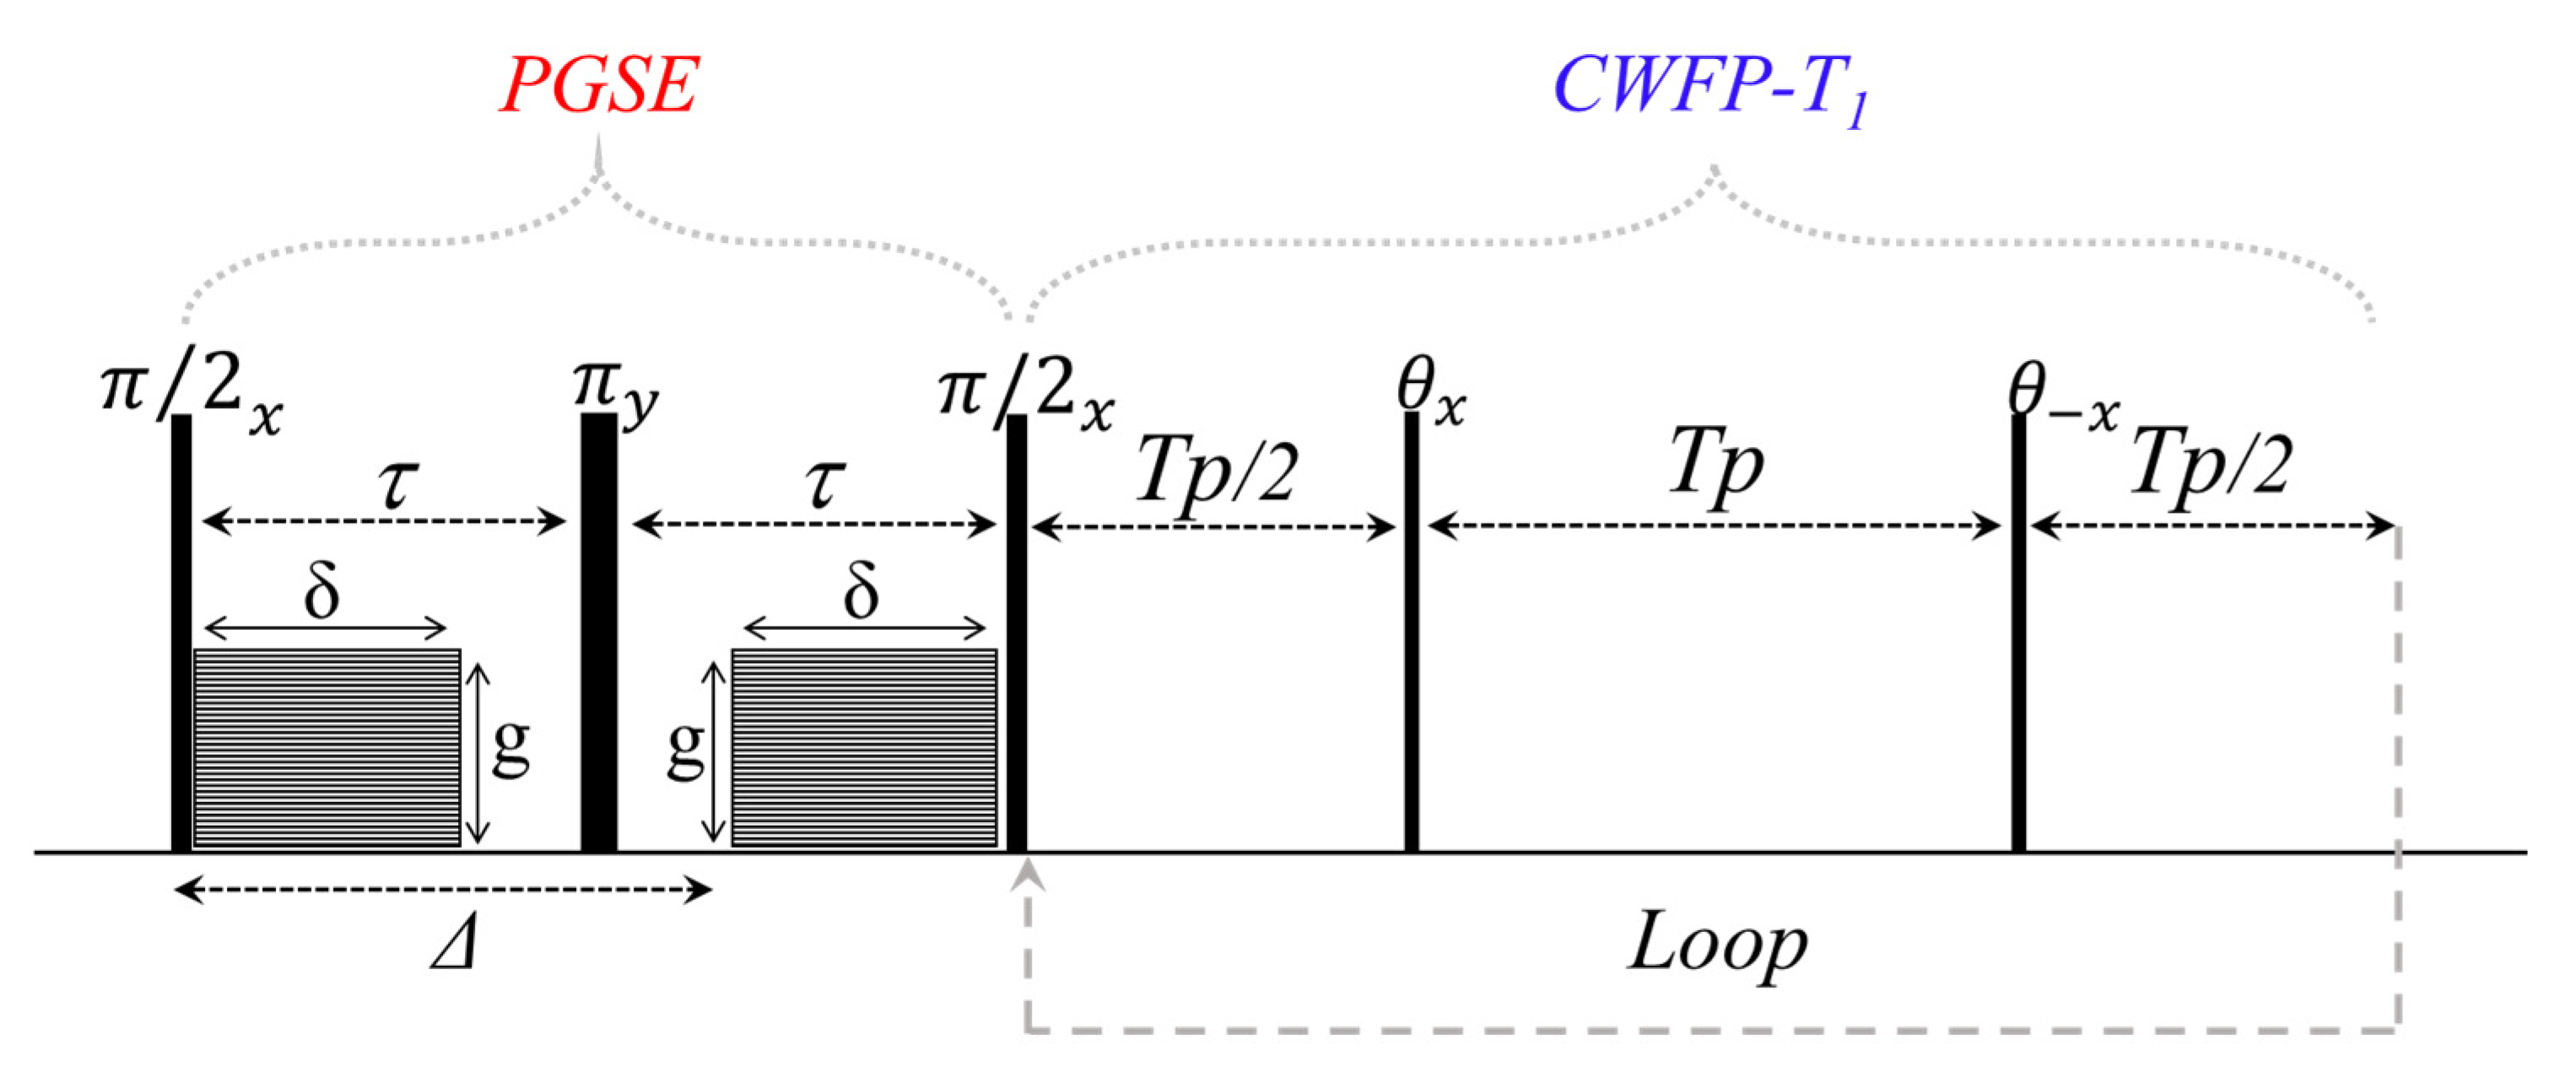
The CWFP–T1 sequence was also used to obtain D–T1 correlation maps [12]. Figure 13 shows the diagram of the 2D PGSE–CWFP–T1 pulse sequence to obtain a D–T1 correlation map. The PGSE–CWFP–T1 method shows similar results to the conventional IR–PGSE and SR–PGSE methods; however, PGSE–CWFP–T1 provides a faster analysis and low SAR due to the small flip angle at the CWFP–T1 method [12].
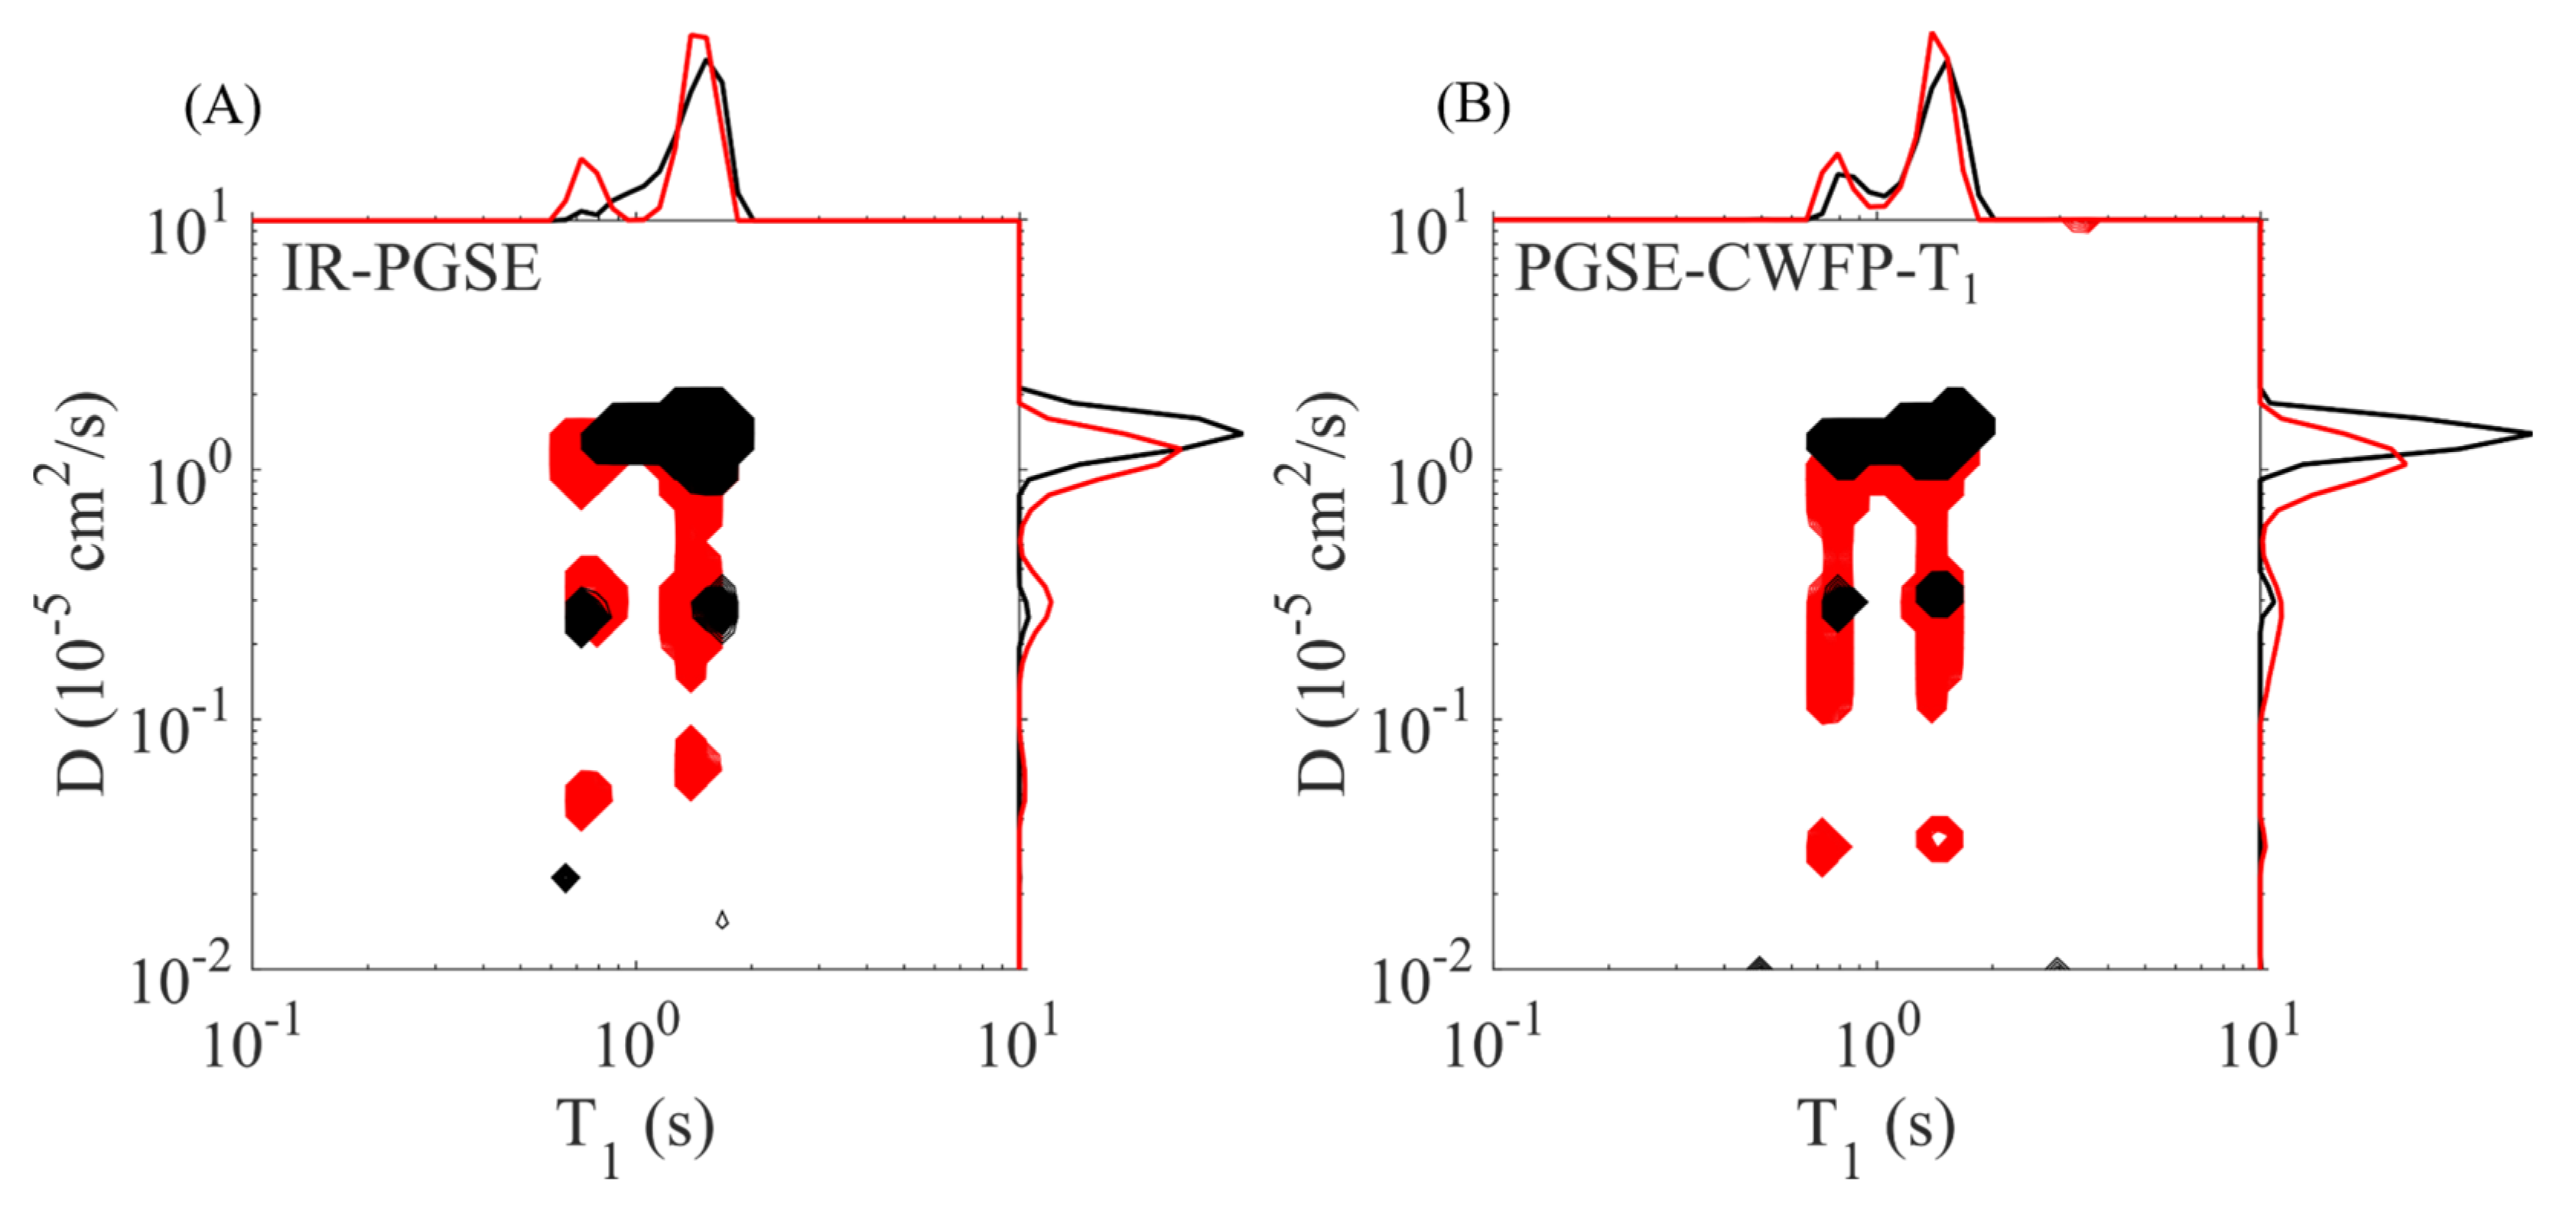
Figure 14 shows the D–T1 correlation maps obtained by IR–PGSE (A) and PGSE–CWFP–T1 (B) sequences for asparagus stems oriented parallel (in black) and perpendicular (in red) to the pulse field gradient direction. Both maps show similar results; however, PGSE–CWFP–T1 is much faster (up to an order of magnitude) than the IR–PGSE experiment [12]. Applications of the PGSE–CWFP–T1 sequence to measure D–T1 correlation in fruits and vegetables are showing promising results.

4. Conclusions

The recent 1D methods based on the CWFP regime or the low-power CPMG sequence have potential as alternatives to CPMG to enhance SNR and resolution and minimize instrumental or sample-heating problems, especially when fast analysis protocols are necessary for plant science studies. The new 2D pulse sequences (CPMG–CWFP–T1 and PGSE–CWFP–T1) based on the direct detection of CWFP–T1 signals are an alternative to obtain T2–T1 and D–T1 correlation maps, with better resolution and lower SAR than those from the standard 2D sequences and are an important advancement in the use of TD–NMR for plant science studies.

Author Contributions

Conceptualization, writing—original draft preparation, review and editing, T.M., T.B.M., and L.A.C.; experimental analysis, T.M.; funding acquisition and project administration, L.A.C. All authors have read and agreed to the published version of the manuscript.

Funding

This research was funded by FAPESP, grant numbers 2019/13656-8 and 2020/07017-0 and CNPq 302866/2017-5.

Institutional Review Board Statement

Not applicable.

Informed Consent Statement

Not applicable.

Data Availability Statement

Not applicable.

Conflicts of Interest

The authors declare no conflict of interest.

References

  1. Todt, H.; Burk, W.; Guthausen, G.; Guthausen, A.; Kamlowski, A.; Schmalbein, D. Quality control with time-domain NMR. Eur. J. Lipid Sci. Technol. 2001, 103, 835–840. [Google Scholar] [CrossRef]
  2. Cobo, M.F.; Deublein, E.J.; Haber, A.; Kwamen, R.; Nimbalkar, M.; Decker, F. TD–NMR in Quality Control: Standard Applications. In Modern Magnetic Resonance; Webb, G.A., Ed.; Springer International Publishing: Berlin/Heidelberg, Germany, 2017; pp. 1–18. [Google Scholar]
  3. Colnago, L.A.; Wiesman, Z.; Pages, G.; Musse, M.; Monaretto, T.; Windt, C.W.; Rondeau-Mouro, C. Low field, time domain NMR in the agriculture and agrifood sectors: An overview of applications in plants, foods and biofuels. J. Magn. Reson. 2021, 323, 106899. [Google Scholar] [CrossRef] [PubMed]
  4. Kingsley, P.B. Methods of measuring spin-lattice (T1) relaxation times: An annotated bibliography. Concepts Magn. Reson. 1999, 11, 243–276. [Google Scholar] [CrossRef]
  5. Meiboom, S.; Gill, D. Modified Spin-Echo Method for Measuring Nuclear Relaxation Times. Rev. Sci. Instrum. 1958, 29, 688–691. [Google Scholar] [CrossRef] [Green Version]
  6. Hürlimann, M.D.; Venkataramanan, L. Quantitative Measurement of Two-Dimensional Distribution Functions of Diffusion and Relaxation in Grossly Inhomogeneous Fields. J. Magn. Reson. 2002, 157, 31–42. [Google Scholar] [CrossRef]
  7. Voda, M.A.; van Duynhoven, J. Characterization of food emulsions by PFG NMR. Trends Food Sci. Technol. 2009, 20, 533–543. [Google Scholar] [CrossRef]
  8. Nestle, N.; Qadan, A.; Galvosas, P.; Süss, W.; Kärger, J. PFG NMR and internal magnetic field gradients in plant-based materials. Magn. Reson. Imaging 2002, 20, 567–573. [Google Scholar] [CrossRef]
  9. Newling, B.; Batchelor, S.N. Pulsed Field Gradient NMR Study of the Diffusion of H2O and Polyethylene Glycol Polymers in the Supramolecular Structure of Wet Cotton. J. Phys. Chem. B 2003, 107, 12391–12397. [Google Scholar] [CrossRef]
  10. Van Duynhoven, J.; Voda, A.; Witek, M.; Van As, H. Time-Domain NMR Applied to Food Products. In Annual Reports on NMR Spectroscopy; Academic Press: Cambridge, MA, USA, 2010; Volume 69, pp. 145–197. [Google Scholar]
  11. Marigheto, N.; Venturi, L.; Hibberd, D.; Wright, K.M.; Ferrante, G.; Hills, B.P. Methods for peak assignment in low-resolution multidimensional NMR cross-correlation relaxometry. J. Magn. Reson. 2007, 187, 327–342. [Google Scholar] [CrossRef]
  12. Montrazi, E.T.; Monaretto, T.; Bonagamba, T.J.; Colnago, L.A. New and rapid pulse sequences for two-dimensional D-T1 correlation measurements. J. Magn. Reson. 2020, 315, 106749. [Google Scholar] [CrossRef] [PubMed]
  13. Monaretto, T.; Montrazi, E.T.; Moraes, T.B.; Souza, A.A.; Rondeau-Mouro, C.; Colnago, L.A. Using T1 as a direct detection dimension in two-dimensional time-domain NMR experiments using CWFP regime. J. Magn. Reson. 2020, 311, 106666. [Google Scholar] [CrossRef]
  14. Moraes, T.B.; Monaretto, T.; Colnago, L.A. Rapid and simple determination of T1 relaxation times in time-domain NMR by Continuous Wave Free Precession sequence. J. Magn. Reson. 2016, 270, 1–6. [Google Scholar] [CrossRef] [PubMed]
  15. Monaretto, T.; Andrade, F.D.; Moraes, T.B.; Souza, A.A.; de Azevedo, E.R.; Colnago, L.A. On resonance phase alternated CWFP sequences for rapid and simultaneous measurement of relaxation times. J. Magn. Reson. 2015, 259, 174–178. [Google Scholar] [CrossRef] [PubMed]
  16. de Andrade, F.D.; Netto, A.M.; Colnago, L.A. Qualitative analysis by online nuclear magnetic resonance using Carr–Purcell–Meiboom–Gill sequence with low refocusing flip angles. Talanta 2011, 84, 84–88. [Google Scholar] [CrossRef]
  17. Van Der Weerd, L.; Claessens, M.M.A.E.; Efdé, C.; Van As, H. Nuclear magnetic resonanceimaging of membrane permeability changes in plants during osmoticstress. Plant Cell Environ. 2002, 25, 1539–1549. [Google Scholar] [CrossRef]
  18. Musse, M.; De Franceschi, L.; Cambert, M.; Sorin, C.; Le Caherec, F.; Burel, A.; Bouchereau, A.; Mariette, F.; Leport, L. Structural changes in senescing oilseed rape leaves at tissue and subcellular levels monitored by nuclear magnetic resonance relaxometry through water status. Plant Physiol. 2013, 163, 392–406. [Google Scholar] [CrossRef] [Green Version]
  19. Carosio, M.G.A.; Bernardes, D.F.; Andrade, F.D.; Moraes, T.B.; Tosin, G.; Colnago, L.A. Measuring thermal properties of oilseeds using time domain nuclear magnetic resonance spectroscopy. J. Food Eng. 2016, 173, 143–149. [Google Scholar] [CrossRef]
  20. Musse, M.; Cambert, M.; Mariette, F. NMR Study of Water Distribution inside Tomato Cells: Effects of Water Stress. Appl. Magn. Reson. 2010, 38, 455–469. [Google Scholar] [CrossRef]
  21. Xu, F.; Jin, X.; Zhang, L.; Chen, X.D. Investigation on water status and distribution in broccoli and the effects of drying on water status using NMR and MRI methods. Food Res. Int. 2017, 96, 191–197. [Google Scholar] [CrossRef]
  22. Pereira, F.M.V.; Carvalho, A.d.S.; Cabeça, L.F.; Colnago, L.A. Classification of intact fresh plums according to sweetness using time-domain nuclear magnetic resonance and chemometrics. Microchem. J. 2013, 108, 14–17. [Google Scholar] [CrossRef]
  23. Carosio, M.G.A.; Bernardes, D.F.; Carvalho, A.d.S.; Colnago, L.A. Non-invasive Measurements of Oilseed Temperature in Soil and Soil Thermal Diffusivity Using Time-Domain NMR Relaxometry. Appl. Magn. Reson. 2018, 49, 1119–1127. [Google Scholar] [CrossRef]
  24. Borgia, G.C.; Brown, R.J.S.; Fantazzini, P. Uniform-Penalty Inversion of Multiexponential Decay Data: II. Data Spacing, T2 Data, Systematic Data Errors, and Diagnostics. J. Magn. Reson. 2000, 147, 273–285. [Google Scholar] [CrossRef] [Green Version]
  25. Schwenk, A. NMR pulse technique with high sensitivity for slowly relaxing systems. J. Magn. Reson. 1971, 5, 376–389. [Google Scholar] [CrossRef]
  26. Azeredo, R.B.V.; Colnago, L.A.; Souza, A.A.; Engelsberg, M. Continuous wave free precession: Practical analytical tool for low-resolution nuclear magnetic resonance measurements. Anal. Chim. Acta 2003, 478, 313–320. [Google Scholar] [CrossRef]
  27. Azeredo, R.B.V.; Colnago, L.A.; Engelsberg, M. Quantitative analysis using steady-state free precession nuclear magnetic resonance. Anal. Chem. 2000, 72, 2401–2405. [Google Scholar]
  28. Moraes, T.B.; Monaretto, T.; Colnago, L.A. Applications of Continuous Wave Free Precession Sequences in Low-Field, Time-Domain NMR. Appl. Sci. 2019, 9, 1312. [Google Scholar] [CrossRef] [Green Version]
  29. Colnago, L.A.; Azeredo, R.B.V.; Marchi Netto, A.; Andrade, F.D.; Venâncio, T. Rapid analyses of oil and fat content in agri-food products using continuous wave free precession time domain NMR. Magn. Reson. Chem. 2011, 49, S113–S120. [Google Scholar] [CrossRef]
  30. Ernst, R.R.; Anderson, W.A. Application of Fourier Transform Spectroscopy to Magnetic Resonance. Rev. Sci. Instrum. 1966, 37, 93–102. [Google Scholar] [CrossRef]
  31. Moraes, T.B.; Colnago, L.A. Simulação de sinais de RMN através das equações de Bloch. Química Nova 2014, 37, 1410–1416. [Google Scholar]
  32. Venâncio, T.; Engelsberg, M.; Azeredo, R.B.V.; Alem, N.E.R.; Colnago, L.A. Fast and simultaneous measurement of longitudinal and transverse NMR relaxation times in a single continuous wave free precession experiment. J. Magn. Reson. 2005, 173, 34–39. [Google Scholar] [CrossRef]
  33. Colnago, L.A.; Engelsberg, M.; Souza, A.A.; Barbosa, L.L. High-Throughput, Non-Destructive Determination of Oil Content in Intact Seeds by Continuous Wave-Free Precession NMR. Anal. Chem. 2007, 79, 1271–1274. [Google Scholar] [CrossRef]
  34. Ribeiro, F.Z.; Marconcini, L.V.; de Toledo, I.B.; de Vasconcellos Azeredo, R.B.; Barbosa, L.L.; Colnago, L.A. Nuclear magnetic resonance water relaxation time changes in bananas during ripening: A new mechanism. J. Sci. Food Agric. 2010, 90, 2052–2057. [Google Scholar] [CrossRef]
  35. de Andrade, F.D.; Marchi Netto, A.; Colnago, L.A. Use of Carr–Purcell pulse sequence with low refocusing flip angle to measure T1 and T2 in a single experiment. J. Magn. Reson. 2012, 214, 184–188. [Google Scholar] [CrossRef]
  36. Monaretto, T.; Souza, A.; Moraes, T.B.; Bertucci-Neto, V.; Rondeau-Mouro, C.; Colnago, L.A. Enhancing signal-to-noise ratio and resolution in low-field NMR relaxation measurements using post-acquisition digital filters. Magn. Reson. Chem. 2019, 57, 616–625. [Google Scholar] [CrossRef]
  37. Venkataramanan, L.; Yi-Qiao, S.; Hurlimann, M.D. Solving Fredholm integrals of the first kind with tensor product structure in 2 and 2.5 dimensions. IEEE Trans. Signal Process. 2002, 50, 1017–1026. [Google Scholar] [CrossRef]
  38. Song, Y.Q.; Venkataramanan, L.; Hürlimann, M.D.; Flaum, M.; Frulla, P.; Straley, C. T1–T2 Correlation Spectra Obtained Using a Fast Two-Dimensional Laplace Inversion. J. Magn. Reson. 2002, 154, 261–268. [Google Scholar] [CrossRef]
  39. Song, Y.-Q. A 2D NMR method to characterize granular structure of dairy products. Prog. Nucl. Magn. Reson. Spectrosc. 2009, 55, 324–334. [Google Scholar] [CrossRef]
  40. Hürlimann, M.D.; Burcaw, L.; Song, Y.-Q. Quantitative characterization of food products by two-dimensional D–T2 and T1–T2 distribution functions in a static gradient. J. Colloid Interface Sci. 2006, 297, 303–311. [Google Scholar] [CrossRef]
  41. Rondeau Mouro, C. 2D TD–NMR Analysis of Complex Food Products. In Modern Magnetic Resonance; Webb, G.A., Ed.; Springer: London, UK, 2018; pp. 1483–1502. [Google Scholar]
  42. Meiri, N.; Berman, P.; Colnago, L.A.; Moraes, T.B.; Linder, C.; Wiesman, Z. Liquid-phase characterization of molecular interactions in polyunsaturated and n-fatty acid methyl esters by (1)H low-field nuclear magnetic resonance. Biotechnol. Biofuels 2015, 8, 96. [Google Scholar] [CrossRef] [Green Version]
  43. Berman, P.; Meiri, N.; Colnago, L.A.; Moraes, T.B.; Linder, C.; Levi, O.; Parmet, Y.; Saunders, M.; Wiesman, Z. Study of liquid-phase molecular packing interactions and morphology of fatty acid methyl esters (biodiesel). Biotechnol. Biofuels 2015, 8, 12. [Google Scholar] [CrossRef] [Green Version]
Figure 1. Diagram for the CPMG pulse sequence (θ = π) and for the CPMG with a low flip refocusing pulse (θ ≤ π).
Plants 10 00833 g001
Figure 2. Experimental CPMG signals using refocusing angle pulse of π, 3π/4, π/2, and π/4 for soybean oil in different homogeneities (Δν = 15 Hz (A,B) and 100 Hz (C,D)), τ = 0.1 ms (left) and 0.4 ms (right). Adapted from publication [16]. Copyright (2011), with permission from Elsevier.
Plants 10 00833 g002
Figure 3. (A) CPMG signals and (B) its inverse Laplace transform (ILT) obtained from castor bean seed (oil signal) using π (red line) and π/2 (black line) as a refocusing pulse. The dashed-dotted line in (B) is the guide to the signal center.
Plants 10 00833 g003
Figure 4. Correlation between T2 values obtained with the CPMG and LRFA–CPMG methods using π/2 as a refocusing and different oilseed species; r = 0.98. Adapted from Publication [16]. Copyright (2011) with permission from Elsevier.
Plants 10 00833 g004
Figure 5. Continuous wave free precession (CWFP) pulse sequences that generate a special steady state free precession (SSFP) condition in the magnetization, when Tp < T2* < T2.
Plants 10 00833 g005
Figure 6. NMR signals simulated numerically using T1 = 150 ms, T2 = 50 ms, T2* = 0.5 ms, and different Tp values. (A) Tp = 2.9T2*, (B,C) Tp < T2*. The frequency offset is 8.333 kHz (A,B) and 6.666 kHz (C). Adapted from Publication [28].
Plants 10 00833 g006
Figure 7. Typical CWFP signal (magnitude) obtained from the first pulse. The dark grey region indicates the initial signal that oscillates for a time that is dependent on T2*. When the oscillation stops, a quasi-stationary state (QSS) signal is observed (red arrow). The light grey region shows T* decay from the QSS to the steady state regime |Mss| (white region).
Plants 10 00833 g007
Figure 8. Pulse diagram for CP–CWFP (ϕ = x)/CP–CWFPx−x (ϕ = −x) pulse sequences. Adapted from publication [15]. Copyright (2015), with permission from Elsevier.
Plants 10 00833 g008
Figure 9. Pulse diagram for the CWFP–T1 pulse sequences. Adapted from publication [14]. Copyright (2016), with permission from Elsevier.
Plants 10 00833 g009
Figure 10. Inversion recovery signal (black points) and the CWFP–T1 signal (gray line) obtained for a water sample at 27 °C. Adapted from publication [14]. Copyright (2016), with permission from Elsevier.
Plants 10 00833 g010
Figure 11. Pulse diagram for (A) conventional IR–CPMG and (B) CPMG–CWFP–T1 sequences.
Plants 10 00833 g011
Figure 12. T1–T2 correlation maps for castor beans oil at 40 °C (A,B) and green banana at 22 °C (C,D) obtained by the CPMG–CWFP–T1 (A,C) and IR-CPMG (B,D) methods.
Plants 10 00833 g012
Figure 13. PGSE–CWFP–T1 diagram pulse sequence to obtain fast D–T1 correlation maps. Adapted from publication [12]. Copyright (2020) with permission from Elsevier.
Plants 10 00833 g013
Figure 14. D–T1 correlation maps obtained by (A) IR–PGSE and (B) PGSE–CWFP–T1 methods for asparagus stems oriented parallel (in black) and perpendicular (in red) to the PFG. Adapted from publication [12]. Copyright (2020) with permission from Elsevier.
Plants 10 00833 g014
Publisher’s Note: MDPI stays neutral with regard to jurisdictional claims in published maps and institutional affiliations.