1. Introduction
The extracellular matrix (ECM) or cell wall of vascular plants is an interlaced array of cellulose, hemicellulose, pectin, and a variety of proteins that maintains cell structure, is a first barrier to pathogens, and provides a platform for cell adhesion [
1,
2,
3]. Pectin is laid down in Golgi-derived vesicles between two dividing cells and after the elaboration of a complex cellulose and protein mixture proximal to the cell membrane, the pectin remains enriched in the middle lamella, an area between the two cells [
4,
5,
6]. This pectin layer likely mediates cell adhesion, and its modification through de-esterification by esterases and their inhibitors [
7], elaboration of side chains [
8], or through cleavage, can alter the adhesive properties in a variety of organs [
9].
Pectin is synthesized in the Golgi in an esterified form, and then selectively de-esterified in specific locations in the extracellular matrix by a large family of pectin methylesterase (PMEs) that are highly regulated transcriptionally [
10]. Pectin methylesterase inhibitors (PMEIs), a family of 75 isoforms in Arabidopsis, are also tightly regulated and may interact in a pH dependent manner with specific PMEs to create a complex pattern of inhibition [
11,
12].
Polygalacturonases (PGs) hydrolyze pectin, loosen the cell wall, and allow for turgor-driven cellular growth, expansion, and cell separation [
9]. PG activity requires pectin de-esterification and because PMEs are needed for calcium crosslinking, while also being required for PG activity, it is not surprising that PME activity increases cellular adhesion in some tissues, while decreasing it in others. For example, a high level of pectin methylesterification is correlated with an increase in cellular adhesion and decreased cell separation in tetraspores and root border cells respectively [
13], while methylesterified pectin is correlated with a reduction in cellular adhesion in the mesophyll and pericarp [
2,
14,
15]. These two opposing examples may reflect a different balance of PG and PME activity that change the relative amounts of degradation versus crosslinking and hence adhesion.
Mutations in putative Golgi-localized glycosyl and methyl transferases have supported the role of homogalacturonan (HG) pectin in cellular adhesion. The
QUA1 and
QUA2 genes encode a Golgi-localized glycosyl and methyl transferase, respectively.
qua1 and
qua2 mutants of Arabidopsis have a 50% decrease in HG pectin and show weakened cellular adhesion and cell detachment in the hypocotyl [
16,
17,
18,
19,
20,
21]. While the
qua mutants show the importance of pectin abundance in cellular adhesion, other Arabidopsis mutants indicate that adhesion is not just dependent upon pectin abundance. A loss of function mutation in a putative Golgi-localized O-fucosyl transferase FRIABLE1 (FRB1) decreases adhesion without decreasing HG pectin abundance [
20]. Instead
frb1 changes the amount of galactose- and arabinose-containing oligosaccharides in the Golgi, and alters pectin methylesterification, extensin, and xyloglucan microstructure. While it is hypothesized FRB1 fucosylates a protein in the Golgi [
20], the precise target of FRB1 is unknown. It is likely that the
qua and
frb1 mutants affect adhesion through the same pathway because the
qua2/frb1 double mutant does not show an additive phenotype [
20]. While
frb1 shows complex changes to its cell wall, the mutant’s change in methylesterification may be directly responsible for its adhesion phenotype.
While mutations in
QUA1 [
16],
QUA2 [
19], and
FRB1 [
20] lead to either a reduction in pectin levels (
qua1,2) or a change in their esterification and modification (
frb1) and a subsequent loss in cell adhesion, it is also likely that pectin crosslinking via extensins can affect the organization and adhesion of the cell wall [
21,
22]. Null alleles of
EXT3 are lethal and lead to general cell wall disorganization, and
EXT3 is upregulated in
qua2 mutants [
21]. Studies using antiserum to a variety of extensin epitopes show a wide and varied distribution between tissue and species [
20,
23,
24], and the relationship between specific genes and these epitopes is not well established. The identification of a putative fucosyl transferase ESMERALDA1 (ESMD1), whose mutant suppresses an adhesion defect in
qua2 and
frb1 without restoring pectin levels, points to the existence of an uncharacterized signaling mechanism that controls cell adhesion [
25]. Thus, while pectin and its modification contribute to cellular adhesion, there are numerous other factors that are likely involved. To further our understanding of plant cell adhesion, a population of ethyl methanesulfonate (EMS) mutagenized Arabidopsis were screened for hypocotyl adhesion defects. This work describes the isolation of a new allele of
qua2, and of a suppressor of
qua2 that is a new allele of
SAB that encodes a previously described membrane protein required for microtubule organization [
26,
27]. The results also further support the essential role of pectin and its modification in cellular adhesion.
2. Results and Discussion
Ruthenium red binds to de-esterified pectin, but while it cannot penetrate the cell wall of wild type Arabidopsis hypocotyls, it can penetrate defective cell walls as it does stain hypocotyls of adhesion mutants
qua2-1 and
frb1-2 [
19,
25] (
Figure S1). Both mutant and wild type (WT) roots stain with ruthenium red. To identify new mutants in adhesion, dark grown seedlings of the M2 generation of ca. 5000 EMS mutagenized Arabidopsis seeds were screened for abnormal ruthenium red hypocotyl staining and visible cell detachment, and six mutants were identified (
Figure S1). In one mutant, 38Red, (38R,
Figure 1A), visible cell detachment, an irregular hypocotyl surface, and ruthenium red staining is shown in
Figure 1A. To more closely view the cells of the hypocotyl, propidium iodide was used as a general hypocotyl cell surface stain, a three-dimensional image was created using confocal microscopy, and the results are shown in
Figure 1B. Confocal microscopy of propidium iodide stained hypocotyls showed that cells are misplaced and curled (
Figure 1B). In the M3 generation of a 38R self cross, only six out of seven seedlings had hypocotyls staining red and a new non-staining phenotype with a short, swollen root and hypocotyl appeared in the remaining seventh (
Figure 1A, 38R arrow, and 38S). This new stumpy mutant called 38 short (38S) was expected to be homozygous for the 38R allele causing red staining, but also to carry an additional allele that suppressed red staining. In order to verify this, the 38R mutation was first characterized.
The 38R appeared similar to WT on soil (
Figure 1C) and produced healthy siliques. The red staining M3 seedling was transferred to soil and then crossed to WT and F1 hypocotyls from this backcross (38R
+/−), which are shown in
Figure S2 and do not stain with ruthenium red, which indicated that the mutation responsible for the 38R adhesion phenotype is recessive.
The 38R has a phenotype similar to but weaker than
qua2-1, and polymerase chain reaction (PCR) -based sequencing shows that 38R is homozygous for a new
qua2-4 allele, causing a change of a conserved glycine to a glutamic acid at amino acid 580 in the amino transferase domain (
Figure S3) [
19]. All F1 progeny of a 38R
−/− crossed with
qua2-1 stain with ruthenium red, indicating that
qua2-1 fails to complement 38R (
Figure S4A). PCR-based sequencing of these F1 show that the 38R and
qua2-1 alleles appear heterozygous as expected (
Figure S4B). The
qua2-4−/− plant was then crossed with
esmd1-1−/− and F2 progeny homozygous for both loci were identified by PCR and sequencing of the two loci.
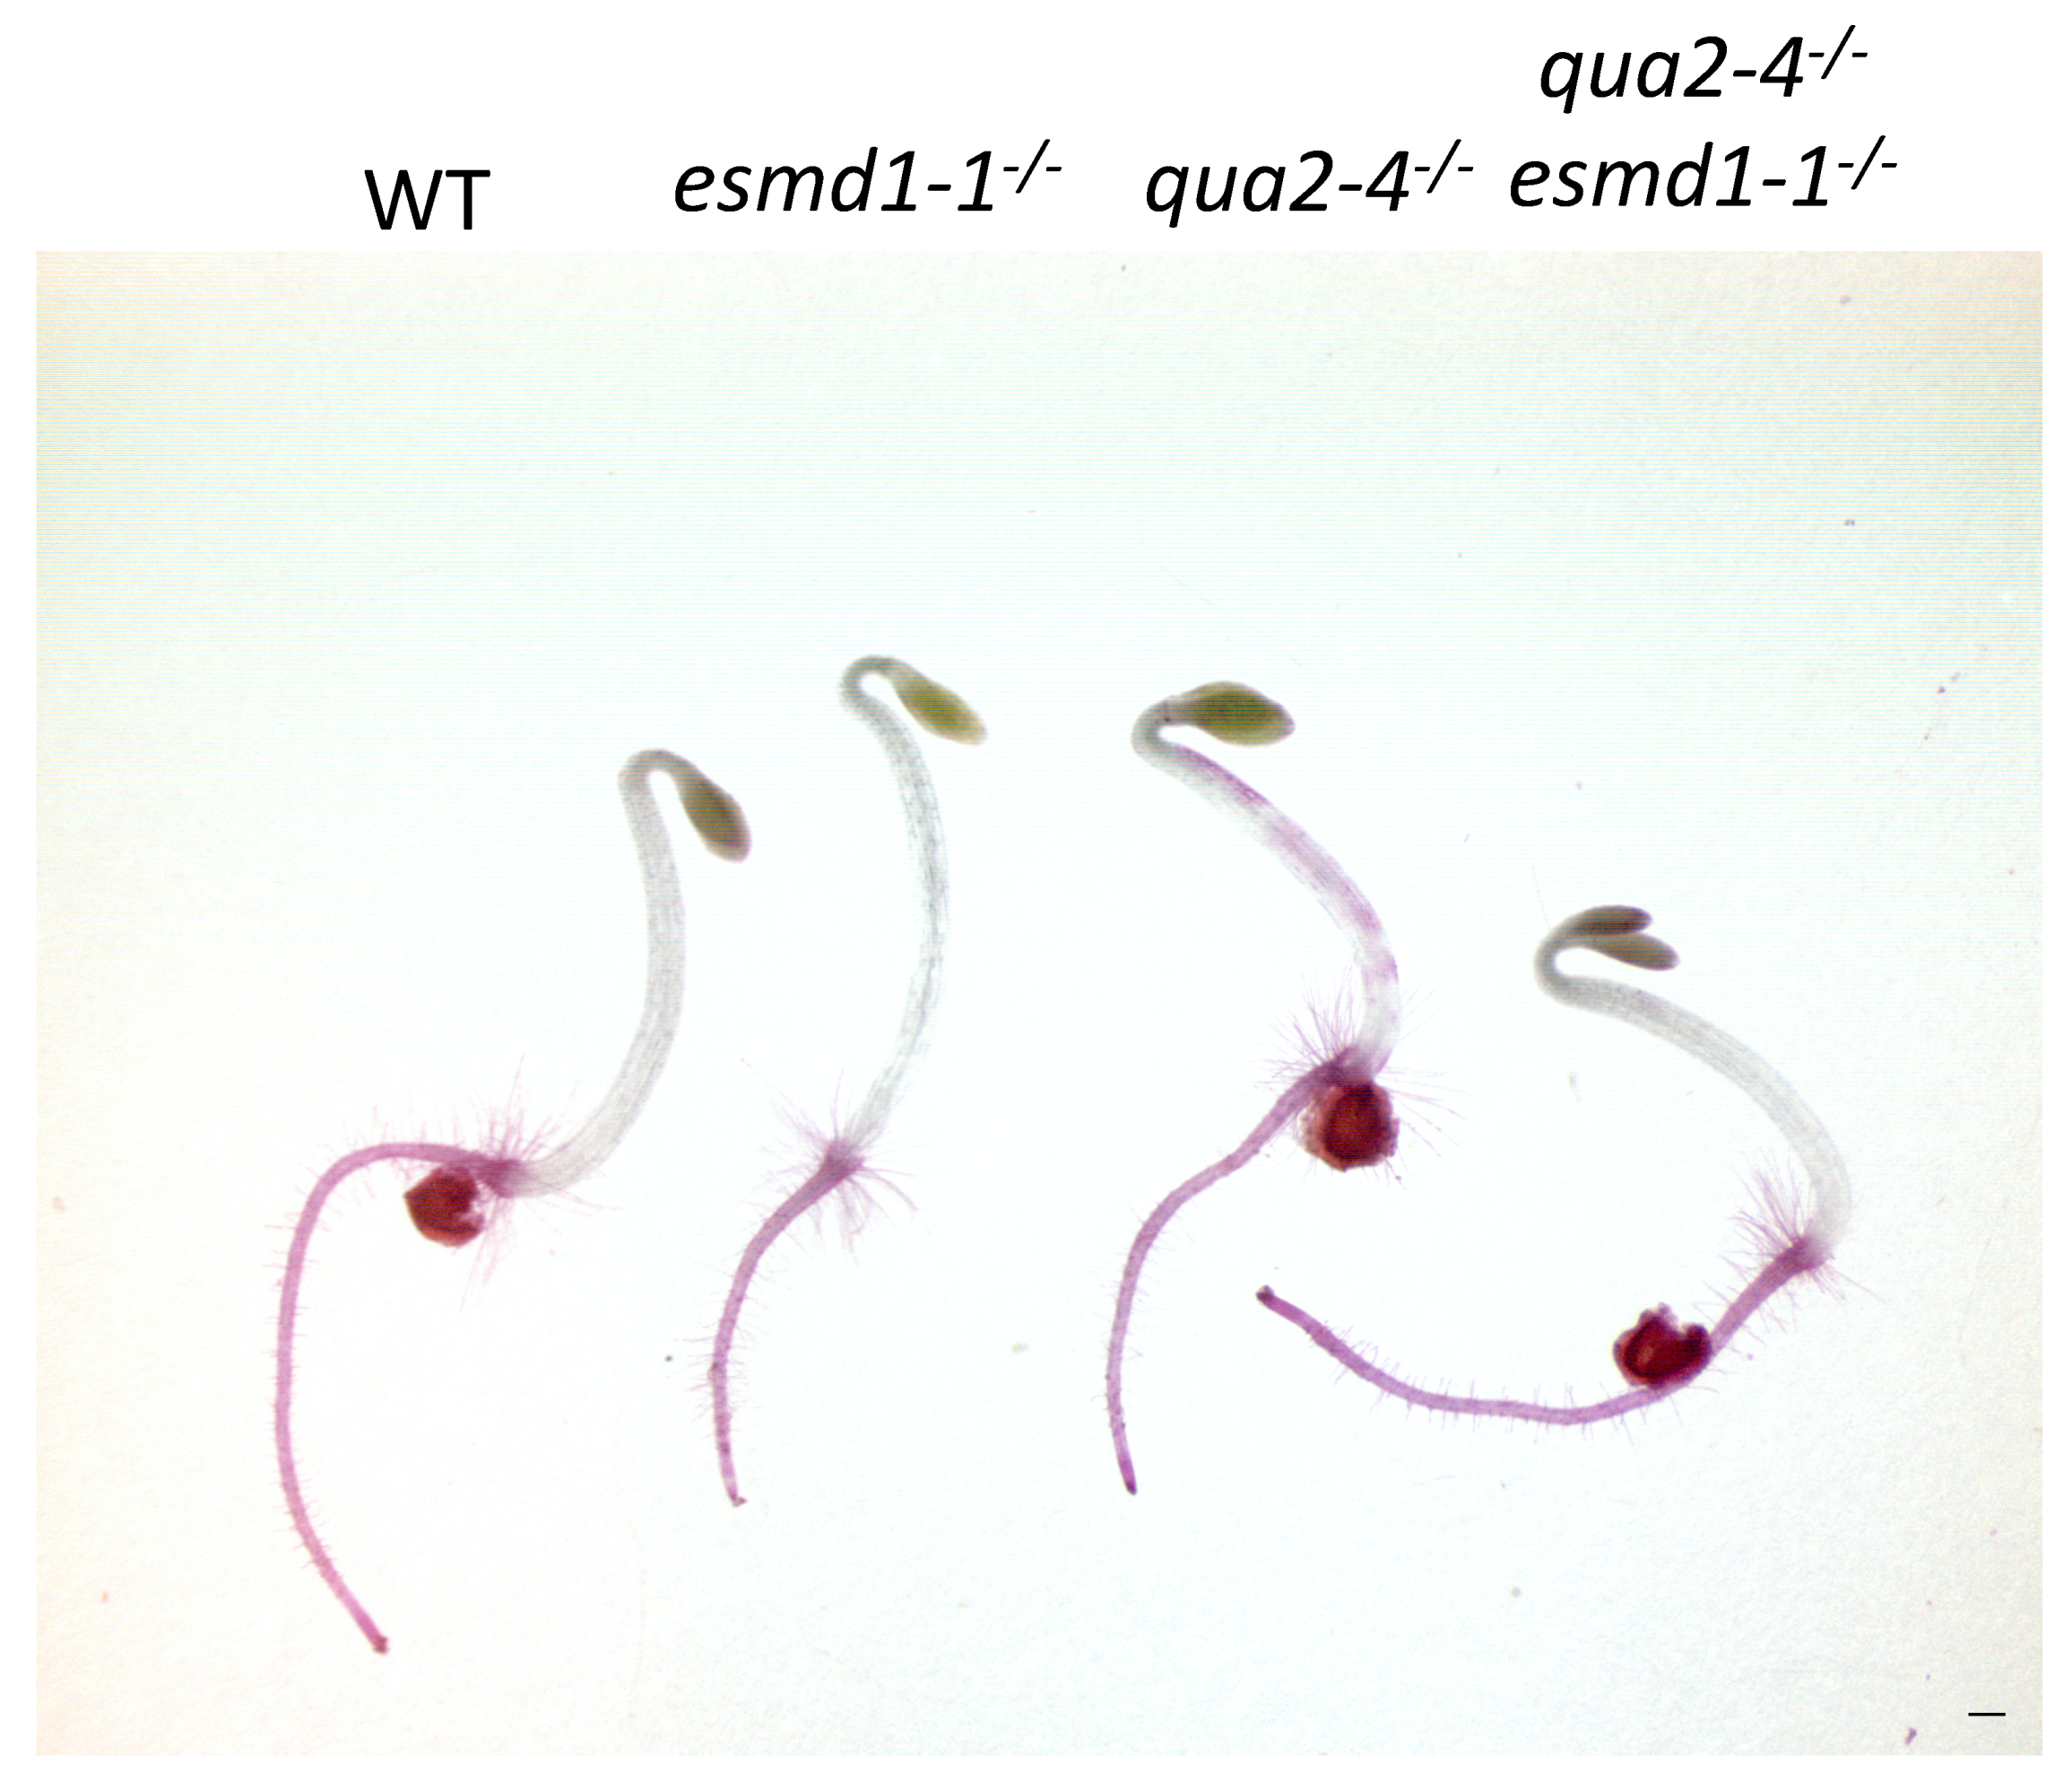
Figure 2 shows that dark grown hypocotyls of
qua2-4−/− esmd1-1−/− do not stain with ruthenium red, indicating that
esmd1-1, that suppresses both
qua2-1 and
frb1-2 [
25], also suppresses
qua2-4 (
Figure 2).
The 38R M3 population also contained a seedling, 38S, that was stunted and did not stain with ruthenium red (
Figure 1A, arrows). Because the 38S phenotype initially appeared in 8 out of the 58 plants observed and not in the expected one quarter of the population, and all M3 seeds germinated, the allele responsible for the 38S phenotype likely causes male or female gametophyte lethality. On soil, the 38S mutant exhibited short shoots, smaller irregularly shaped leaves, and did not produce functional siliques (
Figure 1C). The
QUA2 gene from 38S leaves was PCR amplified and sequenced and M3 38S was homozygous for
qua2-4, indicating 38S carries a suppressor of
qua2-4.
Confocal microscopy of M3 38S propidium iodide stained hypocotyls shows that both the hypocotyls and the cells of the hypocotyl appear smaller than WT, and bulge outward relative to WT (
Figure 1B). This is consistent with a loss of longitudinal expansion [
28], but this was not quantified further since genetic analysis revealed that 38S is a well characterized mutant (see below).
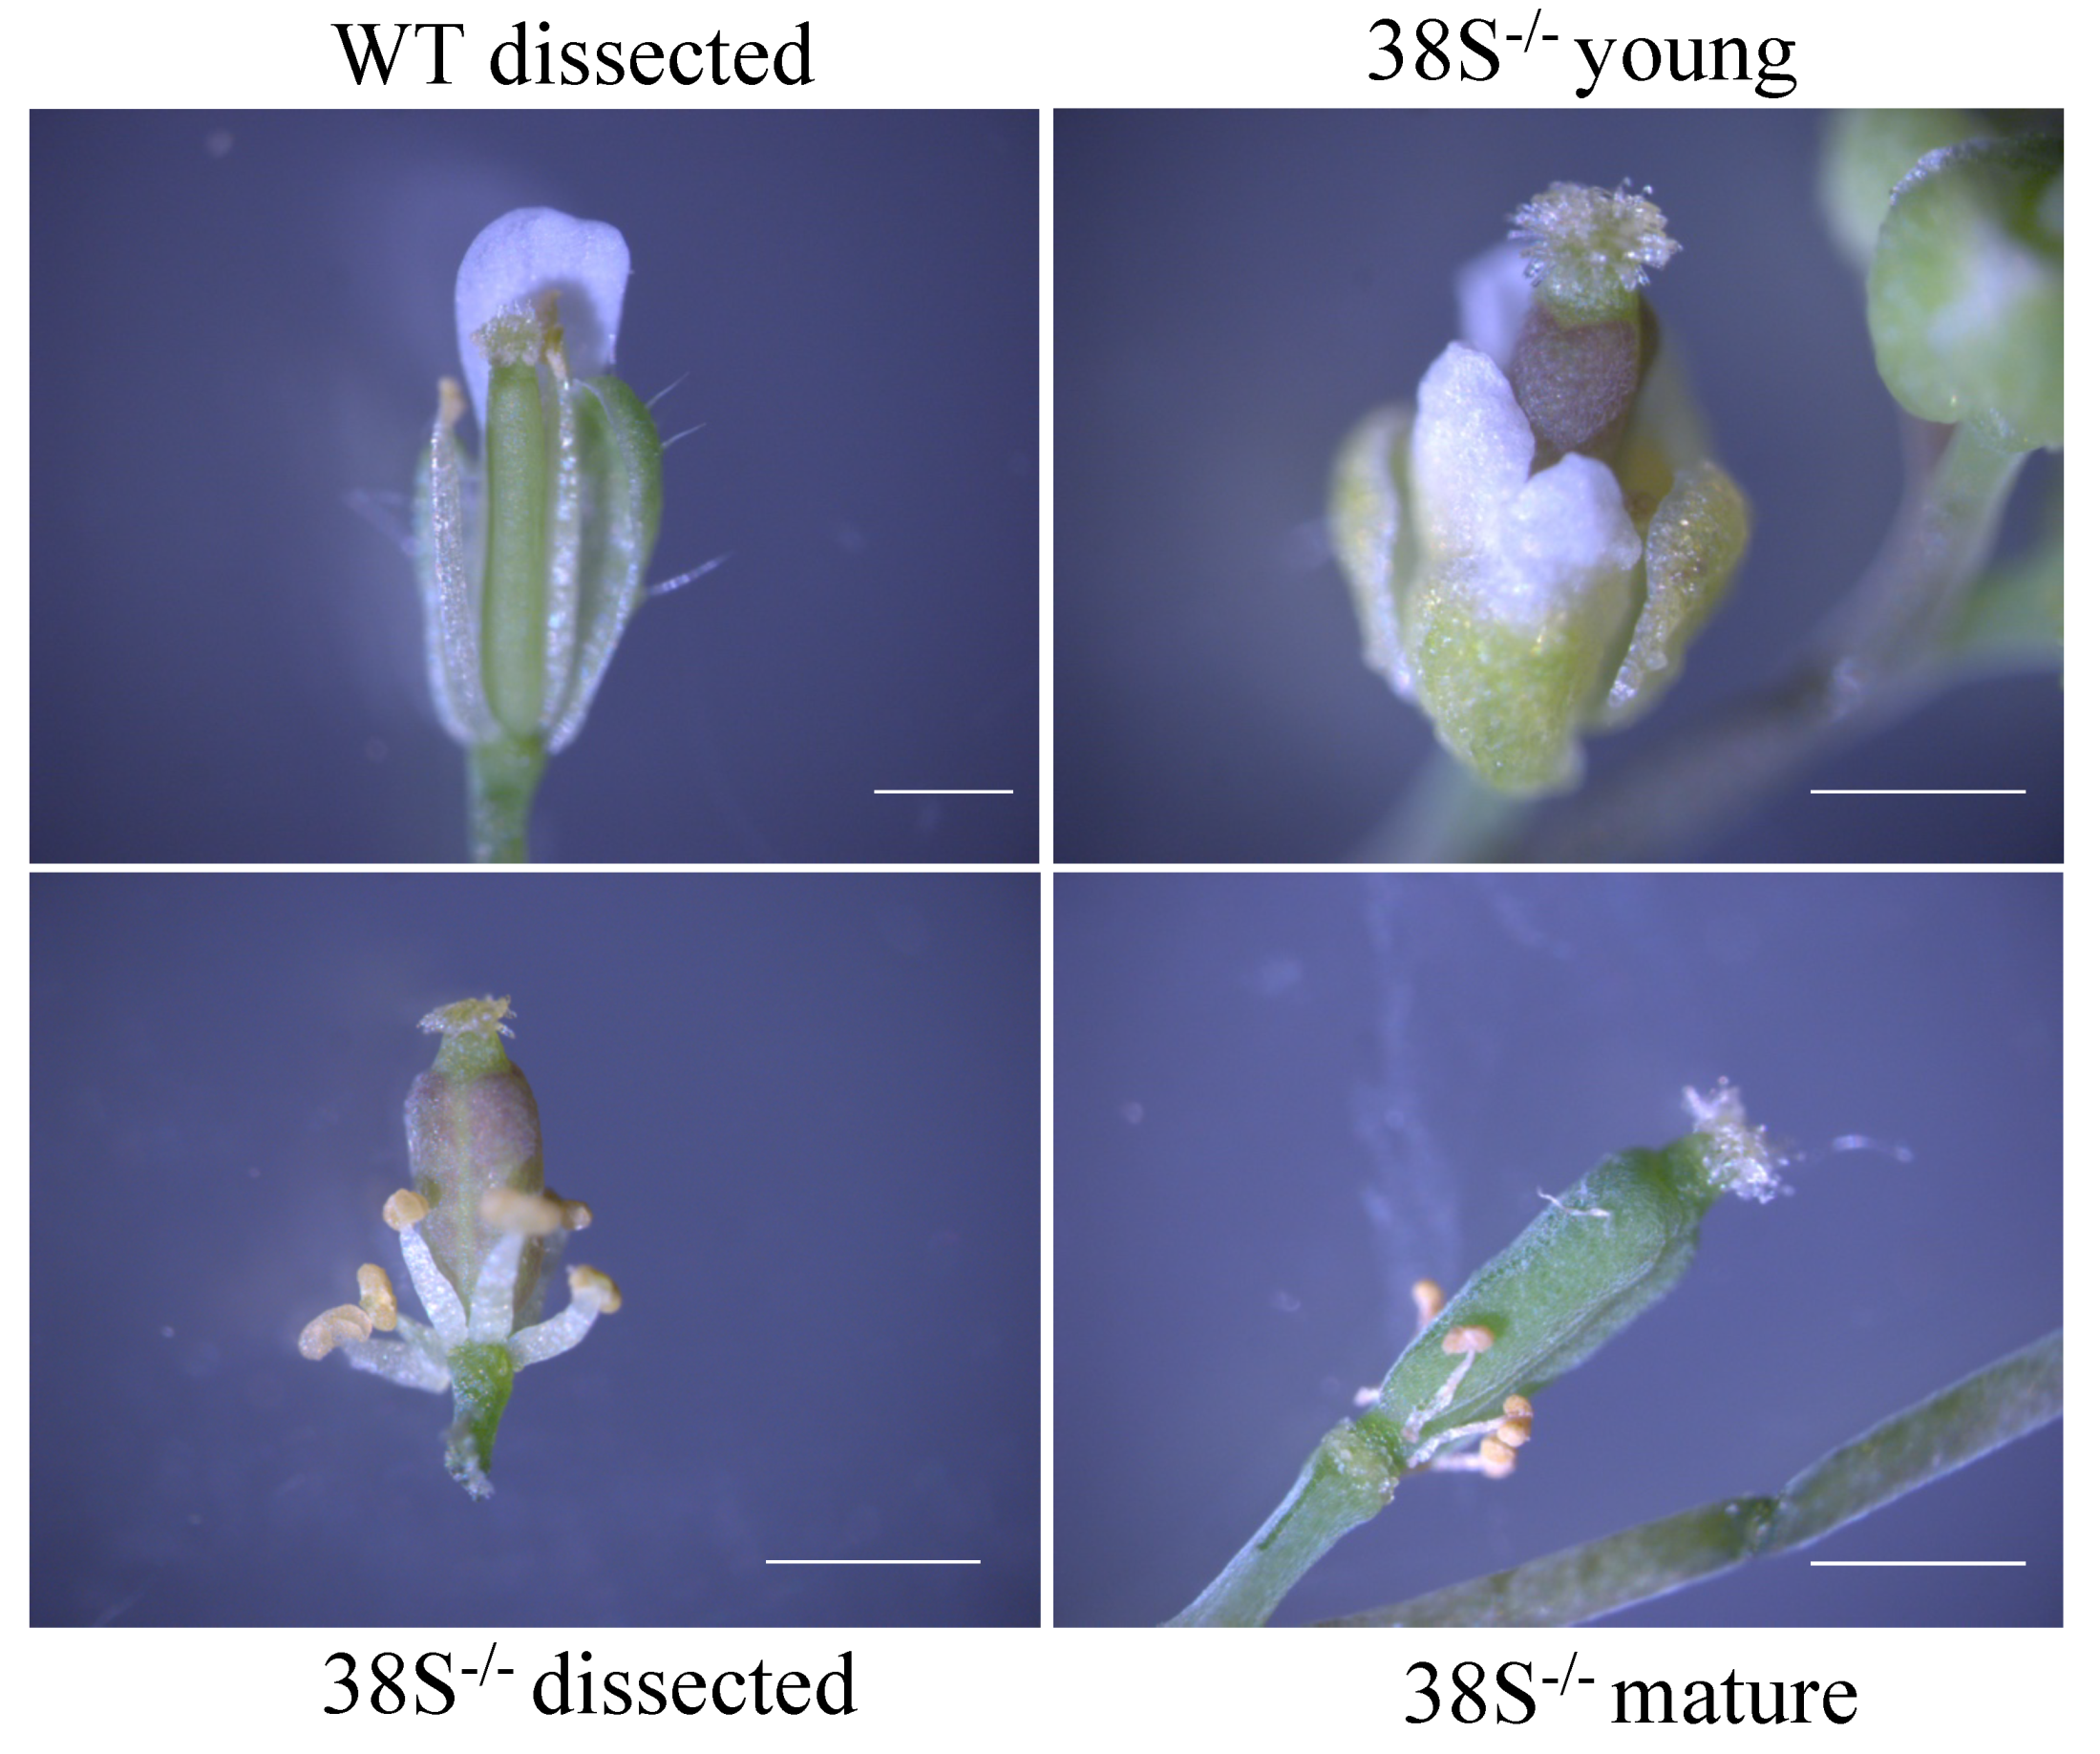
M3 38S did not produce normal siliques, and to evaluate this further the flowers were visualized by microscopy and partial dissection, and the results are shown in
Figure 3. The 38S petals and sepals are malformed (
Figure 3, 38S
−/− young), and as 38S flowers matured, the stamens remained short and withered (
Figure 3, 38S
−/− mature). Thus, the lack of normal siliques is likely due to a lack of stamen elongation and the inability of pollen to reach the stigma (
Figure 3). The 38S pollen is fertile because malformed stamens of 38S can be used to pollinate wild type (backcross) to produce heterozygous 38S F1. However, even when fertilized with WT pollen, 38S flowers did not produce siliques, indicating that the female infertility of 38S likely results from abnormalities in gynoecium maturation and/or female gamete production.
To determine if the 38S mutation was recessive, the hypocotyls of the F1 progeny of the 38SxWT (backcross) were examined by microscopy and ruthenium red staining and the results are shown in
Figure S2. All F1 appeared wild type and hence the allele is recessive (
Figure S2, 38S
+/−). As expected, one seventh of the F2 generation of this backcross appeared stumpy when grown on agar in the light or in the dark in liquid. To determine if the 38S phenotype required the presence of the
qua2-4 allele, the
QUA2 gene was sequenced from eight stumpy seedlings (38S
−/−) that appeared in the F2 generation of a 38S
−/+ x WT. Of these eight stumpy seedlings, four were homozygous for
qua2-4, three were heterozygous
qua2-4, and one was homozygous WT. This result confirmed that the 38S stumpy phenotype does not require the
qua2-4 allele (
Figure 1C).
To identify the mutation responsible for the 38S phenotype, 38S was backcrossed to WT, the F1 was then self crossed, and the F2 generation was planted on soil or in liquid. As expected, 101 of the 700 progeny showed a stunted (38S homozygote) growth phenotype. Leaves from 101 stunted F2 mutants from soil were pooled, and separately 115 dark grown mutant hypocotyls from liquid were pooled and DNA was then extracted from each pool and sequenced. Because only stunted plants were sequenced, all were necessarily homozygous for the stunted allele, and therefore during sequencing the causative mutation would be expected to appear with 100% frequency. Most other background mutations would be expected to segregate and appear with less than 100% frequency [
29].
The pooled genome sequence from 101 38SxWT F2 38S stunted soil grown plants was analyzed using artMAP [
29], which calculates allele frequencies and maps these to the Arabidopsis genome. The analysis indicated that nine mutations appear with 100% frequency in this F2 pool (
Table 1). In the DNA sample from the hypocotyl pool, all of the same mutations as in the leaf pool were detected, except a mutation in mitochondrial DNA was found and there were no mutants on chromosome 3 at 100% frequency. The only mutation that appeared with 100% frequency and was predicted to have an amino change within the coding region of a gene was the change from a cytosine to a thymine that appeared within the
SABRE gene (At1g58250). The mutation lying in the
SABRE (
SAB) gene introduces a premature stop codon at amino acid 455 of the 2655 amino acid long multi-transmembrane protein that has been previously shown to organize tubulin and is responsible for longitudinal cellular expansion [
26,
27]. Like 38S, hypocotyls of the previously characterized
sab mutants do not elongate, and
sab mutants exhibit a dwarfed phenotype highly similar to 38S [
26]. A
sab1-5−/+ having a TDNA insertion that causes a null allele was crossed with a 38S
−/+ [
26] (note that neither homozygotes can be fertilized), and if the 38S and
sab mutations were in different genes then all F1 should appear WT. Since 6 of 22 F1 seedlings (
Figure S5, arrows) showed the stunted phenotype while the remainder appear similar to WT,
sab1-5 does not complement 38S and hence the mutations are in the same gene.
qua2-1 causes a 50% reduction in pectin content but no other cell wall alterations and this deficiency is thought to explain the loss of cell adhesion [
19], and since
qua2-4 is a weaker allele, it was also expected to only reduce pectin levels, and have no other cell wall changes. The restoration in cell adhesion by
sab1 could be due to an increased level of pectin in
sab1 mutants relative to WT, or through a reduced cell surface area that requires less pectin for sufficient adhesion. To determine how
sab1 might suppress
qua2, the pectin content was assayed by measuring ammonium oxalate extracted uronic acid in leaves of
qua2-4−/−, sab−/−qua2-4−/−, and
sab−/− (insufficient material can be collected from stunted hypocotyls). An ammonium oxalate enrichment is necessary to detect reduced pectin in
qua2-1, as pectin changes in mutants such as
qua2 are detected only after ammonium oxalate enrichment but not in cell wall alcohol insoluble residue (AIR) fractions [
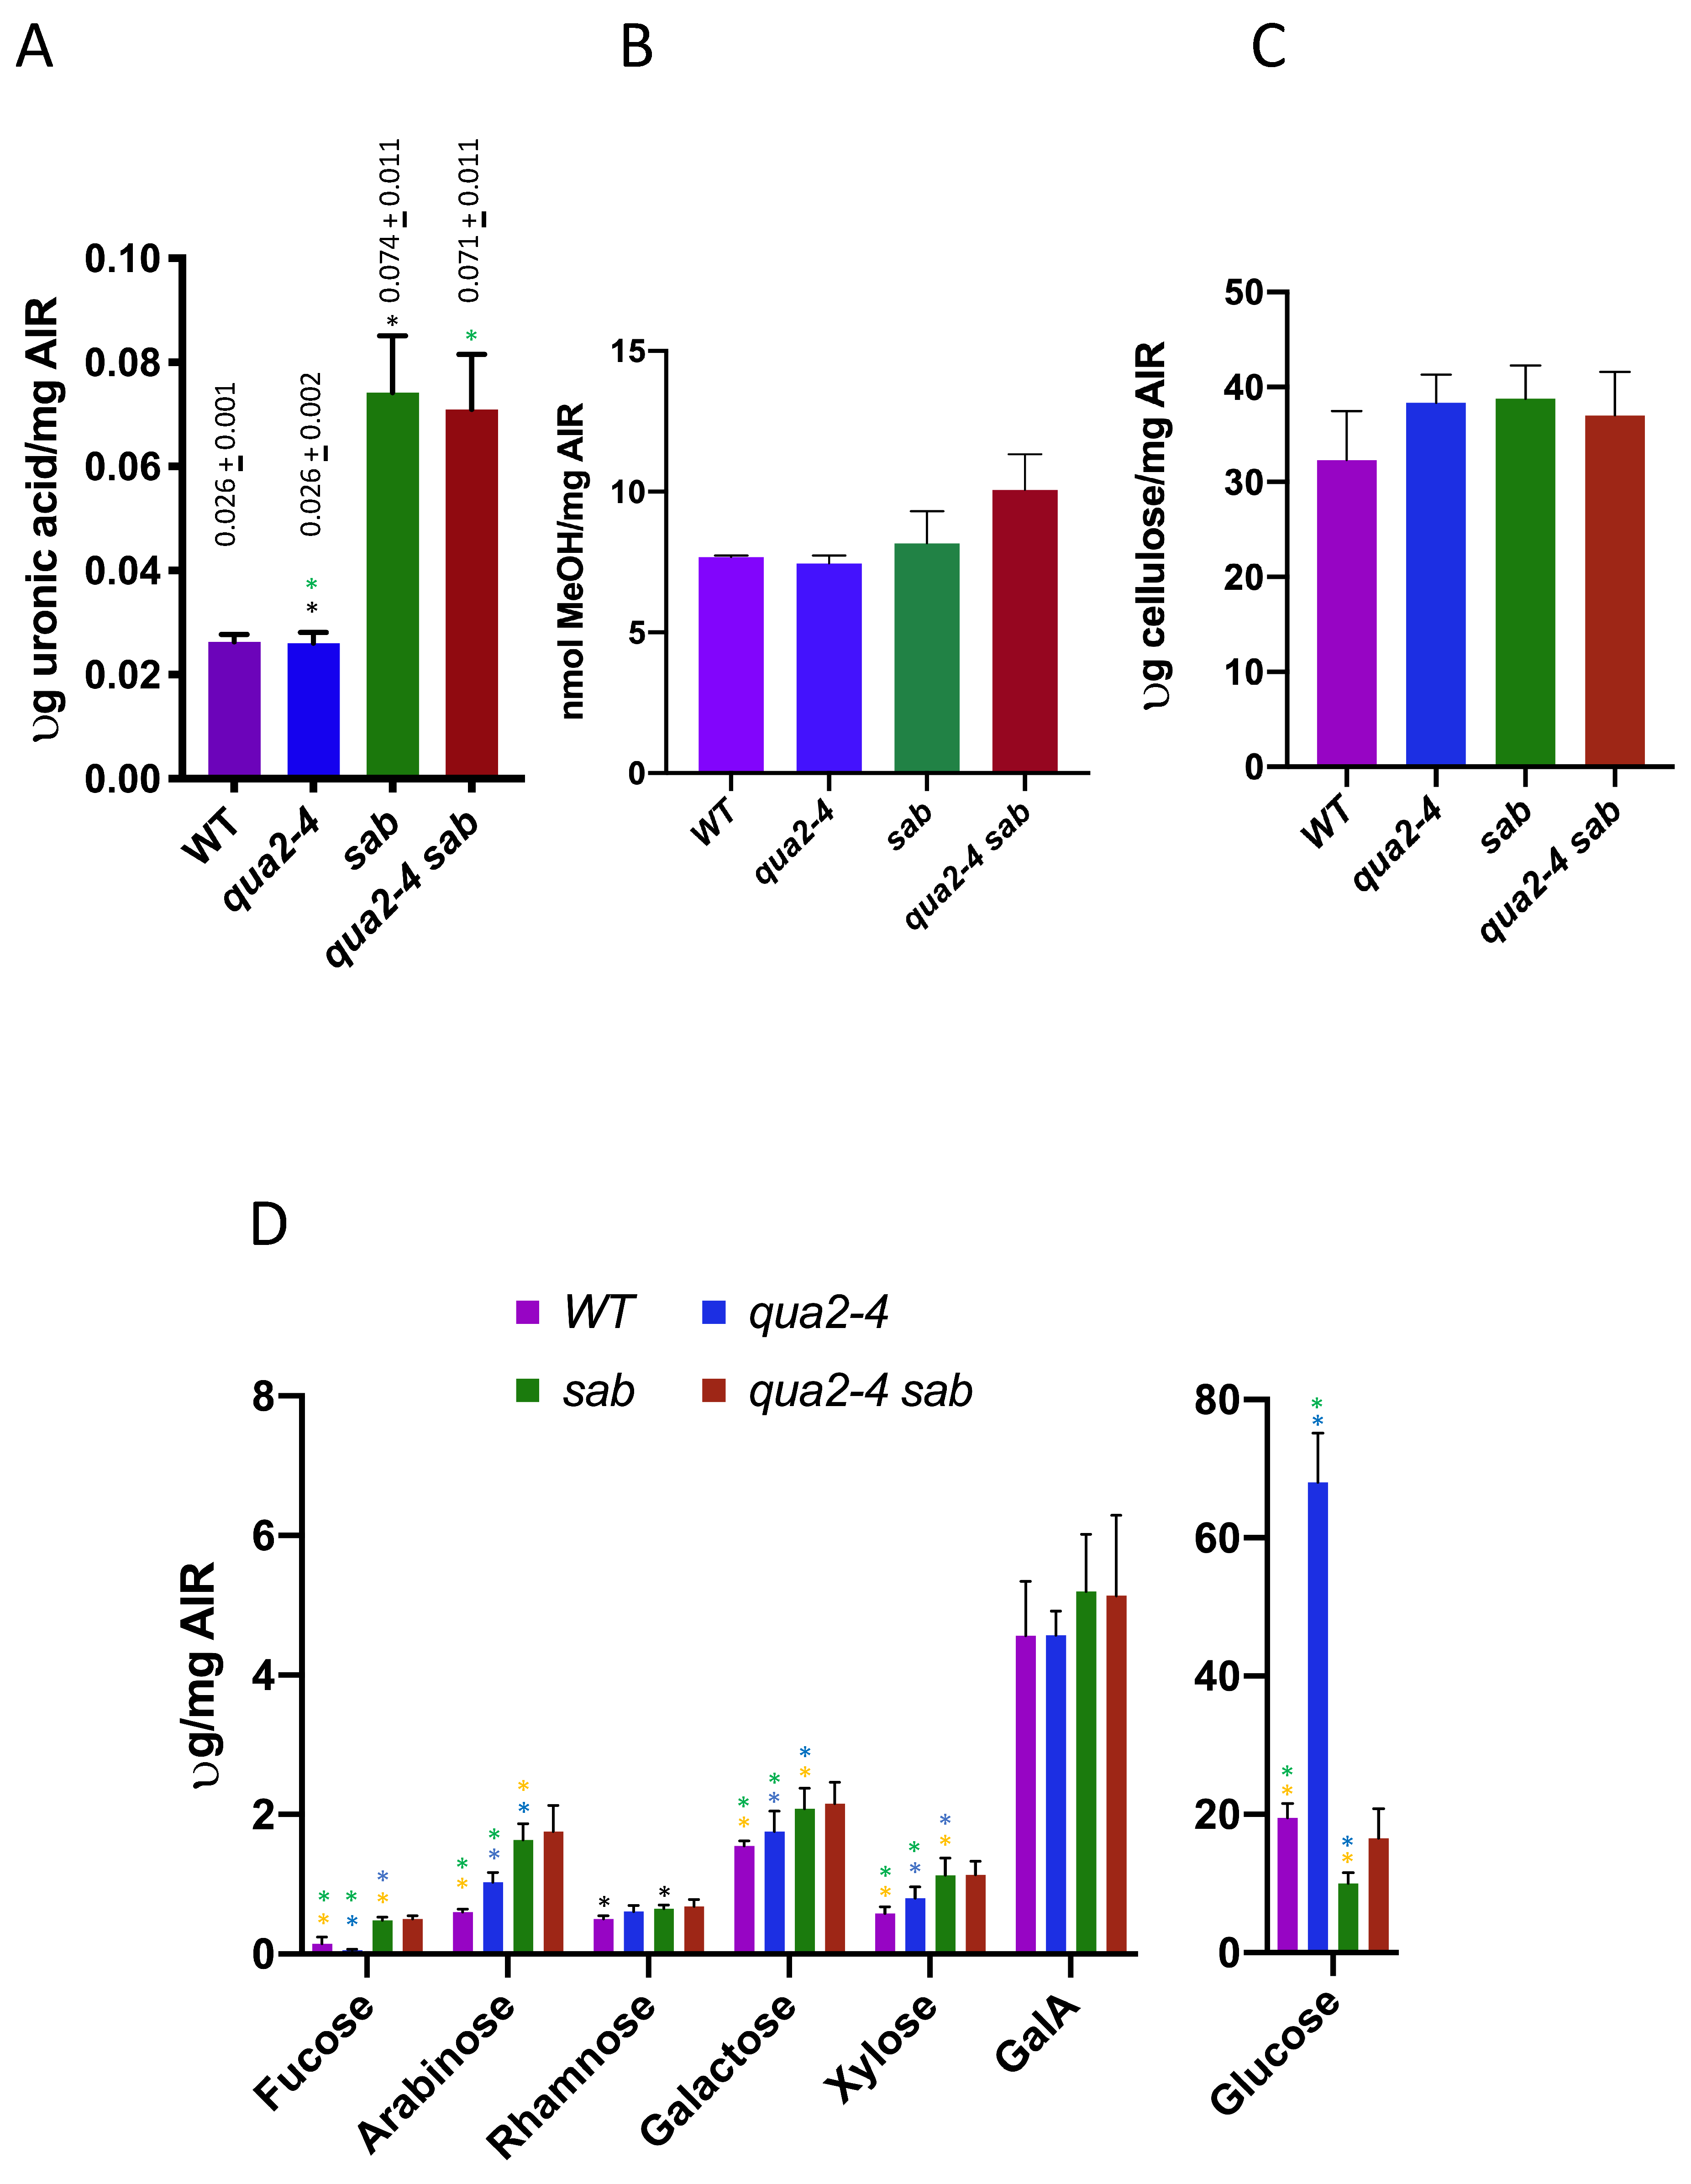
19]. The results are shown in
Figure 4, and both
sab−/− and
sab−/− qua2-4−/− show several fold higher levels of galacturonic acid than do WT and
qua2-4−/− (
t test,
p < 0.01, green and black asterisks). Thus,
sab1 over-compensates for pectin levels and thereby rescues a possible pectin deficiency caused by
qua2-4. However, no difference was detected in pectin levels between WT and
qua2-4−/− (
t test,
p > 0.01), and while this was not expected since
qua2-4−/− does affect adhesion (albeit less than
qua2-1) and is an allele of a gene required for pectin abundance, this method may be insufficiently sensitive to detect a small reduction especially in leaves. In addition, the
qua2-1 allele shows no reduction in leaves and previous differences with WT were only detected in dark grown hypocotyls [
16,
19,
25]. The level of pectin methylesterification was also determined by measuring the amount of methanol released from NaOH treated AIR preparations, and there are no differences between WT and the three mutant genotypes (
t test
p > 0.05,
Figure 4B). Since
sab−/− and
qua2-4−/− sab−/− have elevated levels of pectin, this implies that the level of pectin esterification is reduced in
sab−/− and
qua2-4−/− sab−/−. Total cell wall composition was also determined for
sab−/− and
sab−/− /qua2-4−/− mutants by trifluoroacetic acid treatment of AIR and quantitation of the released monosaccharide using High-Performance Anion-Exchange Chromatography with Pulsed Amperometric detection (HPAEC-PAD), and the results are shown in
Figure 4C,D. No differences are detected in cellulose (
t test
p > 0.05,
Figure 4D). In
sab−/− relative to WT, fucose, arabinose, galactose, glucose, and xylose are all increased (
t test,
p < 0.05; orange asterisk). The fucose amount is lower and arabinose, galactose, xylose, and glucose are increased in
qua2-4−/− relative to WT (
t test,
p < 0.05; green asterisk), and relative to
qua2-4−/, sab−/− is only higher in fucose, galactose, arabinose, and glucose (
t test,
p < 0.05; blue asterisk). The dramatic increase in glucose in
qua2-4−/− likely reflects the accumulation of starch as previously observed in leaves [
16]. There were no differences detected between
sab−/− and
sab−/− /qua2-4−/− for any cell wall components. Thus,
sab−/− causes a significant change in multiple cell wall polysaccharides that may have a role in rescuing the
qua2-4−/− phenotype.
To determine if the cell wall changes in the
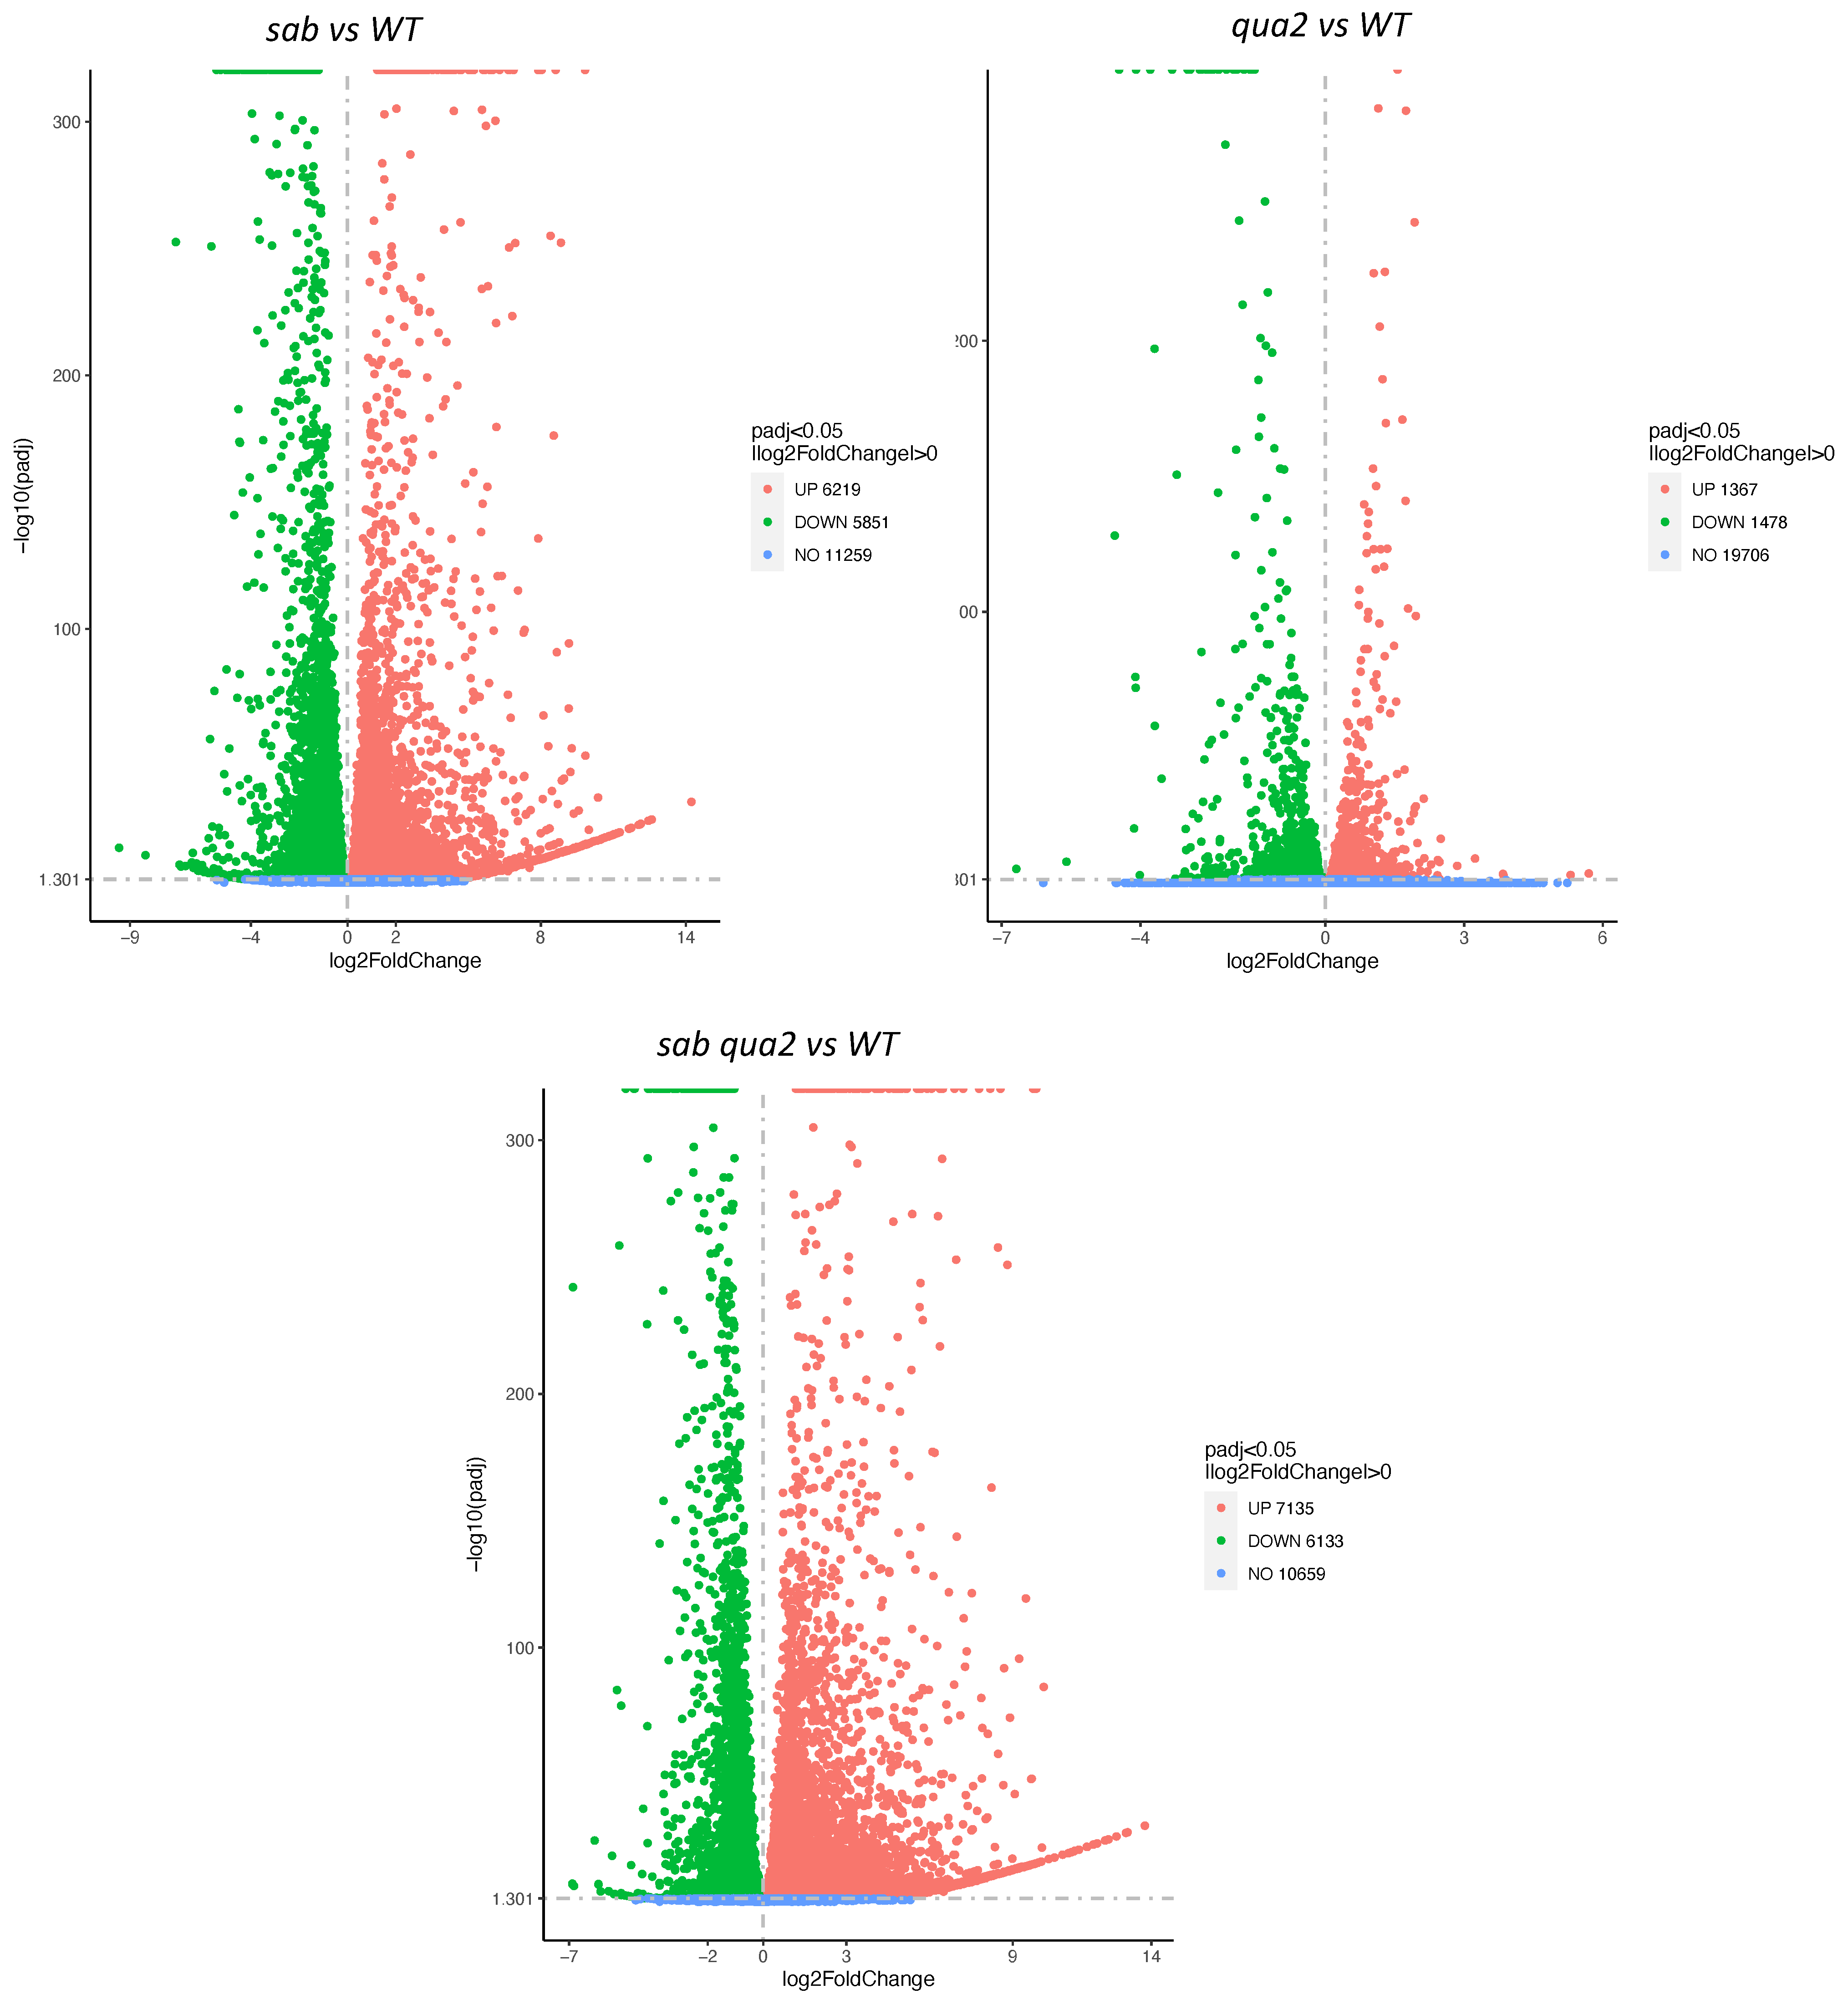
sab mutants might be reflected in gene expression changes, and therefore predict biosynthetic changes, a comparative RNA Seq analysis was performed on mRNA from soil-grown leaves. Significant differences were detected in gene expression between
sab−/− and WT, and as expected
sab−/− and
sab−/−qua2-4−/− expression patterns are more similar to each other (
Figure 5,
Figure S7), and Gene Ontology (GO) analysis indicates that most of these changes are due to ribosome biosynthesis and metabolism. Surprisingly, the regulation of genes encoding pectin biosynthesis and degradation, and proteins involved in monitoring cell wall integrity appear not to be dramatically altered in any of the mutants (
Figures S6 and S7 Cell Wall related sheet). While 5 glycosyl hydrolases are slightly upregulated, these are not known to affect pectin. The Wall Associated Kinases (WAKs) that are likely pectin receptors, appear slightly upregulated, but these are often increased by numerous stresses and it is not yet known what an increased mRNA level indicates [
1]. However, there are two cell wall-related gene families that do show dramatic changes.
sab−/− and
sab−/−qua2-4−/− do have a 5–10 fold (log 2,
p adj < 0.05) increase in expression relative to WT of multiple pectin methylesterases (PME) and their inhibitors (PMEI) that regulate the charge induced crosslinking of pectin (
Figures S6 and S7), presumably in part to compensate for increased pectin levels. However, further analysis of the complex interplay between the expression and interaction between PMEs and PMEIs is needed to understand how these particular changes might directly affect pectin [
11,
12]. In addition, two extensins, EXT3 and EXT4 mRNAs, are highly upregulated suggesting that the crosslinking of pectin to cellulose is increased. This also may well be to compensate for a reduced level of adhesion and is consistent with the increased arabinose content in the cell wall (
Figure 4C). While EXT3 mRNA is slightly up regulated in
qua2 mutants [
21], the
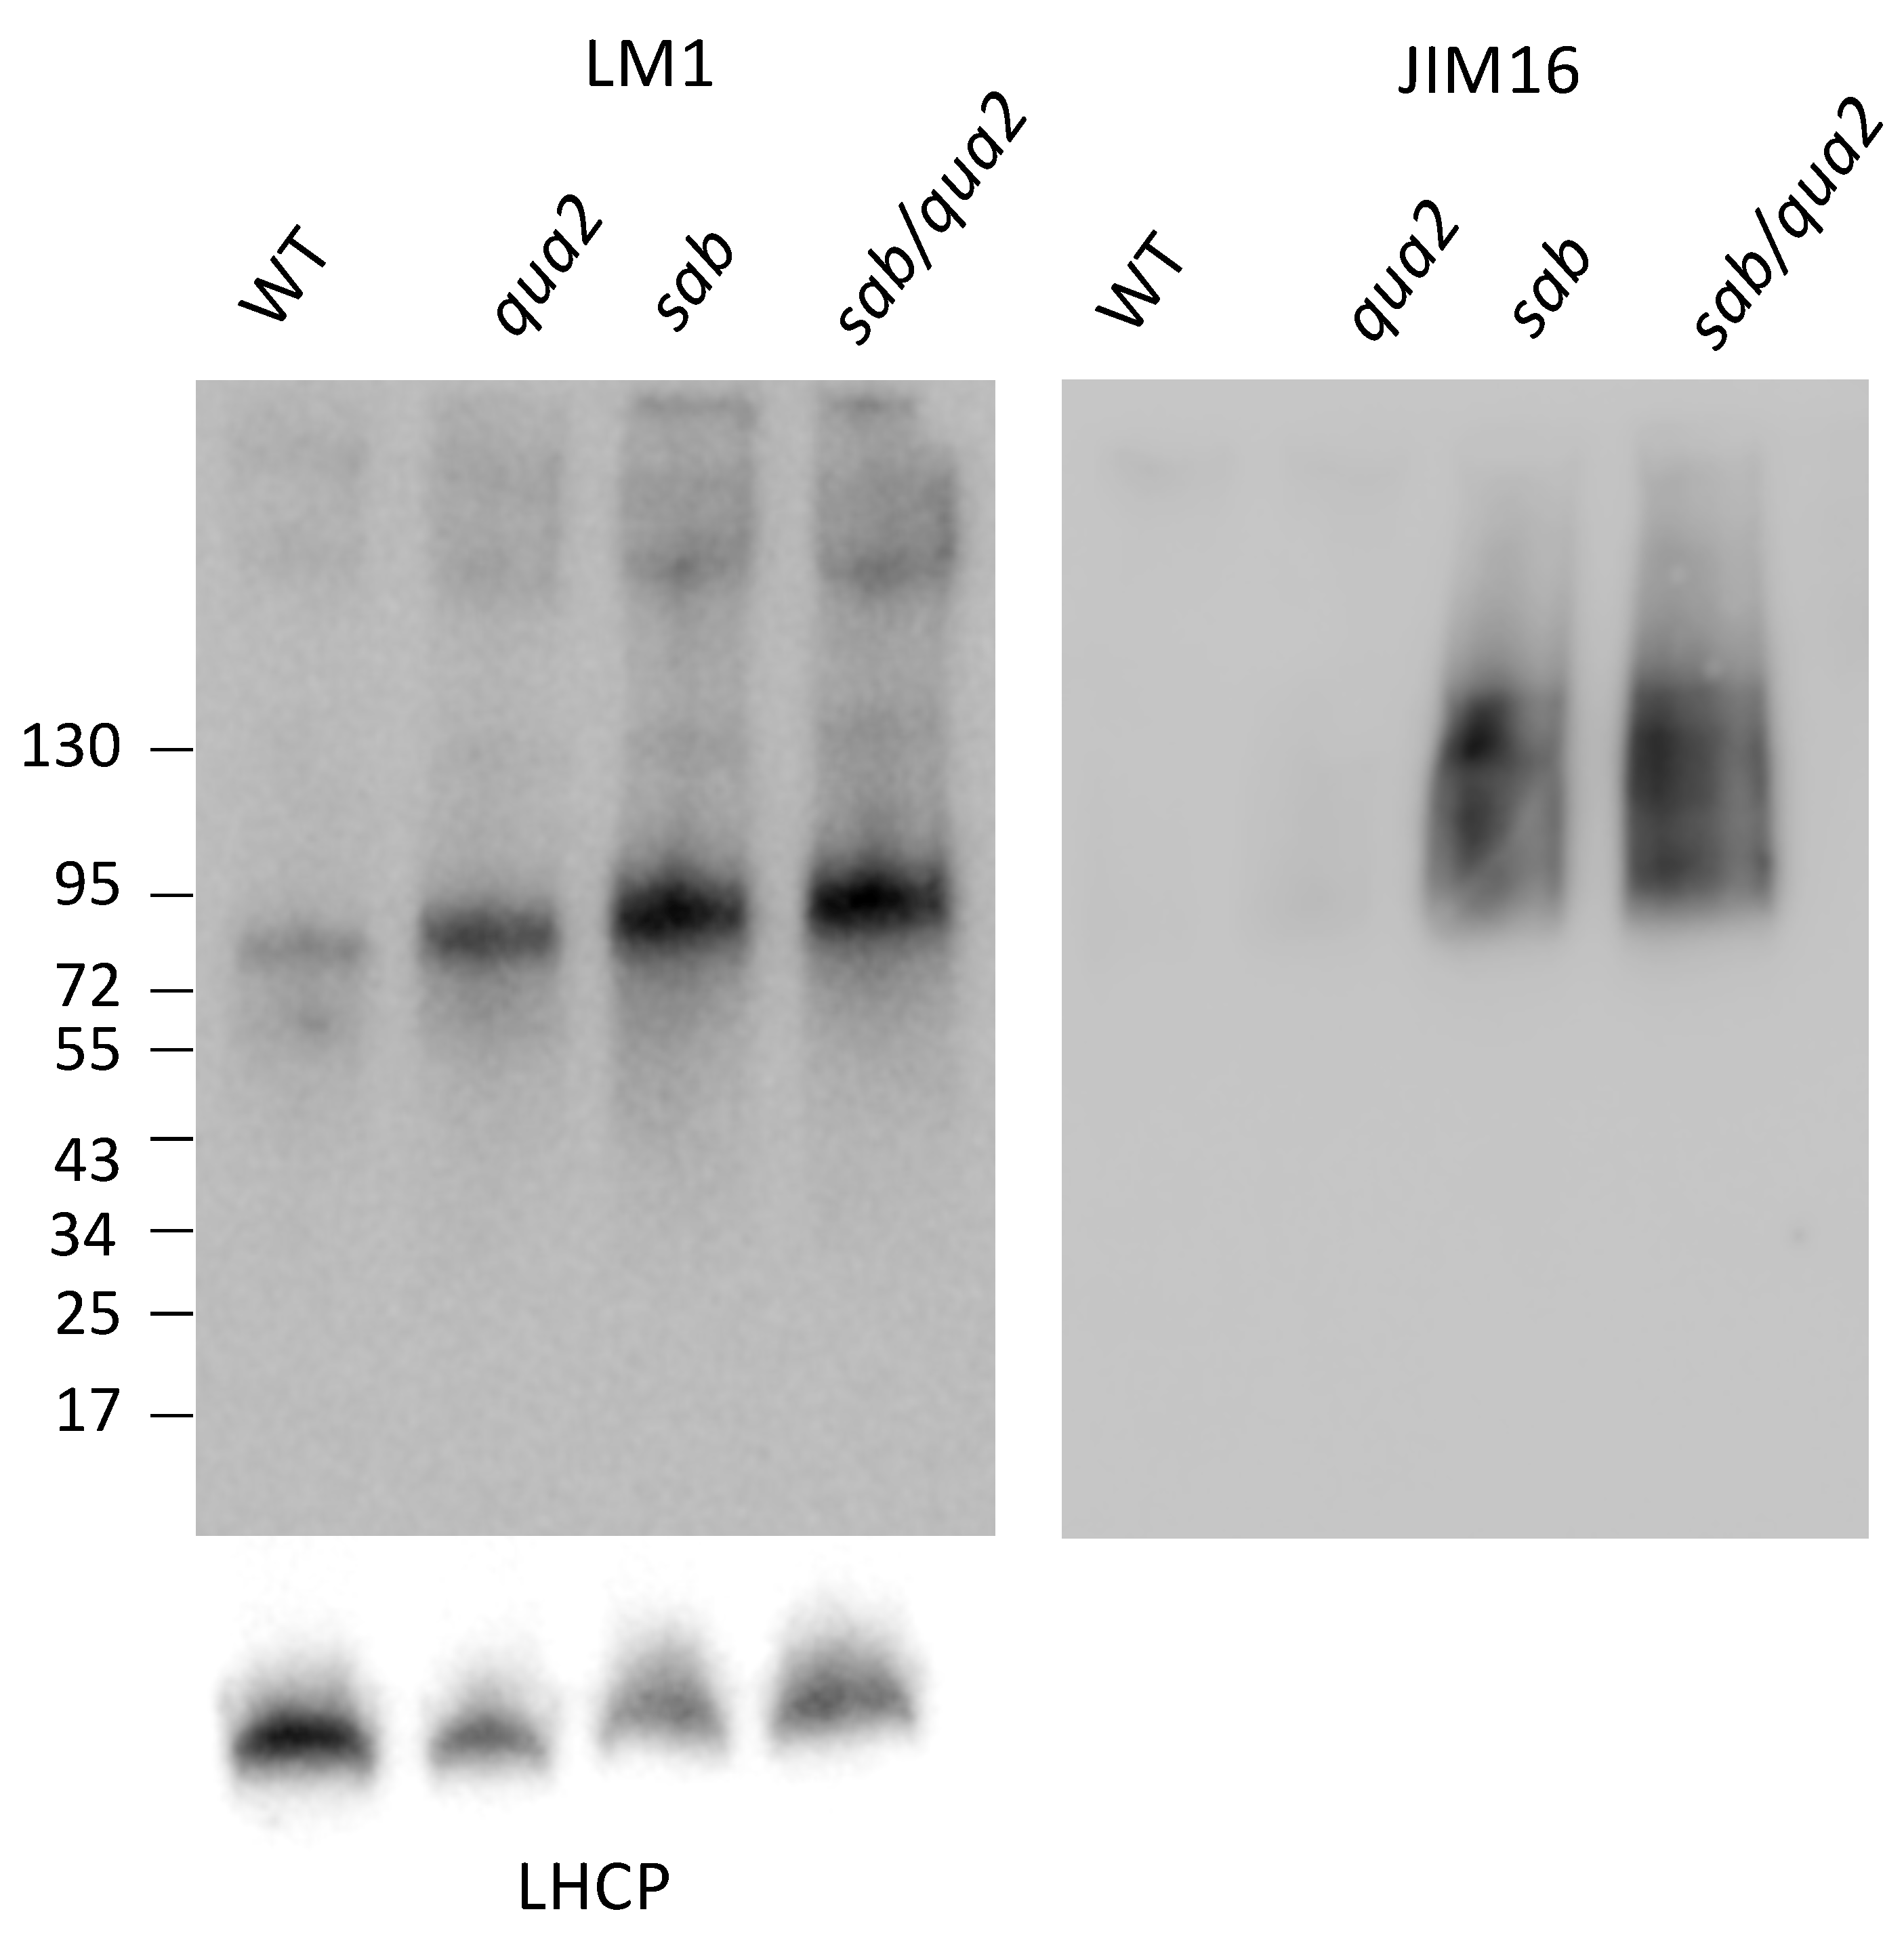
sab1 allele causes a dramatic 8-fold (log2) change. Western blots using LM1 antiserum [
23,
24] indicate that the extensin protein levels are also increased by 5-fold relative to WT (
Figure 6), but not as significantly as the EXT3 and EXT4 mRNAs. The molecular weight of the extensin is slightly increased (
Figure 6) in
sab−/− and
sab−/−qua2-4−/− relative to
qua2−/− and WT suggesting that the carbohydrate chain length or number is increased, and this has been observed in other conditions [
22,
30]. Since extensins can become crosslinked in the wall, the absolute increase in extensin protein levels might not be detected by Western blots and this may explain why the protein levels do not increase as dramatically as do the mRNAs. Moreover, although the EXT mRNA levels are increased in the
sab mutants and predict an increase in EXT protein, since the LM1 epitope includes protein, galactose, and arabinose [
23,
24], the increase in the Western signal may also indicate a change in the carbohydrate moiety. However, a direct link between the LM1 epitope and EXT3 and 4 is not demonstrated by these results, and the specific EXT affected has not been determined. In addition to the large increase of EXT3 and EXT4 mRNA, three members of the arabinogalactan protein (AGP) family, AGP2, AGP5, and AGP17 mRNA are induced 1–5-fold (
Figures S6 and Figure S7, log2,
p adj < 0,05). Western blotting with JIM16 antiserum that detects arabinogalactan proteins (AGPs) [
24] also shows a dramatic increase in this epitope in
sab−/− and
sab−/− qua2-4−/− mutants, relative to
qua2-4−/− and WT (
Figure 6). Since the antiserum is detecting both the arabinogalactan and protein [
24], the increase seen on the Western blot likely reflects both the increase in protein predicted by the mRNA levels, and a change in modification consistent with the changes in arabinose, rhamnose, and fucose detected in the cell wall (
Figure 4D) as these sugars are covalently bound to AGP. However, a direct link between the JIM16 epitope and specifically AGP2, AGP5, and AGP17 has not been demonstrated by these results, and the specific AGP affected has not been determined.
In summary, the screen for new mutants in adhesion identified a new allele of the putative Golgi-localized pectin methyltransferase QUA2, where a change from a glycine to a glutamic acid leads to a mild loss of adhesion. The screen also identified a premature stop codon within the
SAB gene that suppresses the
qua2-4 adhesion phenotype. SAB is a widely expressed, hydrophobic membrane protein that has previously been shown to organize ROP2/4 and the microtubule binding protein CLASP leading to an alignment of microtubules to promote longitudinal cell elongation [
27,
31,
32,
33]. Since oryzalin induced reduction in growth and cortical microtubule organization does not rescue the adhesion defects of
qua2 [
21], the reduced cell size and previously demonstrated microtubule reorganization in
sab [
26,
27] would be by itself unlikely sufficient to explain the suppression of the
qua2 adhesion phenotype. Rather, the higher levels of pectin in
sab1−/− and
sab1−/−qua2-4−/− can explain the restoration of adhesion in
qua2. The observation that
sab mutants have reduced pectin methylesterification increases the potential for calcium-mediated crosslinking, which too might contribute to the rescue of adhesion.
sab1 appears not to alter pectin abundance by altering the transcription of pectin biosynthesis genes, suggesting that the pectin levels may be higher in
sab−/− due to a reduced turnover of pectin. However, no significant increase in expression of genes encoding pectin-degrading enzymes was detected. The exploration of pectin transport may also reveal how SAB might control pectin accumulation. Mutations in kinesin Fragile Fiber 1 (FRA1) [
34], and SPIKE1, which controls lateral microtubule clustering [
35], likely affect the trafficking of pectin-containing Golgi [
36] but these mutants do not show pectin changes or adhesion defects. Thus, SAB may have a specific effect on the accumulation of pectin in the cell wall.
Genes encoding proteins for pectin modification and crosslinking are however highly upregulated in
sab1−/− and
sab1−/−qua2-4−/−, including
EXT 3 and
EXT4, and while it is not known if the proteins encoded by these particular genes are involved in the
sab suppression, the EXT family of proteins are thought to mediate pectin crosslinking to other wall components such as cellulose [
21,
22,
30]. Thus, while pectin levels are higher and esterification rate is lower in
sab1−/− and
sab1−/−qua2-4−/− and this can explain the restoration of adhesion and lack of ruthenium red staining, the elevated levels of extensin and AGPs might also be responsible as this may increase the level of crosslinking of wall components. The work here provides further evidence that both the amount, and the levels of pectin modification and crosslinking agents can have dramatic effects on cell adhesion in Arabidopsis, and are directly influenced by a protein that has been previously shown [
26,
27] to be involved in the organization of the cytoskeleton.
3.1. Plant Growth Conditions
Arabidopsis thaliana seeds were sterilized for 5 min in 95% ethanol and then 5 min in 10% bleach and rinsed twice with sterile dH2O. Seedlings were then grown on agar containing Murashige and Skoog (MS) media (Sigma Aldrich, Saint Louis MO, USA) pH 5, with 2% agarose and 1% sucrose or planted directly onto soil. Following plating, seeds were exposed to cold (4 °C) for 48 h, grown at 20 °C for 10–14 days in 8 h of dark, 16 h of light. Seeds planted directly on soil were exposed to cold (4 °C) for 48 h and grown with a cover on. For in-experiment comparisons, samples were grown at the same time in triplicate. Plants were imaged using a Nikon D3000 camera. Total leaf area of each plant was measured using ImageJ.
3.2. Mutant Identification
To identify
Arabidopsis thaliana mutants with abnormal cellular adhesion, approximately 5000 M1 seeds were mutagenized with ethyl methanesulfonate (EMS) [
37] and grown on soil (M2 generation seeds were then collected in 191 pools (each pool contained the progeny of approximately 20–30 plants). Then, 100 seeds from each pool were then grown on liquid media after sterilization and stained with ruthenium red dye as follows. Liquid media was removed and 3 mL of ruthenium red dye (Sigma Corp. Saint Loui MO, USA, 0.5 mg/mL in dH
2O) was applied to seedlings for 2 min in a 10 mL microtiter growth plate. After 2 min, seedlings were washed twice with 5 mL of dH
2O. Hypocotyl staining was then observed under a dissecting microscope, and mutants were isolated and plated on MS agarose for 5 days before being transferred to soil.
3.3. DNA Extraction and PCR
Three-week-old healthy green leaves from plants of interest were collected, frozen in liquid N
2, and DNA was extracted as described [
38]. The indicated genes were PCR amplified according to the manufacturer’s conditions using Titanium Taq DNA polymerase (Takara Bio, Mountain View CA USA) using primers shown in
Figure S2C, and samples were sequenced by Retrogen Corp.
3.4. 38 S F2 Whole Genome Sequencing
The pooled 38S F2 DNA preparations were sequenced with Illumina genome sequencing technology performed by Novogene. Analysis of the 38S F2 allele frequencies was performed using the data files provided by Novogene, and the programs artMAP (used to identify the allele frequencies) [
29], and IGV (used to visualize the genome sequence) [
39].
3.5. Cell Wall Preparation
Leaves from three biological replicates were immersed in 96% ethanol and incubated at 70 °C for 30 min, homogenized using a ball homogenizer for 20 min, centrifuged for 15 min at 20,000×
g, and the supernatant was removed and the pellet was re-suspended in 100% ethanol and centrifuged for 15 min at 20,000×
g. The supernatant was then removed and the pellet was re-suspended in methanol/chloroform (2v/3v) and shaken overnight. Samples were then centrifuged for 15 min at 20,000×
g and the supernatant was removed. The pellet was then re-suspended sequentially in 100%, 65%, 80%, and 100% ethanol. After each re-suspension, samples were centrifuged at 20,000×
g for 15 min and the supernatant was removed and the pellet or alcohol insoluble residue (AIR) dried under vacuum. The AIR was saponified overnight in 0.05 M NaOH and the samples centrifuged at 4 °C, 10,000×
g 10 min. Methylesterification of the pectin was quantified by measurement of the methanol content in the supernatant [
25]. The pellet was then washed twice with 70% ethanol (to remove residual NaOH) and twice with acetone at room temperature and dried under vacuum. Ammonium oxalate-extracted uronic acid content of the AIR was determined according to [
25,
40]. Neutral monosaccharide composition analysis of the non-crystalline polysaccharide fraction was performed after hydrolysis of a portion of the AIR in 2.5 M trifluoroacetic acid for 1.5 h at 100 °C, and the released monosaccharide quantified using HPAEC-PAD chromatography [
25]. Cellulose content was determined through the hydrolysis of the rinsed residue resistant to TFA hydrolysis (crystalline polysaccharide) as described in [
25].
3.6. Confocal Microscopy
Four-day-old dark grown seedlings were stained for 10 min with 10 υg/mL propidium iodide, and then washed one time in dH20. Hypocotyls were then visualized by confocal microscopy on a Leica SP8 microscope using a 10× objective, a 514 nm excitation laser, and an emission spectra of 620–40 nm. A Z stack was then created for the seedling using the Leica SP8 software.
3.7. RNA Seq
RNA seq and bioinformatics was performed by Novogene Corp. (Sacramento CA USA) on biological triplicate, 3-week-old leaf RNA samples isolated using a Qiagen RNA isolation kit (Germantown MD.) Analysis of specific transcripts was carried out by Novogene using NOVASYSTEM online software which is R based.
3.8. Western Blotting
Leaves were ground with a pestle in 10 mM Tris 7, 3% sodium deodecyl sulfate, 100 mM Dithiothreitol, 10% glycerol, with 2X bromophenol blue loading dye and centrifuged at 10,000× g for 5 min. Prior to loading, samples were heated at 95 °C for 10 min. Samples were then separated using a 10–20% SDS-polyacrylamide gel and transferred to a nitrocellulose membrane for 1500 mA h. Following transfer, the blot was blocked in 5% non-fat dried milk in Tris buffered saline (20 mM Tris pH 7.5, 150 mM NaCl, 0.1% Tween-20) and subsequently incubated with anti-light harvesting protein (LHCP), LM1, or JIM 16 antibody at 1:2500 for 2 h at room temperature, washed in Tris buffered saline 0.3% Tween (TBST) and then subsequently incubated with horseradish peroxidase (HRP) conjugate anti-rabbit or rat secondary antibody (1:2500) for 2 h at room temperature. Blots were detected using SuperSignal Chemiluminescent detection kit (Thermo Fisher, Waltham MA, USA) and visualized using G-box (Syngene, Frederick MD, USA). Image J was used to quantify bands on the Western blots.

