
Does Elevated [CO2] Only Increase Root Growth in the Topsoil? A FACE Study with Lentil in a Semi-Arid Environment

 ,
,  , , and
Abstract
1. Introduction
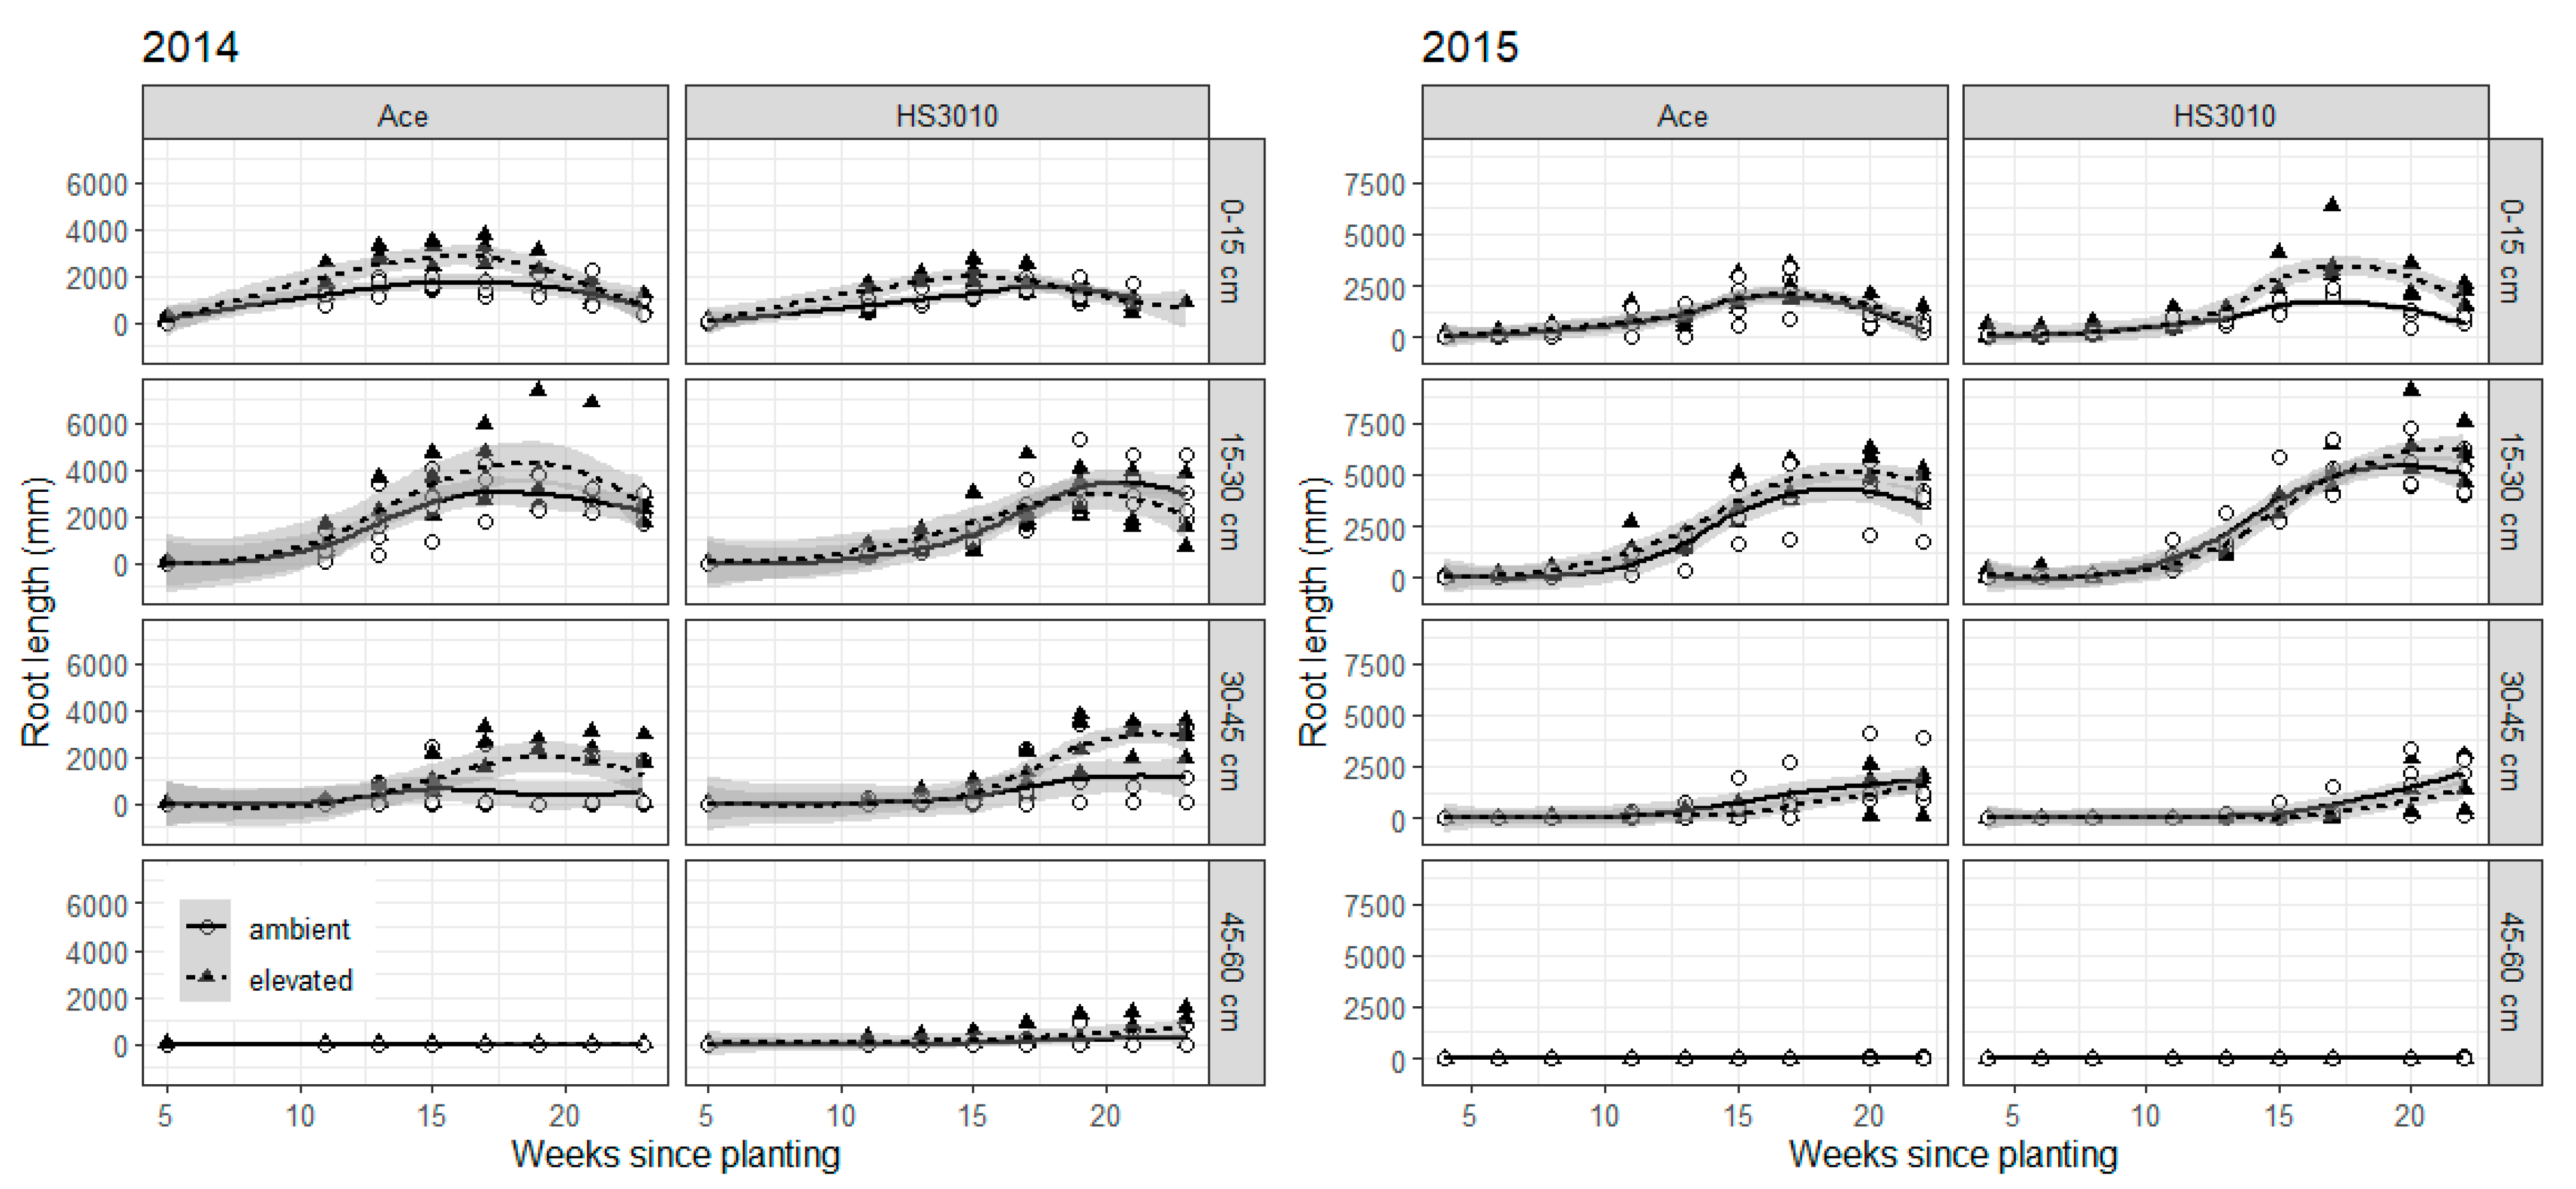
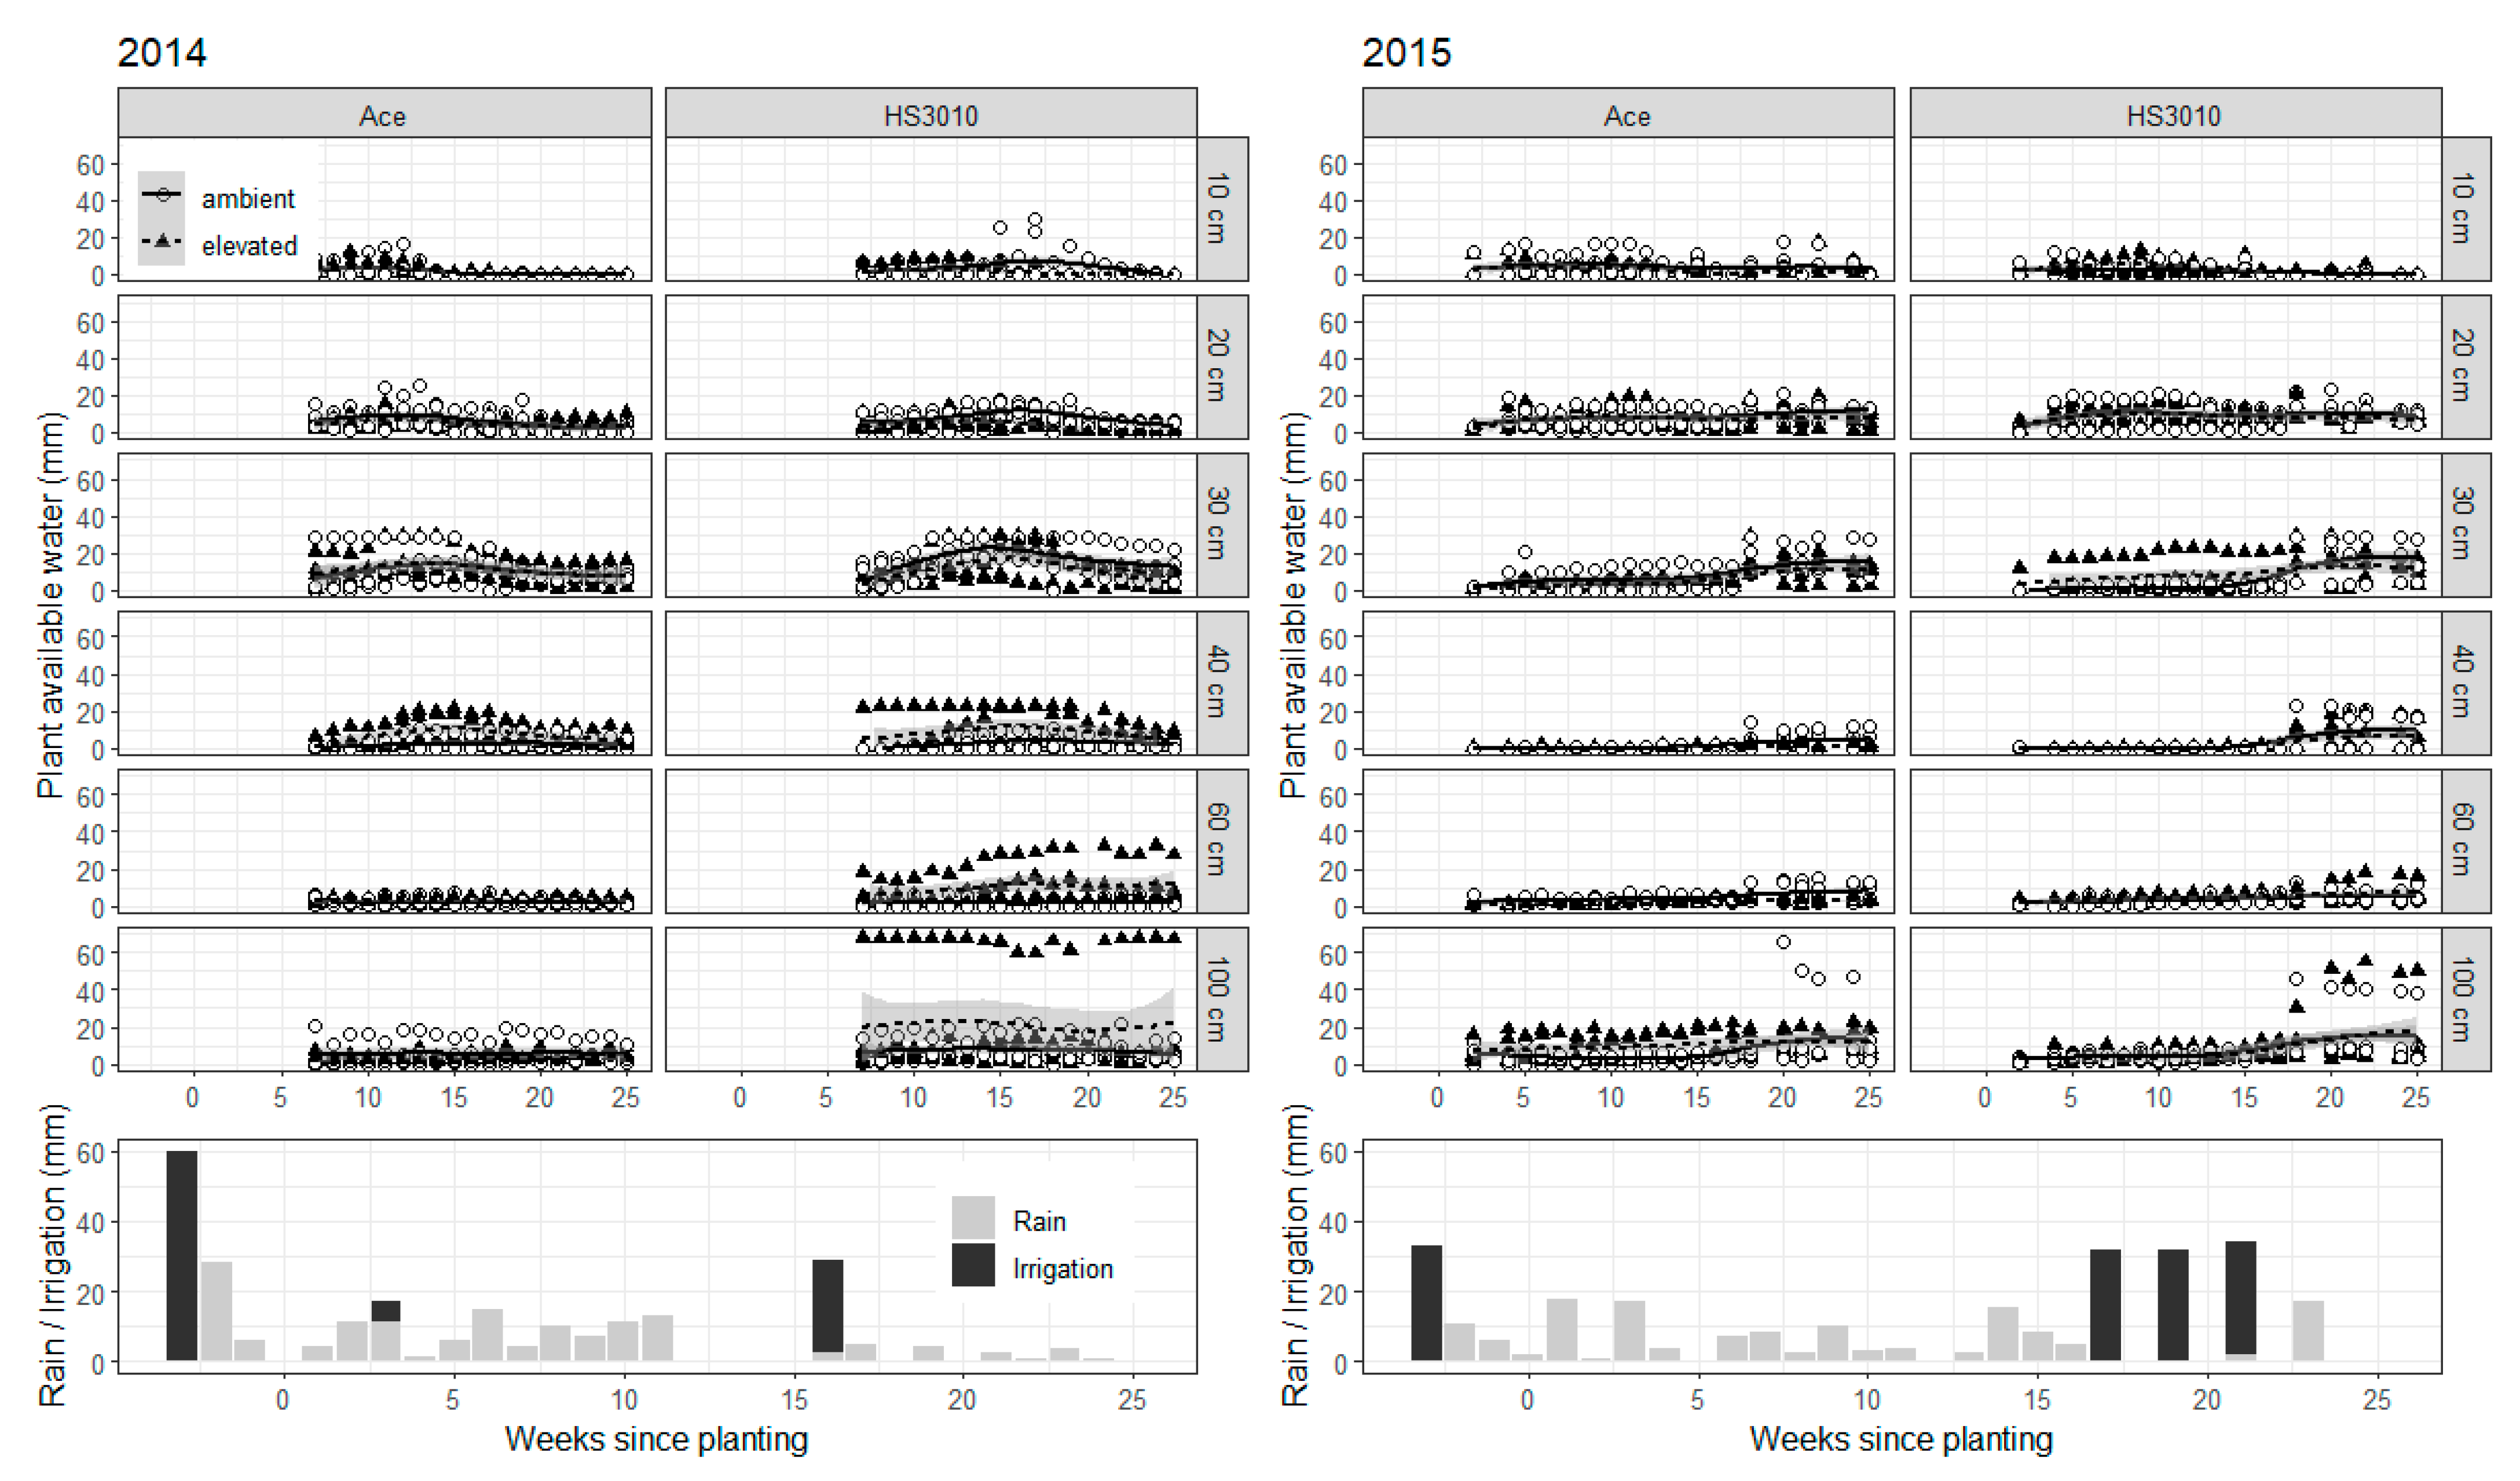
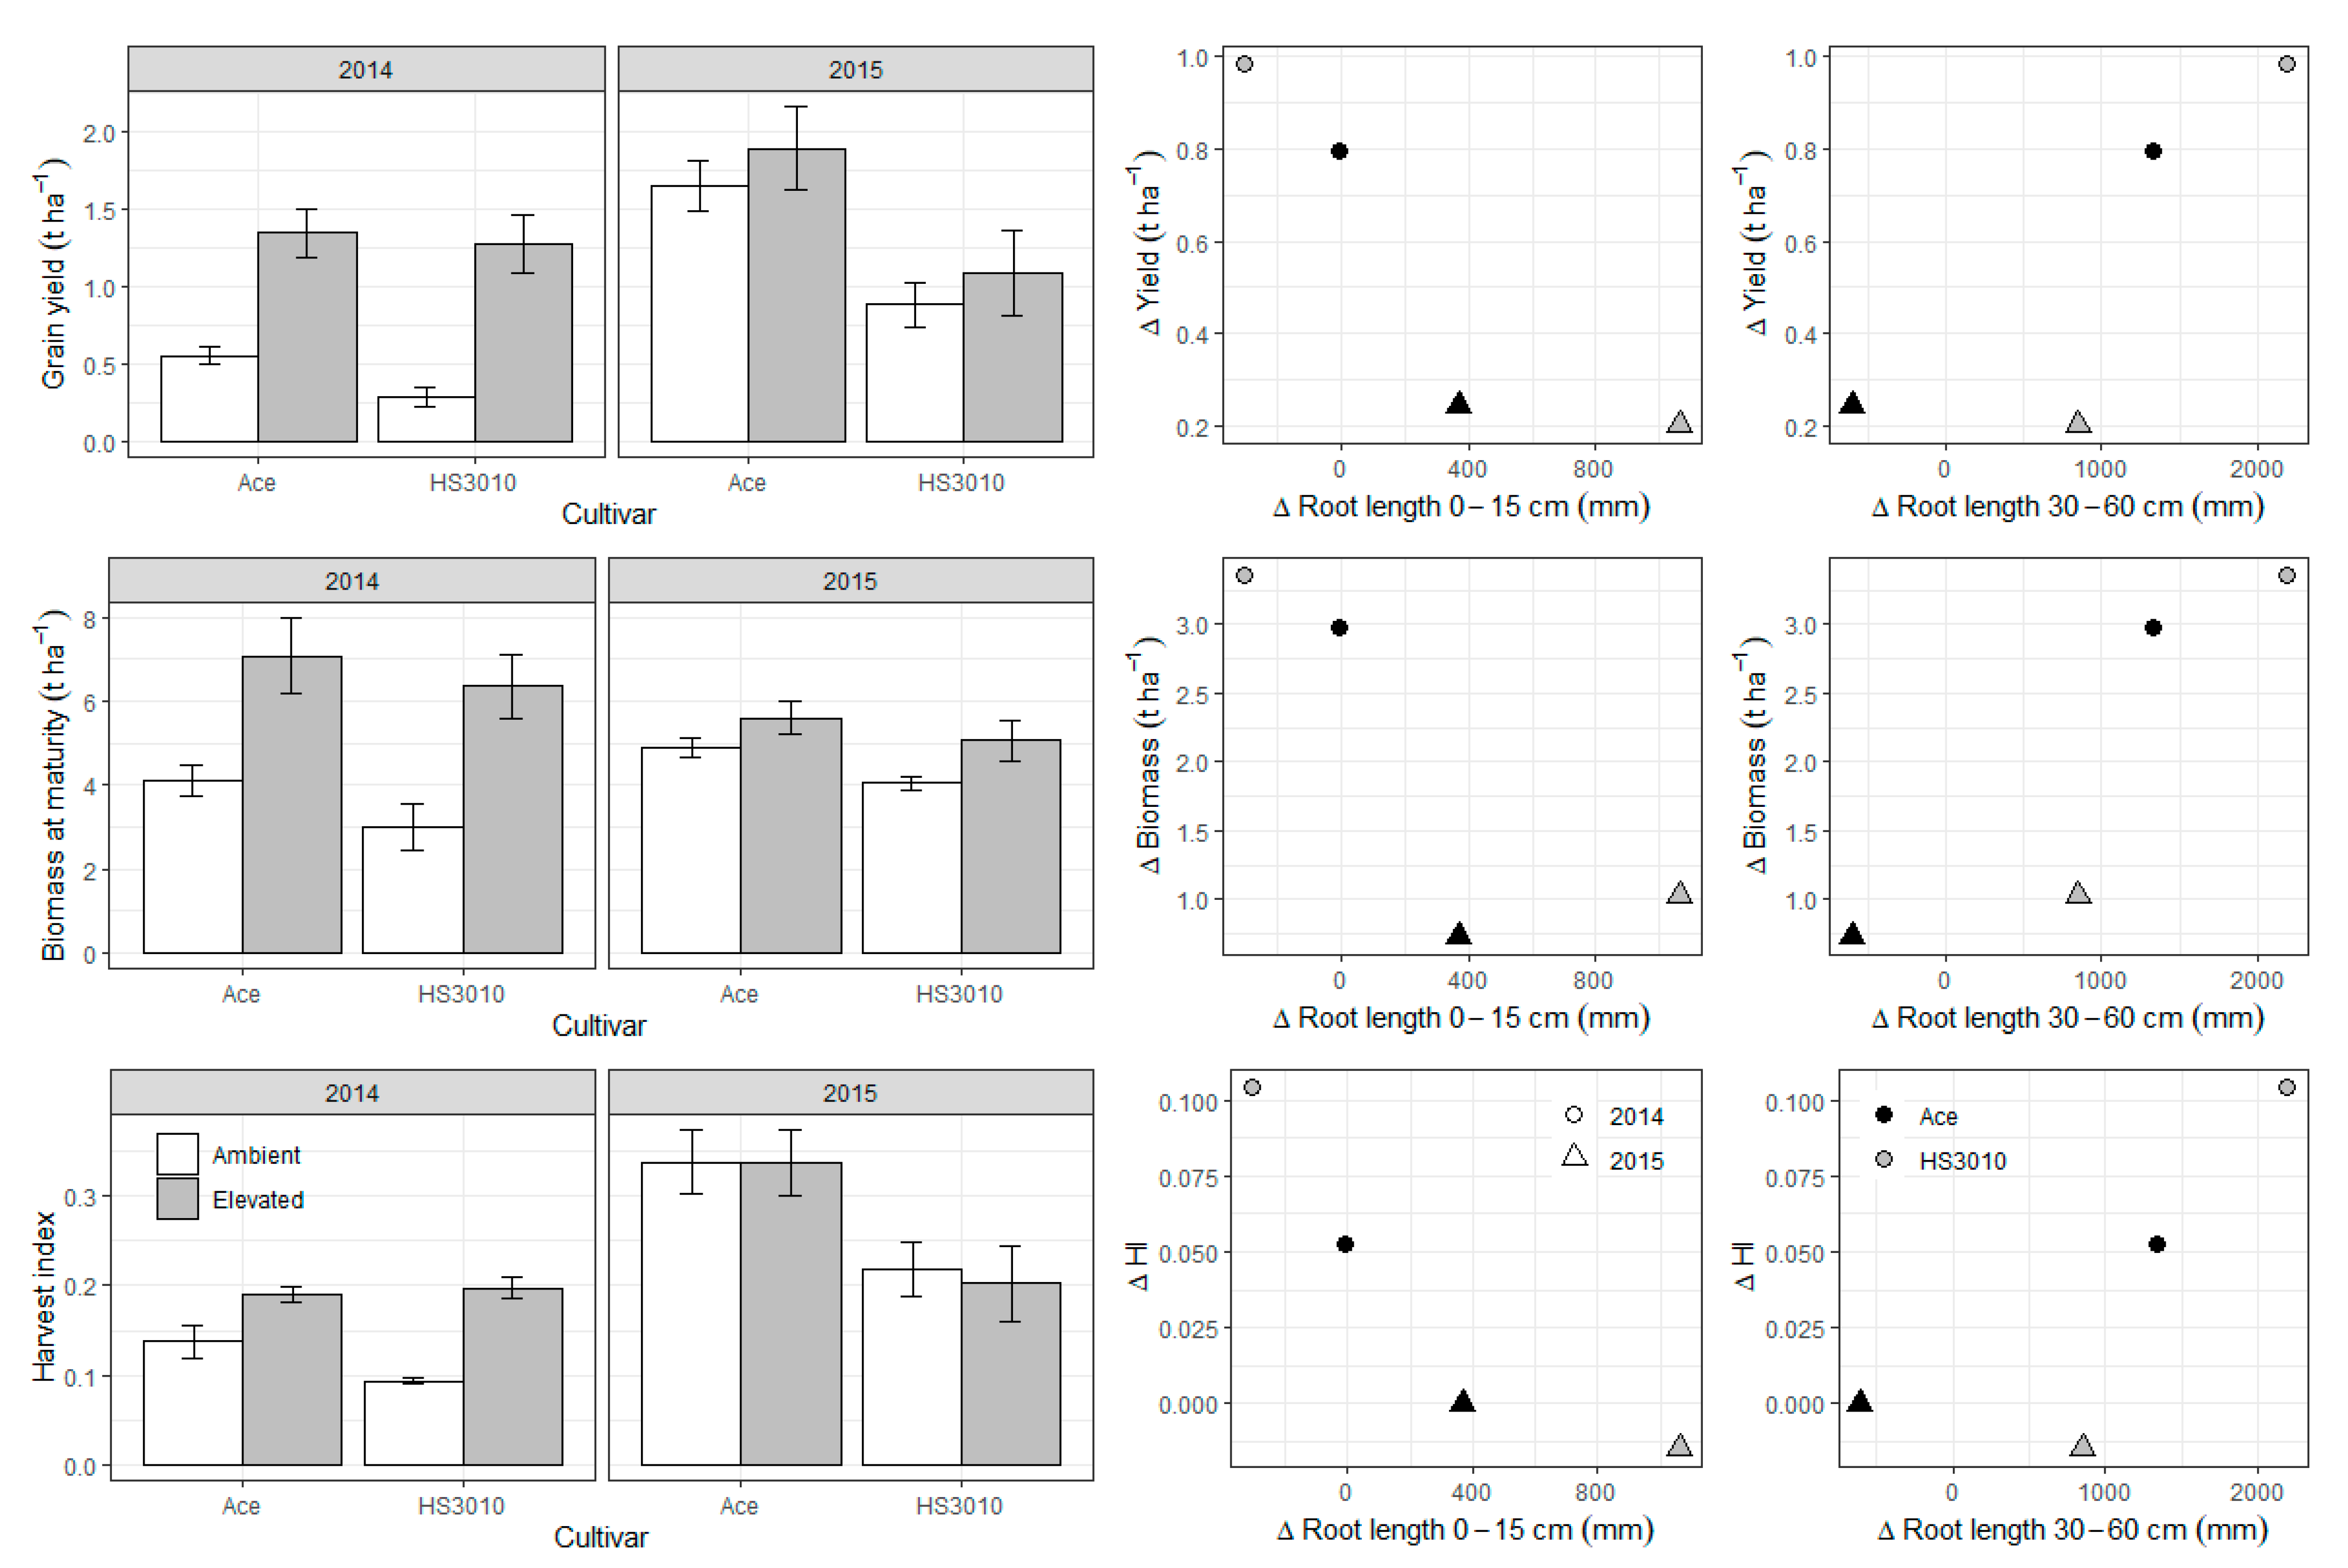
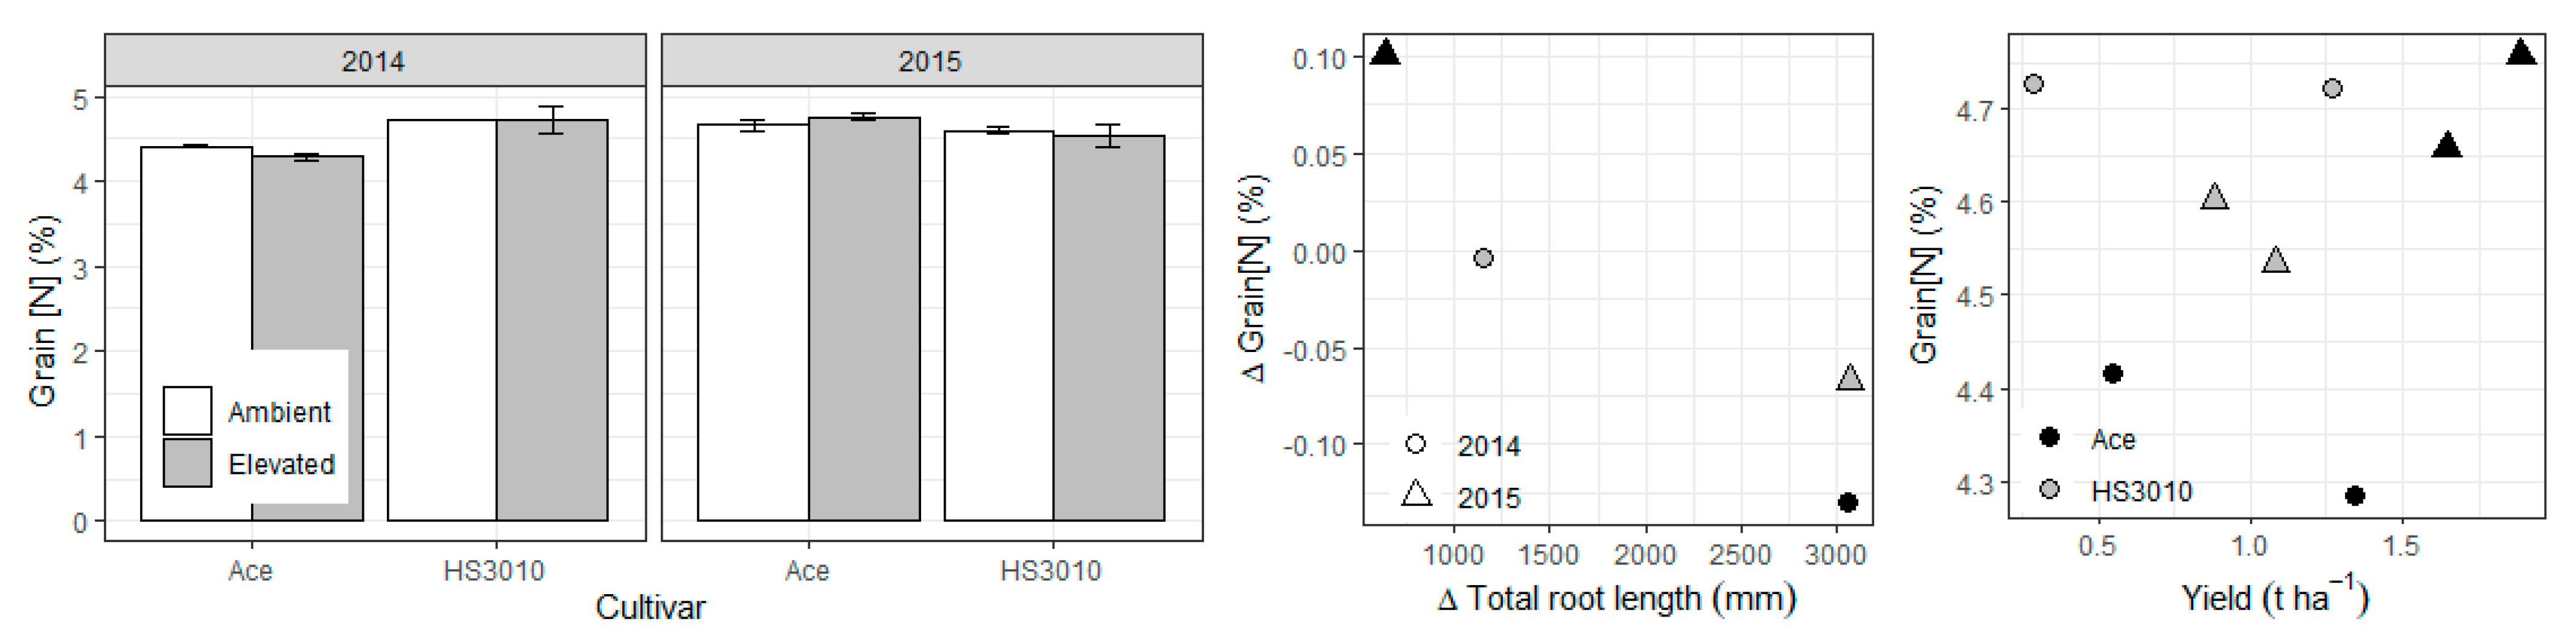
2. Results
3. Discussion
4. Materials and Methods
4.1. Site Location and Climate
4.2. Site Management
4.3. FACE Technology
4.4. Experimental Design
4.5. Plant Material
4.6. Root Growth Observations
4.7. Soil Water Monitoring
4.8. Other Measurements
4.9. Statistics
5. Conclusions
Author Contributions
Funding
Institutional Review Board Statement
Data Availability Statement
Acknowledgments
Conflicts of Interest
References
- Kimball, B.A. Crop responses to elevated CO2 and interactions with H2O, N and temperature. Curr. Opin. Plant Biol. 2016, 31, 36–43. [Google Scholar] [CrossRef] [PubMed]
- Leakey, A.D.B.; Ainsworth, E.A.; Bernacchi, C.J.; Rogers, A.; Long, S.P.; Ort, D.R. Elevated CO2 effects on plant carbon, nitrogen, and water relations: Six important lessons from FACE. J. Exp. Bot. 2009, 60, 2859–2876. [Google Scholar] [CrossRef]
- Madhu, M.; Hatfield, J.L. Dynamics of plant root growth under increased atmospheric carbon dioxide. Agron. J. 2013, 105, 657–669. [Google Scholar] [CrossRef]
- Nie, M.; Lu, M.; Bell, J.; Raut, S.; Pendall, E. Altered root traits due to elevated CO2: A meta-analysis. Glob. Ecol. Biogeogr. 2013, 22, 1095–1105. [Google Scholar] [CrossRef]
- Hall, A.; Sadras, V. Whither Crop Physiology? In Crop Physiology: Applications for Genetic Improvement and Agronomy; Sadras, V.O., Calderini, D.F., Eds.; Academic Press: Burlington, MA, USA, 2009; pp. 545–570. [Google Scholar]
- Passioura, J.B. Roots and Drought Resistance. Agric. Water Manag. 1983, 7, 265–280. [Google Scholar] [CrossRef]
- Palta, J.A.; Chen, X.; Milroy, S.P.; Rebetzke, G.J.; Dreccer, M.F.; Watt, M. Large root systems: Are they useful in adapting wheat to dry environments? Funct. Plant Biol. 2011, 38, 347–354. [Google Scholar] [CrossRef]
- Lynch, J.P. Rightsizing root phenotypes for drought resistance. J. Exp. Bot. 2018, 69, 3279–3292. [Google Scholar] [CrossRef] [PubMed]
- Wechsung, G.; Wechsung, F.; Wall, G.W.; Adamsen, F.J.; Kimball, B.A.; Pinter, P.J., Jr.; Lamorete, R.L.; Garcia, R.L.; Kartschall, T.H. The effects of free-air CO2 enrichment and soil water availability on spatial and seasonal patterns of wheat root growth. Glob. Chang. Biol. 1999, 5, 519–529. [Google Scholar] [CrossRef]
- Qiao, Y.; Zhang, H.; Dong, B.; Shi, C.; Li, Y.; Zhai, H. Effects of elevated CO2 concentration on growth and water use efficiency of winter wheat under two soil water regimes. Agric. Water Manag. 2010, 97, 1742–1748. [Google Scholar] [CrossRef]
- Saha, S.; Chakraborty, D.; Lata; Pal, M.; Nagarajan, S. Impact of elevated CO2 on utilization of soil moisture and associated soil biophysical parameters in pigeon pea (Cajanus cajan L.). Agric. Ecosyst. Environ. 2011, 142, 213–221. [Google Scholar] [CrossRef]
- FAOSTAT, 2020. Crops. Available online: http://www.fao.org/faostat/en/#data/QC (accessed on 23 April 2020).
- Bourgault, M.; Brand, J.; Tausz-Posch, S.; Armstrong, R.D.; O’Leary, G.L.; Fitzgerald, G.J.; Tausz, M. Yield, growth and grain nitrogen response to elevated CO2 in six lentil (Lens culinaris) cultivars grown under Free Air CO2 Enrichment (FACE) in a semi-arid environment. Eur. J. Agron. 2017, 87, 50–58. [Google Scholar] [CrossRef]
- Benlloch-Gonzalez, M.; Berger, J.; Bramley, H.; Rebetzke, G.; Palta, J.A. The plasticity of growth and proliferation of wheat root system under elevated CO2. Plant Soil 2014, 374, 963–976. [Google Scholar] [CrossRef]
- Uddin, S.; Löw, M.; Parvin, S.; Fitzgerald, G.; Tausz-Posch, S.; Armstrong, R.; Tausz, M. Yield of canola (Brassica napus L.) benefits more from elevated CO2 when access to deeper soil is improved. Environ. Exp. Bot. 2018, 155, 518–528. [Google Scholar] [CrossRef]
- Uddin, S.; Löw, M.; Parvin, S.; Fitzgerald, G.; Bahrami, H.; Tausz-Posch, S.; Armstrong, R.; O’Leary, G.; Tausz, M. Water use and growth responses of dryland wheat grown under elevated [CO2] are associated with root length in deeper, but not upper soil layer. Field Crop. Res. 2018, 224, 170–181. [Google Scholar] [CrossRef]
- Manschadi, A.M.; Christopher, J.; Devoil, P.; Hammer, G.L. Dynamics of root architectural traits in adaptation of wheat to water-limited environments. Funct. Plant Biol. 2006, 33, 823–837. [Google Scholar] [CrossRef]
- Kirkegaard, J.A.; Lilley, J.M.; Howe, G.N.; Graham, J.M. Impact of subsoil water use on wheat yield. Aust. J. Agric. Res. 2007, 58, 303–315. [Google Scholar] [CrossRef]
- Bolanos, J.; Edmeades, G.O.; Martinez, L. Eight cycles of selection for drought tolerance in lowland tropical maize. III. Responses in drought adaptive physiological and morphological traits. Field Crop. Res. 1993, 31, 261–286. [Google Scholar] [CrossRef]
- Pask, A.J.D.; Reynolds, M.P. Breeding for yield potential has increased deep soil water extraction capacity in irrigated wheat. Crop Sci. 2013, 53, 2090–2104. [Google Scholar] [CrossRef]
- Chaudhuri, U.N.; Kirkham, M.B.; Kanemasu, E.T. Root growth of winter wheat under elevated carbon dioxide and drought. Crop Sci. 1990, 30, 853–857. [Google Scholar] [CrossRef]
- Myers, S.S.; Zanobetti, A.; Kloog, I.; Huybers, P.; Leakey, A.D.B.; Bloom, A.J.; Carlisle, E.; Dietterich, L.H.; Fitzgerald, G.; Hasewaga, T.; et al. Increasing CO2 threatens human nutrition. Nature 2014, 510, 139–142. [Google Scholar] [CrossRef] [PubMed]
- Parvin, S.; Uddin, S.; Bourgault, M.; Roessner, U.; Tausz-Posch, S.; Armstrong, R.; O’Leary, G.; Tausz, M. Water availability moderates N2 fixation benefit from elevated [CO2]: A 2-year free-air CO2 enrichment study on lentil (Lens culinaris MEDIK.) in a water limited agroecosystem. Plant Cell Environ. 2018, 41, 2418–2434. [Google Scholar] [CrossRef] [PubMed]
- Bourgault, M.; Löw, M.; Tausz-Posch, S.; Nuttall, J.G.; Delahunty, A.J.; Brand, J.; Panozzo, J.F.; McDonald, L.; O’Leary, G.J.; Armstrong, R.D.; et al. Effect of a heat wave on lentil grown under free-air CO2 enrichment (FACE) in a semi-arid environment. Crop Sci. 2018, 58, 803–812. [Google Scholar] [CrossRef]
- Parvin, S.; Uddin, S.; Tausz-Posch, S.; Fitzgerald, G.; Armstrong, R.; Tausz, M. Elevated CO2 improves yield and N2 fixation but not grain N concentration of faba bean (Vicia faba L.) subjected to terminal drought. Environ. Exp. Bot. 2019, 165, 161–173. [Google Scholar] [CrossRef]
- Tausz-Posch, S.; Tausz, M.; Bourgault, M. Elevated [CO2] effects on crops: Advances in understanding acclimation, nitrogen dynamics and interactions with drought and other organisms. Plant Biol. 2020, 22 (Suppl. 1), 38–51. [Google Scholar] [CrossRef]
- Bahrami, H.; De Kok, L.J.; Armstrong, R.; Fitzgerald, G.J.; Bourgault, M.; Henty, S.; Tausz, M.; Tausz-Posch, S. The proportion of nitrate in leaf nitrogen, but not changes in root growth, are associated with decreased grain protein in wheat under elevated [CO2]. J. Plant Physiol. 2017, 216, 44–51. [Google Scholar] [CrossRef]
- Gan, Y.T.; Campbell, C.A.; Janzen, H.H.; Lemke, R.; Liu, L.P.; Basnyat, P.; McDonald, C.L. Root mass for oilseed and pulse crops: Growth and distribution in the soil profile. Can. J. Plant Sci. 2009, 89, 883–893. [Google Scholar] [CrossRef]
- Gorim, L.Y.; Vanderberg, A. Root traits, nodulation and root distribution in soil for five wild lentil species and Lens culinaris (Medik.) grown under well-watered conditions. Front. Plant Sci. 2017, 8, 1632. [Google Scholar] [CrossRef] [PubMed]
- Ohashi, A.Y.P.; Pires, R.C.d.M.; Silva, A.L.B.d.O.; dos Sanots, L.N.S.; Matsura, E.E. Minirhizotron as an in-situ tool for assessing sugarcane root system growth and distribution. Agric. Res. Technol. 2019, 22, 556182. [Google Scholar] [CrossRef]
- Freebairn, D.; Ghahramani, A. Challenges in estimating soil water. In Proceedings of the National Soils Conference, Canberra, ACT, Australia, 18–23 November 2018; Hulugalle, N., Biswas, T., Greene, R., Bacon, P., Eds.; pp. 429–430. Available online: https://www.soilscienceaustralia.org.au/wp-content/uploads/2019/10/Proceedings-Natl.-Soil-Sci-Conf-Canberra-18-23-Nov-2018-FINAL_reduced-size-1.pdf (accessed on 29 January 2021).
- Isbell, R.F. The Ausralian Soil Clasification; CSIRO Publishing: Collingwood, VIC, Australia, 1996. [Google Scholar]
- Bureau of Meteorology (Australian Government). Climate Data Online database (Horsham Polkemmet Rd VIC). 2016. Available online: http://www.bom.gov.au/climate/data/ (accessed on 5 July 2016).
- Hollaway, K. Victorian Winter Crop Summary 2015; Department of Economic Development, Jobs, Transport and Resources: Victoria, Australia, 2015; 80p. [Google Scholar]
- Couchman, J.; Hollaway, K. Victorian Winter Crop Summary 2016; Department of Economic Development, Jobs, Transport and Resources: Victoria, Australia, 2016; 80p. [Google Scholar]
- Mollah, M.; Norton, R.; Huzzey, J. Australian grains free-air carbon dioxide enrichment (AGFACE) facility: Design and performance. Crop Pasture Sci. 2009, 60, 697–707. [Google Scholar] [CrossRef]
- O’Leary, G.J.; Christy, B.; Nuttall, J.; Huth, N.; Cammarano, D.; Stockle, C.; Basso, B.; Shcherbak, I.; Fitzgerald, G.; Luo, Q.; et al. Response of wheat growth, grain yield and water use to elevated CO2 under Free-Air CO2 Enrichment (FACE) experiment and modelling in a semi-arid environment. Glob. Chang. Biol. 2015, 21, 2670–2686. [Google Scholar] [CrossRef]
- Erskine, W.; Ellis, R.H.; Summerfield, R.J.; Roberts, E.H.; Hussain, A. Characterization of responses to temperature and photoperiod for time to flowering in a world lentil collection. Theor. Appl. Genet. 1990, 80, 193–199. [Google Scholar] [CrossRef] [PubMed]
- R Core Team. R: A Language and Environment for Statistical Computing; R Foundation for Statistical Computing: Vienna, Austria, 2020; Available online: https://www.R-project.org/ (accessed on 27 April 2020).
- Pinheiro, J.; Bates, D.; DebRoy, S.; Sarkar, D.; R Core Team. Nlme: Linear and Nonlinear Mixed Effects Models. R package version 3.1-144, 2020. Available online: https://CRAN.Rproject.org/package=nlme (accessed on 27 April 2020).
- Wickham, H. ggplot2: Elegant Graphics for Data Analysis; Springer: New York, NY, USA, 2009; 213p. [Google Scholar]


| Year | Cultivar | Pre-Flowering (mm) | Post-Flowering (mm) | Total (mm) |
|---|---|---|---|---|
| 2014 | PBA Ace | 126 a 1 | 27 b | 153 a |
| *HS3010 | 97 b | 49 a | 146 a | |
| 2015 | PBA Ace | 100 A | 99 A | 198 A |
| *HS3010 | 97 A | 87 A | 184 A |
Publisher’s Note: MDPI stays neutral with regard to jurisdictional claims in published maps and institutional affiliations. |
© 2021 by the authors. Licensee MDPI, Basel, Switzerland. This article is an open access article distributed under the terms and conditions of the Creative Commons Attribution (CC BY) license (http://creativecommons.org/licenses/by/4.0/).
Share and Cite
Bourgault, M.; Tausz-Posch, S.; Greenwood, M.; Löw, M.; Henty, S.; Armstrong, R.D.; O’Leary, G.L.; Fitzgerald, G.J.; Tausz, M. Does Elevated [CO2] Only Increase Root Growth in the Topsoil? A FACE Study with Lentil in a Semi-Arid Environment. Plants 2021, 10, 612. https://doi.org/10.3390/plants10040612
Bourgault M, Tausz-Posch S, Greenwood M, Löw M, Henty S, Armstrong RD, O’Leary GL, Fitzgerald GJ, Tausz M. Does Elevated [CO2] Only Increase Root Growth in the Topsoil? A FACE Study with Lentil in a Semi-Arid Environment. Plants. 2021; 10(4):612. https://doi.org/10.3390/plants10040612
Chicago/Turabian StyleBourgault, Maryse, Sabine Tausz-Posch, Mark Greenwood, Markus Löw, Samuel Henty, Roger D. Armstrong, Garry L. O’Leary, Glenn J. Fitzgerald, and Michael Tausz. 2021. "Does Elevated [CO2] Only Increase Root Growth in the Topsoil? A FACE Study with Lentil in a Semi-Arid Environment" Plants 10, no. 4: 612. https://doi.org/10.3390/plants10040612
APA StyleBourgault, M., Tausz-Posch, S., Greenwood, M., Löw, M., Henty, S., Armstrong, R. D., O’Leary, G. L., Fitzgerald, G. J., & Tausz, M. (2021). Does Elevated [CO2] Only Increase Root Growth in the Topsoil? A FACE Study with Lentil in a Semi-Arid Environment. Plants, 10(4), 612. https://doi.org/10.3390/plants10040612