Communication

Expression of Structural Flavonoid Biosynthesis Genes in Dark-Blue and White Myrtle Berries (Myrtus communis L.)

by
Silvia Medda
1,
Maria Teresa Sanchez-Ballesta
2,
Irene Romero
2,
Leonarda Dessena
1 and
Maurizio Mulas
1,3,*
1
Department of Agricultural Science, University of Sassari, Via De Nicola 9, 07100 Sassari, Italy
2
Instituto de Ciencia y Tecnologia de Alimentos y Nutrición (ICTAN-CSIC), Jose Antonio Novais, 10, 28040 Madrid, Spain
3
Centre for Conservation and Evaluation of Plant Biodiversity, University of Sassari, Via De Nicola 9, 07100 Sassari, Italy
*
Author to whom correspondence should be addressed.
Plants 2021, 10(2), 316; https://doi.org/10.3390/plants10020316
Submission received: 23 October 2020 / Revised: 2 February 2021 / Accepted: 4 February 2021 / Published: 6 February 2021
(This article belongs to the Section Plant Genetics, Genomics and Biotechnology)

Abstract

:
Within the myrtle (Myrtus communis L.) species, different genotypes may produce dark-blue berries or white berries depending on the peel color upon ripening. One dark-blue cultivar and one white myrtle cultivar were used to study the molecular mechanisms underlying flavonoid biosynthesis. The relative expression levels of common (PAL, CHS, CHI, DFR and LDOX) and specific (FLS, ANR, LAR and UFGT) flavonoid genes were analyzed during fruit development by means of quantitative real-time polymerase chain reaction (RT-qPCR). Moreover, the anthocyanin content was determined, and it showed an increase with the ripening of the berries of the dark-blue cultivar. The results showed an increased transcript abundance of PAL, CHI, DFR, LDOX and UFGT gene expression in the dark-blue cultivar compared to the white one, as well as a strong positive correlation between the changes in gene expression and anthocyanin accumulation. The transcript levels of UFGT showed sharp increases at 150 and 180 days after full blooming (DAF) in the dark-blue cultivar, which corresponded with anthocyanin accumulation. However, ripening seemed to modulate the expression of genes implicated in flavonols (i.e., FLS) and flavan-3-ols (i.e., LAR and ANR) in different manners. However, whereas FLS transcript accumulation increased at the end of the ripening period in the dark-blue cultivar, LAR and ANR gene expression decreased in both cultivars.

1. Introduction

Phenolic compounds are secondary metabolites. They include several molecules characterized by an aromatic ring bound to one or more hydroxyl groups. Some examples of these compounds are phenolic acids, flavonoids, condensed tannins, and lignin. They are involved in plant defense against biotic and abiotic stresses [1]. Anthocyanins are members of this group and are water-soluble pigments belonging to a class of flavonoids that widely contribute to the blue, red, and purple coloring of several fruits, vegetables, and flowers. Their content and composition of plants may be influenced by several ecological factors, such as altitude, temperature, light exposure, and growing management [2,3,4,5,6]. The postharvest treatment and storage conditions of plant-derived food can affect the quantity and quality of these compounds [7,8]. Depending on the intensity, controlled abiotic stresses in plants can induce transcription factors that are involved in secondary metabolite biosynthesis and can affect the enzyme activity of the genes involved in that pathway [9]. Several studies have focused on two important functions of these pigments. Firstly, their use as natural colorants in the food industry to replace synthetic ones was the object of some research [10,11]. On the other hand, the implications of anthocyanins for human health have promoted numerous studies about the antioxidant, anticancer, anti-inflammatory, and antimutagenic activities of the different compounds, as well as their positive effects against cardiovascular disease and diabetes [12,13,14,15].
Fruit are potentially suitable as natural anthocyanin sources; of these, myrtle (Myrtus communis L.) is a spontaneous aromatic shrub that is widely spread in the Mediterranean region and belongs to the Myrtaceae family. It has been used and appreciated in folk medicine. The economic and scientific interest in this plant has also grown due to its high content of polyphenolic compounds. Several scientific studies have focused on its antioxidant properties and their correlation with the anthocyanin content in the fruit, leaves, and extracts of myrtle [16,17,18,19]. The organoleptic properties [20] and the shelf life [21] of the sweet myrtle liquor that is produced in Sardinia (Italy) are influenced by the amount of anthocyanins in the hydroalcoholic extract. Because of the high industrial demand for biomass and with the aims of protecting the natural population and providing raw material, a domestication and cultivation program for this species has been promoted [22]. The species has high phenotypic variability and may be classified according to the color of the ripe berries, such as dark red, dark blue (M. communis var. melanocarpa DC), or white (M. communis var. leucocarpa DC) [22]. Previous comparative studies between dark and white myrtle genotypes showed a higher total phenolic content and a higher anthocyanin content in extracts of pigmented berries compared to white berries [23,24]. However, most studies concerning myrtle have been carried out on dark berry genotypes, such as those mentioned above.
The precursors of most flavonoids are malonyl–Coenzyme–A (CoA)—derived from carbohydrate metabolism—and phenylalanine—derived from phenylpropanoid metabolism. Phenylalanine ammonia–lyase (PAL) catalyzes the transformation of phenylalanine into trans-cinnamic acid. The first enzyme involved in flavonoid biosynthesis is CHS (chalcone synthase), which catalyzes the condensation of three molecules of malonyl–CoA with a molecule of p coumaroyl–CoA to form naringenin chalcone. This product is rapidly isomerized by chalcone isomerase (CHI) into the flavanone naringenin. Through hydroxylation of naringenin by flavanone 3-hydroxylase (F3H), dihydrokaempferol is formed. Dihydrokaempferol can be subsequently hydroxylated at the 3′ position, by flavonoid 3′-hydroxylase (F3′H), forming dihydroquercetin. However, if hydroxylation occurs at the 3′ and 5′ positions of naringenin through the flavonoid 3′,5′-hydroxylase enzyme (F3′5′H), dihydromyricetin is formed. Dihydroquercetin is involved in the production of cyanidin-based anthocyanin, while dihydromyricetin is the precursor of delphinidin-based anthocyanin. Then, the dihydroflavonol-4-reductase enzyme (DFR) drives the reduction of dihydroflavanol into leucoanthocyanidins (flavan-3,4-diol), the precursors of anthocyanins. Alternatively, dihydroflavanols can be transformed into kaempferol, quercetin, and myricetin flavanols by the flavanol synthase enzyme (FLS). Leucoanthocyanidins are converted into anthocyanidins by leucoanthocyanidin dioxygenase (LDOX); subsequently, leucoanthocyanidins are stabilized and accumulate in the cellular vacuoles. This last step is catalyzed by enzyme UDP-glucose: the flavonoid 3-O-glucosyltransferase (UFGT) transfers the glucose moiety from UDP-glucose to the free hydroxyl group at the 3′ position of the heterocyclic ring of anthocyanidin. In contrast to anthocyanidin production, proanthocyanidins—which are also called condensed tannins and are oligomers or polymers of flavan-3-ol units—can be produced. Two enzymes—leucoanthocyanidin reductase (LAR) and anthocyanidin reductase (ANR)—can produce the flavan-3-ol monomers required for the formation of proanthocyanidin polymers [25,26].
Although there have been several studies [16,17,18,19] on the phenolic profile of myrtle leaves and berries, as well as their biological properties—e.g., their antioxidant activity—to the best of our knowledge, there is no information available about the biosynthesis at the gene expression level. Currently, only studies of the phenylalanine ammonia lyase (PAL) enzymatic activity during the development of berries and leaves in dark-blue and white myrtle cultivars have been carried out [27].
Previous studies of other species [28,29,30] have shown that the expression of most of the anthocyanin pathway genes is higher in dark fruits compared to white ones. In spite of the variable expression of genes involved in the flavonoid pathway in different species and tissues, a certain correlation with anthocyanin accumulation has been found [30]. For example, sweet red cherries show an up-regulated gene expression during ripening that is higher than that of yellow cultivars [30]. PAL, CHS, CHI, DFR and LDOX gene expression was up-regulated in the red “Yunhong-1” pear variety compared to the white “Zaobaimi” variety [31]. Likewise, Lin et al. [32] suggested that the pink–white mutant of Chinese bayberry was due to a reduction in the expression of key biosynthesis genes in the later stages of development. Moreover, their expression could be influenced by abiotic factors, such as temperature [33], light, [34] and hormones [35].
In this work, two myrtle cultivars—“Giovanna” with dark-blue fruit and “Grazia” with white fruit fruit—were identified according to the domestication process and the varietal selection of myrtle plants and were analyzed [22]. In a previous work [36], the metabolic profile of the “Giovanna” cultivar (namely in the work RUM 13) was analyzed. The study showed that the most abundant anthocyanins in ripe berries are delphinidin 3-O-glucoside, cyanidin 3-O-glucoside, petunidin 3-O-glucoside, and malvidin 3-O-glucoside (486.6, 144.6, 356.9, and 937.2 mg/100 g dry weight (DW), respectively). The detected flavanols with the highest amounts were myricetin 3-galacatoside (183.1 mg/100 g dry weight) and myricetin 3-rhamnoside (135.57 mg/100 g dry weight). Regarding the quantitative composition of the phenolic compounds found in a previous study, at ripening, the “Giovanna” cultivar showed a lower content of total phenolic compounds than the “Grazia” cultivar (37 and 46 mg gallic acid equivalent (GAE)/g DW for “Giovanna” and “Grazia”), as well as a lower content of total tannins (0.33 mg catechin equivalent (CE)/g DW for “Giovanna” and 2.73 mg CE/g DW for “Grazia”) [27]. From the perspective of genetic diversity, both cultivars have been evaluated using ISSR (Inter simple sequence repeat) and AFLP (Amplified fragment length polymorphism) molecular marker analyses. The results revealed a clear separation between the cultivars according to the berry pigmentation [37,38]. Indeed, all analyzed unpigmented cultivars showed common genome regions that were not found in pigmented cultivars.
The aim of this work was to provide preliminary information about the molecular mechanisms that lead to myrtle berry pigmentation by studying the expression of common and specific genes of flavonoid biosynthesis during the physiological ripening of the fruit at different stages of development as well as and how these changes correlate with total anthocyanin and phenolic content.

2. Results

2.1. Isolation and Characterization of Common and Specific Flavonoid Biosynthetic Genes

Nine partial cDNA clones, PAL (GenBank accession no. MT745992), CHS (GenBank accession no. MT745993), CHI (GenBank accession no. MT745994), DFR (GenBank accession no. MT745995), LDOX (GenBank accession no. MT745996), FLS (GenBank accession no. MT745997), LAR (GenBank accession no. MT745998), ANR (GenBank accession no. MT745999) and UFGT (GenBank accession no. MT746000) were isolated from Myrtus communis L. For this experiment, peel samples were used; the peel is the fruit tissue with the highest anthocyanin accumulation. The different fragments were isolated via real-time polymerase chain reaction (RT-PCR) using primers corresponding to the sequences from Eucalyptus. The Eucalyptus genome was chosen because all gene sequences from Myrtus communis were available in the databases, and both species belong to the same family—Myrtaceae. The sequence analysis indicated that the different partial clones showed more than 90% identity compared with the corresponding genes from Eucalyptus grandis. Moreover, the partial fragments presented an identity higher than 70% compared with the corresponding genes from Vitis vinifera (Table 1). Likewise, an identity higher than 60% was found when the different partial PCR fragments and genes from Malus × domestica were compared, as well as Arabidopsis thaliana, with the exception of FLS from M. domestica, which showed an identity of 55%. No LAR genes were found in Arabidopsis, [39] so only comparisons with the LAR genes of E. grandis, V. vinifera, and M. domestica are shown.
We would like to highlight that a detailed BLAST search showed that the PAL fragment from myrtle presented 95% identity when compared with five of the nine PAL genes from Eucalyptus. These five PAL genes (XM_010069015, XM_010069014, XM_010069016, XM_010069013 and XM_010069017) were located in chromosome 5 and presented a 95% identity. Likewise, in the case of UFGT, the BLAST search also showed a 91.04% identity compared with the two UFGTs (XM_010064907 and XM_010064884) identified in Eucalyptus. The alignments of the partial nucleotide sequences obtained from the purified PCR fragments and, likewise, the translated amplicon-amino acid sequences from M. communis with the corresponding nucleotide and full-length amino acid sequences from E. grandis, V. vinifera, A. thaliana, and M. domestica (Table 1), are presented in the Supplementary Materials (Figures S1–S18).

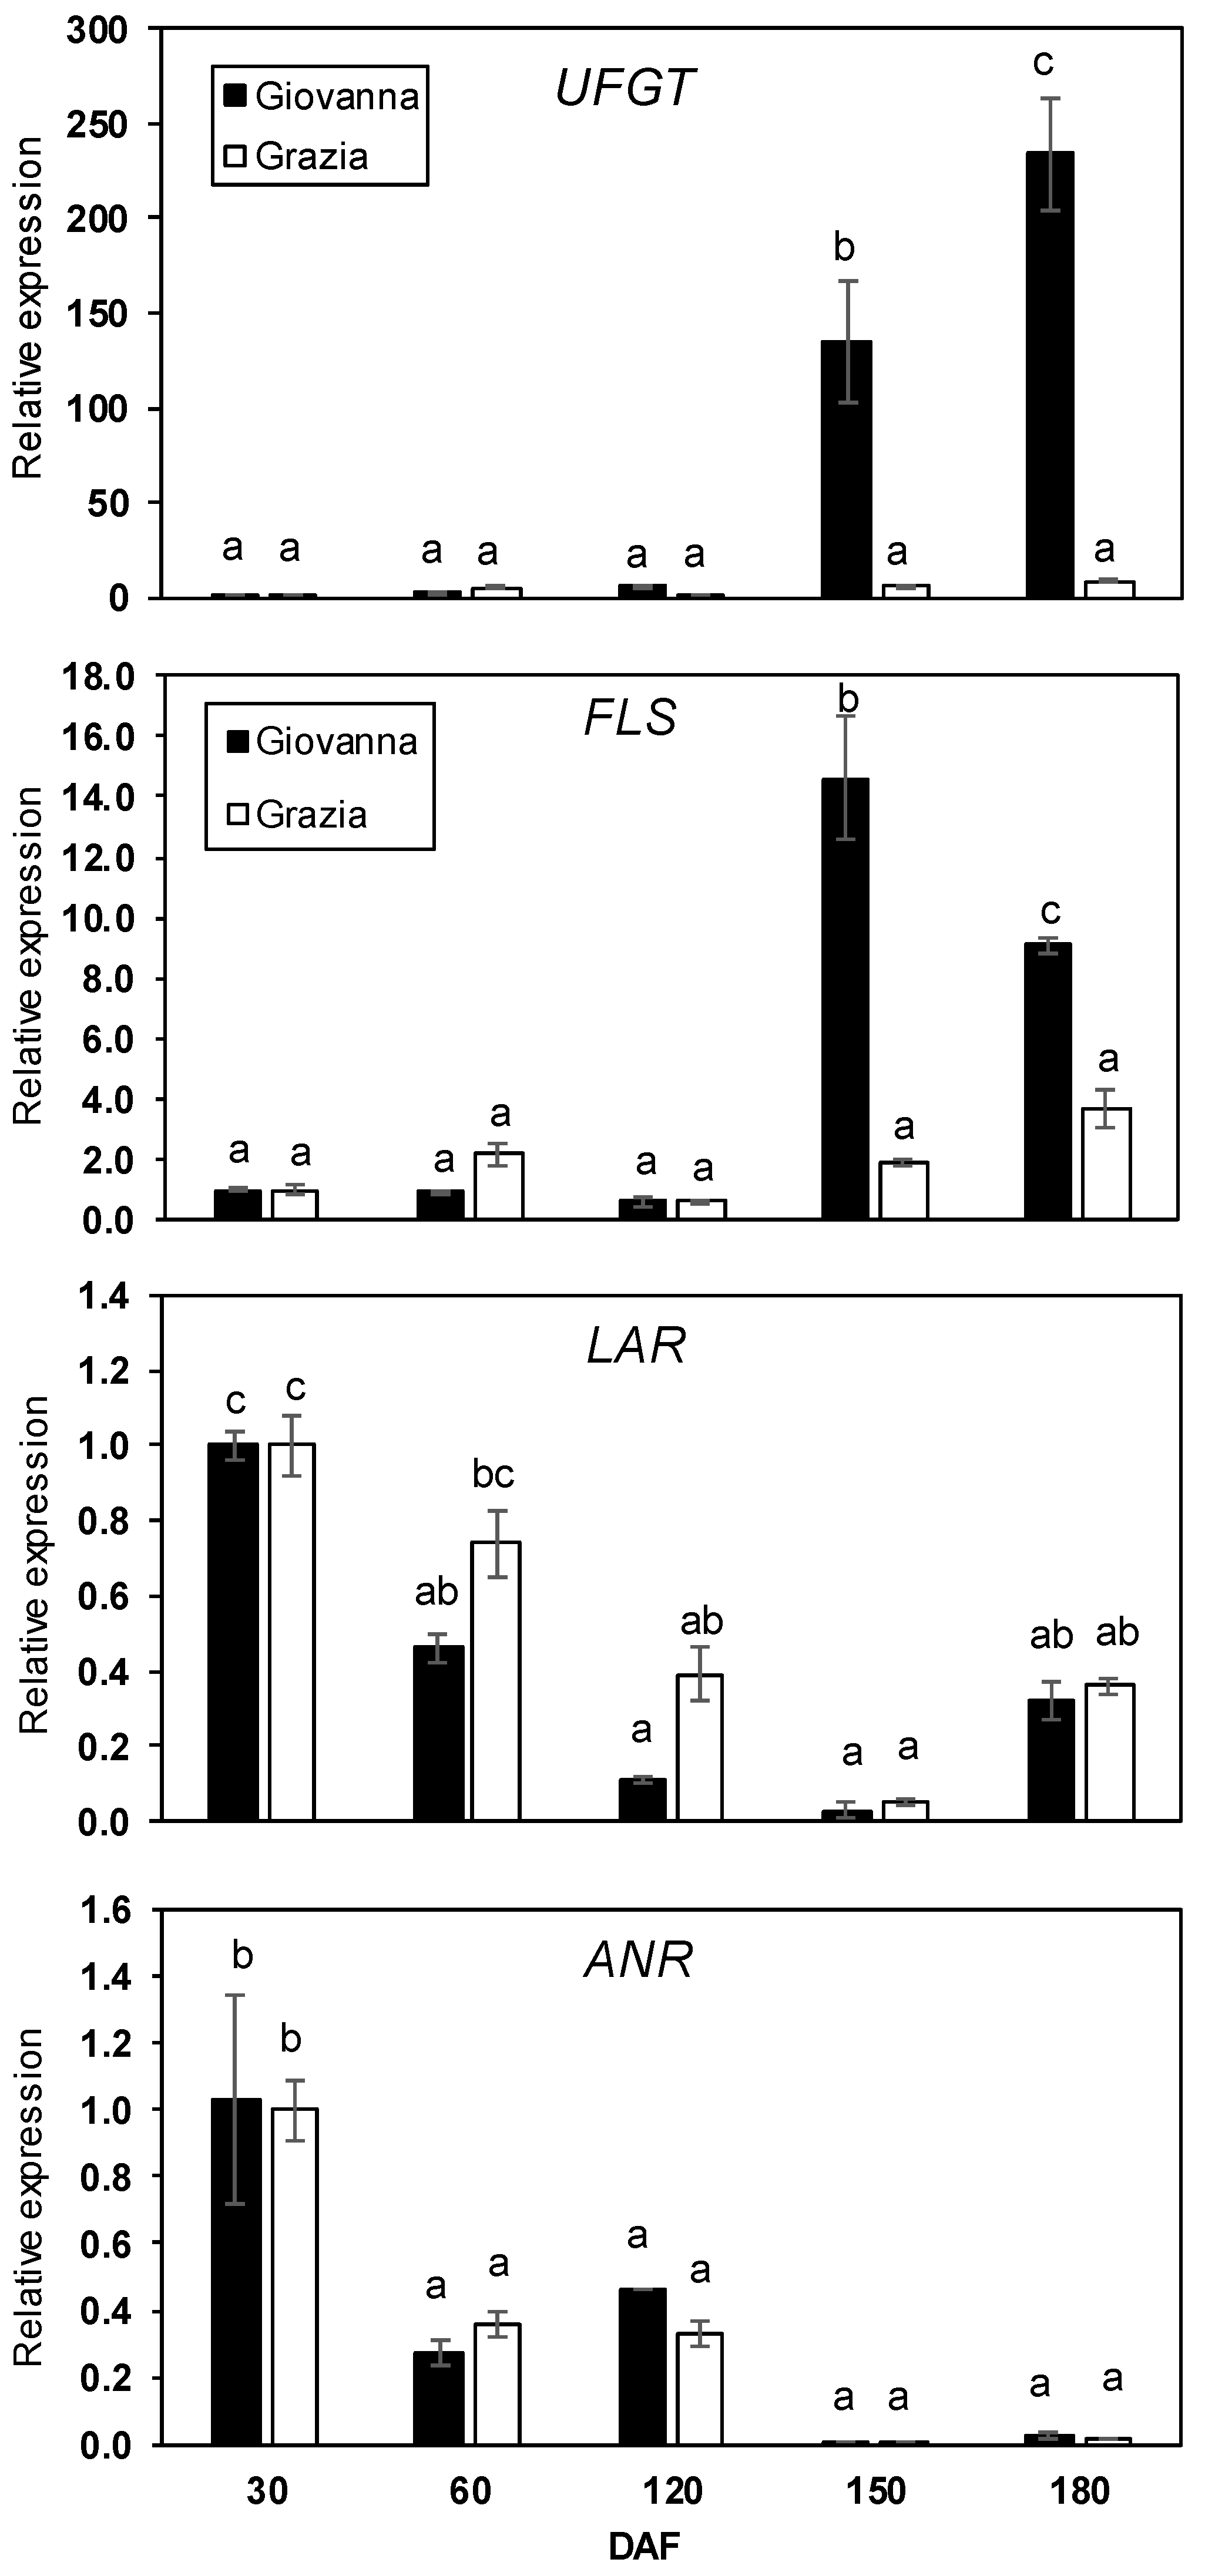
2.2. Expression of Common and Specific Flavonoid Biosynthetic Genes

The relative levels of five common genes of the flavonoid biosynthetic pathway (PAL, CHS, CHI, DFR and LDOX)—a specific anthocyanin gene (UFGT) and genes coding for enzymes implicated in the synthesis of flavonols (FLS) and flavan-3-ols (LAR and ANR)—were analyzed over the five developmental stages of dark-blue and white myrtle fruit (Figure 1 and Figure 2). The relative levels of the analyzed genes showed two distinct patterns of expression between the “Giovanna” and “Grazia” cultivars. In the dark-blue “Giovanna” fruit, the accumulation of PAL, CHI, and UFGT transcripts showed a sharp increase during the last stages of berry maturation at 150 and 180 DAF (days after full blooming) (Figure 1 and Figure 2). Moreover, DFR and FLS showed peak expression at 150 DAF, while LDOX showed a peak at 180 DAF. It is important to note that UFGT transcript expression increased by more than 200 times at 180 DAF (Figure 2). However, the CHS transcript did not vary throughout the development (Figure 1). Regarding the white “Grazia” cultivar, it is interesting to note that only the increase in CHS and the decrease in DFR expression showed significant differences. Thus, the relative change in CHS was approximately 2.5-fold at 180 DAF (Figure 1), whereas, in the case of DFR, (Figure 1) it was two-fold at 60 DAF and decreased with ripening. Finally, the LAR and ANR genes, which are implicated in flavan-3-ol biosynthesis, presented a similar pattern of accumulation in both cultivars. A significant decrease in the expression of both genes throughout the development period was observed. In the dark-blue fruit, the LAR gene decreased by about 60% at ripening compared to at 30 DAF, whereas ANS decreased by about 98% in ripe fruit compared to at 30 DAF (Figure 2).

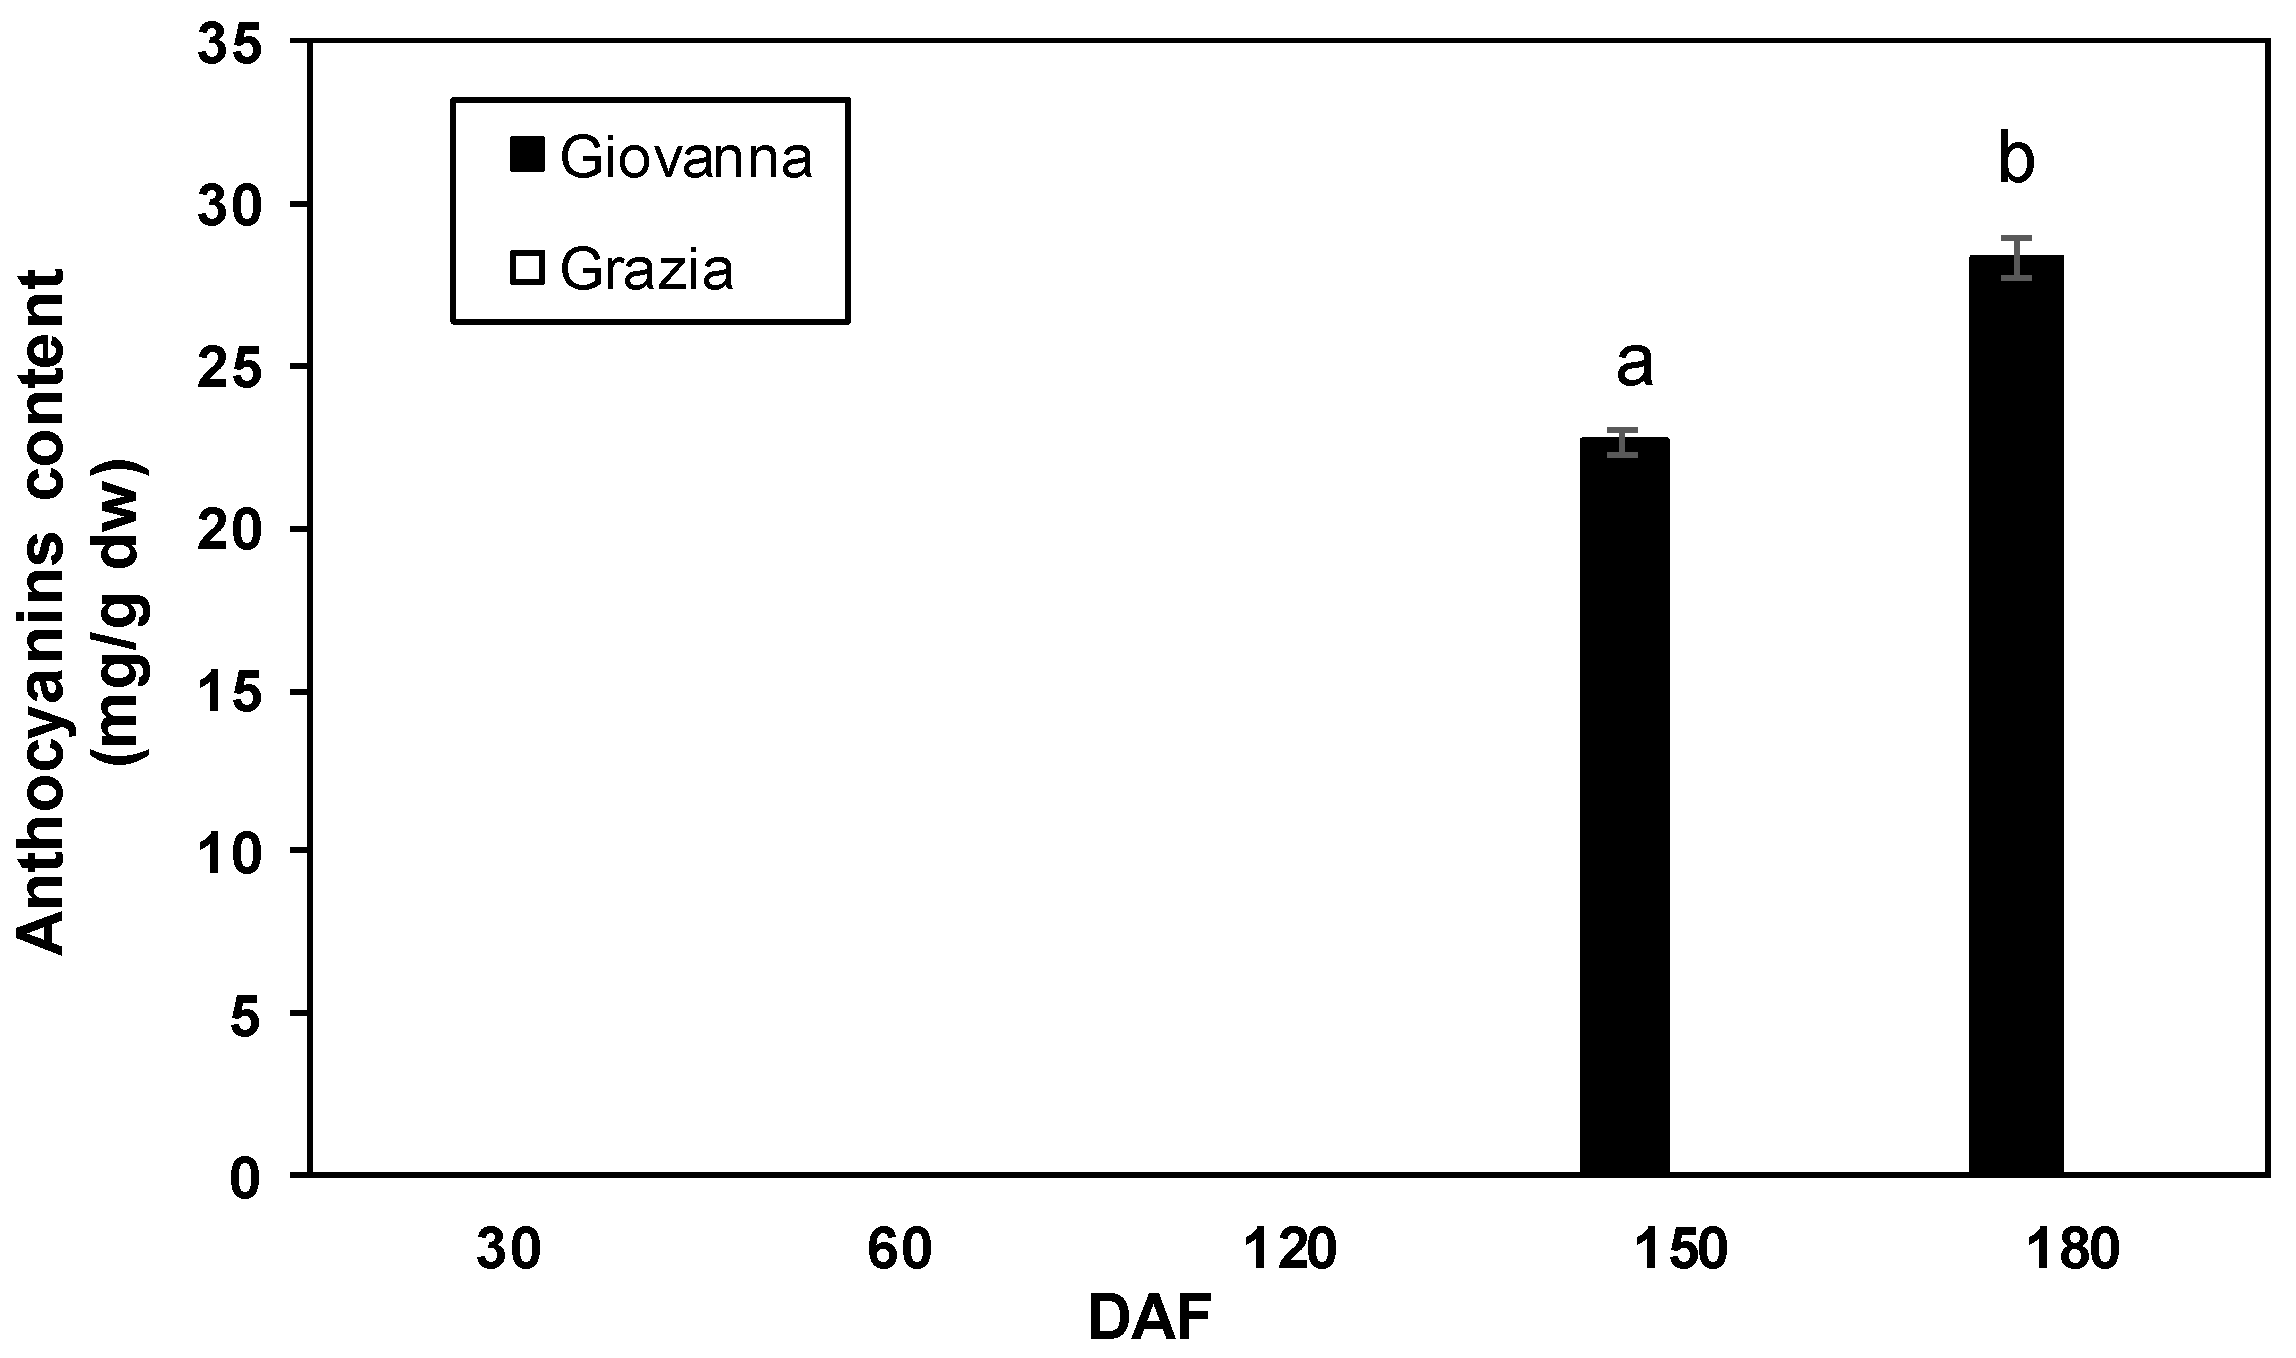
2.3. Total Anthocyanin and Phenolic Content

The total anthocyanin content detected in both genotypes reflected the phenotypical differences between them. Thus, total anthocyanin was only recorded in the “Giovanna” fruit at 120 and 150 DAF with 22.61 and 28.24 mg cyanidin 3-glucoside equivalent/g dry matter, respectively. However, anthocyanins were not detected in the “Grazia” samples (Figure 3). Moreover, strong positive correlations were noted between the PAL, CHI, DFR, LDOX, and UFGT transcript accumulation and the total anthocyanin content (p < 0.01) in the dark-blue “Giovanna” fruit (Table 2). Regarding the total phenolic content, no significant differences between dark-blue and white myrtle fruit were found. Two significant peaks were recorded for “Giovanna” at 60 and 150 DAF while one peak was found for “Grazia” at 120 DAF (Figure 4). Thereafter, the levels were maintained until 180 DAF, and they decreased to levels similar to those observed at 30 DAF. However, though the maximum levels were recorded at 60 DAF in the dark-blue fruit, they were recorded at 120 DAF in white ones. Moreover, it is important to note that no correlations were found between gene expression and total phenolic content (data not shown).

3. Discussion

This study is the first investigation of flavonoid biosynthesis in two myrtle cultivars from a molecular perspective. The use of dark-blue and white genotypes allowed us to understand the differences between the expression levels of key genes that are responsible for the different colorations of ripe berries in flavonoid synthesis. Partial fragments of PAL, CHI, CHS, DFR, FLS, ANR, LAR, ANS, and UFGT (Figure 1 and Figure 2) were isolated from myrtle fruit for the first time, and the relative levels of expression were measured via quantitative RT-PCR (RT-qPCR). We would like to highlight that, although the partial PAL and UFGT fragments from myrtle presented a high identity with five and two Eucalyptus paralogs, respectively, our results showed that the other partial fragments that were isolated only possessed a similar identity to one gene from Eucalyptus. Moreover, it is important to note that some of these key genes presented multiple copies with altered expression during fruit ripening [40,41,42,43,44]. However, in the present study, due to the lack of information about the myrtle genome, we cannot determine the number of copies at the present time.
The dark-blue fruit of the “Giovanna” cultivar showed a content of anthocyanins ranging from 22.61 to 28.24 mg of cyanidin 3-glucoside equivalent/g of dry matter during ripening. Another study on myrtle berries derived from the same domestication process as the cultivars analyzed in this study showed a content of 220.12 mg/100 g fresh weight after 150 DAF [20]. Moreover, it is also possible to find traces of anthocyanins in white myrtle fruit. The macerate obtained through the infusion of white berries in alcohol showed a high content of gallic and ellagic acids and flavonols, especially myricetin-3-O-rhamnoside, while malvidin-3-O-glucoside was present in traces [45].
With regard to the biological differences between the cultivars, all of the myrtle cultivars are characterized by a high plant vigor with strong green biomass production, and this characteristic is linked to high fruit production. However, the mean plant production per year of “Grazia” is 4.5 kg of berries compared to 2.5 kg for “Giovanna”. Moreover, the ripening time of “Grazia” is about 30 days before that of “Giovanna”. As shown in Figure 5 at 180 DAF, the white “Grazia” cultivar during 180 DAF starts to change its peel color. However, the possible anthocyanin accumulation with overripening was under the sensitivity thresholds of the applied method.
In this study, an increase in PAL expression was observed from 30 to 180 DAF in the dark-blue “Giovanna” fruit (Figure 1), which was correlated with the anthocyanin content during the ripening stages (150 and 180 DAF) (Table 2). In some plant species, PAL expression increased with ripening and was correlated with fruit pigmentation [46]. In other species, such as apples, this correlation was not found [47]; thus, it is assumed that PAL is not a key enzyme for anthocyanin formation in these species. Consequently, these authors suggested that this close correlation does not always occur because anthocyanins may originate not only from phenylalanine, but also from other precursors if they are present in high amounts. However, our results suggest that, in myrtle berries, phenylalanine could be the main precursor of anthocyanin biosynthesis. In myrtle, CHS gene expression only increased at the last ripening stage in the white fruit (Figure 1). This trend was also observed in unpigmented strawberry cultivars (Fragaria chiloensis L.), as reported by Salvatierra et al. [48]. Furthermore, Ju et al. [47] and Kondo et al. [49] reported that CHS in apples was not involved in anthocyanin biosynthesis, as its activity remained constant throughout the entire development stage, regardless of anthocyanin synthesis. Goto-Yamamoto et al. [42] showed that the mRNA of CHS3 accumulated mainly in the grape berry skin of red cultivars during coloration, while CHS1 and CHS2 accumulated in the leaves and berry skin of both white and red cultivars. Moreover, Ageorges et al. [43] showed that, among the three CHS identified in grapes, only CHS3 was strongly associated with color. The fact that CHS acts in the first step of the flavonoid biosynthetic pathway for several compounds, including anthocyanins, suggests that, in myrtle fruit, the biosynthesis of other phenolic compounds could be involved, such as proanthocyanidins, as previously reported by Downey et al. [50]. Contrarily to CHS gene expression, the accumulation of CHI showed a peak at the end of the ripening stage (180 DAF) in the dark-blue cultivar, which was correlated with the content of total anthocyanins. In this case, CHI might be a rate-limiting enzyme in anthocyanin formation, in contrast to the findings of other studies [51,52]. DFR gene expression levels also increased with the ripening stage in the dark-blue myrtle cultivar, showing a peak at 150 DAF. Moreover, these changes were positively correlated with anthocyanin accumulation. The white “Grazia” cultivar showed an opposite trend, with higher levels at the early stages of development (especially at 60 DAF) compared to maturation. The DFR gene expression results are in agreement with those of several previous studies. Roy et al. [46] found a higher expression level in the ripe red strawberry genotype than in the white genotype. In addition, in the red fruit of Fragaria pentaphylla, a strong correlation between DFR gene expression and anthocyanin content was found [53]. Furthermore, the expression of DFR gradually increased with ripening in Prunus persica and was correlated with the accumulation of anthocyanins [54]. In pomegranate, DFR showed higher expression levels in the dark and red genotypes than in the green and white ones, and was correlated with anthocyanin accumulation [55]. On other hand, in Ginkgo biloba, an isoform of DFR related to anthocyanin accumulation was found, as well as one that was not related, which could be involved in tannic acid synthesis [56]. Regarding the LDOX and UFGT genes, we found that their expression increased with ripening and was strictly correlated with anthocyanin accumulation in the “Giovanna” cultivar. According to these results, in strawberry, an up-regulation of LDOX and UFGT in the red receptacle at the ripening stage was also observed [46,48]. By contrast, whereas UFGT expression and anthocyanin amount were strictly correlated in the red Tsugaru apple cultivar, LDOX did not seem to directly regulate anthocyanin formation [49]. In the dark-blue myrtle berry, UFGT expression recorded the sharpest increase out of all the studied genes. In contrast, in the white “Grazia” samples, UFGT was detected at very low expression levels. It is known that variations in color intensity can be attributed to differences in the expression of structural or regulatory genes. In pink–white Chinese bayberry fruit, LDOX and UFGT expression was 70% and 90% lower than that of the red fruit at the ripening stage [32]. Previous studies reported UFGT as the key gene of anthocyanin biosynthesis in sweet cherry [30], mangosteen [57], and litchi [58]. Moreover, Boss et al. [51] found UFGT expression exclusively in grape tissue, where anthocyanins were also detected, but only in the in red variety and not in the white one. In this sense, white grapes have arisen through mutations in two MYB transcription factors that specifically control UFGT expression [59,60]. Moreover, Takos et al. [61] showed that the transcript levels of multiple anthocyanin pathway genes, including MdUFGT1 and MdMYB1, were much lower in non-red-skinned apples than in red-skinned ones, concluding that the expression level of this transcription factor could be the genetic basis for apple skin color. By contrast, Meng et al. [62] indicated that UFGT is important for anthocyanin accumulation in apple skins of different colors, especially in non-red apples. These authors showed that, whereas MdUFGT2 was up-regulated only in non-red cultivars, MdUFGT4 was up-regulated only in the red-skinned cultivar. Our results seem to indicate that UFGT could be a key gene responsible for the different pigmentations in the two myrtle genotypes. In this sense, in the future, it will be interesting to identify MYBs or other UFGT regulatory elements in order to determine if they are essential regulatory elements during myrtle ripening.
UFGT showed a higher level of expression in blood oranges than in common oranges, and its expression was correlated with CHS and LDOX expression [63]. In this sense, our results indicated a strong positive correlation between UFGT gene expression and PAL (r = 0.886, p < 0.01), CHI (r = 0.929, p < 0.01), DFR (r = 0.538, p < 0.01), and LDOX (r = 0.886, p < 0.01) expression. FLS, a key gene for flavonol accumulation, showed higher accumulation in the dark-blue myrtle cultivar, though no significant differences were observed in the white cultivar during the fruit development stages. These results are in acccordance with those of Wang et al. [64], who observed increased levels of the FLS transcript in red-fleshed crabapples in comparison to white ones. These authors indicated that the different colorings of fruits are derived from the different expression profiles of structural genes belonging to a network related to flavonoid biosynthesis. In fact, FLS was higher in the ripening stage than in the early development stage in the pigmented cultivar in citrus peels [65]. Moreover, our results seem to indicate that PAL expression could play a role in flavonol accumulation, showing a positive correlation with FLS accumulation (r = 0.778, p < 0.01). In this sense, Morales et al. [66] showed a positive correlation between PAL expression and the accumulation of four flavonols in Betula pendula leaves. The ANR and LAR genes, which are involved in proanthocyanidin biosynthesis, showed higher expression levels in the first stage (30 DAF) of development than in the ripening stage (180 DAF) for both myrtle cultivars; a similar pattern was observed in mulberry, in which ANR and LAR gene expression was highest in young fruitlets and decreased as the fruit developed. Moreover, the expression of these genes decreased with ripening in strawberries [48]. In addition to MYBs, members of several protein superfamilies mediate the transcriptional regulation of the flavonoid biosynthetic pathway, such as basic helix–loop–helix (bHLH) transcription factors and conserved WD40 repeat (WDR) proteins [67]. Therefore, an in-depth study of these regulatory elements may be of great interest for understanding the different expression profiles of the flavonoid genes of both cultivars.
Regardless of the total phenolic content, the maximum content was reached in the “Giovanna” berry at 60 DAF and in the “Grazia” one month later (at 120 DAF); it then decreased in both cultivars upon ripening. In the dark-blue myrtle cultivars, a decrease in total phenolic content and an increase in anthocyanin content were found during ripening [20]. Messaoud and Boussaid [24] indicated that the total phenolic content was higher in red myrtle berries than in white ones; however, in our work, no significant differences between the two cultivars were found. These differences could be explained by the fact that the total phenol content in the fruit depends on several factors, such as genetic factors, the location, and the year of sampling. Contrary to the anthocyanin content, no correlation was found between the total phenolic content and the expression levels analyzed in either cultivar, indicating that it is the anthocyanin trend that seems to regulate gene expression in myrtle during development and ripening. Moreover, the absence of a correlation between total phenolic content and gene expression levels may be due to the sensitivity of the assay used for total phenolic quantification. In fact, the presence of reducing sugars or other reducing compounds in the solution—analyzed via the Folin–Ciocalteu method—may, in part, lead to an overestimation of the total phenolic content [68]. By contrast, Parra-Palma et al. [69] found a positive correlation between total phenolic content and FLS and ANR expression levels in strawberries, suggesting that flavonols and condensed tannins are the major phenolic compounds in the first stages of ripening.

4. Materials and Methods
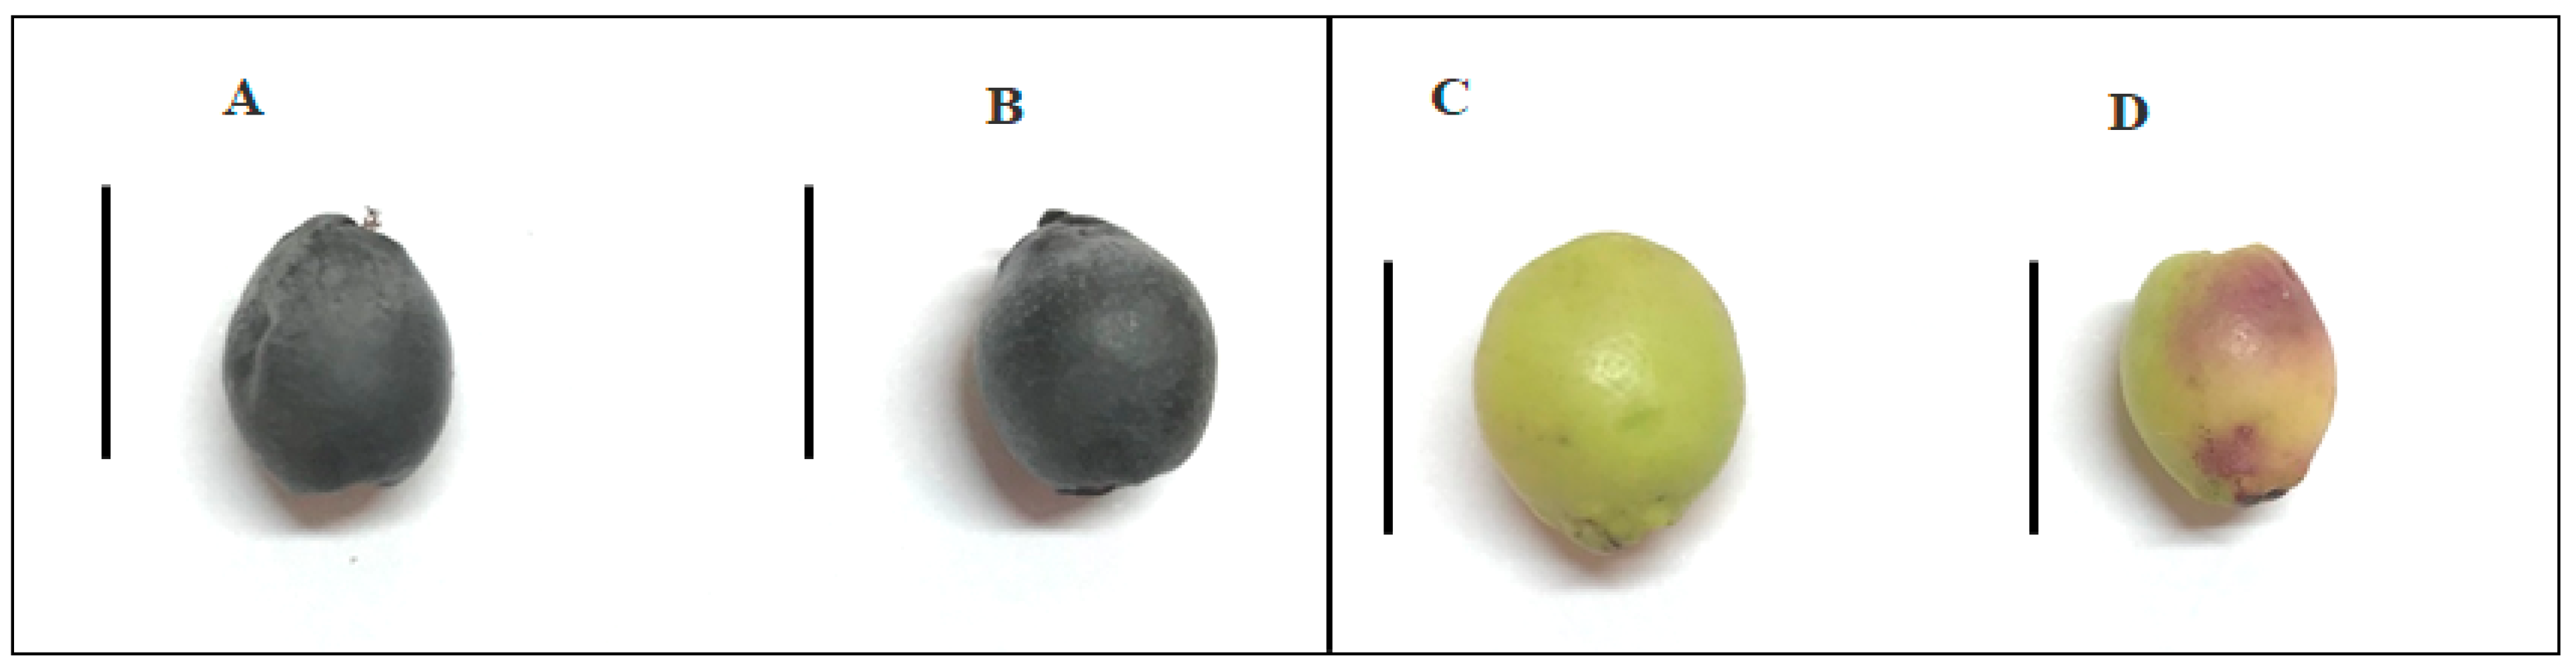
4.1. Plant Material

Two cultivars of myrtle (Myrtus communis L.) with dark-blue berries (“Giovanna”) and white berries (“Grazia”) were analyzed. Fifteen plants of each cultivar were grown in a collection field belonging to the University of Sassari in Fenosu (Oristano, Central–West Sardinia, Italy; 39°53′ North, 8°37′ East; 12 m a.s.l). Berry sampling was carried out over five stages of development, which were defined according to the number of days after flowering (DAF) in the season from July to December 2018 at 30, 60, 120, 150, and 180 DAF. The last stages, 150 and 180 DAF, can be considered overripening stages, particular for the “Grazia” cultivar, which showed earlier ripening with respect to the “Giovanna” cultivar (Figure 5).
The fruit was harvested from 20 plants of each cultivar, with a total of 120 berries sampled for each stage of development. Seeds and core pulp were removed from the berries, and peels with about 1 mm of pulp were ground using a pestle and mortar with liquid nitrogen and stored at −80 °C until analysis.

4.2. Total RNA Extraction, cDNA Synthesis, and RT-PCR

Total RNA was extracted from three biological replicates for each sample (and, for each biological replication, two technical replications were carried out) using the protocol indicated by [70] with some modifications. The extracted RNA quantification was conducted using a Nanodrop 8000 spectrophotometer (Thermo Fisher Scientific, Waltham, MA, USA). RNA integrity was verified through agarose gel electrophoresis. Total RNA was treated with Ambion® DNA-free DNase Treatment (Life Technologies, Carlsbad, CA, USA) to remove possible DNA contamination. Then, cDNA was synthesized from 1 µg of treated RNA using an NZY First-Strand cDNA Synthesis kit (NZYTech™, Lisbon, Portugal) according to the manufacturer’s instructions. Gene-specific primer pairs for RT-PCR (Table 3) were designed with the Primer 3 software [71] using the gene sequences from Eucaliptus extracted from the NCBI (National Center for Biotechnology Information) database as templates. The efficiency of the reaction to establish the most suitable template and primer concentrations was calculated according to [72].
As a template, a pool of cDNA synthetized using RNA extracted from the pigmented myrtle fruit at 120, 150, and 180 DAF was used. Sanger sequencing at Secugen (Madrid, Spain) confirmed the PCR fragments. BLASTN was used to perform similarity searches in the NCBI databases.

4.3. Quantitative Real-Time RT-PCR (RT-qPCR)

The relative expression of all studied genes was assayed with RT-qPCR using Supreme NZYTaq II 2× Green Master (NZYTech™, Lisbon, Portugal), as described by [72]. The reaction mix was composed as follows: 11.25 µL SYBR green, 4.5 µL primer forward and primer reverse (3 µm), 4.5 µL water and 4.5 µL cDNA. The amplification program consisted of initial denaturation at 95 °C for 5 min, followed by 35 denaturation cycles at 94 °C for 30 s, pairing for 30 s, extension at 72 °C for 30 s, and final extension at 72 °C for 5 min. Amplifications were run in a 96-well plate iCycler iQ thermal cycler (Bio-Rad, Hercules, CA, USA), and quantification was performed with the iCycler iQTM software (Real Time Detection System Software, version 2.0, Bio-Rad Laboratories, Hercules, CA, USA). Each gene was evaluated at least in two independent runs. The previously indicated gene-specific primers (Table 1) were used. The actin gene was used as the internal reference gene for normalizing the transcript profiles. Gene-specific primers were designed for ACTIN-1 from Eucalyptus (Table 3). Relative expression levels were estimated with the 2−ΔΔCt method and were denoted as the fold difference from the expression present at the calibrator sample (30 DAF from dark-blue samples). The specificity of the products was validated with dissociation curve analysis and with agarose gel; the sequences were confirmed via Sanger sequencing at Secugen (Madrid, Spain).

4.4. Determination of Total Anthocyanin and Total Phenolic Content

For these determinations, 600 mg of fruit sample (peel with 1 mm of adherent pulp) pulverized in liquid nitrogen was extracted with 10 mL of acidified ethanol (0.1% hydrochloric acid) and placed in the dark overnight at room temperature. The extracts were filtered with Whatman filter paper and stored at −20 °C until the chemical analysis (within one week after sampling). The same extract was used for both anthocyanin and total phenolic content determination. Three biological replicates were analyzed for each sample.
The total anthocyanin content was quantified using the spectrophotometric method proposed by [73] with some modifications according to the expected concentration of anthocyanins. Then, 0.5 mL of acidified ethanol extract was added to 6.5 mL potassium chloride buffer at pH 1, while the other 0.5 mL of extract was added to 6.5 mL of sodium acetate buffer (pH 4.5). After 30 min, the absorbance (A) of the two mixtures was read at both 510 and 700 nm and was calculated as (A) = (A510–A700 nm) pH 1.0–(A510–A700 nm) pH 4.5 [74].
The content of anthocyanins was calculated according to the following equation [74]:
Anthocyanins = (A × MW × DF × 1000)/(ε × l),
  • A = Absorbance
  • MW = Molecular weight
  • DF = Dilution factor
  • ε = Molar extinction coefficient, l × mol−1 × cm−1
  • l = Pathlength (1 cm)
Anthocyanin content was expressed as mg of cyanidin-3-glucoside equivalent/g of dry matter (DW). The results were compared with a calibration curve that was obtained using a range of concentrations of 0.05–0.30 mg/mL.
Total phenolic content was determined with the Folin–Ciocalteu colorimetric method [75]. For this, 0.5 mL of ethanolic acidified extract diluted with 35 mL of deionized water was added to 2.5 mL of Folin–Ciocalteu reagent. After 3 min of incubation, 5 mL of sodium carbonate solution (20% in water) was added to the mixture. The solution was heated at 70 °C for 20 min and deionized water was added to bring the solution to a final volume of 50 mL. The absorbance was read at 750 nm using a CARY 50 Scan Uv-Vis VARIAN (Amsterdam, The Netherlands) spectrophotometer. The calibration curve was obtained using a range of gallic acid between 0.05 and 0.5 mg/mL. The results were expressed as mg of gallic acid equivalent (GAE)/g DW.

4.5. Statistical Analysis

After analysis for normality and homogeneity, an analysis of variance (ANOVA) was performed using the SSPS statistical software with a split-plot design in order to evaluate the influence of the main variables: cultivar (A) and DAF (B). Tukey’s B-test (p ≤ 0.05) was applied for mean separation at the AxB level of the dependent variables (PAL, CHS, CHI, DFR, FLS, ANR, LAR, LDOX, and UFGT relative expression).
The correlations between the relative levels of structural gene expression, total anthocyanin content, and total phenolic content were evaluated with the Pearson coefficient at 99% significance using the R Studio software (version: 3.4.4; PBC, Boston, MA, USA).

5. Conclusions

In this preliminary study, we analyzed, for the first time, the expression of the structural genes involved in flavonoid biosynthesis in myrtle fruit. The overall results indicated that the differences in coloration between the dark-blue “Giovanna” cultivar and the white “Grazia” fruit might be due to the over-regulation of some structural genes in dark-blue fruit, particularly the LDOX and UFGT genes. Moreover, this first molecular approach showed significant positive correlations between the common and specific anthocyanin genes and the total anthocyanin content, whereas no correlations were found with total phenolic content. Further work, with the aim of elucidating the molecular mechanisms underlying the loss of anthocyanins in the white fruit cultivar and the eventual role of the transcription factors involved in flavonoid gene modulation, could initiate an interesting research line with regard to myrtle fruit.

Supplementary Materials

The following are available online at ’https://www.mdpi.com/2223-7747/10/2/316/s1, Figures S1, S3, S5, S7, S9, S11, S13, S15, S17. Alignment of the partial nucleotide sequence of PAL, CHS, CHI, DFR, LDOX, UFGT, FLS, LAR, ANR, respectively, from M. communis and the full-length sequences from E. grandis, V. vinifera, M. domestica and A. thaliana. Identical nucleotides among the sequences are in a black background, whereas those that are similar among the nucleotide sequences are in grey background. The dashes indicate gaps introduced to improve alignment, Figures S2, S4, S6, S8, S10, S12, S14, S16, S18. Alignment of the translated amplicon-amino acid sequence from M. communis and the full-length PAL, CHS, CHI, DFR, LDOX, UFGT, FLS, LAR, ANR, respectively, sequences from E. grandis, V. vinifera, M. domestica and A. thaliana. Identical amino acids are shaded in black, and similar amino acids are shaded in grey. The remaining residues are in a white background.

Author Contributions

Conceptualization, S.M. and M.M.; methodology, S.M., M.T.S.-B., I.R., L.D., M.M.; validation, S.M., M.T.S.-B., and I.R.; formal analysis, S.M., M.T.S.-B., and I.R.; resources, S.M., and M.M.; data curation, S.M., L.D.; writing—original draft preparation, S.M., M.T.S.-B., I.R., L.D., M.M.; writing—review and editing, S.M., M.T.S.-B., I.R., L.D., M.M.; supervision, M.M.; project administration, M.M.; funding acquisition, M.M. All authors have read and agreed to the published version of the manuscript.

Funding

This work was funded by a grant of the Regione Autonoma della Sardegna P.O.R. program, by the FAR2019MULAS found, and by the project SYSTEMIC “An integrated approach to the challenge of sustainable food systems adaptive and mitigatory strategies to address climate change and malnutrition”, Knowledge hub on Nutrition and Food Security, in a joint action of JPI HDHL, JPI OCEANS and FACCE JPI launched in 2019 under the ERA NET ERA HDHL (n 696295).

Conflicts of Interest

The authors declare no conflict of interest.

References

  1. Haminiuk, C.W.; Maciel, G.M.; Plata-Oviedo, M.S.; Peralta, R.M. Phenolic compounds in fruits—An overview. Int. J. Food Sci. Technol. 2012, 47, 2023–2044. [Google Scholar] [CrossRef]
  2. Guerrero-Chavez, G.; Scampicchio, M.; Andreotti, C. Influence of the site altitude on strawberry phenolic composition and quality. Sci. Hortic. 2015, 192, 21–28. [Google Scholar] [CrossRef]
  3. Azuma, A.; Yakushiji, H.; Koshita, Y.; Kobayashi, S. Flavonoid biosynthesis-related genes in grape skin are differentially regulated by temperature and light conditions. Planta 2012, 236, 1067–1080. [Google Scholar] [CrossRef] [PubMed]
  4. Vian, M.A.; Tomao, V.; Coulomb, P.O.; Lacombe, J.M.; Dangles, O. Comparison of the anthocyanin composition during ripening of Syrah grapes grown using organic or conventional agricultural practices. J. Agric. Food Chem. 2006, 54, 5230–5235. [Google Scholar] [CrossRef] [PubMed]
  5. Awad, M.A.; Wagenmakers, P.S.; de Jager, A. Effects of light on flavonoid and chlorogenic acid levels in the skin of ‘Jonagold’ apples. Sci. Hortic. 2001, 88, 289–298. [Google Scholar] [CrossRef]
  6. Esteban, M.A.; Villanueva, M.J.; Lissarrague, J.R. Effect of irrigation on changes in the anthocyanin composition of the skin of cv Tempranillo (Vitis vinifera L.) grape berries during ripening. J. Sci. Food Agric. 2001, 81, 409–420. [Google Scholar] [CrossRef]
  7. Romero, I.; Sanchez-Ballesta, M.T.; Maldonado, R.; Escribano, M.I.; Merodio, C. Anthocyanin, antioxidant activity and stress-induced gene expression in high CO2-treated table grapes stored at low temperature. J. Plant Physiol. 2008, 165, 522–530. [Google Scholar] [CrossRef]
  8. Bodelón, O.G.; Blanch, M.; Sanchez-Ballesta, M.T.; Escribano, M.I.; Merodio, C. The effects of high CO2 levels on anthocyanin composition, antioxidant activity and soluble sugar content of strawberries stored at low non-freezing temperature. Food Chem. 2010, 122, 673–678. [Google Scholar] [CrossRef]
  9. Cisneros-Zevallos, L.; Jacobo-Velázquez, D.A. Controlled Abiotic Stresses Revisited: From Homeostasis through Hormesis to Extreme Stresses and the Impact on Nutraceuticals and Quality during Pre-and Postharvest Applications in Horticultural Crops. J. Agric. Food Chem. 2020, 68, 11877–11879. [Google Scholar] [CrossRef] [PubMed]
  10. Sigurdson, G.T.; Tang, P.; Giusti, M.M. Natural colorants: Food colorants from natural sources. Annu. Rev. Food Sci. Technol. 2017, 8, 261–280. [Google Scholar] [CrossRef] [PubMed]
  11. Pazmiño-Durán, E.A.; Giusti, M.M.; Wrolstad, R.E.; Glória, M.B.A. Anthocyanins from banana bracts (Musa X paradisiaca) as potential food colorants. Food Chem. 2001, 73, 327–332. [Google Scholar] [CrossRef]
  12. Hope Smith, S.; Tate, P.L.; Huang, G.; Magee, J.B.; Meepagala, K.M.; Wedge, D.E.; Larcom, L.L. Antimutagenic activity of berry extracts. J. Med. Food 2004, 7, 450–455. [Google Scholar] [CrossRef] [Green Version]
  13. Bowen-Forbes, C.S.; Zhang, Y.; Nair, M.G. Anthocyanin content, antioxidant, anti-inflammatory and anticancer properties of blackberry and raspberry fruits. J. Food Compos. Anal. 2010, 23, 554–560. [Google Scholar] [CrossRef]
  14. Wallace, T.C. Anthocyanins in cardiovascular disease. Adv. Nutr. 2011, 2, 1–7. [Google Scholar] [CrossRef] [Green Version]
  15. Gowd, V.; Jia, Z.; Chen, W. Anthocyanins as promising molecules and dietary bioactive components against diabetes—A review of recent advances. Trends Food Sci. Technol. 2017, 68, 1–13. [Google Scholar] [CrossRef]
  16. Cruciani, S.; Santaniello, S.; Fadda, A.; Sale, L.; Sarais, G.; Sanna, D.; Mulas, M.; Ginesu, G.C.; Cossu, M.L.; Serra, P.A.; et al. Extracts from myrtle liqueur processing waste modulate stem cells pluripotency under stressing conditions. Biomed. Res. Int. 2019, 2019. [Google Scholar] [CrossRef] [PubMed] [Green Version]
  17. Babou, L.; Hadidi, L.; Grosso, C.; Zaidi, F.; Valentão, P.; Andrade, P.B. Study of phenolic composition and antioxidant activity of myrtle leaves and fruits as a function of maturation. Eur. Food Res. Technol. 2016, 242, 1447–1457. [Google Scholar] [CrossRef]
  18. Wannes, A.W.; Marzouk, B. Differences between myrtle fruit parts (Myrtus communis var. italica) in phenolics and antioxidant contents. J. Food Biochem. 2013, 37, 585–594. [Google Scholar] [CrossRef]
  19. Sanna, D.; Delogu, G.; Mulas, M.; Schirra, M.; Fadda, A. Determination of free radical scavenging activity of plant extracts through DPPH assay: An EPR and UV–Vis study. Food Anal. Methods 2012, 5, 759–766. [Google Scholar] [CrossRef]
  20. Fadda, A.; Mulas, M. Chemical changes during myrtle (Myrtus communis L.) fruit development and ripening. Sci. Hortic. 2010, 125, 477–485. [Google Scholar] [CrossRef]
  21. Tuberoso, C.I.; Melis, M.; Angioni, A.; Pala, M.; Cabras, P. Myrtle hydroalcoholic extracts obtained from different selections of Myrtus communis L. Food Chem. 2007, 101, 806–811. [Google Scholar] [CrossRef]
  22. Mulas, M. The myrtle (Myrtus communis L.) case: From a wild shrub to a new fruit crop. Acta Hortic. 2012, 948, 235–242. [Google Scholar] [CrossRef]
  23. Özcan, M.M.; Al Juhaimi, F.; Ahmed, I.A.M.; Babiker, E.E.; Ghafoor, K. Antioxidant activity, fatty acid composition, phenolic compounds and mineral contents of stem, leave and fruits of two morphs of wild myrtle plants. J. Food Meas. Charact. 2020, 14, 1376–1382. [Google Scholar] [CrossRef]
  24. Messaoud, C.; Boussaid, M. Myrtus communis berry color morphs: A comparative analysis of essential oils, fatty acids, phenolic compounds, and antioxidant activities. Chem. Biodivers. 2011, 8, 300–310. [Google Scholar] [CrossRef] [PubMed]
  25. Kayesh, E.; Shangguan, L.; Korir, N.K.; Sun, X.; Bilkish, N.; Zhang, Y.; Fang, J. Fruit skin color and the role of anthocyanin. Acta Physiol. Plant. 2013, 35, 2879–2890. [Google Scholar] [CrossRef]
  26. Schijlen, E.G.; De Vos, C.R.; van Tunen, A.J.; Bovy, A.G. Modification of flavonoid biosynthesis in crop plants. Phytochemistry 2004, 65, 2631–2648. [Google Scholar] [CrossRef] [PubMed]
  27. Medda, S.; Dessena, L.; Mulas, M. Monitoring of the PAL Enzymatic Activity and Polyphenolic Compounds in Leaves and Fruits of Two Myrtle Cultivars during Maturation. Agriculture 2020, 10, 389. [Google Scholar] [CrossRef]
  28. Xie, S.; Song, C.; Wang, X.; Liu, M.; Zhang, Z.; Xi, Z. Tissue-specific expression analysis of anthocyanin biosynthetic genes in white-and red-fleshed grape cultivars. Molecules 2015, 20, 22767–22780. [Google Scholar] [CrossRef] [Green Version]
  29. Zhao, X.; Yuan, Z.; Feng, L.; Fang, Y. Cloning and expression of anthocyanin biosynthetic genes in red and white pomegranate. J. Plant Res. 2015, 128, 687–696. [Google Scholar] [CrossRef] [PubMed]
  30. Wei, H.; Chen, X.; Zong, X.; Shu, H.; Gao, D.; Liu, Q. Comparative transcriptome analysis of genes involved in anthocyanin biosynthesis in the red and yellow fruits of sweet cherry (Prunus avium L.). PLoS ONE 2015, 10, e0121164. [Google Scholar] [CrossRef]
  31. Zhang, X.; Allan, A.C.; Yi, Q.; Chen, L.; Li, K.; Shu, Q.; Su, J. Differential gene expression analysis of Yunnan red pear, Pyrus pyrifolia, during fruit skin coloration. Plant Mol. Biol. Report. 2011, 29, 305–314. [Google Scholar] [CrossRef]
  32. Lin, Q.; Zhong, Q.; Zhang, Z. Comparative transcriptome analysis of genes involved in anthocyanin biosynthesis in the pink-white and red fruits of Chinese bayberry (Morella rubra). Sci. Hortic. 2019, 250, 278–286. [Google Scholar] [CrossRef]
  33. Mori, K.; Sugaya, S.; Gemma, H. Decreased anthocyanin biosynthesis in grape berries grown under elevated night temperature condition. Sci. Hortic. 2005, 105, 319–330. [Google Scholar] [CrossRef]
  34. Cominelli, E.; Gusmaroli, G.; Allegra, D.; Galbiati, M.; Wade, H.K.; Jenkins, G.I.; Tonelli, C. Expression analysis of anthocyanin regulatory genes in response to different light qualities in Arabidopsis thaliana. J. Plant Physiol. 2008, 165, 886–894. [Google Scholar] [CrossRef]
  35. Loreti, E.; Povero, G.; Novi, G.; Solfanelli, C.; Alpi, A.; Perata, P. Gibberellins, jasmonate and abscisic acid modulate the sucrose-induced expression of anthocyanin biosynthetic genes in Arabidopsis. New Phytol. 2008, 179, 1004–1016. [Google Scholar] [CrossRef]
  36. Sarais, G.; D’Urso, G.; Lai, C.; Pirisi, F.M.; Pizza, C.; Montoro, P. Targeted and untargeted mass spectrometric approaches in discrimination between Myrtus communis cultivars from Sardinia region. J. Mass Spectrom. 2016, 51, 704–715. [Google Scholar] [CrossRef]
  37. Melito, S.; Chessa, I.; Erre, P.; Podani, J.; Mulas, M. The genetic diversity of Sardinian myrtle (Myrtus communis L.) populations. Electron. J. Biotechnol. 2013, 16, 7. [Google Scholar] [CrossRef]
  38. Melito, S.; Fadda, A.; Rapposelli, E.; Mulas, M. Genetic diversity and population structure of Sardinian myrtle (Myrtus communis L.) selections as obtained by AFLP markers. HortScience 2014, 49, 531–537. [Google Scholar] [CrossRef]
  39. Lepiniec, L.; Debeaujon, I.; Routaboul, J.; Baudry, A.; Pourcel, L.; Nesi, N.; Caboche, M. Genetics and biochemistry of seed flavonoids. Annu. Rev. Plant Biol. 2006, 57, 405–430. [Google Scholar] [CrossRef] [PubMed]
  40. Chaudhary, H.; Bang, G.K.; Jayaprakasha, G.K.; Patil, B.S. Variation in key flavonoid biosynthetic enzymes and phytochemicals in ‘Rio Red’ grapefruit (Citrus paradisi Macf.) during fruit development. J. Agric. Food Chem. 2016, 64, 9022–9032. [Google Scholar] [CrossRef] [PubMed]
  41. Rao, G.; Zhang, J.; Liu, X.; Luo, Y. Identification of putative genes for polyphenol biosynthesis in olive fruits and leaves using full-length transcriptome sequencing. Food Chem. 2019, 300, 125246. [Google Scholar]
  42. Goto-Yamamoto, N.; Wan, G.H.; Masaki, K.; Kobayashi, S. Structure and transcription of three chalcone synthase genes of grapevine (Vitis vinifera). Plant Sci. 2002, 162, 867–872. [Google Scholar] [CrossRef]
  43. Ageorges, A.; Fernandez, L.; Vialet, S.; Merdinoglu, D.; Terrier, N.; Romieu, C. Four specific isogenes of the anthocyanin metabolic pathway are systematically co-expressed with the red colour of grape berries. Plant Sci. 2006, 170, 372–383. [Google Scholar] [CrossRef]
  44. Meng, R.; Zhang, J.; An, L.; Zhang, B.; Jiang, X.; Yang, Y.; Zhao, Z. Expression profiling of several gene families involved in anthocyanin biosynthesis in apple (Malus domestica Borkh.) skin during fruit development. J. Plant Growth Regul. 2016, 35, 449–464. [Google Scholar] [CrossRef]
  45. Serreli, G.; Jerković, I.; Gil, K.A.; Marijanović, Z.; Pacini, V.; Tuberoso, C.I.G. Phenolic compounds, volatiles and antioxidant capacity of white myrtle berry liqueurs. Plant Foods Hum. Nutr. 2017, 72, 205–210. [Google Scholar] [CrossRef] [PubMed]
  46. Roy, S.; Singh, S.; Archbold, D.D. Developmental variation in fruit polyphenol content and related gene expression of a red-fruited versus a white-fruited Fragaria vesca genotype. Horticulturae 2018, 4, 30. [Google Scholar] [CrossRef] [Green Version]
  47. Ju, Z.; Liu, C.; Yuan, Y. Activities of chalcone synthase and UDPGal: Flavonoid-3-o-glycosyltransferase in relation to anthocyanin synthesis in apple. Sci. Hortic. 1995, 63, 175–185. [Google Scholar] [CrossRef]
  48. Salvatierra, A.; Pimentel, P.; Moya-Leon, M.A.; Caligari, P.D.; Herrera, R. Comparison of transcriptional profiles of flavonoid genes and anthocyanin contents during fruit development of two botanical forms of Fragaria chiloensis ssp. chiloensis. Phytochemistry 2010, 71, 1839–1847. [Google Scholar] [CrossRef] [PubMed]
  49. Kondo, S.; Hiraoka, K.; Kobayashi, S.; Honda, C.; Terahara, N. Changes in the expression of anthocyanin biosynthetic genes during apple development. J. Am. Soc. Hortic. Sci. 2002, 127, 971–976. [Google Scholar] [CrossRef]
  50. Downey, M.O.; Harvey, J.S.; Robinson, S.P. Synthesis of flavonols and expression of flavonol synthase genes in the developing grape berries of Shiraz and Chardonnay (Vitis vinifera L.). Aust. J. Grape Wine Res. 2003, 9, 110–121. [Google Scholar] [CrossRef]
  51. Boss, P.K.; Davies, C.; Robinson, S.P. Expression of anthocyanin biosynthesis pathway genes in red and white grapes. Plant Mol. Biol. 1996, 32, 565–569. [Google Scholar] [CrossRef]
  52. Niu, S.S.; Xu, C.J.; Zhang, W.S.; Zhang, B.; Li, X.; Lin-Wang, K.; Ferguson, I.B.; Allan, A.C.; Chen, K.S. Coordinated regulation of anthocyanin biosynthesis in Chinese bayberry (Myrica rubra) fruit by a R2R3 MYB transcription factor. Planta 2010, 231, 887–899. [Google Scholar] [CrossRef]
  53. Duan, W.; Sun, P.; Li, J. Expression of genes involved in the anthocyanin biosynthesis pathway in white and red fruits of Fragaria pentaphylla and genetic variation in the dihydroflavonol-4-reductase gene. Biochem. Syst. Ecol. 2017, 72, 40–46. [Google Scholar] [CrossRef]
  54. Liu, X.; Chen, M.; Wen, B.; Fu, X.; Li, D.; Chen, X.; Gao, D.; Li, L.; Xiao, W. Transcriptome analysis of peach (Prunus persica) fruit skin and differential expression of related pigment genes. Sci. Hortic. 2019, 250, 271–277. [Google Scholar] [CrossRef]
  55. Rouholamin, S.; Zahedi, B.; Nazarian-Firouzabadi, F.; Saei, A. Expression analysis of anthocyanin biosynthesis key regulatory genes involved in pomegranate (Punica granatum L.). Sci. Hortic. 2015, 186, 84–88. [Google Scholar] [CrossRef]
  56. Hua, C.; Linling, L.; Shuiyuan, C.; Fuliang, C.; Feng, X.; Honghui, Y.; Conghua, W. Molecular cloning and characterization of three genes encoding dihydroflavonol-4-reductase from Ginkgo biloba in anthocyanin biosynthetic pathway. PLoS ONE 2013, 8, e72017. [Google Scholar] [CrossRef] [Green Version]
  57. Palapol, Y.; Ketsa, S.; Lin-Wang, K.; Ferguson, I.B.; Allan, A.C. A MYB transcription factor regulates anthocyanin biosynthesis in mangosteen (Garcinia mangostana L.) fruit during ripening. Planta 2009, 229, 1323–1334. [Google Scholar] [CrossRef]
  58. Zhao, Z.C.; Hu, G.B.; Hu, F.C.; Wang, H.C.; Yang, Z.Y.; Lai, B. The UDP glucose: Flavonoid-3-O-glucosyltransferase (UFGT) gene regulates anthocyanin biosynthesis in litchi (Litchi chinesis Sonn.) during fruit coloration. Mol. Biol. Rep. 2012, 39, 6409–6415. [Google Scholar] [CrossRef] [PubMed]
  59. Kobayashi, S.; Goto-Yamamoto, N.; Hirochika, H. Retrotransposon-induced mutations in grape skin color. Science 2004, 304, 982. [Google Scholar] [CrossRef] [PubMed]
  60. Walker, A.R.; Lee, E.; Bogs, J.; McDavid, D.A.J.; Thomas, M.R.; Robinson, S.P. White grapes arose through the mutation of two similar and adjacent regulatory genes. Plant J. 2007, 49, 772–785. [Google Scholar] [CrossRef] [PubMed]
  61. Takos, A.M.; Jaffé, F.W.; Jacob, S.R.; Bogs, J.; Robinson, S.P.; Walker, A.R. Light-induced expression of a MYB gene regulates anthocyanin biosynthesis in red apples. Plant Physiol. 2006, 142, 1216–1232. [Google Scholar] [CrossRef] [PubMed] [Green Version]
  62. Meng, R.; Qu, D.; Liu, Y.; Gao, Z.; Yang, H.; Shi, X.; Zhao, Z. Anthocyanin accumulation and related gene family expression in the skin of dark-grown red and non-red apples (Malus domestica Borkh.) in response to sunlight. Sci. Hortic. 2015, 189, 66–73. [Google Scholar] [CrossRef]
  63. Cotroneo, P.S.; Russo, M.P.; Ciuni, M.; Recupero, G.R.; Piero, A.R.L. Quantitative real-time reverse transcriptase-PCR profiling of anthocyanin biosynthetic genes during orange fruit ripening. J. Am. Soc. Hortic. Sci. 2006, 131, 537–543. [Google Scholar] [CrossRef] [Green Version]
  64. Wang, Y.R.; Lu, Y.F.; Hao, S.X.; Zhang, M.L.; Zhang, J.; Tian, J.; Yao, Y.C. Different coloration patterns between the red-and white-fleshed fruits of malus crabapples. Sci. Hortic. 2015, 194, 26–33. [Google Scholar] [CrossRef]
  65. Moriguchi, T.; Kita, M.; Ogawa, K.; Tomono, Y.; Endo, T.; Omura, M. Flavonol synthase gene expression during citrus fruit development. Physiol. Plant. 2002, 114, 251–258. [Google Scholar] [CrossRef]
  66. Morales, L.O.; Tegelberg, R.; Brosché, M.; Keinänen, M.; Lindfors, A.; Aphalo, P.J. Effects of solar UV-A and UV-B radiation on gene expression and phenolic accumulation in Betula pendula leaves. Tree Phyiol. 2010, 30, 923–934. [Google Scholar] [CrossRef] [Green Version]
  67. Hichri, I.; Barrieu, F.; Bogs, J.; Kappel, C.; Delrot, S.; Lauvergeat, V. Recent advances in the transcriptional regulation of the flavonoid biosynthetic pathway. J. Exp. Bot. 2011, 62, 2465–2483. [Google Scholar] [CrossRef] [PubMed] [Green Version]
  68. Sánchez-Rangel, J.C.; Benavides, J.; Heredia, J.B.; Cisneros-Zevallos, L.; Jacobo-Velázquez, D.A. The Folin–Ciocalteu assay revisited: Improvement of its specificity for total phenolic content determination. Food Anal. Methods 2013, 5, 5990–5999. [Google Scholar] [CrossRef]
  69. Parra-Palma, C.; Morales-Quintana, L.; Ramos, P. Phenolic Content, Color Development, and Pigment−Related Gene Expression: A Comparative Analysis in Different Cultivars of Strawberry during the Ripening Process. Agronomy 2020, 10, 588. [Google Scholar] [CrossRef] [Green Version]
  70. Fortes, A.M.; Agudelo-Romero, P.; Silva, M.S.; Ali, K.; Sousa, L.; Maltese, F.; Choi, Y.H.; Grimplet, J.; Martinez-Zapater, J.M.; Pais, M.S. Transcript and metabolite analysis in Trincadeira cultivar reveals novel information regarding the dynamics of grape ripening. BMC Plant Biol. 2011, 11, 149. [Google Scholar] [CrossRef] [Green Version]
  71. Koressaar, T.; Remm, M. Enhancements and modifications of primer design program Primer3. Bioinformatics 2007, 23, 1289–1291. [Google Scholar] [CrossRef] [Green Version]
  72. Rosales, R.; Fernandez-Caballero, C.; Romero, I.; Escribano, M.I.; Merodio, C.; Sanchez-Ballesta, M.T. Molecular analysis of the improvement in rachis quality by high CO2 levels in table grapes stored at low temperature. Postharvest Biol. Technol. 2013, 77, 50–58. [Google Scholar] [CrossRef] [Green Version]
  73. Lee, J.; Durst, R.W.; Wrolstad, R.E. Determination of total monomeric anthocyanin pigment content of fruit juices, beverages, natural colorants, and wines by the pH differential method: Collaborative study. J. AOAC Int. 2005, 88, 1269–1278. [Google Scholar] [CrossRef] [PubMed] [Green Version]
  74. Wrolstad, R.E.; Durst, R.W.; Lee, J. Tracking color and pigment changes in anthocyanin products. Trends Food Sci. Technol. 2005, 16, 423–428. [Google Scholar] [CrossRef]
  75. Singleton, V.; Rossi, J.A. Colorimetry of total phenolics with phosphomolybdic-phosphotungstic acid reagents. Am. J. Enol. Vitic. 1965, 16, 144–158. [Google Scholar]
Figure 1. Expression analysis of PAL, CHS, CHI, DFR, and LDOX during five stages of “Giovanna” (dark-blue) and “Grazia” (white) myrtle fruit development. Transcript levels of each gene were assessed by RT-qPCR and normalized using actin as a reference gene. The results were calculated relative to a calibrator sample (30 days after full blooming (DAF) from dark-blue samples) using the formula 2−ΔΔCt. Error bars represent standard error of three biological replicates. Every replication consisted of 40 berries. Different letters represent statistically significant differences with Tukey’s B-test (p < 0.05). Tukey’s B-test was carried out by comparing all means calculated at different DAFs for both cultivars.
Plants 10 00316 g001
Figure 2. Expression analysis of UFGT, FLS, LAR, and ANR during five stages of “Giovanna” (dark-blue) and “Grazia” (white) myrtle fruit development. Transcript levels of each gene were assessed by RT-qPCR and normalized using actin as reference gene. The results were calculated relative to a calibrator sample (30 DAF from dark-blue samples) using the formula 2−ΔΔCt. Error bars represent standard error of three biological replicates. Every replication consisted of 40 berries. Different letters represent statistically significant differences with Tukey’s B-test (p < 0.05). Tukey’s B-test was carried out by comparing all means calculated at different DAFs for both cultivars.
Plants 10 00316 g002
Figure 3. Total anthocyanin content at different development stages of “Giovanna” (dark-blue) and “Grazia” (white) fruit. Error bars represent the standard error of the mean of three biological replicates. Every replication consisted of 40 berries. Different letters represent statistically significant differences with Tukey’s B-test (p < 0.05). Tukey’s B-test was carried out by comparing all means calculated at different DAFs for both cultivars.
Plants 10 00316 g003
Figure 4. Total phenolic content at different development stages of “Giovanna” (dark-blue) and “Grazia” (white) fruit. Error bars represent the standard error of the mean of three biological replicates. Every replication consisted of 40 berries. Different letters represent statistically significant differences with Tukey’s B-test (p < 0.05). Tukey’s B-test was carried out by comparing all means calculated at different DAFs for both cultivars.
Plants 10 00316 g004
Figure 5. (A) “Giovanna” berry cultivar at 150 DAF; (B) “Giovanna” berry cultivar at 180 DAF; (C) “Grazia” berry cultivar at 150 DAF; (D) “Grazia” berry cultivar at 180 DAF. Scale bar equals 1 cm.
Plants 10 00316 g005
Table 1. Percentage of identity for partial sequences from myrtle with other species.
DescriptionIdentityAccession
PALPREDICTED: E. grandis phenylalanine ammonia-lyase 95.00%XM_010069013
PREDICTED: E. grandis phenylalanine ammonia-lyase 95.00%XM_010069014
PREDICTED: E. grandis phenylalanine ammonia-lyase 95.00%XM_010069015
PREDICTED: E. grandis phenylalanine ammonia-lyase 94.17%XM_010069016
PREDICTED: E. grandis phenylalanine ammonia-lyase 94.17%XM_010069017
V. vinifera phenylalanine ammonia-lyase 1 (PAL1)80.00%KU162973
PREDICTED: M. domestica phenylalanine ammonia-lyase 1-like 79.80%XM_008357397
A. thaliana phenylalanine ammonia-lyase 4 (PAL4)76.50%NM_111869
CHSPREDICTED: E. grandis chalcone synthase 3 97.00% XM_010030619
V. vinifera chalcone synthase 85.10%JF808008
A. thaliana chalcone synthase family protein82.80%DQ062406
M. domestica MdCHS chalcone synthase80.60%AB074485
CHIPREDICTED: E. grandis chalcone--flavonone isomerase 3 92.30%XM_010069312
PREDICTED: M. domestica chalcone--flavonone isomerase 3 77.30%XM_008371146
PREDICTED: V. vinifera chalcone--flavonone isomerase 3 76.60%XM_002280122
A. thaliana chalcone-flavanone isomerase family protein (CHIL)69.00%NM_120609
DFRPREDICTED: E. grandis dihydroflavonol-4-reductase 90.03%XM_010062668
V. vinifera dihydroflavonol 4-reductase74.60%AY780886
M. domestica dihydroflavonol 4-reductase71.00%AY227728
A. thaliana dihydroflavonol 4-reductase67.40%AK221622
FLSPREDICTED: E. grandis flavonol synthase/flavanone 3-hydroxylase 93.80%XM_010065055
V. vinifera FLS5 gene flavonol synthase70.90%AB213566
A. thaliana flavonol synthase gene60.30%U84258
M. domestica flavonol synthase55.81%AY965343
LARPREDICTED: E. grandis leucoanthocyanidin reductase 93.80%XM_010045996
M. domestica leucoanthocyanidin reductase 172.90%DQ139836
V. vinifera leucoanthocyanidin reductase 1 (LAR1) 69.80%MK726357
ANRPREDICTED: E. grandis anthocyanidin reductase93.10%XM_010054161
V. vinifera anthocyanidin reductase (ANR)78.10% NM_001280956
M. domestica anthocyanidin reductase (ANR2a)76.90%JN035300
A. thaliana NAD(P)-binding Rossmann-fold superfamily protein (BAN) 67.50%NM_104854
LDOXPREDICTED: E. grandis leucoanthocyanidin dioxygenase 94.70%XM_010055063
V. vinifera LDOX leucoanthocyanidin dioxygenase85.10%X75966
M. domestica leucoanthocyanidin dioxygenase-like 83.50%NM_001328948
A. thaliana leucoanthocyanidin dioxygenase (LDOX)78.20%NM_001036623
UFGTPREDICTED: E. grandis anthocyanidin 3-O-glucosyltransferase 2 91.90%XM_010064884
PREDICTED: E. grandis anthocyanidin 3-O-glucosyltransferase 2 91.90%XM_010064907
V. vinifera ItUFGT2 UDP-glucose:flavonoid 3-O-glucosyltransferase73.70%AB047093
A. thaliana UDP glucose:flavonoid 3-O-glucosyltransferase-like protein 70.60%AY072325
M. domestica UDP glucose:flavonoid 3-O-glucosyl transferase (UFGT1) 60.20%AF117267
Table 2. Pearson correlations between total anthocyanin content and gene expression levels in dark-blue fruit of “Giovanna” cultivar (significance: ** p < 0.01).
PALCHSCHIDFRLDOXUFGT
Total anthocyanin content0.854 **−0.2080.892 **0.688 **0.679 **0.93 **
Table 3. Sequence of primers used for RT-qPCR analysis.
GeneForward Primer
5′–3′
Reverse Primer
5′–3′
Length Sequence (bp)
ACTAGATGACCCAGATTATGTTTGAGACCTTCACCATCACCAGAATCCAACACAATACC122
PALCAACCCTGTGACCAACCATGTTCTCTTCCAGGTGCCTCAG174
CHSAGTCTTCTGCTCCACCTCTGGATCTCAGAGCAGACGACGA199
CHIGCCACAGATGATGCCTTCTTCTCTTCCTCCTCCTCCTCGT200
DFRCGCGAATTTGCTCAGGAAGAAGCCCTTTCTCTCTGCATGT183
FLSTACTGGTCCCGAACGATGTCAACACTGCCCATGACATTCG193
LDOXAGGTTGGAGAAGGAAGTCGGAGGATCTCAATGGTGTCCCC245
UFGTCCAGAAGAGGACATCGAGCTGCCGAGAGTCTGCCTGATAT237
LARTGACATCGGGAAGTTCACCATGATGATGACACGAGGGAGG155
ANRGCCAAAGCGAAGACAGTGAATTTCCTCCGCGAATTTCCAC200
Publisher’s Note: MDPI stays neutral with regard to jurisdictional claims in published maps and institutional affiliations.

