Article

Production of Potato (Solanum tuberosum L.) Seed Tuber under Artificial LED Light Irradiation in Plant Factory

1
Department of Bio-Health Convergence, Kangwon National University, Chuncheon 24341, Korea
2
Physiology and Sugar Chemistry Division, Bangladesh Sugar Crop Research Institute, Ishurdi, Pabna 6620, Bangladesh
3
Agricultural College of Yanbian University, Yanji 133002, China
*
Author to whom correspondence should be addressed.
These authors contribute equally.
Plants 2021, 10(2), 297; https://doi.org/10.3390/plants10020297
Submission received: 11 January 2021 / Revised: 29 January 2021 / Accepted: 29 January 2021 / Published: 4 February 2021

Abstract

:
Plant production in a plant factory is an innovative and smart idea to grow food anytime, anywhere, regardless of the outer environment. However, potato pre-basic seed tuber (PBST) production in a plant factory is a comparatively new initiative. Therefore, the aim of this study was to optimize the artificial LED light spectrum to produce PBST in a plant factory. Two potato varieties such as Golden king (V48) and Chungang (V41) were grown in soil substrate under different combination of artificial LED light combinations (such as red+blue+far-red, red+blue+white, blue+far-red, blue+white, red+far-red, and red+white) maintaining photosynthetic photon flux density (PPFD) of 100 mol m−2s−1, temperature 23/15 °C (day/night), and relative humidity 70%. The study revealed that, overall, potato plant growth (viz.; plant height, node number, leaf number, leaf length and width, fresh and dry weight) was enhanced by the red+far red light for both potato varieties. The total seed tuber number per plant was higher in red+blue+white light for V48, and red+far-red for V41. The fresh tuber weight was the highest in the red+blue+far-red light for V48 and red+blue+white for V41. The highest accumulated photosynthetic pigment (total Chlorophyll, Chlorophyll a, b and Carotenoid) was observed in red+blue+white light for both varieties. The total carbohydrate content and total sucrose content were higher in red+blue+far red and red +far red light treatment for V48 and V41, respectively. Finally, considering all factors, it is concluded that the red+blue+white light combination is deemed to be appropriate for the potato PBST production in plant factory conditions.

1. Introduction

The early generation of pre-basic seed potatoes or potato mini tubers is mostly produced in soilless and substrate culture from in vitro potato plantlets or micro tubers in aseptic culture conditions. Generally, potato seed tubers are produced at high densities in the greenhouse using different substrates and open fields. In the open field condition, potatoes’ growth and productivity depend on soil characteristics and topographic conditions [1]. Nowadays, there are multiple techniques which have been assayed to produce potato mini tubers such as hydroponic systems [2] including deep water culture systems [3], the NFT system, and the ebb and flow system [4].
Plant production in controlled environments/plant factories is a well-established agricultural production system for leafy vegetables, microgreens, fruits, and other crop species [5]. However, potato seed tubers/pre-basic seed tuber production in a plant factory is a comparatively new idea where seed tuber can be produced year-round ignoring the external environment. In a plant factory, the plant food production is transferred to a technically optimized building envelope allowing high productivity and assuring good food quality under regulated growing conditions without seasonal interruptions. To produce plants in a controlled environment, light is crucial because artificial light entirely determines the light condition where sunlight is completely restricted. Light regulates plant growth and development, and it directly influences plant photosynthesis resulting in increased carbohydrate and total biomass and ultimate production [6]
Plant entire developmental process is controlled by light quality, quantity, and photoperiod. Light also has a significant role in altering the nutrients and quality of germinating seed [7]. In greenhouse production, artificial supplemental light compensates the natural light, but in plant factories, the plant solely depends on artificial light. Moreover, it is possible to regulate the plant productivity and nutritional quality by manipulating the light environment in the closed plant factory [8]. Since the blue and red light profoundly affects plant production apart from nutritional quality, yield, and biomass production [9], many plant species are successfully grown either in the greenhouse or in plant factories using red and blue light [10,11]. It has previously been reported that considering the total light that plants receive from natural sunlight, 90% of the absorbed light is B and R light [12]. Blue and red light increased the nutritional and functional status of lettuce, spinach, radish [11], pepper plants [13], and cucumber [14]. It is reported that yield and quality of crops could be improved by managing the light quality and quantity through regulation at the phytochrome photostationary stage, changing the ratio of active phytochrome to total phytochrome [15], exciting the photoreceptors [16], and exciting the enzymatic activity [17].
The appropriate dose of artificial light is plant species dependent. Hogewoning et al. [16] revealed that the photosynthetic capacity of C. sativus leaf is twice higher grown at 7% blue compared with 0% blue with a red light at 100 μmol m−2 s−1 intensity. Matsuda et al. [17] reported that 30 μmol m−2 s−1 blue light comparing 150 μmolm−2 s−1 blue light increased the photosynthesis rate in spinach at a total light intensity of 300 μmolm−2 s−1. Research has shown that red and blue light is the most dominant light band that drives photosynthesis and stimulates plant signaling, respectively, and accelerates the accumulation of secondary metabolites. It has also been confirmed that red and blue light enhances stomatal conductance activity more than other spectral regions [18] where blue light is more effective than red light to open stomata [19].
On a larger scale, plant factories typically produce more plants per unit area than conventional field cultivation; however, energy consumption is higher in the former. Therefore, customized proprieties for plant production is a strong strategy to improve resource use efficiency [20]. Moreover, many research strategies are being developed to grow plant foods in extreme environments, such as in the arctic and even space farming [21]. Given these backgrounds, the design and development of species-specific factors are crucial in establishing food–energy nexus sustainability. Artificial LED provides a means to control the light intensity according to a precise spectrum with lower energy demand.
Artificial LED lighting can regulate the light quality and quantity, thus enabling the required lighting for a particular crop according to its developmental stage [22]. It is hypothesized that an optimal combination of blue, red, far-red, white light under low light irradiation will improve plant production while reducing energy expenses. Therefore, the objective of this study was to determine the optimal B/R/FR/W light ratios under a low light regime by assessing the pre- basic seed tuber yield of two potato varieties gown in plant factory for year-round production.

2. Materials and Methods

2.1. Plantlet Production and Growth Conditions

Solanum tuberosum L. var. Golden king (V48) and Chungang (V41) were selected for the experiments and were obtained from Professor Young-Seok Lim, breeder and owner of these varieties at Kangwon National University. The potato plantlets were grown in in-vitro conditions under artificial white LED light having photosynthetic photon flux density (PPFD) of 100 µmol m−2 s−1. The photoperiod, relative humidity (RH), and in vitro growth room temperature were 16/8 (day/night), 70%, and 25 °C, respectively.
Thirty-days-old virus-free tested (ISK 20001/0025, Agdia, Inc., Elkhart, IN, USA) (Figure 1) plantlets were transplanted in commercial substrate soil (Biosangtho. Co., Suncheon, Korea) in a 16-cells seed tray. The newly transplanted plantlets were placed in a greenhouse for three days under shade for acclimatization. After three days, the acclimatized plants were moved to the plant factory equipped with artificial LED light.

2.2. Plant Factory and Light-Emitting Diode (LED) Settings

All LED devices used in this study were purchased from ESLEDs Co. Ltd., Seoul, Korea. The artificial red (R, 660 nm), blue (B, 450 nm), far-red (FR, 730 nm), and white (W) LED light were combined to make light treatment according to Table 1. The light intensity was calculated at the plant canopy level, 30 cm from the light panel.
The parameter of the plant factory was as follows: photoperiod 16/8 and 8/16 h (light/dark) at the vegetative growth and at the tuber bulking period, respectively, temperature 25/15 °C (day/night), RH 70%. The day and night temperatures were maintained by the automatic air conditioner. During the study, the potato plants were irrigated with nutrient solution (Table 2) twice a week.

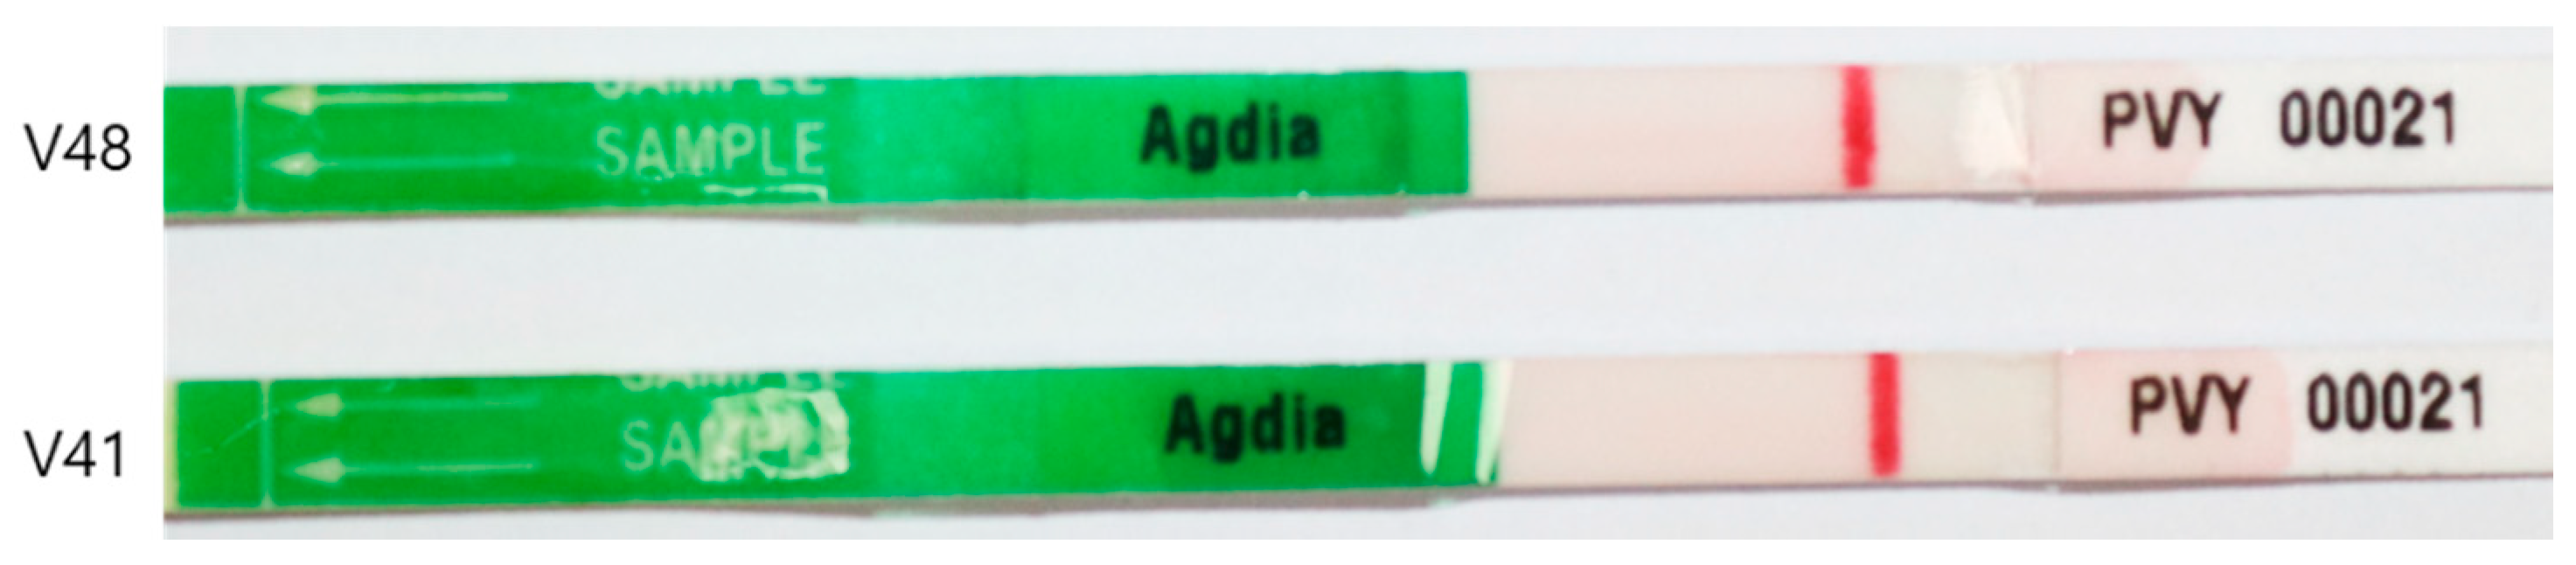
2.3. Measurement of Plant Growth Characteristics and Seed Tuber Yield

The potato plant growth characteristics were measured after 40 days of potato growth under artificial LED light in the plant factory. The growth characteristics, such as plant height, leaf number, node number, leaf length and width, fresh weight, and dry weight were measured. The potato pre-basic seed tuber (PBST) was harvested and counted after 90 days of growth when the potato plant was fully matured. The PBST yield was estimated considering the yield of 6 plants/treatment.

2.4. Analysis of Photosynthetic Pigment of Potato Plants

The photosynthetic pigments including, chlorophyll a (Chl a), chlorophyll b (Chl b), Total chlorophyll (Chl), and carotenoid of the potato plants were analysed after 40 days of onset of LED light treatment as this time was the peak vegetative stage. The six-plant samples from each treatment were collected for the photosynthetic pigment analysis. The harvested leaves were immediately plunged in liquid nitrogen and then stored at −80 °C for further analysis.
For the determination of photosynthetic pigments, the fresh (3 g) leaves were macerated (10 mL of 80% acetone) using mortar and pestle and placed at room temperature for 15 min. The collected extract was transferred into a tube and centrifuged at 5000 rpm for 10 min. The absorbance was taken at 647, 663, and 470 nm, respectively using a spectrophotometer (UV-1800 240 V, Shimadzu Corporation, Kyoto, Japan). The photosynthetic pigments were determined according to the following formula [23] and expressed as mg/g fresh weight (FW).
Chlorophyll a = 12.25 × A663 − 2.79 × A647
Chlorophyll b = 21.50 × A647 − 5.10 × A663
Total Chlorophyll = 7.15 × A663 + 18.71 × A647
Car = 1000   ×   A 470 1.82   ×   Chl   a 85.02   ×   Chl   b   198

2.5. Determination of Total Soluble Carbohydrate (TSC) and Total Soluble Sugar (TSS) Content

The extraction and analysis of TSC and TSS content were determined following the method described by Islam et al. [24]. Briefly, the harvested fresh leave samples (250 mg) were homogenised in 5 mL of ethanol (95%) followed by centrifuging at 5000 rpm for 10 min. After collecting the supernatant, the procedure was repeated with 70% ethanol. Both the supernatants were mixed and kept in a refrigerator (4 °C) for analysis. For analysing the TSC, 0.1 mL of the aliquot was mixed with 1 mL anthrone (200 mg anthrone mixed with 100 mL of 72% sulfuric acid). The mixture was heated at 100 °C for 10 min and then cooled. Total soluble carbohydrate was estimated by using a standard curve of glucose, the detection wavelength was 625 nm, and the results were expressed as mg/g fresh weight. In TSS content, 0.2 mL of the supernatant was mixed with 0.1 mL of KOH (30%) and heated at 100 °C for 10 min. After cooling at room temperature, 3 mL of anthrone (150 mg anthrone mixed with 100 mL 70% sulfuric acid) was added. Ten minutes later, the samples were cooled, and absorbance was read at 620 nm. The TSS concentration was calculated using the standard curve of glucose, and the results were expressed as mg/g fresh weight.

2.6. Statistical Analysis

All results were expressed as mean ± SD (standard deviation), and the one-way analysis of variance was performed using Statistix 10 (Tallahassee, FL, USA). Different letters indicate the statistically significant differences between treatments at p < 0.05, according to the least significant differences (LSD). The principal component analysis (PCA) was carried out using the OriginLab 10.0 software (OriginLab, Northampton, MA, USA).

3. Results

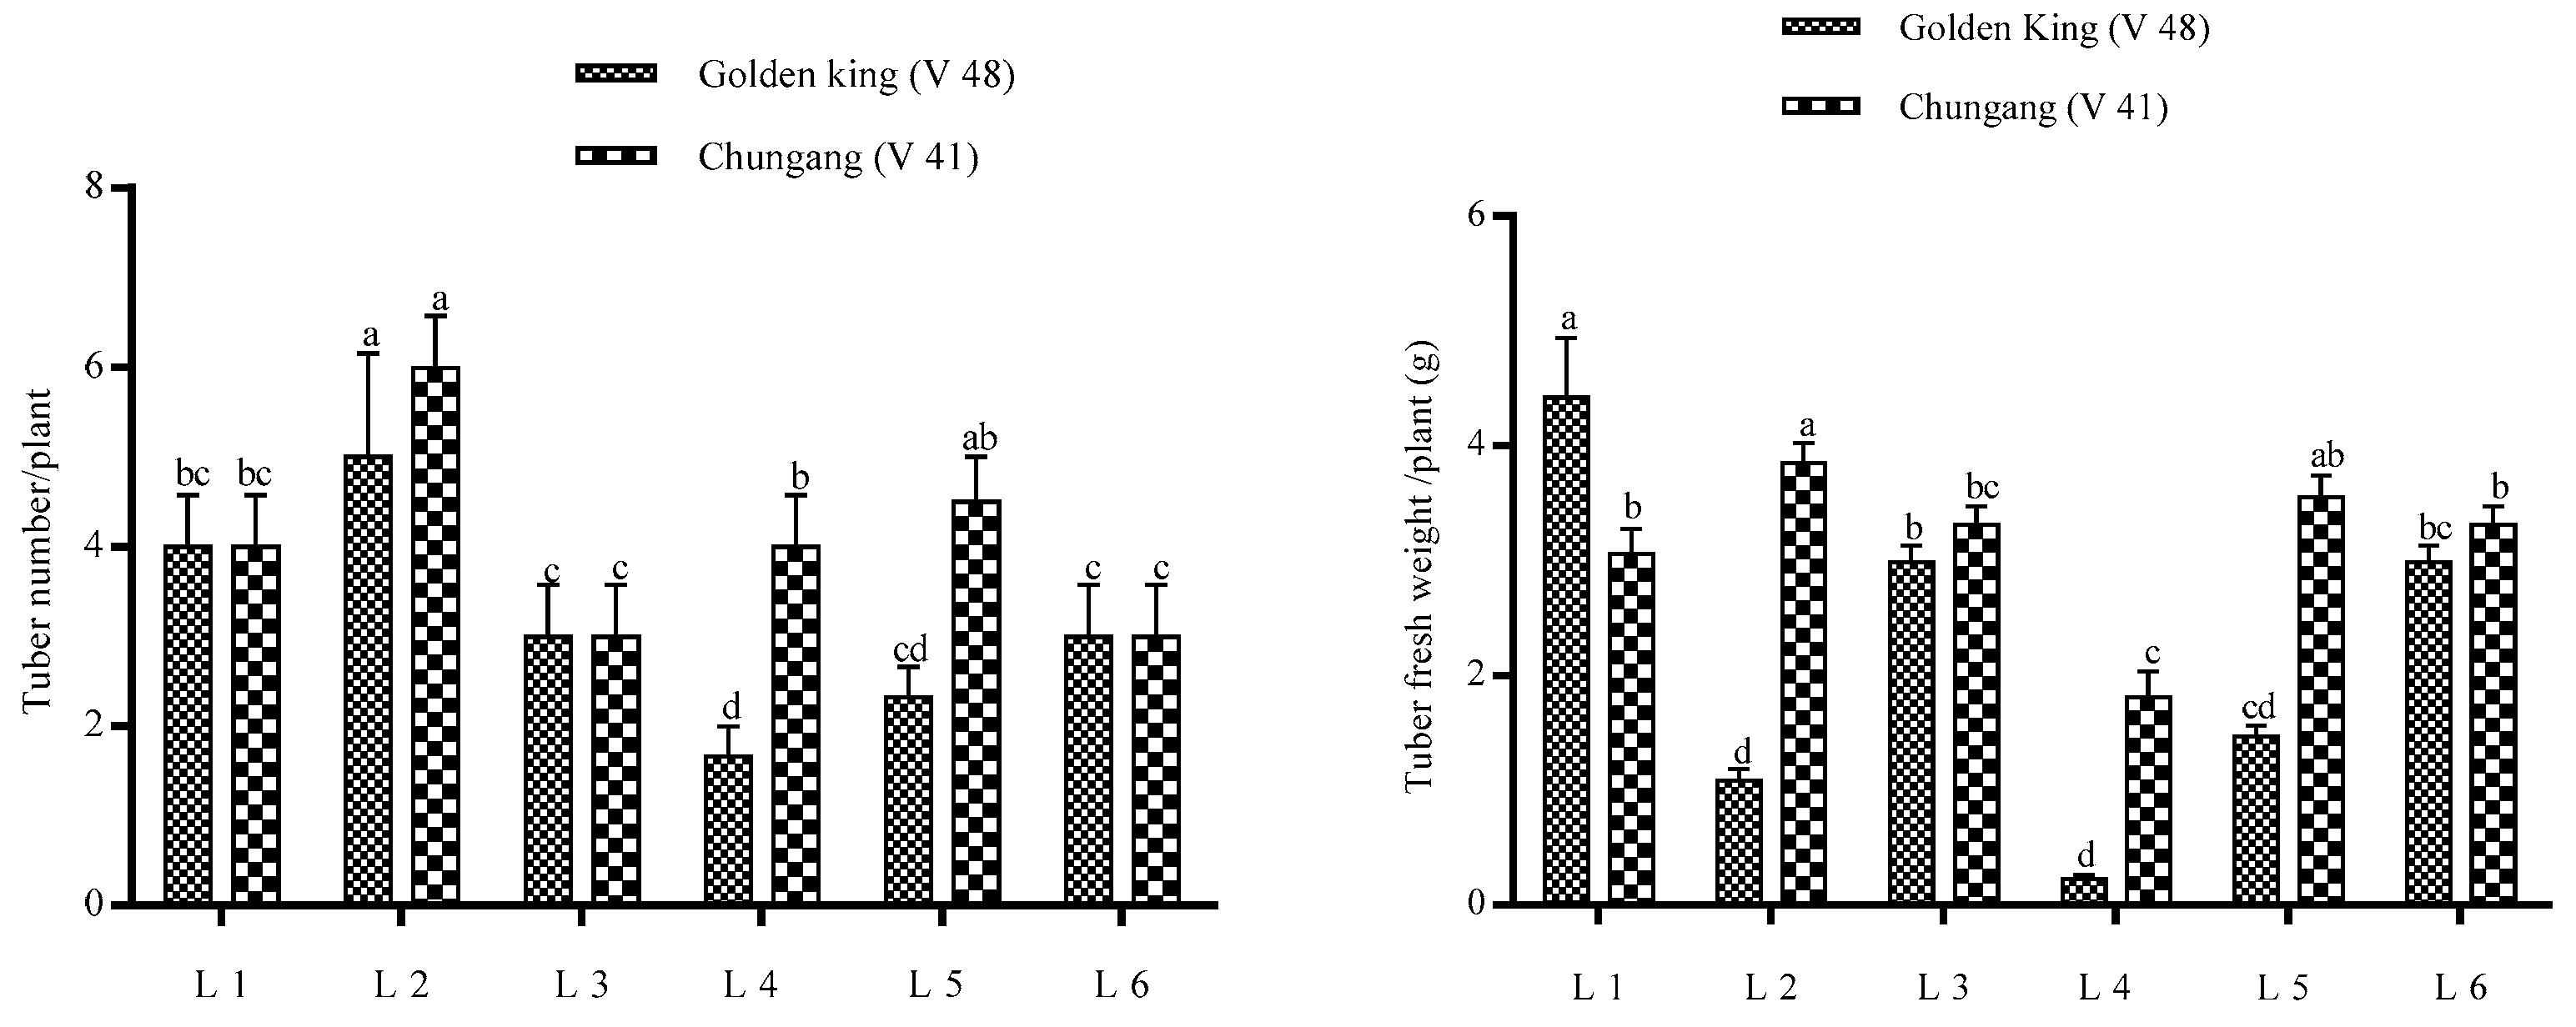
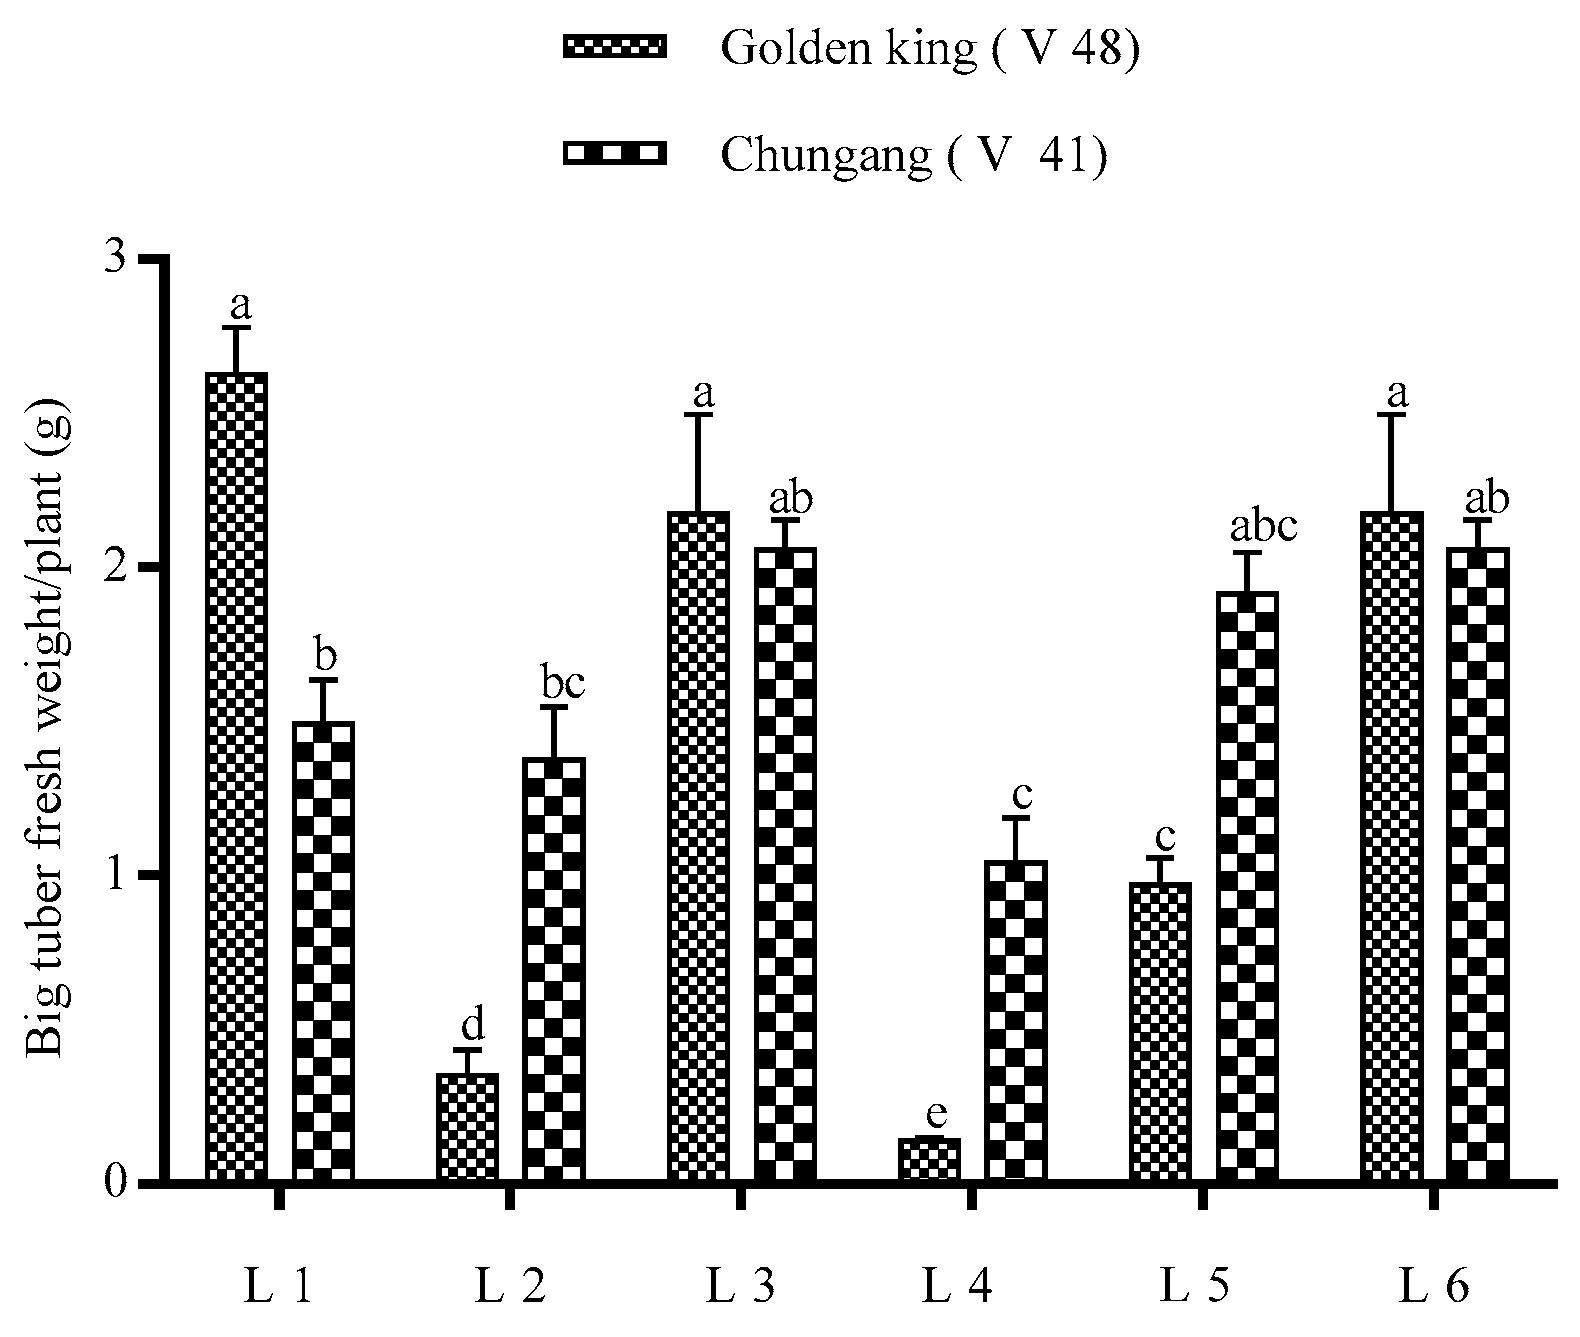
3.1. Potato Plant Growth Characteristics and Seed Tuber Yield

Table 3 indicated the growth characteristics of the potato plants grown under the different LED light spectrum. The study shows that L5 treatment has an overall positive effect on the growth characteristics for both cultivars among the artificial light combination. The plant height, plant fresh, and dry weight was significantly higher in the L5 treatment for both cultivars (Figure 2). The node number was the same within the light combination except L2/L6. The total leaf number was higher in L5 for V48 and in L2 for V41. The leaf length increased in L1/L3/L5 for V48 and L3/L5 for V1.
The total tuber per plant and tuber fresh weight were demonstrated in Figure 3. It is shown that tuber number per plant was higher in L2 for both cultivars; however, total tuber fresh weight was higher in L1 for V48 and L2 for V41. The comparative bigger tuber’s fresh weight was significantly higher in light treatment L1 in the golden king (V 48), where tuber weight > 1 g was minimal in L4 in both varieties (Figure 4 and Figure 5). On the other hand, L2 and L4 produced very small tubers in size while no tubers were found >1 g.

3.2. Analysis of Plant Photosynthetic Pigments and Carbohydrate Content of Potato Plants

The photosynthetic pigments such as total Chlorophyll, Chl a, b, and Carotenoid content of potato plants are shown in Table 4. It is observed that treatment L2 significantly influences the total Chlorophyll, Chl a, b, and total carotenoid content for V48. On the other hand, for V41, total Chlorophyll, Chl a, b and Carotenoid were increased in L1.
The total carbohydrate content and total sucrose content, as depicted in Figure 6, was significantly higher in the L1 treatment for V48. However, total carbohydrate and sucrose content was higher in L5 for the V41 cultivar.

4. Discussion

4.1. Potato Plant Growth Characteristics and Seed Tuber Production

This study demonstrated that the different combination of the artificial LED light spectrum has a significant impact on the growth and seed tuber formation of the potato plants. A common trend observed that the L5 (Red+Far-red) light combination profoundly influences the speedy growth of potato plants (Figure 2). Many studies were published on the optimum dose of the red, blue, and far-red light spectrum for plant growth and development. It is reported that the optimum ratio of red and blue LED light is to be specified and varied to plant species. For instance, the suitable combination of red and blue LED light was 50R/50B for cotton [25], 80R/20B for Phalaenopsis and banana [26,27], and 1B/5R for lettuce [20]. It was reported that 65% red + 35% blue light enhanced growth, stem diameter fresh and dry weight of in vitro potato plantlets [28]. The report has demonstrated that potato plantlets that were grown under monochromatic red light were weak and slim with small leaves [29], however, in the current study, potato plants had elongated stems with high biomass when grown under the red +far-red light spectrum.
In our study, the potato plant’s growth was higher at L5 light because of the red and far-red light ratio. Research proved that photosynthetic pigments absorb and convert light energy into chemical energy via complex photosynthetic machinery. Blue and red light play an active role in photosynthesis and stimulate the biosynthesis of carotenoids and chlorophyll [30]. It was also reported that red and far-red light regulates the photosensors that promote the stem elongation while an opposite effect was observed from the blue light [31,32]. These findings are quite similar to our results.
Moreover, it is also proved that blue light activates the stomata and broadens the leaf. It has long been known that blue and red lights induce stomatal opening [33]; however, blue light is more efficient than red [34]. The study has demonstrated that the Red HL and blue regimens induced stomatal opening, while the stomata were more closed under the Red Far-red and white regimens. It seems that neither the red/far-red, nor the blue/red ratio correlated to stomatal movements rather than the low blue/far-red ratio [32]. In our study, L5 treatment plays a crucial role in broadening potato leaves compared to treatment containing blue light. This finding indicated that the light spectrum requirement is plant species related, which supports the previous studies. However, the two potato cultivars (V48, V41) showed a similar pattern of response to the different light spectrum with few exceptions.
The highest tuber number was obtained in L2 treatment for both varieties; however, total tuber fresh weight was higher in L1 for the V48 variety. It may be due to the smaller tuber size, which increases the number but has less weight. However, total fresh weight was higher in L1 for V48 and L2 for V41. The total tuber fresh weight was decreased in L2, owing to the smaller tuber for V48.
The plant growth was promoted in L5 treatment for both cultivars; however, tuber formation was enhanced in L2 (red+blue+white) treatment. This phenomenon indicated that light requirement for growth and potato tuber formation is independent when grown under artificial LED light in plant factory. There is no evidence of how tuberization is caused by light from various wavelengths [35]. However, the tuber formation of potatoes is directed by the hormonal signal, especially gibberellins (GA) and cytokinin (CK). It is stated that a CK activating enzyme induces de novo homeotic tubers in the potato, which is the phytochromes mediated leaf driving signaling on tuberization [36]. A previous study showed that red light inhibited mini tuber initiation, which is inconsistent with the current research [37]. The effect of regulation on the light spectrum on plant growth can be partly attributed to the regulation of the phytohormone levels in plants [38]. Endogenous hormones in potatoes are affected by light quality [39]. It has been also reported that gibberellic acid (GA3) and abscisic acid (ABA) are closely related to tuber formation and that GA3 inhibits tuber formation whereas ABA promotes it [40,41]. GA3 concentrations decrease in leaves of grape grown under red light [42], and ABA concentrations induced by red light increased in the hypocotyl of cucumber [43]. In the present study, red light facilitated tuber formation, which might be correlated with decreased levels of GA3 and increased ABA concentrations in plants.
It is assumed that this light treatment successfully activated the CK and GA, which induced more tuber. The red light spectrum initiates more biosynthesis of endogenous gibberellin (GA). However, the red:blue (30:70) spectrum generated a static GA level of the plant; consequently, the plant acquired growth signals like stem elongation and stem diameter. As indicated earlier, the combined spectrum of the red and blue light was represented to be further patronizing for stem length compares to white light [44,45,46]. Generally, elongation of the stem depends on cellular proliferation and cell elongation. There was also a significant effect of far-red and, red light on cell numbers and cell length on aspen [47]. It is also reported that the red+blue light spectrum increases the tuber number per potato plant. [28] Overall, the consequence of this study demonstrated that the combined spectrum of red, blue, and white had a significant effect on stem elongation, which ultimately turned into the tuber. Another hormone named indole acetic acid (IAA) is believed to enhance the sink capacity of plant organs [48]. It is reported that red light increases the IAA concentration in potatoes thus, promoting the flow of assimilates into the tubers. The rate of assimilates is also an essential factor for tuber size or weight [49,50]. Enhanced assimilate rates are efficiently partitioned into underground tubers in plant growing under the combined LED blue and red spectrum. This may be the explanation for why most large micro-tubers were found in the combined spectrum of red and blue [49,51].

4.2. Analysis of Photosynthetic Pigments and Carbohydrate Content

The photosynthesis pigments such as total chlorophyll, chl a and b, and total carotenoid were significantly increased in L2 treatment (red+blue+white). It is well established that plant pigments receive a particular light spectrum through their light-harvesting antenna, i.e., chlorophyll and carotenoid pigment absorb at wavelengths 400–500 nm and 630–680 nm of the light spectrum [9,52]. Blue light is profusely absorbed by the photosynthetic antenna of plant pigment, which works as a catalytic agent to accumulate the pigment including chlorophyll and carotenoid content in plant leaves [53,54].
It was noted that the red spectrum, combined with the blue spectrum, significantly increases the photosynthetic pigment, including carotenoid compared to other spectrum combinations [49]. A severe malformation of the chloroplast of invitro potato plantlets was found when grown under a monochromatic red light only; however, the red and blue light combination provided more uniform chloroplast in the leaf with increased leaf thickness [28].
Our current study demonstrated that L2 light enhanced the total chlorophyll, chl a, b, and carotenoid content. This finding is consistent with the previous reports of Li et al. [55] and Son et al. [56]. The enhanced chlorophyll and carotenoid content of potato in L2 treatment are due to the stimulation, induction, and synthesis of the principal gene (PAL gene activity) in chlorophyll and carotenoid by red and blue light spectrum [57,58].
The total carbohydrate and sucrose content were significantly increased in L1 treatment Figure 6). Carbohydrates are the final product of photosynthesis and an essential parameter for the plant [9]. Previously, it was reported that red light is the most effective light source for accumulating soluble carbohydrates [55]. The total carbohydrate and sucrose content for both potato cultivars are responded to differently. The treatment L5 induced primary metabolites in potato for V41 however, L1 for V48. It may be due to the genetic variation of the plant, which determines the Calvin cycle and photorespiration and photoprotective mechanisms to effectively utilize light, thus leading to the accumulation pattern of metabolites [59]. Red and blue light has promoted photosynthetic product accumulated in the plants, however, combined blue and red light increase these compounds in the plants, which partially supports our study [60].
Irradiation of blue light significantly increases the soluble-carbohydrate content including, glucose, fructose, sucrose in Chinese bayberry, a similar phenomenon also executed in the strawberry fruit [61]. Previous findings demonstrated that sucrose synthesis is associated with the aggravating activity of Sucrose-phosphate synthase (SPS) gene expression [61], which, combined with red+blue+far-red, have a significant role in increasing soluble carbohydrate and soluble sugar. The higher TSC and TSS content in L1 (Red: Blue: Far-red) treatments also comply with this finding.

4.3. PCA Analysis Unveiled the Connections between Variables and Treatments

The PCA analysis was carried out to discover the relationship between different parameters and treatments (Figure 7). The PCA (PC1 and PC2) elements described 76.33% and 68.52% of data variability in V48 and V41. The results demonstrated that most of the plants’ morphological characteristics are associated with the treatment L5 in both genotypes. A higher tuber number is associated with L2 in both the genotypes; moreover, L1 also showed a significant tuber number in both varieties and Chungang variety in L5 respectively. However, with minimal yield performance, tuber number and tuber fresh weight was recorded in L4 in the specific variety Golden king (V48).
However, the L1 and L2 have a parallel relationship with bigger and smaller tuber sizes, respectively. The results also demonstrated that the TSC and TSS of potato plants have a close relationship with the production of tuber size.
In PCA, the lines starting from the central point of the biplots present negative or positive associations of different variables, and their proximity specifies the degree of correlation with a specific treatment (Figure 7). L1, R:B:FR; L2, R:B:W; L3, B:FR; L4, B:W; L5, R:FR; L6, R:W. Plant H., Plant Height; Plant FW., Plant Fresh Weight; Plant DW., Plant Dry Weight; leaf N., Leaf Number; Node N., Node Number; Leaf N., Leaf Number; Leaf L., Leaf Length; Leaf W., Leaf width; Chl a, Chlorophyll a; Chl b, Chlorophyll b; TCL, Total Chlorophyll; TSC, Total Soluble Carbohydrate; TSS, Total Soluble Sugar; Tuber N., Tuber Number; TTFW, Total Tuber Fresh Weight; Biggest TW., Biggest tuber weight; Bigger TN > 1 g, Bigger tuber weight more than 1 g; smaller TN < 1 g, smaller tuber number less than 1 g.

5. Conclusions

The current study obtained that potato plant growth and tuber formation are an independent phenomenon, and their response to the artificial light is unique when grown in a plant factory. Red and far-red light spectrum boosted up the growth characteristics; however, red+blue+far-red/white light combination influenced the tuber formation and accumulation of primary metabolites. These results are the preliminary findings to produce seed tuber in a plant factory under artificial light, which provides a fundamental ground to design further artificial LED lighting environment to grow potato PBST in a plant factory.

Author Contributions

M.H.R. and M.O.K.A. conducted the study, analyzed the result, and drafted the manuscript, M.S.R., M.J.I. analyzed the sample, K.-h.L. revised the manuscript and Y.-S.L. supervised the study. All authors have read and agreed to the published version of the manuscript.

Funding

This research did not receive any specific grant.

Institutional Review Board Statement

Not applicable.

Informed Consent Statement

Not applicable.

Data Availability Statement

Not applicable.

Acknowledgments

This research was supported by the BK21 FOUR funded by the Ministry of Education (MOE, Korea) and National Research Foundation of Korea (NRF).

Conflicts of Interest

The authors declare no conflict of interest.

References

  1. Islam, J.; Choi, S.P.; Azad, O.K.; Kim, J.W.; Lim, Y.-S. Evaluation of tuber yield and marketable quality of newly developed thirty-two potato varieties grown in three different ecological zones in South Korea. Agriculture 2020, 10, 327. [Google Scholar] [CrossRef]
  2. Navarrete Ortega, J.I. Evaluación de dos Métodos de Micropropagacion Para la Producción de Semilla Categoría pre Básica de dos Variedades de papa (Solanum Tuberosum) Bajo Condiciones de Invernadero. Bachelor’s Thesis, Central University of Ecuador, Faculty of Agricultural Sciences, School of Agronomic Engineering, Quito, Ecuador, 2004. [Google Scholar]
  3. Lommen, W.J.M. The canon of potato science: 27. Hydroponics. Potato Res. 2007, 50, 315. [Google Scholar] [CrossRef] [Green Version]
  4. Wheeler, R.M. Potato and human exploration of space: Some observations from NASA-sponsored controlled environment studies. Potato Res. 2006, 49, 67–90. [Google Scholar] [CrossRef]
  5. Kozai, T.; Niu, G.; Takagaki, M. Plant Factory, 2nd ed.; Elsevier Science: Amsterdam, The Netherlands, 2016. [Google Scholar]
  6. Mills, H.A.; Jones, J.B., Jr. Plant Analysis Handbook II: A Practical Sampling, Preparation, Analysis, and Interpretation Guide; Micro-Macro Publishing: Athens, Greece, 1996; ISBN 1878148052. [Google Scholar]
  7. Islam, M.J.; Hassan, M.K.; Sarker, S.R.; Rahman, A.B.; Fakir, M.S.A. Light and temperature effects on sprout yield and its proximate composition and vitamin C content in lignosus and mung beans. J. Bangladesh Agric. Univ. 2017, 15, 248–254. [Google Scholar] [CrossRef] [Green Version]
  8. Wenke, L. Light environmental management for artificial protected horticulture. Agrotechnology 2012, 1, 101. [Google Scholar]
  9. Lin, K.-H.; Huang, M.-Y.; Huang, W.-D.; Hsu, M.-H.; Yang, Z.-W.; Yang, C.-M. The effects of red, blue, and white light-emitting diodes on the growth, development, and edible quality of hydroponically grown lettuce (Lactuca sativa L. var. capitata). Sci. Hortic. (Amsterdam). 2013, 150, 86–91. [Google Scholar] [CrossRef]
  10. Shimizu, H.; Saito, Y.; Nakashima, H.; Miyasaka, J.; Ohdoi, K. Light environment optimization for lettuce growth in plant factory. IFAC Proc. Vol. 2011, 44, 605–609. [Google Scholar] [CrossRef] [Green Version]
  11. Yorio, N.C.; Goins, G.D.; Kagie, H.R.; Wheeler, R.M.; Sager, J.C. Improving spinach, radish, and lettuce growth under red light-emitting diodes (LEDs) with blue light supplementation. HortScience 2001, 36, 380–383. [Google Scholar] [CrossRef] [PubMed] [Green Version]
  12. Terashima, I.; Fujita, T.; Inoue, T.; Chow, W.S.; Oguchi, R. Green light drives leaf photosynthesis more efficiently than red light in strong white light: Revisiting the enigmatic question of why leaves are green. Plant Cell Physiol. 2009, 50, 684–697. [Google Scholar] [CrossRef] [PubMed] [Green Version]
  13. Brown, C.S.; Schuerger, A.C.; Sager, J.C. Growth and photomorphogenesis of pepper plants under red light-emitting diodes with supplemental blue or far-red lighting. J. Am. Soc. Hortic. Sci. 1995, 120, 808–813. [Google Scholar] [CrossRef] [PubMed] [Green Version]
  14. Schuerger, A.C.; Brown, C.S. Spectral quality may be used to alter plant disease development in CELSS. Adv. Sp. Res. 1994, 14, 395–398. [Google Scholar] [CrossRef]
  15. Hanyu, H.; Shoji, K. Acceleration of growth in spinach by short-term exposure to red and blue light at the beginning and at the end of the daily dark period. In Proceedings of the IV International ISHS Symposium on Artificial Lighting, Quebec City, QC, Canada, 7–9 November 2000; pp. 145–150. [Google Scholar]
  16. Smith, H. Light quality, photoperception, and plant strategy. Annu. Rev. Plant Physiol. 1982, 33, 481–518. [Google Scholar] [CrossRef]
  17. Kopsell, D.A.; Lefsrud, M.G.; Kopsell, D.E.; Curran-Celentano, J. Irradiance Levels Affect Growth Parameters and CarotenoidPigments in Kale and Spinach Grown in a Controlled Environment. Physiol. Plantarum 2006, 127, 624–631. [Google Scholar]
  18. Heo, J.; Lee, C.; Chakrabarty, D.; Paek, K. Growth responses of marigold and salvia bedding plants as affected by monochromic or mixture radiation provided by a light-emitting diode (LED). Plant Growth Regul. 2002, 38, 225–230. [Google Scholar] [CrossRef]
  19. Kim, S.-J.; Hahn, E.-J.; Heo, J.-W.; Paek, K.-Y. Effects of LEDs on net photosynthetic rate, growth and leaf stomata of chrysanthemum plantlets in vitro. Sci. Hortic. (Amsterdam). 2004, 101, 143–151. [Google Scholar] [CrossRef]
  20. Azad, M.O.K.; Kjaer, K.H.; Adnan, M.; Naznin, M.T.; Lim, J.D.; Sung, I.J.; Park, C.H.; Lim, Y.S. The Evaluation of Growth Performance, Photosynthetic Capacity, and Primary and Secondary Metabolite Content of Leaf Lettuce Grown under Limited Irradiation of Blue and Red LED Light in an Urban Plant Factory. Agriculture 2020, 10, 28. [Google Scholar] [CrossRef] [Green Version]
  21. Yeh, N.; Chung, J.-P. High-brightness LEDs—Energy efficient lighting sources and their potential in indoor plant cultivation. Renew. Sustain. Energy Rev. 2009, 13, 2175–2180. [Google Scholar] [CrossRef]
  22. Han, T.; Vaganov, V.; Cao, S.; Li, Q.; Ling, L.; Cheng, X.; Peng, L.; Zhang, C.; Yakovlev, A.N.; Zhong, Y. Improving “color rendering” of LED lighting for the growth of lettuce. Sci. Rep. 2017, 7, 45944. [Google Scholar] [CrossRef]
  23. Lichtenthaler, H.K. [34] Chlorophylls and carotenoids: Pigments of photosynthetic biomembranes. Methods Enzymol. 1987, 148, 350–382. [Google Scholar]
  24. Islam, M.J.; Kim, J.W.; Begum, M.K.; Sohel, M.A.T.; Lim, Y.-S. Physiological and Biochemical Changes in Sugar Beet Seedlings to Confer Stress Adaptability under Drought Condition. Plants 2020, 9, 1511. [Google Scholar] [CrossRef]
  25. Li, H.; Xu, Z.; Tang, C. Effect of light-emitting diodes on growth and morphogenesis of upland cotton (Gossypium hirsutum L.) plantlets in vitro. Plant Cell Tissue Organ Cult. 2010, 103, 155–163. [Google Scholar] [CrossRef]
  26. Nhut, D.T.; Don, N.T.; Tanaka, M. Light-emitting diodes as an effective lighting source for in vitro banana culture. In Protocols for Micropropagation of Woody Trees and Fruits; Springer: Berlin/Heidelberg, Germany, 2007; pp. 527–541. [Google Scholar]
  27. Wongnok, A.; Piluek, C.; Techasilpitak, T.; Tantivivat, S. Effects of light emitting diodes on micropropagation of Phalaenopsis orchids. In Proceedings of the International Workshop on Ornamental Plants 788, Chiang Mai, Thailand, 8–11 January 2007; pp. 149–156. [Google Scholar]
  28. Chen, L.; Zhang, K.; Gong, X.; Wang, H.; Gao, Y.; Wang, X.; Zeng, Z.; Hu, Y. Effects of different LEDs light spectrum on the growth, leaf anatomy, and chloroplast ultrastructure of potato plantlets in vitro and minituber production after transplanting in the greenhouse. J. Integr. Agric. 2020, 19, 108–119. [Google Scholar] [CrossRef]
  29. Aksenova, N.P.; Konstantinova, T.N.; Sergeeva, L.I.; Macháčková, I.; Golyanovskaya, S.A. Morphogenesis of potato plants in vitro. I. Effect of light quality and hormones. J. Plant Growth Regul. 1994, 13, 143. [Google Scholar] [CrossRef]
  30. Fan, X.; Zang, J.; Xu, Z.; Guo, S.; Jiao, X.; Liu, X.; Gao, Y. Effects of different light quality on growth, chlorophyll concentration and chlorophyll biosynthesis precursors of non-heading Chinese cabbage (Brassica campestris L.). Acta Physiol. Plant. 2013, 35, 2721–2726. [Google Scholar] [CrossRef]
  31. Folta, K.M.; Childers, K.S. Light as a growth regulator: Controlling plant biology with narrow-bandwidth solid-state lighting systems. HortScience 2008, 43, 1957–1964. [Google Scholar] [CrossRef] [Green Version]
  32. Monostori, I.; Heilmann, M.; Kocsy, G.; Rakszegi, M.; Ahres, M.; Altenbach, S.B.; Szalai, G.; Pál, M.; Toldi, D.; Simon-Sarkadi, L. LED lighting–modification of growth, metabolism, yield and flour composition in wheat by spectral quality and intensity. Front. Plant Sci. 2018, 9, 605. [Google Scholar] [CrossRef]
  33. Assmann, S.M. Signal transduction in guard cells. Annu. Rev. Cell Biol. 1993, 9, 345–375. [Google Scholar] [CrossRef]
  34. Kim, H.-H.; Goins, G.D.; Wheeler, R.M.; Sager, J.C. Stomatal conductance of lettuce grown under or exposed to different light qualities. Ann. Bot. 2004, 94, 691–697. [Google Scholar] [CrossRef] [Green Version]
  35. Seabrook, J.E.A. Light effects on the growth and morphogenesis of potato (Solanum tuberosum) in vitro: A review. Am. J. Potato Res. 2005, 82, 353–367. [Google Scholar] [CrossRef]
  36. Eviatar-Ribak, T.; Shalit-Kaneh, A.; Chappell-Maor, L.; Amsellem, Z.; Eshed, Y.; Lifschitz, E. A cytokinin-activating enzyme promotes tuber formation in tomato. Curr. Biol. 2013, 23, 1057–1064. [Google Scholar] [CrossRef] [PubMed] [Green Version]
  37. Aksenova, N.P.; Konstantinova, T.N.; Chailakhian, M.K. Morphogenetic effect of blue and red-light under illumination of the overground and underground potato plant organs invitro. Dokl. Akad. Nauk SSSR 1989, 305, 508–512. [Google Scholar]
  38. Kaufman, L.S. Transduction of blue-light signals. Plant Physiol. 1993, 102, 333. [Google Scholar] [CrossRef] [PubMed]
  39. Fixen, K.R.; Thomas, S.C.; Tong, C.B.S. Blue light inhibition of tuberization in a day-neutral potato. J. Plant Growth Regul. 2012, 31, 342–350. [Google Scholar] [CrossRef]
  40. Lovell, P.H.; Booth, A. Effects of gibberellic acid on growth, tuber formation and carbohydrate distribution in Solanum tuberosum. New Phytol. 1967, 66, 525–537. [Google Scholar] [CrossRef]
  41. Roumeliotis, E.; Visser, R.G.F.; Bachem, C.W.B. A crosstalk of auxin and GA during tuber development. Plant Signal. Behav. 2012, 7, 1360–1363. [Google Scholar] [CrossRef] [PubMed] [Green Version]
  42. Wang, H.B.; Wang, S.; Wang, X.D.; Shi, X.B.; Wang, B.L.; Zheng, X.C.; Wang, Z.Q.; Liu, F.Z. Effects of light quality on leaf senescence and endogenous hormones content in grapevine under protected cultivation. Ying Yong Sheng Tai Xue Bao = J. Appl. Ecol. 2017, 28, 3535. [Google Scholar]
  43. Su, N.; Wu, Q.; Cui, J. Effects of monochromatic LED light quality on endogenous hormone content in leaves and hypocotyl of Cucumis sativus L. Chin. J. Appl. Environ. Biol. 2014, 20, 45–49. [Google Scholar]
  44. Poudel, P.R.; Kataoka, I.; Mochioka, R. Effect of red-and blue-light-emitting diodes on growth and morphogenesis of grapes. Plant Cell Tissue Organ Cult. 2008, 92, 147–153. [Google Scholar] [CrossRef]
  45. Nhut, D.T.; Takamura, T.; Watanabe, H.; Tanaka, M. Efficiency of a novel culture system by using light-emitting diode (LED) on in vitro and subsequent growth of micropropagated banana plantlets. In Proceedings of the I International Symposium on Acclimatization and Establishment of Micropropagated Plants 616, Sani-Halkidiki, Greece, 19–22 September 2001; pp. 121–127. [Google Scholar]
  46. Nhut, D.T.; Takamura, T.; Watanabe, H.; Okamoto, K.; Tanaka, M. Responses of strawberry plantlets cultured in vitro under superbright red and blue light-emitting diodes (LEDs). Plant Cell Tissue Organ Cult. 2003, 73, 43–52. [Google Scholar] [CrossRef]
  47. Olsen, J.E.; Junttila, O. Far red end-of-day treatment restores wild type-like plant length in hybrid aspen overexpressing phytochrome A. Physiol. Plant. 2002, 115, 448–457. [Google Scholar] [CrossRef]
  48. Kara, A.N.; Kotov, A.A.; Bukhov, N.G. Specific distribution of gibberellins, cytokinins, indole-3-acetic acid, and abscisic acid in radish plants closely correlates with photomorphogenetic responses to blue or red light. J. Plant Physiol. 1997, 151, 51–59. [Google Scholar] [CrossRef]
  49. Hu, Y. Effects of red and blue LEDs on in vitro growth and microtuberization of potato single-node cuttings. Front. Agric. Sci. Eng. 2018, 5, 197–205. [Google Scholar]
  50. Asghari-Zakaria, R.; Maleki-Zanjani, B.; Sedghi, E. Effect of in vitro chitosan application on growth and minituber yield of Solanum tuberosum L. Plant Soil Environ. 2009, 55, 252–256. [Google Scholar] [CrossRef] [Green Version]
  51. Upadhyaya, C.P.; Pundir, R.K.; Pathak, A.; Joshi, N.; Bagri, D.S. Irradiation Studies of LED Light Spectra on the Growth and Development of Potato (Solanum tuberosum L.). Plant Sci. Today 2020, 7, 406–416. [Google Scholar] [CrossRef]
  52. Martínez-García, J.F.; Huq, E.; Quail, P.H. Direct targeting of light signals to a promoter element-bound transcription factor. Science 2000, 288, 859–863. [Google Scholar] [PubMed] [Green Version]
  53. Hogewoning, S.W.; Trouwborst, G.; Maljaars, H.; Poorter, H.; van Ieperen, W.; Harbinson, J. Blue light dose–responses of leaf photosynthesis, morphology, and chemical composition of Cucumis sativus grown under different combinations of red and blue light. J. Exp. Bot. 2010, 61, 3107–3117. [Google Scholar] [CrossRef]
  54. Li, H.; Tang, C.; Xu, Z. The effects of different light qualities on rapeseed (Brassica napus L.) plantlet growth and morphogenesis in vitro. Sci. Hortic. (Amsterdam). 2013, 150, 117–124. [Google Scholar] [CrossRef]
  55. Li, H.; Tang, C.; Xu, Z.; Liu, X.; Han, X. Effects of different light sources on the growth of non-heading Chinese cabbage (Brassica campestris L.). J. Agric. Sci. 2012, 4, 262. [Google Scholar] [CrossRef] [Green Version]
  56. Son, K.-H.; Oh, M.-M. Leaf shape, growth, and antioxidant phenolic compounds of two lettuce cultivars grown under various combinations of blue and red light-emitting diodes. HortScience 2013, 48, 988–995. [Google Scholar] [CrossRef]
  57. Ma, G.; Zhang, L.; Kato, M.; Yamawaki, K.; Kiriiwa, Y.; Yahata, M.; Ikoma, Y.; Matsumoto, H. Effect of blue and red LED light irradiation on β-cryptoxanthin accumulation in the flavedo of citrus fruits. J. Agric. Food Chem. 2012, 60, 197–201. [Google Scholar] [CrossRef]
  58. Bukhov, N.G.; Drozdova, I.S.; Bondar, V.V.; Mokronosov, A.T. Blue, red and blue plus red light control of chlorophyll content and CO2 gas exchange in barley leaves: Quantitative description of the effects of light quality and fluence rate. Physiol. Plant. 1992, 85, 632–638. [Google Scholar] [CrossRef]
  59. Takagi, D.; Ihara, H.; Takumi, S.; Miyake, C. Growth light environment changes the sensitivity of photosystem I photoinhibition depending on common wheat cultivars. Front. Plant Sci. 2019, 10, 686. [Google Scholar] [CrossRef] [PubMed]
  60. Xu, F.; Cao, S.; Shi, L.; Chen, W.; Su, X.; Yang, Z. Blue light irradiation affects anthocyanin content and enzyme activities involved in postharvest strawberry fruit. J. Agric. Food Chem. 2014, 62, 4778–4783. [Google Scholar] [CrossRef] [PubMed]
  61. do Nascimento, J.R.O.; Cordenunsi, B.R.; Lajolo, F.M.; Alcocer, M.J.C. Banana sucrose-phosphate synthase gene expression during fruit ripening. Planta 1997, 203, 283–288. [Google Scholar] [CrossRef]
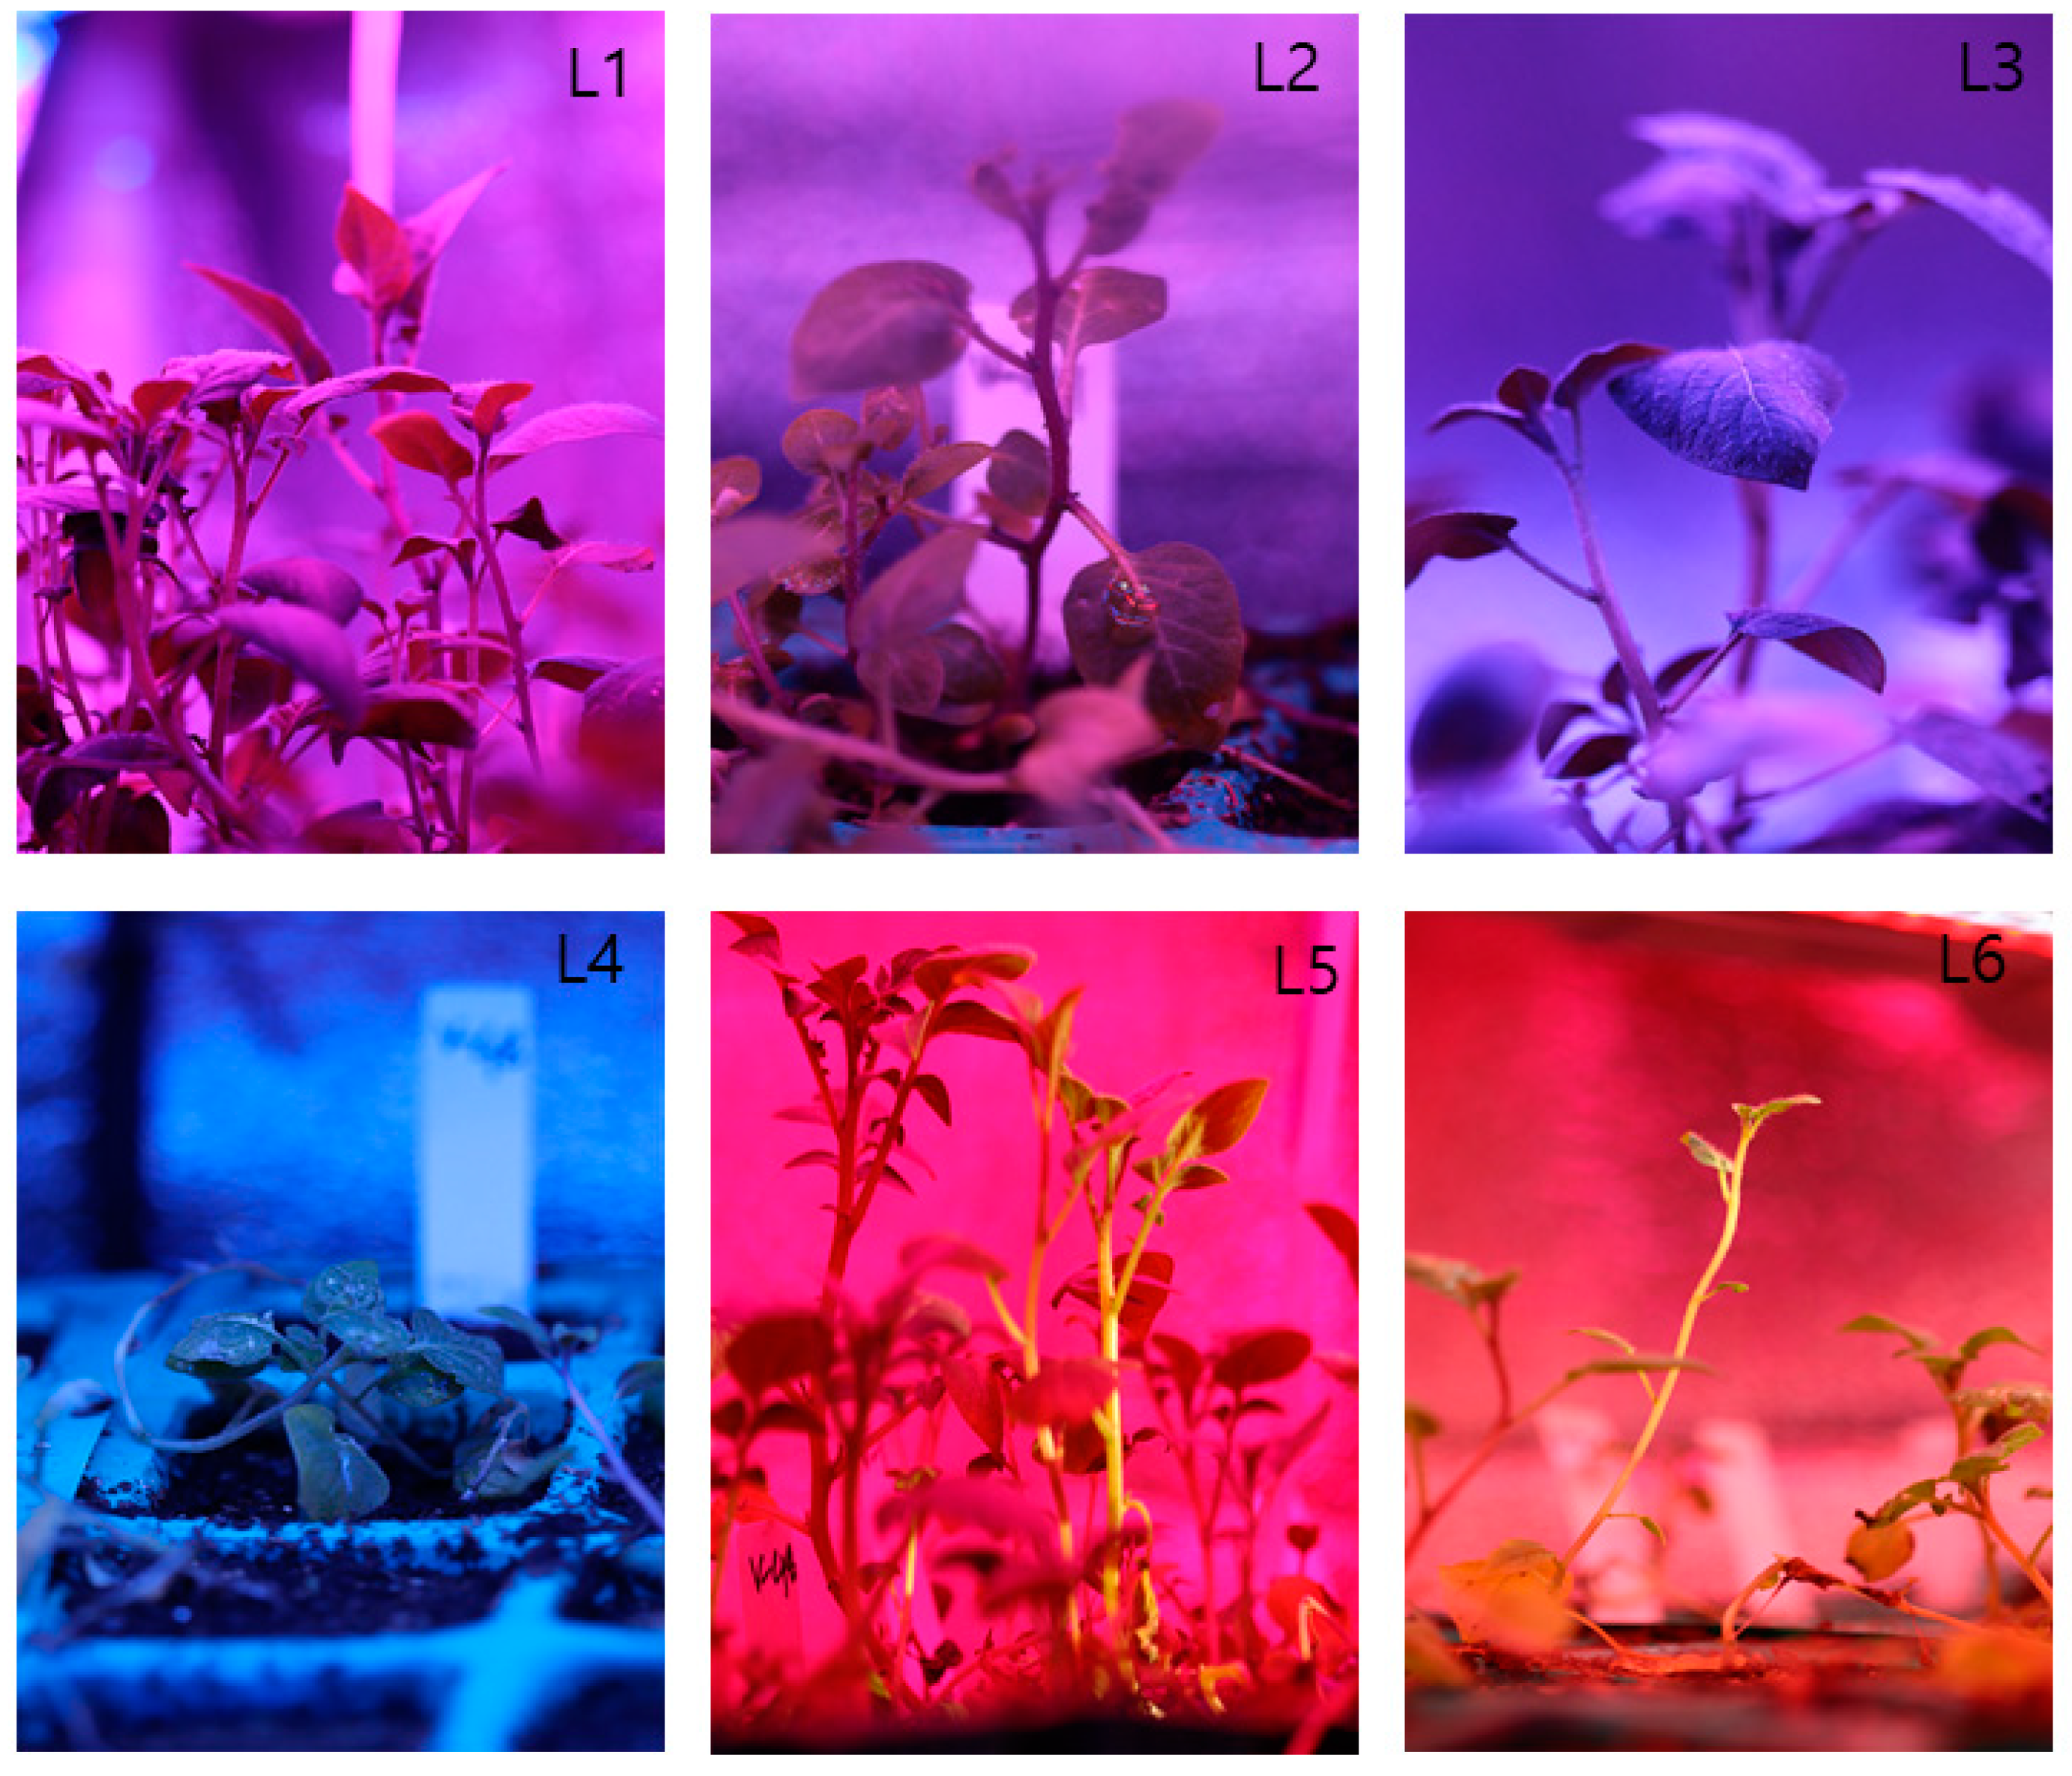
Figure 1. PVY testing results of Golden king (V48) and Chungang (V41) varieties.
Plants 10 00297 g001
Figure 2. Photographs of potato plants grown under the artificial LED light spectrum. L1 = Red: Blue: Far-red (70:20:10), L2 = Red: Blue: White (70:20:10), L3 = Blue: Far-red (70:30), L4 = Blue: White (70:30), L5 = Red: Far-red (70:30), L6 = Red: White (70:30).
Plants 10 00297 g002
Figure 3. Effects of LEDs light on the yield of potato tubers. Different letters in each bar graph indicate significant differences (p < 0.05). Varieties, Golden king (V48) and Chungang (V41). L1 = Red: Blue: Far-red (70:20:10), L2 = Red: Blue: White (70:20:10), L3 = Blue: Far-red (70:30), L4 = Blue: White (70:30), L5 = Red: Far-red (70:30), L6 = Red: White (70:30).
Plants 10 00297 g003aPlants 10 00297 g003b
Figure 4. Photographs of potato tubers grown under the artificial LED light spectrum. Golden king (V48): A (tuber weight >1 g); B (tuber weight <1 g). Chungang (V41): C (tuber weight >1 g); D (tuber weight <1 g).
Plants 10 00297 g004
Figure 5. The big tuber fresh weight of potatoes grown under the artificial LED light. Different letters in each bar graph indicate significant differences (p < 0.05). Varieties, Golden king (V 48) and Chungang (V 41). L1 = Red: Blue: Far-red (70:20:10), L2 = Red: Blue: White (70:20:10), L3 = Blue: Far-red (70:30), L4 = Blue: White (70:30), L5 = Red: Far-red (70:30), L6 = Red: White (70:30).
Plants 10 00297 g005
Figure 6. Effect of LEDs light treatment on the total soluble carbohydrate content and total soluble sugar content of potato plants in greenhouse condition. Different letters in each bar graph indicate significant differences (p < 0.05). Varieties, Golden king (V48) and Chungang (V41). L1 = Red: Blue: Far-red (70:20:10), L2 = Red: Blue: White (70:20:10), L3 = Blue: Far-red (70:30), L4 = Blue: White (70:30), L5 = Red: Far-red (70:30), L6 = Red: White (70:30).
Plants 10 00297 g006
Figure 7. Principal component analysis (PCA) representing patterns and associations between variables and treatments of V48 (A) and V41 (B).
Plants 10 00297 g007
Table 1. Light spectrum combinations and ratios.
Spectrum CombinationsIntensity Ratio (%)Intensity
(µmol m−2 s−1)
Code Name
R:B:FR70:20:10100L1
R:B:W70:20:10100L2
B:FR70:30100L3
B:W70:30100L4
R:FR70:30100L5
R:W70:30100L6
Table 2. Nutrient solution formulations.
Chemical NameVegetative Growth Period
(Transplantation to 40th Day)
Tuber Bulking Period
(41th Days to Harvesting Day)
A Tank (50 L)B Tank (50 L)A Tank (50 L)B Tank (50 L)
Ca(NO3)1.5 kg 7.66 kg
KNO33.79 kg3.79 kg3.54 kg3.54 kg
(NH4)2HPO4 1.6 kg 1.52 kg
MgSO4 4.3 kg 3.68 kg
K2SO4 1.3 kg
Fe-EDTA460 g 460 g30.8 g
MnSO4 30.8 g
H3BO3 57.2 g 57.2 g
ZnSO4 3.6 g 3.6 g
CuSO4 1.3 g 1.3 g
(NH4)6Mo7O24·4H2O 0.4 g 0.4 g
Table 3. Effect of artificial LED on the growth parameters of potato plants in plant factory.
TreatmentsPlant Height (cm)Node NumberLeaf NumberLeaf Length (cm)Leaf Width (cm)Fresh Weight/Plant (g)Dry Weight/Plant (g)
V48V41V48V41V48V41V48V41V48V41V48V41V48V41
L117.33 ± 3.3 bc17.01 ± 3.2 c15.33 ± 2.8 a13.66 ± 1.4 b9.61 ± 1.6 ab9 ± 0.8 ab5.5 ± 0.4 a3 ± 0.4 b2.5 ± 0.4 a1.5 ± 0.2 b2.16 ± 0.3 cd3.35 ± 0.2 d0.21 ± 0.0 c0.24 ± 0.0 bc
L213 ± 0.8 c15 ± 0.8 c12 ± 0.8 ab14.22 ± 2 a7.31 ± 1.2 b9.66 ± 1.2 a3.03 ± 0.2 b3.1 ± 0.7 b1.9 ± 0.2 ab1.6 ± 0.3 abc7.18 ± 1.0 ab4.54 ± 0.3 c0.4 ± 0.0 b0.25 ± 0.0 bc
L321.6 ± 1.2 b26 ± 1.6 ab15.67 ± 1.2 a14.34 ± 2.9 a9 ± 0.8 ab9 ± 0.8 ab5.4 ± 0.53 a4.43 ± 0.4 a2.5 ± 0.1 a1.86 ± 0.1 a1.714 ± 0.2 d0.42 ± 0.0 e0.17 ± 0.0 c0.08 ± 0.0 d
L414 ± 0.8 c15 ± 1.6 c15.31 ± 1.6 a14.24 ± 2.4 a7.32 ± 1.6 ab8 ± 0.8 ab2.73 ± 0.2 b1.96 ± 0.1 c1.55 ± 0.1 b1.43 ± 0.2 bc6.25 ± 0.9 b5.45 ± 0.7 b0.15 ± 0.0 c0.19 ± 0.0 c
L530.3 ± 1.1 a27 ± 1.4 a16.33 ± 1.2 a14.16 ± 1.2 a10.63 ± 1.1 a9 ± 0.8 ab5.9 ± 0.2 a4.23 ± 0.5 a2.5 ± 0.4 a1.73 ± 0.5 a9.98 ± 1.7 a6.91 ± 0.2 a1.23 ± 0.0 c0.35 ± 0.0 a
L616.31 ± 2.0 bc19 ± 2.9 bc11.36 ± 0.8 ab14.74 ± 0.8 a6 ± 0.82 b7.33 ± 1.2 b2.66 ± 0.4 b1.13 ± 0.1 c1.4 ± 0.2 c0.6 ± 0.1 c4.44 ± 0.2 c3.55 ± 0.3 d0.12 ± 0.0 c0.27 ± 0.0 b
dfmssmssmssmssmssmssmss
Variety111.1 ***38.02 ***1.00 ***13.56 ***3.67 ***14.07 ***0.35 ***
Treatment5199.13 ***19.36 ns8.13 ***10.85 ***1.06 ***41.05 ***0.33 ***
Variety X Treatment510.37 ***12.29 ***3.06 ***1.15 ***0.2 ***3.46 ***0.21 **
LSD
(0.05)
7.397.855.614.443.892.191.640.861.250.623.530.750.190.07
The values are treatment means ± standard deviations. Different letters indicate a significant difference between treatments in the same columns. LSD: least significant difference, df: degree of freedom; mss: mean sum of square; 2 way ANOVA was conducted at p ≤ 0.001 (***), 0.01 (**), Varieties: Golden king (V 48) and Chungang (V41). L1 = Red: Blue: Far-red (70:20:10), L2 = Red: Blue: White (70:20:10), L3 = Blue: Far-red (70:30), L4 = Blue: White (70:30), L5 = Red: Far-red (70:30), L6 = Red: White (70:30).
Table 4. Effect of LEDs light treatments on photosynthetic pigments, total chlorophyll, and carotenoids.
TreatmentsChlorophyll a (mg/g)Chlorophyll b (mg/g)Total Chlorophyll (mg/g)Carotenoid (mg/g)
V48V41V48V41V48V41V48V41
L11.12 ± 0.05 a0.61 ± 0.05 e0.74 ± 0.05 b0.44 ± 0.03 d2.07 ± 0.11 a1.06 ± 0.08 d2.01 ± 0.07 a1.12 ± 0.05 b
L21.76 ± 0.06 a1.82 ± 0.05 a1.01 ± 0.06 a0.95 ± 0.04 a2.25 ± 0.12 a1.97 ± 0.02 a2.19 ± 0.05 a1.74 ± 0.07 a
L30.75 ± 0.05 d0.99 ± 0.07 a0.55 ± 0.07c0.76 ± 0.03 a1.3 ± 0.12 d1.46 ± 0.11 b1.21 ± 0.05 c0.73 ± 0.04 cd
L40.66 ± 0.02 de0.7 ± 0.04 de0.45 ± 0.04 d0.51 ± 0.06 c1.12 ± 0.05 de1.22 ± 0.02 cd1.12 ± 0.06 d0.69 ± 0.06 d
L51.06 ± 0.06 b0.77 ± 0.03 bc1.03 ± 0.05 a0.51 ± 0.05 c2.04 ± 0.02 a1.29 ± 0.07 c1.99 ± 0.07 a1.04 ± 0.1 b
L60.87 ± 0.04 c0.87 ± 0.03 b0.69 ± 0.02 b0.57 ± 0.03 b1.56 ± 0.02 b1.44 ± 0.07 b1.51 ± 0.07 b0.86 ± 0.06 c
LSD (0.05)0.10.10.120.030.130.090.130.14
The values are treatment means ± standard deviations. Different letters indicate a significant difference between treatments in the same columns. LSD, least significant difference, p ≤ 0.05. Varieties, Golden king (V 48) and Chungang (V 41). L1 = Red: Blue: Far-red (70:20:10), L2 = Red: Blue: White (70:20:10), L3 = Blue: Far-red (70:30), L4 = Blue: White (70:30), L5 = Red: Far-red (70:30), L6 = Red: White (70:30).
Publisher’s Note: MDPI stays neutral with regard to jurisdictional claims in published maps and institutional affiliations.

