Article

Development of SSR Databases Available for Both NGS and Capillary Electrophoresis in Apple, Pear and Tea

1
Institute of Fruit Tree and Tea Science, NARO, Tsukuba 305-8605, Japan
2
Research Center for Agricultural Information Technology, NARO, Tokyo 105-0003, Japan
3
Institute of Fruit Tree and Tea Science, NARO, Morioka 020-0123, Japan
*
Author to whom correspondence should be addressed.
Plants 2021, 10(12), 2796; https://doi.org/10.3390/plants10122796
Submission received: 16 November 2021 / Revised: 14 December 2021 / Accepted: 14 December 2021 / Published: 17 December 2021
(This article belongs to the Special Issue Plant Bioinformatics: Applications and Databases)

Abstract

:
Developing new varieties in fruit and tea breeding programs is very costly and labor-intensive. Thus, establishing a variety discrimination system is important for protecting breeders’ rights and producers’ profits. Simple sequence repeat (SSR) databases that can be utilized for both next-generation sequencing (SSR-GBS) and polymerase chain reaction–capillary electrophoresis (PCR-CE) would be very useful in variety discrimination. In the present study, SSRs with tri-, tetra- and pentanucleotide repeats were examined in apple, pear and tea. Out of 37 SSRs that showed clear results in PCR-CE, 27 were suitable for SSR-GBS. Among the remaining markers, there was allele dropout for some markers that caused differences between the results of PCR-CE and SSR-GBS. For the selected 27 markers, the alleles detected by SSR-GBS were comparable to those detected by PCR-CE. Furthermore, we developed a computational pipeline for automated genotyping using SSR-GBS by setting a value “α” for each marker, a criterion whether a genotype is homozygous or heterozygous based on allele frequency. The set of 27 markers contains 10, 8 and 9 SSRs for apple, pear and tea, respectively, that are useful for both PCR-CE and SSR-GBS and suitable for automation. The databases help researchers discriminate varieties in various ways depending on sample size, markers and methods.

1. Introduction

Fruit and tea breeding requires tremendous cost and time to release varieties because of their long juvenile stage and large plant size [1]. Once elite genotypes are selected and popularized by producers and consumers, the genotypes are able to be duplicated easily by clonal propagation. For this reason, it is difficult to protect breeders’ rights because breeders cannot control illegal spreads of scions. The period of protection for perennial plants is long, 25 years, as determined by the International Union for the Protection of New Varieties of Plants. Unlike vegetable and flower breeding programs, which are mainly supported by private companies, fruit and tea breeding programs have been mainly supported by governments, universities and individuals interested in plant breeding [2,3,4]. In Japan, because some elite new varieties registered by public research organizations were transported to other countries without authorization, Japanese organizations and breeders have started to register varieties in other countries and have engaged in developing variety identification methods that must be robust and reliable [5]. To further develop varieties for fruit and tea, it is important to protect breeders’ rights and continue organized breeding programs.
Simple sequence repeats (SSRs) are neutral markers that are used mainly in population genetics as well as in conservation ecology and phylogenetic analysis [6,7,8,9]. These markers have also been applied in sensitive studies such as forensic analyses [10], parentage analyses [11,12,13] and variety discrimination [14,15]. However, SSR detection has been difficult to automate because fragments from polymerase chain reaction–capillary electrophoresis (PCR-CE) have usually been evaluated by eye to determine genotypes. Due to limited multiplexing in PCR, the cost and time to determine genotypes has remained high. Slippage and stutter bands in fragment analysis have made allele determination difficult, resulting in the possibility of increased mis-genotyping [16]. Recently, more and more single-nucleotide polymorphism (SNP) analyses based on genotyping by sequencing (GBS) or double-digest restriction-site-associated DNA sequencing (ddRAD-seq) have been applied to the genotyping of plant materials [17,18]. Even so, SSRs have some advantages. First, genetic databases for SSRs were developed in many species [19,20,21,22], and some of the materials applied in the preparation of these databases were blighted and became unavailable. By using these same SSR marker sets, researchers can compare past materials with current ones. Second, if the quality and quantity of DNA are too low to construct libraries by GBS or ddRAD-seq, PCR-CE can be applied to SSRs. Therefore, SSRs can even be used to discriminate varieties in processed products or to genotype single pollen grains [23,24]. In addition, PCR-CE with SSRs can be applied easily and flexibly to plant collections of any size without utilizing next-generation sequencing (NGS).
Recently, some methods that apply NGS techniques for genotyping SSRs, called SSR-GBS [25] or SSR-seq [26], have been developed, and some of the disadvantages of SSRs have been overcome. These methods have speeded up genotyping, determined allele size precisely and identified SNPs in SSR flanking regions. However, manual scoring is still necessary to determine genotypes for some markers, especially for dinucleotide repeats with stutter bands [27]. Some software or pipelines have been developed for automated SSR allele calling [25,26,28], but no studies have tested whether the genotypes of a variety collection determined by SSR-GBS and PCR-CE are comparable for variety discrimination. Additionally, the repeatability necessary for variety discrimination has not been adequately confirmed for SSR-GBS.
To overcome these disadvantages of SSRs, databases that can be utilized for both PCR-CE and SSR-GBS would be very helpful for use in variety discrimination. Depending on the objective, researcher preference and sample size, researchers can select a suitable way to identify genotypes by using these databases. The objective of the present study was to select SSR markers that are suitable for both PCR-CE and SSR-GBS and to validate their repeatability in SSR-GBS. In order to develop automatic allele calling and to create a pipeline that is easy to implement, we mainly used tri-, tetra- and pentanucleotide repeats that do not produce stutter bands. To assess stability and repeatability, we replicated the SSR-GBS analysis in three different species: apple (Malus domestica Borkh.), pear (Pyrus pyrifolia Nakai.) and tea (Camellia sinensis (L.) O. Kuntze).

2. Results

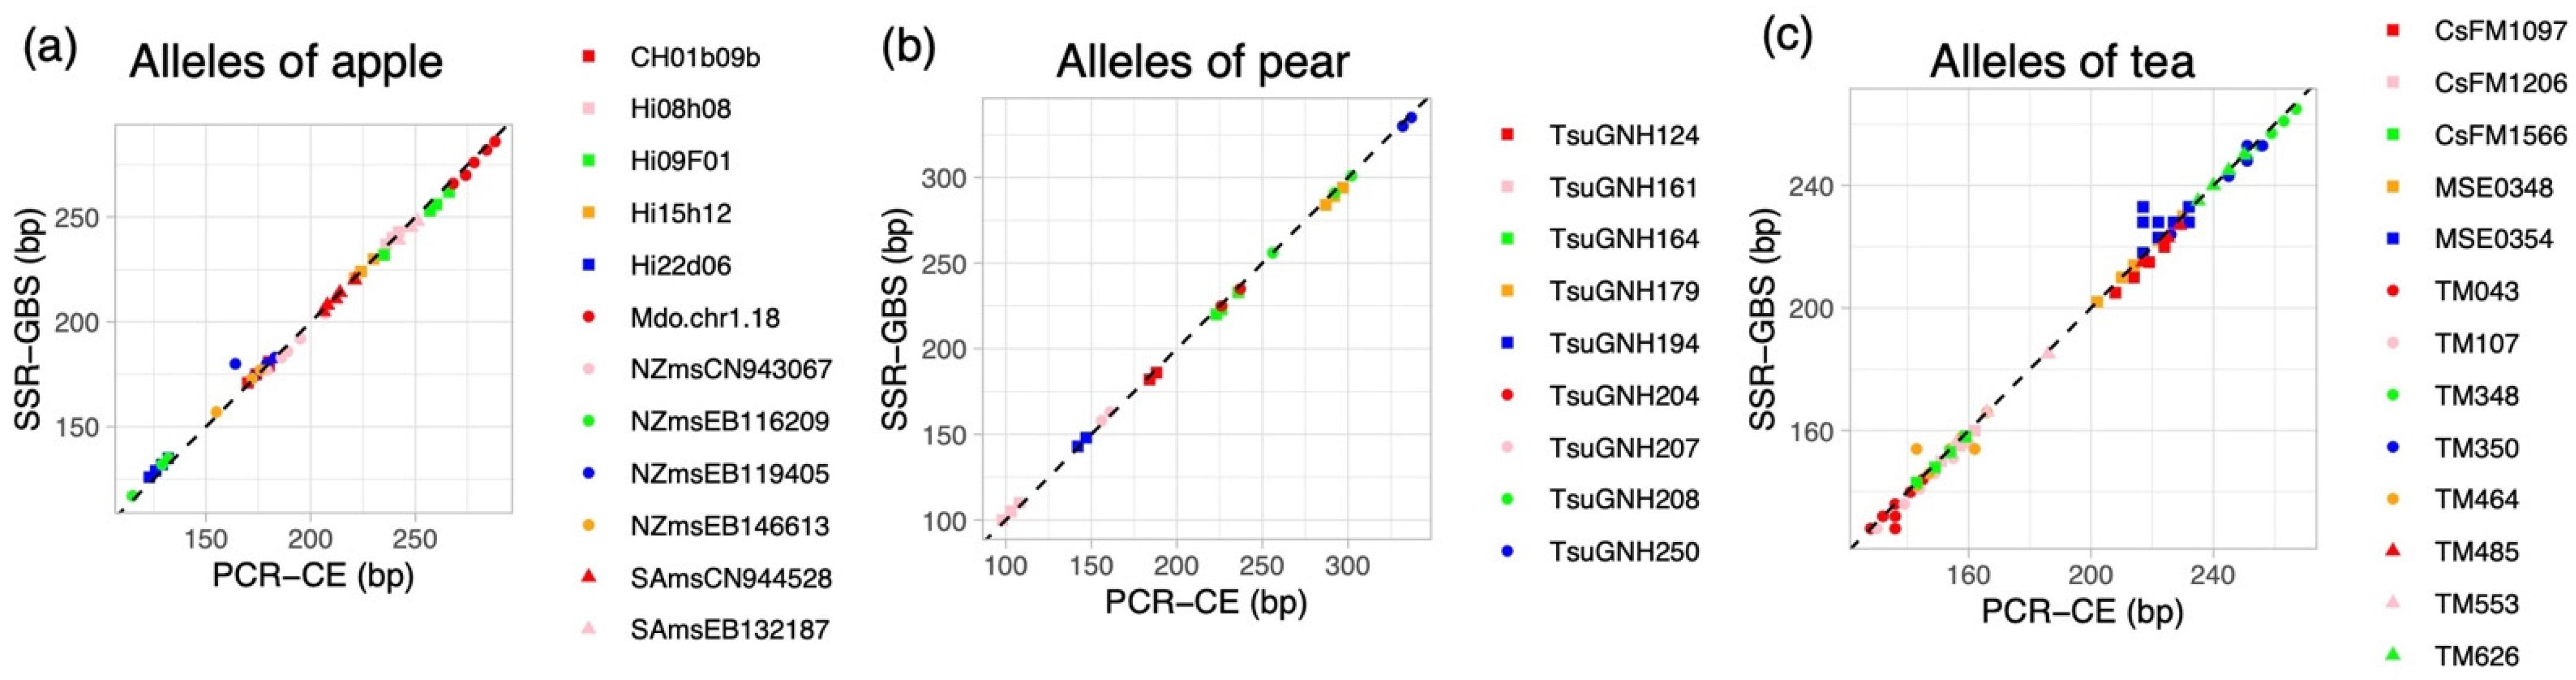
2.1. Genotyping by PCR-CE

Prior to determining the SSR genotypes in each variety, SSR positions were confirmed using BLAST+ [29] against the ‘Golden Delicious’ double-haploid (GDDH13) apple genome [30], the Japanese pear ‘Nijisseiki’ genome [31] and a draft genome of C. sinensis var. sinensis ‘Shuchazao’ (CSS-SCZ) [32] (Table S1). All of the markers except Hi15h12 in apple and TM350 in tea were matched to specific mapped regions of reference genome sequences within repeat-containing regions. Hi15h12 was mapped to fictive chromosome (0) of GDDH13, and TM350 was mapped to contig805 of CSS-SCZ. The remaining markers were mapped to different chromosome regions within each genome, which is beneficial for variety discrimination.
The markers identified for each species were successfully genotyped by PCR-CE in all of the corresponding varieties (43 apple, 29 pear and 44 tea) without any missing values (Table 1 and S2–S4). The SSR fragments were clear, and signals for each allele were constant for each marker. The average observed heterozygosity, expected heterozygosity and polymorphism information content were, respectively, 0.62, 0.59 and 0.52 in apple, 0.46, 0.41 and 0.35 in pear and 0.56, 0.52 and 0.46 in tea (Table 2). In each of the three variety collections, all of the varieties used in this study were successfully differentiated based on genotypes by using those marker sets. The unweighted pair group method with arithmetic mean (UPGMA) dendrograms were created in each variety collection, showing some cultivars that contain the genetic structure of different species are genetically distant from the main varieties used in this study (Figure S1). For example, JM varieties developed from crossing between M. prunifolia Borkh and M. pumila Miller in apple formed a subgroup which is distant from M. domestica varieties. ‘Cha Chukanbohon No. 3’, which is C. sinensis var. assamica, ‘Cha Chukanbohon No. 6’, which is a chance seedling of C. taliensis and their relatives formed a subcluster that is distant from the main tea varieties used in this study (C. sinensis var. sinensis).

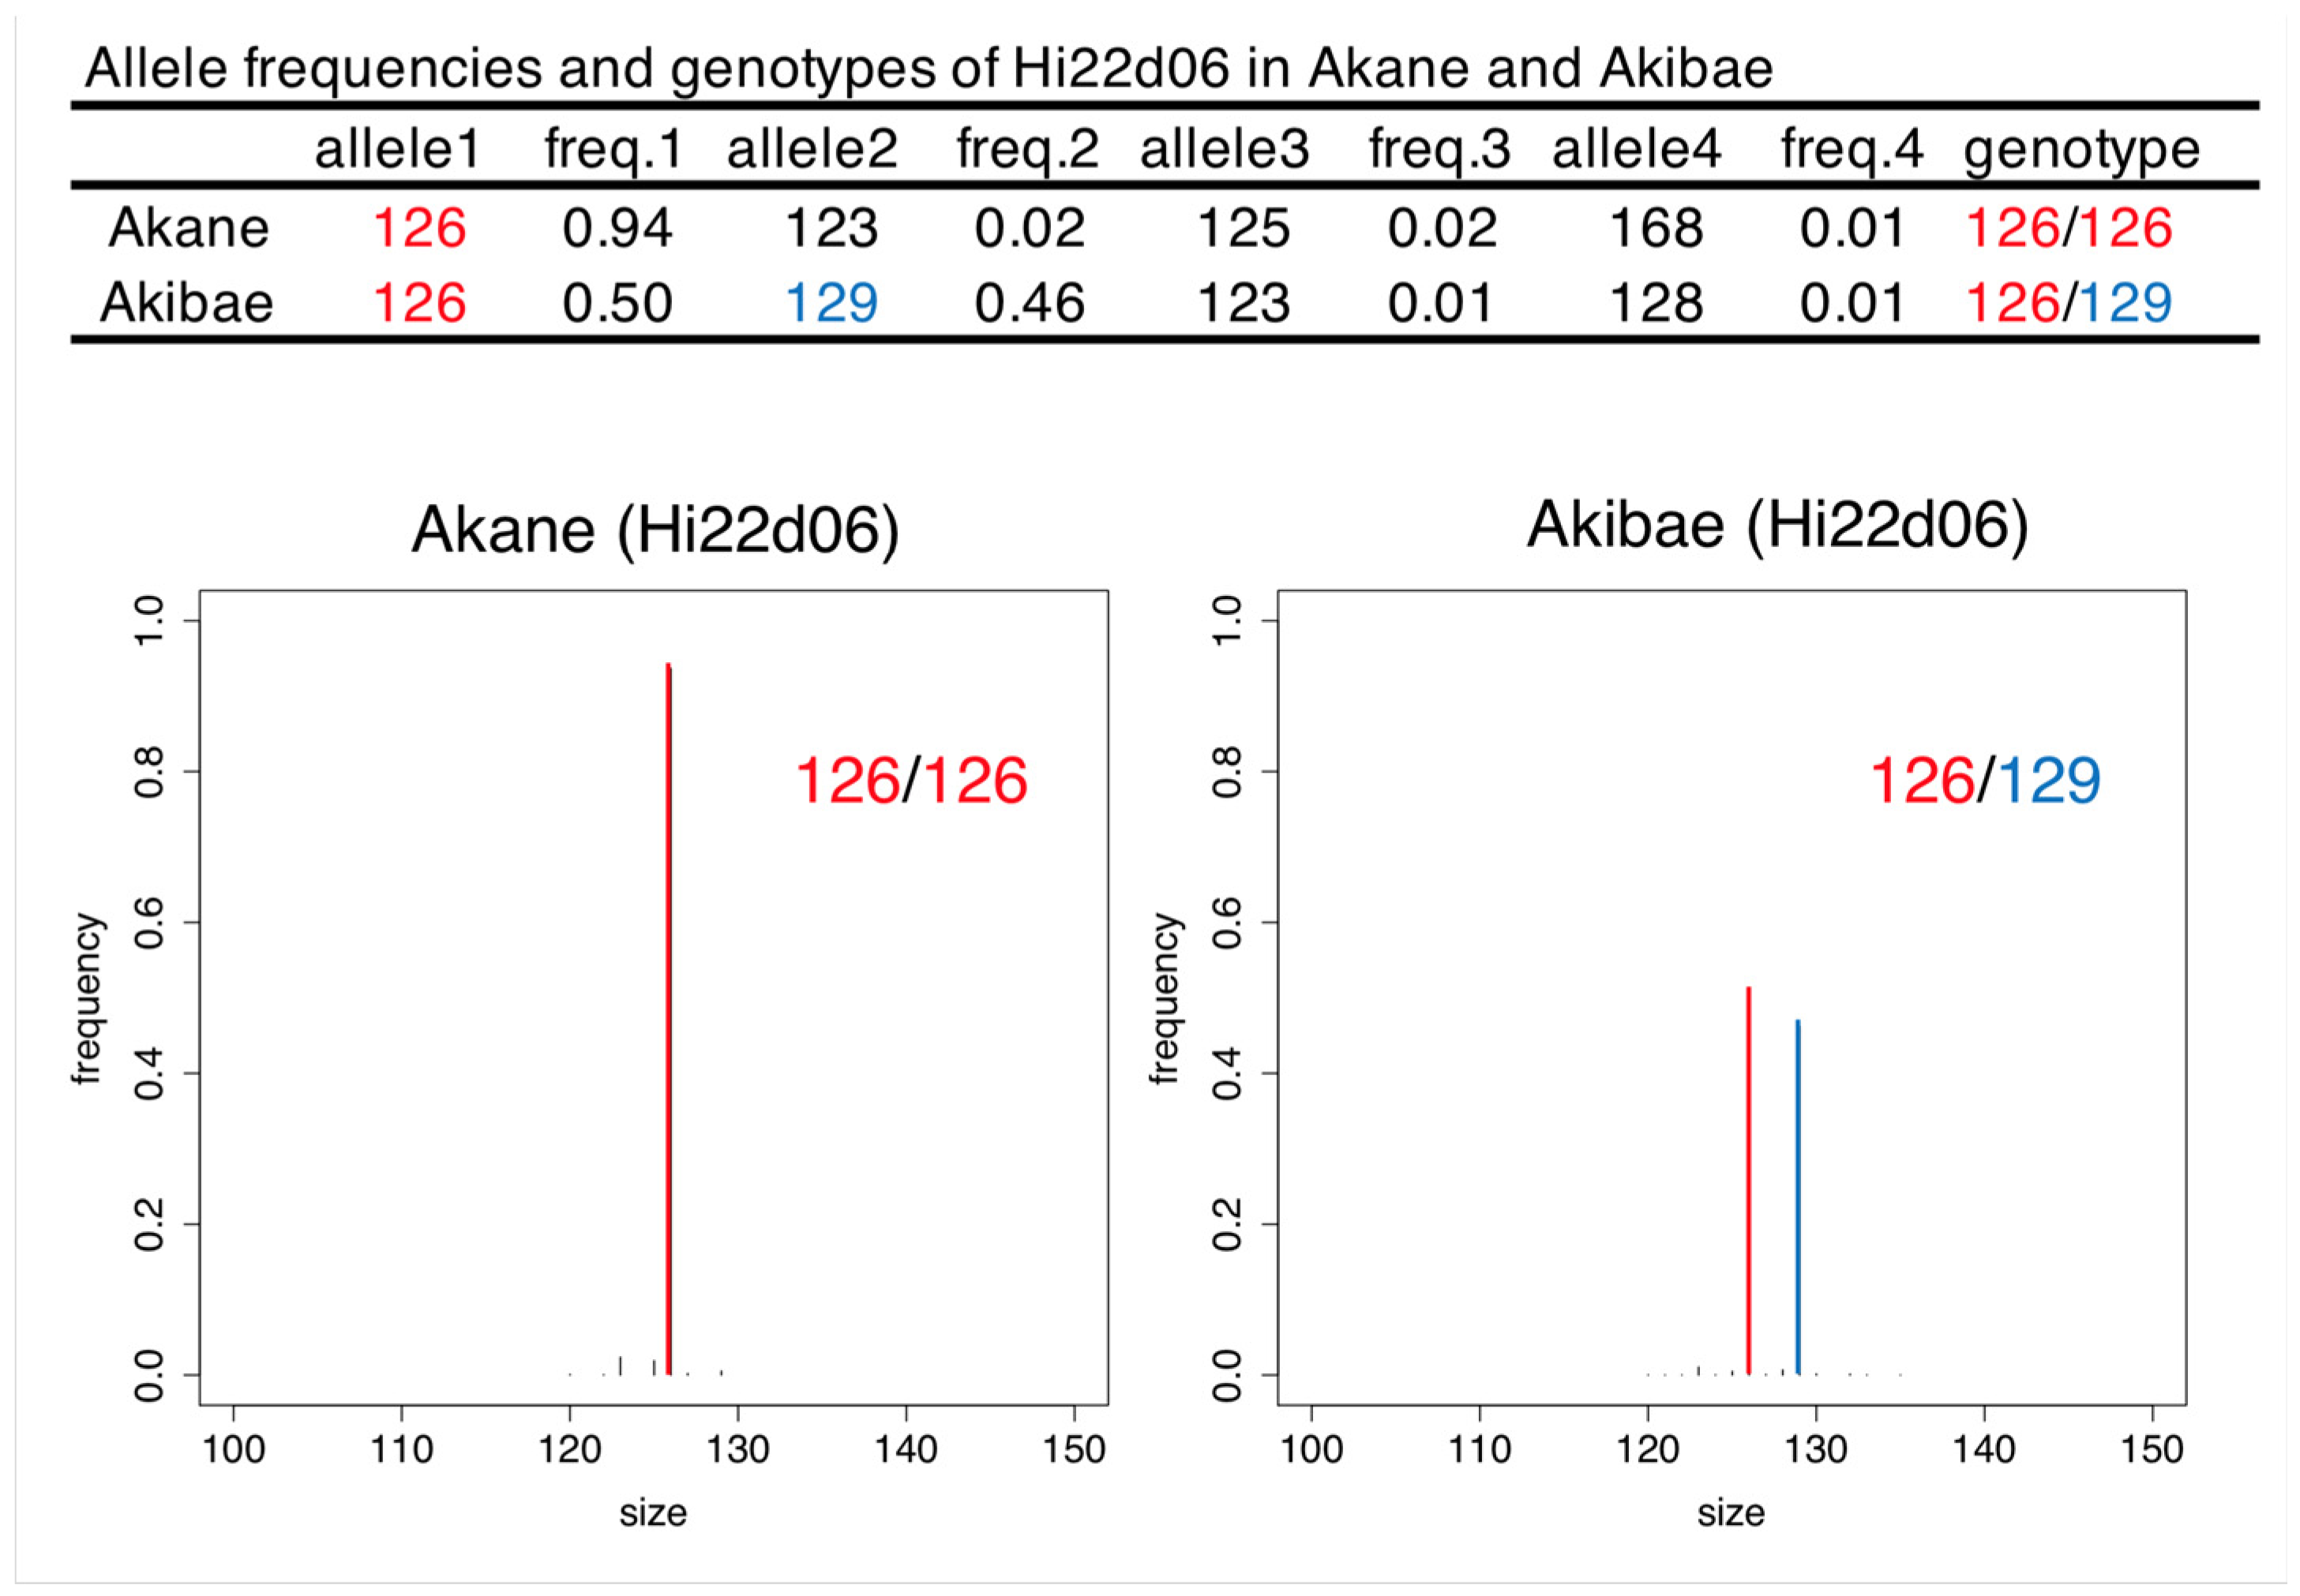
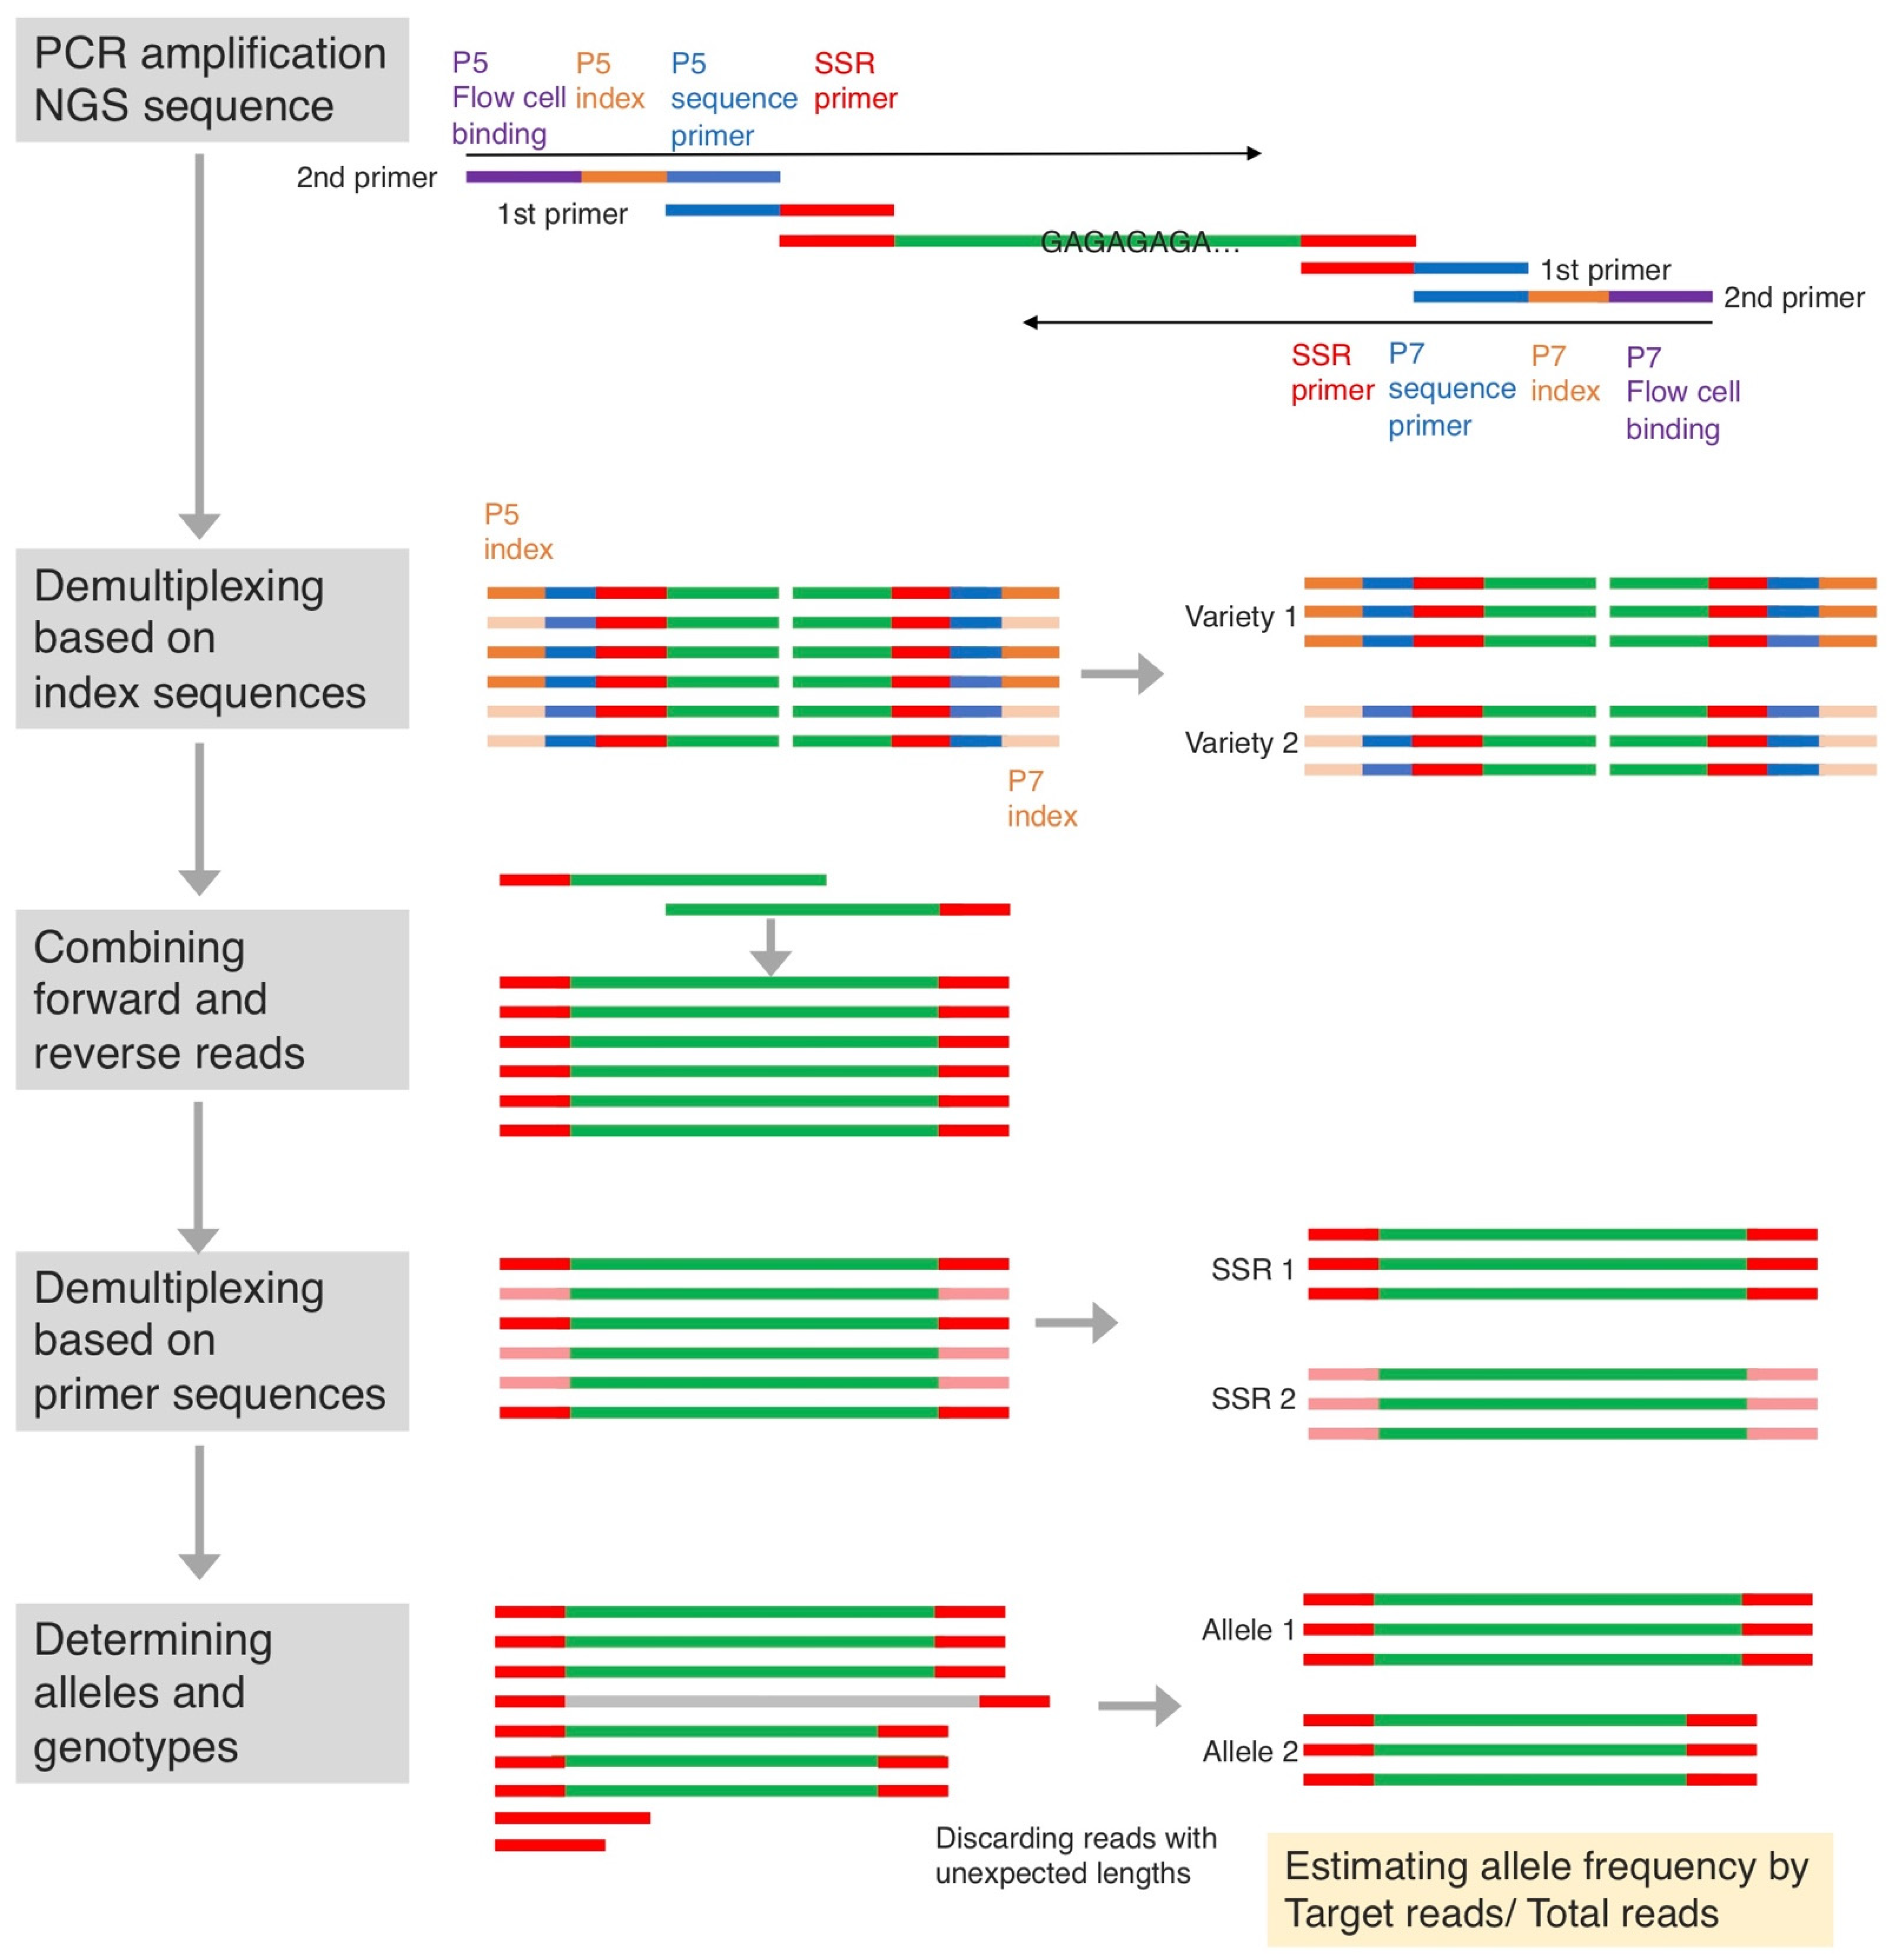
2.2. Genotyping by SSR-GBS

Illumina short-read sequencing data from 9.5 M reads, 7.7 M reads and 7.7 M reads were obtained from the 2 replicates of 43 varieties of apple (average of 110.2 K reads), 29 varieties of pear (average of 132.9 K reads) and 44 varieties of tea (average of 133.0 K reads), respectively. After combining the reads from forward and reverse sequences, 4.2 M, 3.8 M and 3.7 M reads were obtained, respectively. The average number of reads per variety was 49.0 K reads for apple, 66.5 K for pear and 51.4 K for tea. The reads were then demultiplexed based on the primer sequences. The average number of reads per marker ranged from 14 (TM336) to 25,406 (TsuGNH194), with an average of 3866 (Table 3). All 12 SSR markers in apple had an average of more than 50 reads, as did 9 of 10 SSRs in pear and 14 of 15 SSRs in tea. Because the markers that had a small number of reads had lower reliability, they were excluded from further analyses. The numbers of reads in the replicated analysis were similar to those in the original analysis. For example, in tea, the number of reads was highest in MSE0354 (10,510 and 8783) and lowest in TM336 (14 and 12) for the 2 replicated analyses. There were several markers that had an insufficient number of reads in a specific variety even though the overall average number of reads was high. The numbers of reads obtained for TsuGNH164 in ‘Oushuu’ and CsFM1595 in ‘Cha Chukanbohon No. 6’ were quite low, making it impossible to determine the genotypes of these markers in these varieties.
Using the pipeline described in Materials and Methods, we calculated the allele frequencies for each marker in each variety. For each marker, we retrieved allele frequencies for only the four most common alleles, which provided enough information to call the genotypes and understand the details of the PCR products (Figure 1). Then, each genotype was estimated manually based on allele frequency. In most cases, the allele frequency of the first allele was >0.8 when the genotype was homozygous and around 0.4 when the genotype was heterozygous. The distribution of allele frequencies fluctuated depending on the marker owing to background arising during amplification and sequencing. For CH01b09b, which has dinucleotide repeats, genotyping errors were found in ‘Jonathan’ and ‘Sensyu’ because of the presence of stutter bands. We used tri-, tetra- and pentanucleotide repeats for all markers except for CH01b09b and Mdo.chr1.18, so there were few stutter bands for the other markers. The detected sizes of some alleles in SSR-GBS were obviously different from those detected in PCR-CE (Figure 2). In particular, NZmsEB119405 in apple, and MSE0354, TM043, TM350 and TM464 in tea, showed allele dropout (null alleles) in SSR-GBS, meaning that some alleles detected in PCR-CE were undetected in SSR-GBS (Figure 2). Except for the cases of allele dropout, the alleles detected by SSR-GBS corresponded to those detected by PCR-CE. There were some small differences between digital sizes in SSR-GBS and the artificially determined sizes in PCR-CE, which ranged from −4 bp to 3 bp, but this difference could be corrected by adding or subtracting the indicated value for each marker (Table 3). Following this analysis, 10 SSRs for apple, 8 for pear and 9 for tea were selected as suitable markers to use in SSR-GBS for variety discrimination (Tables S5–S7). All of the varieties used in this study could be successfully differentiated based on genotypes determined by those marker sets.

2.3. Automated Genotyping in SSR-GBS and Repeatability

To develop an accurate automated genotyping system, we set the value of a new variable, α, for each marker (Table 4). The value of α is used as a criterion whether a genotype is homozygous or heterozygous. If the first (most common) allele frequency is more than α, the genotype is assumed to be homozygous. If the first allele frequency is less than or equal to α, the genotype is called heterozygous for the first and second alleles. The range of α was largest (estimated as 0.44) for TsuGNH207 and TsuGNH250, and it was smallest for Mdo.chr1.18 (estimated as 0.01). The α for Hi15h12 showed low values (0.34–0.52). This marker produced some slippage reads, resulting in alleles from PCR-CE that were 1 bp larger than the target alleles in SSR-GBS. The α values for TsuGNH179 and TM533 were high (0.89–0.97 and 0.87–0.97, respectively). For these markers, the frequency of the second allele was sometimes less than that of the slippage and stutter band from the first allele, probably due to sequence variation in the primer binding site. Because of this fluctuation, we set the optimum α value for each marker based on the average of the minimum and maximum values, which ranged from 0.43 to 0.98 and averaged 0.75.
To estimate the repeatability of the analyses, we conducted replicated analyses with a slight change in the multiplex PCR set. In the first replicate, we used all of the primers for each species in a single multiplex PCR, whereas in the second replicate, the primers for each species were split into two sets. Otherwise, the steps were the same. The correlations of the first allele frequency among 2 replicated analyses were quite high (0.98–1.00) regardless of the marker, suggesting that this method has high repeatability when the same procedure and conditions are used.

3. Discussion

We developed databases suitable for both PCR-CE and SSR-GBS containing 43 varieties with 10 SSRs for apple, 29 varieties with 9 SSRs for pear, and 44 varieties with 8 SSRs for tea. We were able to distinguish all the varieties that covered most of the varieties planted in Japan; even the number of the markers were around ten. The databases were available to protect breeders’ rights of those varieties. It can also help researchers discriminate varieties in various ways depending on sample size and number of markers. The cost of SSR-GBS is lower than that of PCR-CE when the number of varieties tested is large [33]. The allele scores for PCR-CE and SSR-GBS differed somewhat (Table 3, Figure 2) because the allele sizes fluctuated depending on the type of fluorescent dyes and amplified nucleotide composition. By using the varieties in this study as controls, researchers can adjust the scores of PCR-CE to those of SSR-GBS and vice versa.
SSR-GBS has mainly been used in studies of population genetics, and few studies related to variety discrimination have been conducted. Here, we were able to select SSRs that were suitable for variety discrimination using SSR-GBS. Out of 37 SSRs tested in this study, 33 were successfully amplified (all except for TsuGNH164, TsuGNH184, CsFM1595 and TM336), but only 27 were suitable for SSR-GBS. The rate of successful PCR amplification was similar to those in other studies using SSR-GBS [25,34,35]. Out of the 27 SSRs suitable for automated genotyping, 19 had a range of α values of more than 0.2, suggesting that those markers had high reliability for SSR-GBS. Although the digital allele size determined by SSR-GBS is unambiguous, marker allele frequencies may fluctuate because of differences in enzymes, thermal cyclers and other laboratory equipment. The markers that have a greater range of α have equal amounts of amplification of the first and second alleles when heterozygous and have small numbers of nonspecific PCR products. Thus, those markers could be used as anchoring markers to connect databases. One of the merits of SSR-GBS is that it can detect length homoplasy (the occurrence of nonhomologous fragments of the same size) because it reveals SNPs [25]. However, we did not use SNPs to create the databases because the objective of this study was to develop databases available for both NGS and capillary electrophoresis that do not focus on SNPs but rather on the sizes of the PCR products.
Applying multiplex PCR and/or mixing several PCR products is necessary for NGS because the NGS platform needs sequence diversity in order to produce high-quality reads. On the other hand, applying different enzymes suitable for multiplex PCR at the same annealing temperature produced the differences between the results of SSR-GBS and PCR-CE. In this study, some allele dropouts were observed in SSR-GBS, as has been observed in other studies [33,36]. Each primer used in this study has an optimal annealing temperature, but it was not applied in these experiments, because the cost of genotyping and labor for the experimental procedure would increase if we subdivided the marker set for multiplex PCR. It is possible that some primers did not amplify alleles that had somewhat different sequences in the primer binding site. In fact, allele dropout was observed in varieties that were genetically distant from the main varieties in the database, i.e., JM varieties, which were developed from crossing between M. prunifolia Borkh and M. pumila Miller in apple; ‘Oushuu’, one of whose ancestors is Chinese pear; and ‘Cha Chukanbohon No. 3’, which is C. sinensis var. assamica introduced from India (Figure S1).
Although the accuracy of SSR-GBS, which suffers from allele dropout, is lower than PCR-CE, there are merits of SSR-GBS such as ease of automation and digital allele length, which does not vary among laboratories. We arranged the pipeline for SSR-GBS using the pipeline of Tibihika et al. [25] as a reference. Our pipeline is useful for complete automation of genotyping after the user sets the value of α for each marker. By using fastq reads, primer set sequences and α, the genotype score is easily obtained. The pipeline is simple and is composed of four files with the following functions: (1) combining the pairs of fastq files, (2) demultiplexing based on markers, (3) counting alleles and (4) determining genotypes. This pipeline works in a basic Linux system and is useful not only for variety discrimination but also for marker-assisted selection (MAS). Because the important molecular markers for fruit breeding programs were developed using SSRs and indels, the SSR-GBS pipeline can be applied to practical MAS with a slight change. Specifically, by examining four major alleles, the extent of slippage and stutter bands can be estimated because those increase the frequencies of third and fourth alleles. Even though the third and fourth alleles are not necessary for the determination of genotypes in diploid species, output of that information helps to reduce genotyping errors due to artifacts and helps to confirm whether the result of automatic genotyping is accurate.
In conclusion, the databases of apple, pear and tea developed here can provide basic information for PCR-CE and SSR-GBS. These databases and the methods developed in this study are useful for variety discrimination and protecting breeders’ rights. We also identified markers that have high reliability and are suitable for the automation of SSR-GBS. These highly reliable markers can help to connect databases and facilitate automated genotyping using a simple pipeline.

4. Materials and Methods

4.1. Plant Materials

We used a total of 116 varieties consisting of 43 varieties of apple, 29 varieties of pear and 44 varieties of tea (Table 2). The varieties of apple and pear were preserved at the Institute of Fruit Tree and Tea Science, NARO, in Morioka and Tsukuba, respectively. The tea varieties were preserved at the Institute of Fruit Tree and Tea Science, NARO, Makurazaki, Green Tea Laboratory; Saitama Prefectural Agriculture and Forestry Research Center; and Tea Branch Facility, Miyazaki Agricultural Research Institute. Genomic DNA was extracted from young leaves with a DNeasy Plant Mini Kit (Qiagen, Germany). To understand an overview of genetic relationships among varieties, UPGMA dendrograms were created using R package “pvclust” [37]. The confidence levels for branches of the dendrograms were determined by calculating approximately unbiased (AU) p-values using multiscale bootstrap resampling based on 10,000 replications.

4.2. SSR Genotyping for PCR-CE

The SSR markers used in this study are listed in Table S1 and Table 2. For apple, 12 SSRs that were mainly tri- and tetranucleotide SSRs and that showed clear fragments in PCR-CE in prior analyses were used for genotyping [22,38,39,40,41]. The 10 SSRs for pear were similar to those developed in the study by Yamamoto et al. [42], which were composed of tetra- and pentanucleotide repeats. For tea, 15 SSRs previously developed and composed of tetra- and pentanucleotide repeats were used in this experiment [43,44]. BLAST+ was used to estimate the positions of the SSRs in each reference genome [29]. The recent reference genomes were mainly composed of pseudomolecules that covered most of the genes. Chromosome positions of markers were mapped easily to design and to select optimal marker sets in genetic studies. By using reference genomes, researchers can also conduct high through-put genotyping [17,18]. PCR amplification was performed in a 10-µL solution containing 5 µL of 2× Green GoTaq G2 Hot Start Master Mix (0.4 mM each dNTP, Taq DNA polymerase and 4 mM MgCl2, pH 8.5; Promega, Madison, WI, USA), 20 pmol of each forward primer labeled with a fluorescent dye (5-FAM, 5-HEX, 5-VIC or 5-NES) and unlabeled reverse primer, and 10 ng of genomic DNA. Amplification was performed in 35 cycles of 94 °C for 1 min, 55 °C for 1 min, and 72 °C for 2 min. PCR products were separated and detected with a 3130xl Genetic Analyzer or a SeqStudio Genetic Analyzer (Life Technologies, Carlsbad, CA, USA). The size of each amplified band was determined manually by comparison with a set of internal-standard DNA fragments (400HD ROX, Life Technologies) in GeneMapper software v. 5.0 (Life Technologies).

4.3. SSR Genotyping Using SSR-GBS

SSR-GBS was performed based on the methods described in previous reports with slight changes in sequence data analysis [25,34]. When constructing each library for SSR-GBS, two-step PCR was applied to add the Illumina adapter sequences that are required for Illumina flow-cell binding (Figure 3). The first PCR was performed using specific primers extended with the part of the Illumina adapters P5 (ACACTCTTTCCCTACACGACGCTCTTCCGATCT) and P7 (GTGACTGGAGTTCAGACGTGTGCTCTTCCGATC) as the forward and reverse primers, respectively. In the first replicate, the previously reported primers, consisting of 12-, 10- and 15-primer sets for apple, pear and tea, respectively, were used in a single multiplex reaction. For the second replicate of this experiment, we divided each primer set into 2 subsets, i.e., 6 primers × 2 for apple, 5 primers × 2 for pear and 7 and 8 primers for tea. PCR amplification was performed in a 10-µL reaction containing 5 µL QIAGEN Multiplex PCR Kit (QIAGEN), 0.2 µL primer solution (10 μM each of forward and reverse), 3.8 µL H2O, and 1 µL genomic DNA. The PCR was performed using the following steps: an initial denaturation at 95 °C for 15 min followed by 25 cycles of denaturation at 95 °C for 30 s, primer annealing at 55 °C for 1 min, and extension at 72 °C for 30 s and, finally, followed by a final extension at 72 °C of 10 min. The second PCR was performed using long primers P5 (AATGATACGGCGACCACCGAGATCTACAC[Index]ACACTCTTTCCCTACACGACG) and P7 (CAAGCAGAAGACGGCATACGAGAT[Index]GTGACTGGAGTTCAGACGTGT) in which Illumina flow-cell binding sites and two different indexes of 8 bp were contained. The primers used for this experiment are listed in Table S1. PCR amplification was performed in a 10-µL total volume consisting of 5 µL 2× Green GoTaq G2 Hot Start Master Mix (0.4 mM each dNTP, Taq DNA polymerase and 4 mM MgCl2, pH 8.5; Promega), 1 µL P5 and P7 primers (1 μM) 3 µL H2O and 1 µL of the first PCR products. PCR reactions included the following steps: an initial denaturation of 95 °C for 5 min followed by 15 cycles of 94 °C for 30 s, 60 °C for 1 min and 72 °C for 30 s. This was followed by a final extension of 10 min. All of the second PCR products were mixed equally in a single tube and purified using AMPure XP beads (Beckman Coulter, Inc., Bree, CA, USA) following the Agencourt AMPure XP PCR Purification protocol. The library was sequenced using PE 300-bp sequencing on an Illumina MiSeq platform (Illumina, Inc., San Diego, CA, USA).
The reads from Illumina MiSeq were demultiplexed to each variety based on the index sequences using the Illumina system, and the paired fastq files of each variety were obtained. We used flash2 [45] to merge the paired fastq files with parameter “-M 300 -× 0.5 —allow-outies” (described in the script ‘“1.combine.sh”). The merged reads were then demultiplexed based on primer sequences by using the script “2.demultiplex.sh”. The number of reads of each allele was counted for each variety by using the script “3.CountSSR.sh”. (These scripts are provided in Files S1, S2 and S3, respectively.) We took only the four most common alleles, and the allele frequencies of the four were calculated. Only the first and second alleles were used to determine the genotypes of varieties, but the third and fourth alleles helped in detecting the presence of a stutter band and the accuracy of the called genotype.
To construct a database useful for both SSR-GBS and PCR-CE, we thoroughly compared the genotypes obtained by SSR-GBS with those obtained by PCR-CE and vice versa. First, the markers that showed fewer than 50 average reads in SSR-GBS were discarded. The correspondence of each allele of each marker obtained by SSR-GBS to the alleles obtained by PCR-CE was confirmed manually to identify cases of allele dropping in SSR-GBS. If allele dropping was found with a marker, that marker was not included in the database for SSR-GBS.

4.4. Automated Genotyping in SSR-GBS and Repeatability

In previous studies of SSR-GBS, allele calling was performed based on whether the frequency of the first allele exceeded 0.9 or on manual evaluation [27]. However, each marker has different features such as stutter bands and base variations in the primer binding site, making it difficult to set a single value for all marker sets. Here we set the variable α, which was determined separately for each marker. If the frequency of the first (most common) allele exceeded α, we called the genotype a homozygote for the first allele; otherwise, we called it a heterozygote for the first and second alleles (described in the script ‘4.genotyping.sh’ provided in File S4). The range of α for each marker was determined based on the criterion that the genotypes identified by SSR-GBS and PCR-CE were exactly the same for each of the varieties. In other words, the α values were set so that the genotyping results obtained by SSR-GBS in an automated system would match those previously obtained using PCR-CE, in which genotyping was done by eye. As an example of file structure, the files used to designate the apple cultivars and primers in this pipeline are provided in Files S5 and S6, respectively.

Supplementary Materials

The following are available online at https://www.mdpi.com/article/10.3390/plants10122796/s1, Table S1: SSR markers used in the present study, Table S2: Genotypes determined by PCR-CE for 43 apple varieties, Table S3: Genotypes determined by PCR-CE for 29 pear varieties, Table S4: Genotypes determined by PCR-CE for 44 tea varieties, Table S5: Genotypes determined by SSR-GBS for 43 apple varieties, Table S6: Genotypes determined by SSR-GBS for 29 pear varieties, Table S7: Genotypes determined by SSR-GBS for 44 tea varieties, Figure S1: UPGMA dendrograms showing clustering based on simple allele sharing distance among (A) 44 apple, (B) 29 pear and (C) 44 tea varieties. The figures in red indicate an approximately unbiased (AU) p value that represents more accurate values of bootstrap probability. File S1: 1.combine.sh. Bash script for combining the pairs of fastq files, File S2: 2.demultiplex.sh. Bash script for demultiplexing based on primer sequences, File S3: 3.CountSSR.sh. Bash script for counting alleles detected in each variety, File S4: 4.genotyping.sh. Bash script for determining the genotypes automatically based on variable α, File S5: list_geno. List of apple varieties or IDs used in this study, File S6: list_primer. List of apple primers and variable α used in this study.

Author Contributions

Conceptualization, S.N. and Y.S.; methodology, S.N. and H.K.-K.; software, S.N. and H.K.-K.; validation, S.N., Y.T. and S.M.; formal analysis, F.T. and M.K.; resources, S.M., Y.S., M.K. and F.T.; data curation, S.M., M.K. and F.T.; writing—original draft preparation, S.N.; writing—review and editing, S.N.; visualization, S.N.; project administration, Y.S.; funding acquisition, Y.S. All authors have read and agreed to the published version of the manuscript.

Funding

This research received no external funding.

Institutional Review Board Statement

Not applicable.

Informed Consent Statement

Not applicable.

Data Availability Statement

The genotype data and the scripts used in this study are available in Supplementary files.

Acknowledgments

We thank Fumiko Hosaka for the technical support in genotyping and organizing experimental data.

Conflicts of Interest

The authors declare no conflict of interest.

References

  1. Luby, J.J.; Shaw, D.V. Does marker-assisted selection make dollars and sense in a fruit breeding program? HortScience 2001, 36, 872–879. [Google Scholar] [CrossRef]
  2. Janick, J. History of Fruit Breeding. Fruit Veg. Ceral Sci. Biotechnol. 2011, 5, 1–7. [Google Scholar]
  3. Saito, T. Advances in Japanese pear breeding in Japan. Breed. Sci. 2016, 66, 46–59. [Google Scholar] [CrossRef] [PubMed] [Green Version]
  4. Yamada, M.; Sato, A. Advances in table grape breeding in Japan. Breed. Sci. 2016, 66, 34–45. [Google Scholar] [CrossRef] [Green Version]
  5. Endo, T.; Fujii, H.; Yoshioka, T.; Omura, M.; Shimada, T. TaqMan-MGB SNP genotyping assay to identify 48 citrus cultivars distributed in the Japanese market. Breed. Sci. 2020, 70, 363–372. [Google Scholar] [CrossRef]
  6. Scribner, K.T.; Pearce, J.M. Microsatellites: Evolutionary and methodological background and empirical applications at individual, population, and phylogenetic levels. In Molecular Methods in Ecology; Blackwell Science Limited: London, UK, 2000; pp. 235–273. [Google Scholar]
  7. Sunnucks, P. Efficient genetic markers for population biology. Trends Ecol. Evol. 2000, 15, 199–203. [Google Scholar] [CrossRef]
  8. Ellegren, H. Microsatellites: Simple sequences with complex evolution. Nat. Rev. Genet. 2004, 5, 435–445. [Google Scholar] [CrossRef] [PubMed]
  9. Selkoe, K.A.; Toonen, R.J. Microsatellites for ecologists: A practical guide to using and evaluating microsatellite markers. Ecol. Lett. 2006, 9, 615–629. [Google Scholar] [CrossRef] [PubMed]
  10. Clayton, T.M.; Whitaker, J.P.; Sparkes, R.; Gill, P. Analysis and interpretation of mixed forensic stains using DNA STR profiling. Forensic Sci. Int. 1998, 91, 55–70. [Google Scholar] [CrossRef]
  11. Cipriani, G.; Spadotto, A.; Jurman, I.; Di Gaspero, G.; Crespan, M.; Meneghetti, S.; Frare, E.; Vignani, R.; Cresti, M.; Morgante, M. The SSR-based molecular profile of 1005 grapevine (Vitis vinifera L.) accessions uncovers new synonymy and parentages, and reveals a large admixture amongst varieties of different geographic origin. Theor. Appl. Genet. 2010, 121, 1569–1585. [Google Scholar] [CrossRef]
  12. Moriya, S.; Iwanami, H.; Okada, K.; Yamamoto, T.; Abe, K. A practical method for apple cultivar identification and parent-offspring analysis using simple sequence repeat markers. Euphytica 2011, 177, 135–150. [Google Scholar] [CrossRef]
  13. Sawamura, Y.; Takada, N.; Yamamoto, T.; Saito, T.; Kimura, T.; Kotobuki, K. Identification of parent-offspring relationships in 55 Japanese pear cultivars using S-RNase allele and SSR markers. J. Jpn. Soc. Hortic. Sci. 2008, 77, 364–373. [Google Scholar] [CrossRef] [Green Version]
  14. Kimura, T.; Shi, Y.Z.; Shoda, M.; Kotobuki, K.; Matsuta, N.; Hayashi, T.; Ban, Y.; Yamamoto, T. Identification of Asian pear varieties by SSR analysis. Breed. Sci. 2002, 52, 115–121. [Google Scholar] [CrossRef] [Green Version]
  15. Leigh, F.; Lea, V.; Law, J.; Wolters, P.; Powell, W.; Donini, P. Assessment of EST-and genomic microsatellite markers for variety discrimination and genetic diversity studies in wheat. Euphytica 2003, 133, 359–366. [Google Scholar] [CrossRef]
  16. Hosseinzadeh-Colagar, A.; Haghighatnia, M.J.; Amiri, Z.; Mohadjerani, M.; Tafrihi, M. Microsatellite (SSR) amplification by PCR usually led to polymorphic bands: Evidence which shows replication slippage occurs in extend or nascent DNA strands. Mol. Biol. Res. Commun. 2016, 5, 167. [Google Scholar]
  17. Elshire, R.J.; Glaubitz, J.C.; Sun, Q.; Poland, J.A.; Kawamoto, K.; Buckler, E.S.; Mitchell, S.E. A robust, simple genotyping-by-sequencing (GBS) approach for high diversity species. PLoS ONE 2011, 6, e19379. [Google Scholar] [CrossRef] [PubMed] [Green Version]
  18. Shirasawa, K.; Hirakawa, H.; Isobe, S. Analytical workflow of double-digest restriction site-associated DNA sequencing based on empirical and in silico optimization in tomato. DNA Res. 2016, 23, 145–153. [Google Scholar] [CrossRef] [PubMed] [Green Version]
  19. Du, F.K.; Xu, F.; Qu, H.; Feng, S.; Tang, J.; Wu, R. Exploiting the transcriptome of Euphrates Poplar, Populus euphratica (Salicaceae) to develop and characterize new EST-SSR markers and construct an EST-SSR database. PLoS ONE 2013, 8, e61337. [Google Scholar] [CrossRef] [Green Version]
  20. Dubey, H.; Rawal, H.C.; Rohilla, M.; Lama, U.; Kumar, P.M.; Bandyopadhyay, T.; Gogoi, M.; Singh, N.K.; Mondal, T.K. TeaMiD: A comprehensive database of simple sequence repeat markers of tea. Database 2020, 2020. [Google Scholar] [CrossRef] [PubMed]
  21. Nishio, S.; Takada, N.; Terakami, S.; Kato, H.; Inoue, H.; Takeuchi, Y.; Saito, T. Estimation of effective pollen dispersal distance for cross-pollination in chestnut orchards by microsatellite-based paternity analyses. Sci. Hortic. (Amsterdam) 2019, 250, 89–93. [Google Scholar] [CrossRef]
  22. Silfverberg-Dilworth, E.; Matasci, C.L.; Van de Weg, W.E.; Van Kaauwen, M.P.W.; Walser, M.; Kodde, L.P.; Soglio, V.; Gianfranceschi, L.; Durel, C.E.; Costa, F. Microsatellite markers spanning the apple (Malus x domestica Borkh.) genome. Tree Genet. Genomes 2006, 2, 202–224. [Google Scholar] [CrossRef] [Green Version]
  23. Matsuki, Y.; Isagi, Y.; Suyama, Y. The determination of multiple microsatellite genotypes and DNA sequences from a single pollen grain. Mol. Ecol. Notes 2007, 7, 194–198. [Google Scholar] [CrossRef]
  24. Suyama, Y. Procedure for single-pollen genotyping. In Single-Pollen Genotyping; Springer: Berlin/Heidelberg, Germany, 2011; pp. 7–15. [Google Scholar]
  25. Tibihika, P.D.; Curto, M.; Dornstauder-Schrammel, E.; Winter, S.; Alemayehu, E.; Waidbacher, H.; Meimberg, H. Application of microsatellite genotyping by sequencing (SSR-GBS) to measure genetic diversity of the East African Oreochromis niloticus. Conserv. Genet. 2019, 20, 357–372. [Google Scholar] [CrossRef] [Green Version]
  26. Šarhanová, P.; Pfanzelt, S.; Brandt, R.; Himmelbach, A.; Blattner, F.R. SSR-seq: Genotyping of microsatellites using next-generation sequencing reveals higher level of polymorphism as compared to traditional fragment size scoring. Ecol. Evol. 2018, 8, 10817–10833. [Google Scholar] [CrossRef]
  27. Curto, M.; Winter, S.; Seiter, A.; Schmid, L.; Scheicher, K.; Barthel, L.M.F.; Plass, J.; Meimberg, H. Application of a SSR-GBS marker system on investigation of European Hedgehog species and their hybrid zone dynamics. Ecol. Evol. 2019, 9, 2814–2832. [Google Scholar] [CrossRef] [PubMed] [Green Version]
  28. Zhan, L.; Paterson, I.G.; Fraser, B.A.; Watson, B.; Bradbury, I.R.; Nadukkalam Ravindran, P.; Reznick, D.; Beiko, R.G.; Bentzen, P. MEGASAT: Automated inference of microsatellite genotypes from sequence data. Mol. Ecol. Resour. 2017, 17, 247–256. [Google Scholar] [CrossRef] [Green Version]
  29. Camacho, C.; Coulouris, G.; Avagyan, V.; Ma, N.; Papadopoulos, J.; Bealer, K.; Madden, T.L. BLAST+: Architecture and applications. BMC Bioinform. 2009, 10, 1–9. [Google Scholar] [CrossRef] [PubMed] [Green Version]
  30. Daccord, N.; Celton, J.M.; Linsmith, G.; Becker, C.; Choisne, N.; Schijlen, E.; Van de Geest, H.; Bianco, L.; Micheletti, D.; Velasco, R. High-quality de novo assembly of the apple genome and methylome dynamics of early fruit development. Nat. Genet. 2017, 49, 1099–1106. [Google Scholar] [CrossRef]
  31. Shirasawa, K.; Itai, A.; Isobe, S. Chromosome-scale genome assembly of Japanese pear (Pyrus pyrifolia) variety ‘Nijisseiki’. DNA Res. 2021, 28. [Google Scholar] [CrossRef]
  32. Wei, C.; Yang, H.; Wang, S.; Zhao, J.; Liu, C.; Gao, L.; Xia, E.; Lu, Y.; Tai, Y.; She, G. Draft genome sequence of Camellia sinensis var. sinensis provides insights into the evolution of the tea genome and tea quality. Proc. Natl. Acad. Sci. USA 2018, 115, E4151–E4158. [Google Scholar] [CrossRef] [PubMed] [Green Version]
  33. Darby, B.J.; Erickson, S.F.; Hervey, S.D.; Ellis-Felege, S.N. Digital fragment analysis of short tandem repeats by high-throughput amplicon sequencing. Ecol. Evol. 2016, 6, 4502–4512. [Google Scholar] [CrossRef] [PubMed] [Green Version]
  34. Neophytou, C.; Torutaeva, E.; Winter, S.; Meimberg, H.; Hasenauer, H.; Curto, M. Analysis of microsatellite loci in tree of heaven (Ailanthus altissima (Mill.) Swingle) using SSR-GBS. Tree Genet. Genomes 2018, 14, 82. [Google Scholar] [CrossRef] [Green Version]
  35. Lepais, O.; Chancerel, E.; Boury, C.; Salin, F.; Manicki, A.; Taillebois, L.; Dutech, C.; Aissi, A.; Bacles, C.F.E.; Daverat, F. Fast sequence-based microsatellite genotyping development workflow. PeerJ 2020, 8, e9085. [Google Scholar] [CrossRef]
  36. Bornman, D.M.; Hester, M.E.; Schuetter, J.M.; Kasoji, M.D.; Minard-Smith, A.; Barden, C.A.; Nelson, S.C.; Godbold, G.D.; Baker, C.H.; Yang, B.; et al. Short-read, high-throughput sequencing technology for STR genotyping. Biotech. Rapid Dispatches 2012, 2012, 1–6. [Google Scholar] [CrossRef]
  37. Suzuki, R.; Shimodaira, H. Pvclust: An R package for assessing the uncertainty in hierarchical clustering. Bioinformatics 2006, 22, 1540–1542. [Google Scholar] [CrossRef] [PubMed]
  38. Celton, J.-M.; Tustin, D.S.; Chagné, D.; Gardiner, S.E. Construction of a dense genetic linkage map for apple rootstocks using SSRs developed from Malus ESTs and Pyrus genomic sequences. Tree Genet. Genomes 2009, 5, 93–107. [Google Scholar] [CrossRef]
  39. Kunihisa, M.; Moriya, S.; Abe, K.; Okada, K.; Haji, T.; Hayashi, T.; Kim, H.; Nishitani, C.; Terakami, S.; Yamamoto, T. Identification of QTLs for fruit quality traits in Japanese apples: QTLs for early ripening are tightly related to preharvest fruit drop. Breed. Sci. 2014, 64, 240–251. [Google Scholar] [CrossRef] [Green Version]
  40. Liebhard, R.; Gianfranceschi, L.; Koller, B.; Ryder, C.D.; Tarchini, R.; Van de Weg, E.; Gessler, C. Development and characterisation of 140 new microsatellites in apple (Malus x domestica Borkh.). Mol. Breed. 2002, 10, 217–241. [Google Scholar] [CrossRef]
  41. Van Dyk, M.M.; Soeker, M.K.; Labuschagne, I.F.; Rees, D.J.G. Identification of a major QTL for time of initial vegetative budbreak in apple (Malus x domestica Borkh.). Tree Genet. Genomes 2010, 6, 489–502. [Google Scholar] [CrossRef] [Green Version]
  42. Yamamoto, T.; Terakami, S.; Hosaka, F.; Fujii, H.; Kunihisa, M.; Takada, N.; Saito, T.; Nishitani, C. DNA profiling of Japanese pear cultivars by SSR markers with tetra- and penta-nucleotide motifs. DNA Polymorph. 2021, 20, 58–61. (In Japanese) [Google Scholar]
  43. Ma, J.; Zhou, Y.; Ma, C.; Yao, M.; Jin, J.; Wang, X.; Chen, L. Identification and characterization of 74 novel polymorphic EST-SSR markers in the tea plant, Camellia sinensis (Theaceae). Am. J. Bot. 2010, 97, e153–e156. [Google Scholar] [CrossRef]
  44. Tan, L.Q.; Wang, L.Y.; Wei, K.; Zhang, C.C.; Wu, L.Y.; Qi, G.N.; Cheng, H.; Zhang, Q.; Cui, Q.M.; Liang, J.B. Floral transcriptome sequencing for SSR marker development and linkage map construction in the tea plant (Camellia sinensis). PLoS ONE 2013, 8, e81611. [Google Scholar]
  45. Magoč, T.; Salzberg, S.L. FLASH: Fast length adjustment of short reads to improve genome assemblies. Bioinformatics 2011, 27, 2957–2963. [Google Scholar] [CrossRef]
Figure 1. Allele frequencies, genotypes and digital fragments of Hi22d06 in ‘Akane’ and ‘Akibae’ obtained by SSR-GBS. The first alleles and second alleles were indicated in red and blue, respectively.
Plants 10 02796 g001
Figure 2. Comparisons of alleles detected by PCR-CE and SSR-GBS in apple (a), pear (b) and tea (c). The alleles’ length (bp) detected in capillary electrophoresis was compared against digital allele length in SSR-GBS.
Plants 10 02796 g002
Figure 3. Summary of SSR-GBS procedure used in this study. Green indicates the SSR being amplified, with SSR primer annealing sequences (red) on each end. A different set of indexes (orange) is added to each sample to allow the sequences from that sample to be distinguished after multiplexing. The sequences of P5 flow cell binding, P5 sequence primer, P7 flow cell binding and P7 sequence primer were AATGATACGGCGACCACCGAGATCTACAC, ACACTCTTTCCCTACACGACG, CAAGCAGAAGACGGCATACGAGAT and GTGACTGGAGTTCAGACGTGT, respectively.
Plants 10 02796 g003
Table 1. ID numbers, variety names and accession numbers for the 116 varieties used in this study, including 43 apple, 29 pear and 44 tea varieties.
ApplePearTea
IDVarietyAccession
no. a
IDVarietyAccession
no. a
IDVarietyAccession
no. a
APPLE01AkaneJP169082PEAR01AkiakariJP118536TEA01RyofuNA
APPLE02AkibaeNAPEAR02AkizukiJP118538TEA02Cha Chukanbohon No 3NA
APPLE03IwakamiJP114453PEAR03AtagoJP113570TEA03HarumidoriNA
APPLE04IndoJP169681PEAR04AmanogawaJP113562TEA04SofuNA
APPLE05OrinJP172644PEAR05OushuuJP118539TEA05Cha Chukanbohon No 4JP232165
APPLE06OzenokurenaiNAPEAR06OkusankichiJP113634TEA06Cha Chukanbohon No 5JP232219
APPLE07GalaJP114085PEAR07NatsushizukuJP230439TEA07Cha Chukanbohon No 6NA
APPLE08KioNAPEAR08KumoiJP113623TEA08Sun RougeNA
APPLE09KizashiJP114525PEAR09KousuiJP113619TEA09ShuntaroNA
APPLE10KitakamiJP114148PEAR10ShuugyokuJP113707TEA10SaeakariNA
APPLE11KitaroNAPEAR11ShuureiJP118537TEA11NanmeiNA
APPLE12KinseiJP172634PEAR12ShinkouJP113657TEA12SeimeiNA
APPLE13JonathanJP169679PEAR13ShinsuiJP113660TEA13SayamakaoriNA
APPLE14KotaroNAPEAR14ShinseiJP113694TEA14YabukitaJP168695
APPLE15Golden DeliciousJP116722PEAR15SuiseiJP113665TEA15AsatsuyuNA
APPLE16SansaJP114526PEAR16ChikusuiJP113716TEA16OkumidoriNA
APPLE17SantaroNAPEAR17ChoujuurouJP113574TEA17KanayamidoriNA
APPLE18Shinano SweetNAPEAR18NiitakaJP113630TEA18SaemidoriJP171014
APPLE19JonagoldJP172630PEAR19NijisseikiJP113631TEA19YutakamidoriJP168749
APPLE20SensyuJP114288PEAR20HakkouJP113585TEA20KiyokaNA
APPLE21ChinatsuNAPEAR21HayatamaJP113591TEA21MK5601NA
APPLE22TsugaruJP172651PEAR22HougetsuJP113720TEA22KanaemaruNA
APPLE23DeliciousJP114041PEAR23HousuiJP113598TEA23Yachaken01NA
APPLE24HatsuakiJP169705PEAR24YasatoJP113718TEA24Yachaken02NA
APPLE25HimekamiJP169714PEAR25HatsumaruNATEA25Yachaken09NA
APPLE26FujiJP114078PEAR26RinkaNATEA26Yachaken10NA
APPLE27HokutoJP169715PEAR27HoshiakariNATEA27Kokken01NA
APPLE28MaypoleNAPEAR28NarumiNATEA28Danshin37NA
APPLE29Mori-no-kagayakiNAPEAR29KantaNATEA29Miyazaki39NA
APPLE30YokoJP114416 TEA30Miyazaki40NA
APPLE31Ruby SweetNA TEA31OkuharukaNA
APPLE32Rose PearlNA TEA32Kirari31NA
APPLE33JM1NA TEA33SainomidoriNA
APPLE34JM2NA TEA34SakimidoriNA
APPLE35JM5NA TEA35NagomiyutakaNA
APPLE36JM7NA TEA36Haruto34NA
APPLE37JM8NA TEA37HarunonagoriNA
APPLE38Morioka 66NA TEA38HarumoegiNA
APPLE39BeniminoriNA TEA39MiyamakaoriNA
APPLE40Morioka 68NA TEA40MusashikaoriNA
APPLE41Morioka 69NA TEA41YumekaoriNA
APPLE42KinshuNA TEA42YumewakabaNA
APPLE43Morioka 71NA TEA43BenifukiNA
TEA44SayamaakariNA
a Accession no. for NARO Genebank (www.gene.affrc.go.jp). NA means that the variety is not registered in NARO Genebank.
Table 2. Number of alleles, observed and expected heterozygosity and polymorphism information content of the SSR loci determined by PCR-CE.
MarkerPlantNo. of AllelesHOHEPIC
CH01b09b aApple30.590.670.52
Hi08h08Apple30.560.540.47
Hi09f01Apple40.790.630.57
Hi15h12Apple30.260.290.26
Hi22d06Apple50.790.740.69
Mdo.chr1.18Apple50.630.640.57
NZmsCN943067Apple50.610.510.46
NZmsEB116209Apple30.700.660.58
NzmsEB119405 aApple40.520.610.48
NzmsEB146613Apple30.740.630.56
SamsCN944528Apple50.650.610.55
SamsEB132187Apple30.650.600.52
Averages for apple markers 3.80.620.590.52
TsuGNH124Pear20.550.490.37
TsuGNH161Pear30.620.600.52
TsuGNH164 aPear30.570.410.49
TsuGNH179Pear30.830.590.52
TsuGNH184 aPear20.500.480.37
TsuGNH194Pear20.350.370.30
TsuGNH204Pear20.030.030.03
TsuGNH207Pear20.280.240.21
TsuGNH208Pear30.450.520.46
TsuGNH250Pear20.410.330.27
Averages for pear markers 2.40.460.410.35
CsFM1097Tea40.430.490.45
CsFM1206Tea30.500.570.50
CsFM1566Tea40.610.490.45
CsFM1595 aTea50.620.630.57
MSE0348Tea50.710.610.56
MSE0354 aTea40.640.800.57
TM043 aTea50.450.460.40
TM107Tea60.800.690.64
TM336 aTea30.350.300.31
TM348Tea50.640.590.51
TM350 aTea40.360.360.33
TM464 aTea70.510.570.45
TM485Tea30.390.350.30
TM553Tea30.800.500.39
TM626Tea40.550.460.41
Averages for tea markers 4.30.560.520.46
HO = Observed heterozygosity, HE = Expected heterozygosity, PIC = Polymorphism information content, a This marker was not suitable for SSR-GBS because of the presence of allele dropout.
Table 3. Summary of each marker tested for SSR-GBS. Average depth indicates the number of the reads obtained after demultiplexing based on forward and reverse primer sequences in each marker. Replicated analyses with a slight change in the multiplex PCR set were conducted for validation.
MarkerPlantAverage
Depth
(Number of Reads)
Average
Depth
in Replicate Analysis
Difference in Size from
the Alleles in PCR-CE (bp)
Result in SSR-GBS
CH01b09bApple683457241Errors due to stutter band in ‘Jonathan’ and ‘Sensyu’
Hi08h08Apple3424701Comparable to the result of PCR-CE
Hi09F01Apple395605−4Comparable to the result of PCR-CE
Hi15h12Apple532943310Comparable to the result of PCR-CE
Hi22d06Apple361140703Comparable to the result of PCR-CE
Mdo.chr1.18Apple12061108−2Comparable to the result of PCR-CE
NZmsCN943067Apple1777994−3Comparable to the result of PCR-CE
NZmsEB116209Apple7475343Comparable to the result of PCR-CE
NZmsEB119405Apple244224811Allele dropout was observed in ‘JM1’, ‘JM2’, ‘JM5’, ‘JM8’
NZmsEB146613Apple802346361Comparable to the result of PCR-CE
SAmsCN944528Apple62494003−1Comparable to the result of PCR-CE
SAmsEB132187Apple66214034−3Comparable to the result of PCR-CE
TsuGNH124Pear75760−2Comparable to the result of PCR-CE
TsuGNH161Pear16,75823,8072Comparable to the result of PCR-CE
TsuGNH164Pear7161682−3The read depths were too low to determine genotype in ‘Oushuu’
TsuGNH179Pear16714622−3Comparable to the result of PCR-CE
TsuGNH184Pear21116−1The read depths were too low to determine genotypes
TsuGNH194Pear25,40612,8431Comparable to the result of PCR-CE
TsuGNH204Pear38771957−2Comparable to the result of PCR-CE
TsuGNH207Pear271812312Comparable to the result of PCR-CE
TsuGNH208Pear73483735−1Comparable to the result of PCR-CE
TsuGNH250Pear50212847−2Comparable to the result of PCR-CE
CsFM1097Tea12171868−4Comparable to the result of PCR-CE
CsFM1206Tea12591396−2Comparable to the result of PCR-CE
CsFM1566Tea8571174−1Comparable to the result of PCR-CE
CsFM1595Tea1952680The read depths were too low to determine genotype in ‘Cha Chukanbohon No. 6’
MSE0348Tea358025590Comparable to the result of PCR-CE
MSE0354Tea10,51087831Allele dropout was observed in some varieties
TM043Tea346925280Allele dropout was observed in some varieties
TM107Tea22491645−3Comparable to the result of PCR-CE
TM336Tea14121The read depths were too low to determine genotypes
TM348Tea691577−2Comparable to the result of PCR-CE
TM350Tea514357−3Allele dropout was observed in some varieties
TM464Tea5463710Allele dropout was observed in some varieties
TM485Tea23652947−2Comparable to the result of PCR-CE
TM553Tea680082850Comparable to the result of PCR-CE
TM626Tea160522880Comparable to the result of PCR-CE
Table 4. Optimum range of variable α and correlation of first-allele frequency between the two replicates for each marker. The range of α for each marker was determined based on the criterion that the genotypes identified by SSR-GBS and PCR-CE were exactly the same for each of the varieties.
MarkerPlantMinimum Value of αOptimum Value of αMaximum Value of αCorrelation of
First-Allele Frequency
between Two Replicates
Hi08h08Apple0.450.570.690.98
Hi09F01Apple0.690.800.900.98
Hi15h12Apple0.340.430.520.98
Hi22d06Apple0.570.740.901.00
Mdo.chr1.18Apple0.600.610.610.98
NZmsCN943067Apple0.570.660.740.99
NZmsEB116209Apple0.550.700.840.99
NZmsEB146613Apple0.580.730.871.00
SAmsCN944528Apple0.640.780.910.99
SAmsEB132187Apple0.760.820.881.00
TsuGNH124Pear0.520.600.670.97
TsuGNH161Pear0.530.730.931.00
TsuGNH179Pear0.890.930.970.99
TsuGNH194Pear0.530.750.961.00
TsuGNH204Pear0.430.620.800.99
TsuGNH207Pear0.530.750.971.00
TsuGNH208Pear0.870.890.910.99
TsuGNH250Pear0.530.750.971.00
CsFM1097Tea0.550.710.870.99
CsFM1206Tea0.630.770.901.00
CsFM1566Tea0.710.830.950.99
MSE0348Tea0.730.850.970.99
TM107Tea0.720.850.980.98
TM348Tea0.610.770.930.99
TM485Tea0.720.840.961.00
TM553Tea0.870.920.971.00
TM626Tea0.730.850.971.00
Publisher’s Note: MDPI stays neutral with regard to jurisdictional claims in published maps and institutional affiliations.

