Article

Microtensiometers Accurately Measure Stem Water Potential in Woody Perennials

1
Tree Fruit Research and Extension Center, Washington State University, Wenatchee, WA 98801, USA
2
Department of Horticulture, Washington State University, Pullman, WA 99164, USA
*
Author to whom correspondence should be addressed.
Plants 2021, 10(12), 2780; https://doi.org/10.3390/plants10122780
Submission received: 17 November 2021 / Revised: 3 December 2021 / Accepted: 12 December 2021 / Published: 16 December 2021

Abstract

:
Stem water potential (Ψstem) is considered to be the standard measure of plant water status. However, it is measured with the pressure chamber (PC), an equipment that can neither provide continuous information nor be automated, limiting its use. Recent developments of microtensiometers (MT; FloraPulse sensors), which can continuously measure water tension in woody tissue of the trunk of the tree, can potentially highlight the dynamic nature of plant water relations. Thus, this study aimed to validate and assess the usefulness of the MT by comparing the Ψstem provided by MT with those same measurements from the PC. Here, two irrigation treatments (a control and a deficit treatment) were applied in a pear (Pyrus communis L.) orchard in Washington State (USA) to capture the full range of water potentials in this environment. Discrete measurements of leaf gas exchange, canopy temperature and Ψstem measured with PC and MT were made every two hours for four days from dawn to sunset. There were strong linear relationships between the Ψstem-MT and Ψstem-PC (R2 > 0.8) and with vapor pressure deficit (R2 > 0.7). However, Ψstem-MT was more variable and lower than Ψstem-PC when Ψstem-MT was below −1.5 MPa, especially during the evening. Minimum Ψstem-MT occurred later in the afternoon compared to Ψstem-PC. Ψstem showed similar sensitivity and coefficients of variation for both PC and MT acquired data. Overall, the promising results achieved indicated the potential for MT to be used to continuously assess tree water status.

Graphical Abstract

1. Introduction

Precision agriculture technologies are necessary to improve labor and natural resource-use efficiency. Many tree-fruit-producing regions require irrigation water to be profitable. [1]. Advances in soil water-based irrigation scheduling have improved irrigation scheduling based on climatic conditions, reference evapotranspiration, and crop coefficients [2,3]. However, there is uncertainty about making irrigation decisions without directly measuring the tree, considering temporal and spatial variability in weather and soil present in agricultural systems. Consequently, the use of plant-based indicators that directly measure tree water status represents a significant step towards precision irrigation to avoid undesirable water stress, which may penalize fruit quality and yield, but also overwatering which can waste limited resources and soil nutrients while increasing costs [4]. Among all the plant-based water status indicators, stem water potential (Ψstem) is considered one of the most accurate plant-based water status measures for fruit trees and vines [5]. Stem water potential is the direct measure of the tree water status by measuring the water tension within the plant (MPa). It is traditionally used as the reference to compare against other water status indicators [6]. Currently, the main limitation of Ψstem is the time required to make measurements. To measure Ψstem, a healthy, non-sun-exposed leaf located close to the trunk needs to be covered with black polyethylene plastic and aluminum foil for two hours to limit transpiration to allow leaf water potential to reach an equilibrium with Ψstem [7]. It is a temporally discrete, labor-demanding, destructive measurement and requires a Scholander pressure chamber (PC) [8]. The pressure chamber measures the water potential by applying pressurized gas to a chamber where the excised leaf is placed with the petiole extending outside the sealed chamber [9]. The chamber measures the amount of pressure required to force sap to pool at the end of the petiole. Higher pressure requirements inside the chamber (e.g., 1.5 MPa) indicate that water inside the plant tissue is strongly retained, so the water potential of the plant is lower [10]. Low Ψstem values are related to low sap-flow velocities and can be caused by low soil moisture [11]. Thus, soil water deficit, as well as other environmental factors, has been reported to affect the development of vascular tissues such as the xylem vessels of the tree, decreasing its density, which modifies tree water movement through the trunk and decreases stem water potential [12].
Knowing that the pressure chamber cannot continuously measure Ψstem, and with the aim of continuously monitoring tree water status, other continuous plant-based indicators such as those derived from the trunk diameter fluctuations [13], sap flow [14], leaf turgor pressure [15], or canopy thermal index [16] have been developed. However, despite the development of these continuous measures, commercial implementation has been limited, mainly by their price and the difficult process of data interpretation. Other sensors have been more recently developed such as time and frequency domain reflectometry sensors that measure tree stem water content [17], but their use is even more limited and they have not been yet compared to other commonly used water status indicators such as Ψstem.
In this sense, microtensiometers (MT) appear as an option for continuous monitoring of water status. Microtensiometers measure water potential based on a microelectromechanical pressure sensor that can do in situ measurements [18]. They are embedded in the trunk and directly measure stem water potential. This is a promising method for stem water potential determination, as it can be automated providing continuous data in easy-to-interpret pressure units such as traditional pressure chamber stem water potential methods. However, there is no information available comparing the stem water potential measurements of the microtensiometers with other well-known tree water status indicators under field conditions and how it relates to functional physiology measures for woody perennial trees. In this sense, the scarce information currently available on microtensiometers is focused on vines, and for Ψstem values higher than −1.0 MPa [19].
We hypothesized that microtensiometers can provide sensitive, stable, and accurate stem water potential measurements, and we sought to know if they can be used within a wide range of environmental and soil water conditions. Thus, the aim of this study was to validate the use of microtensiometers as plant-based water status sensors and compare stem water potential values acquired from microtensiometers with those values measured with the pressure chamber across different irrigation strategies, times throughout the day, and days with different environmental conditions. To our knowledge, this is the first report that shows MT response to different environmental and soil water content situations and compares these results with those taken by traditional discrete plant-based water status indicators in mature, field-grown pear trees.

2. Results

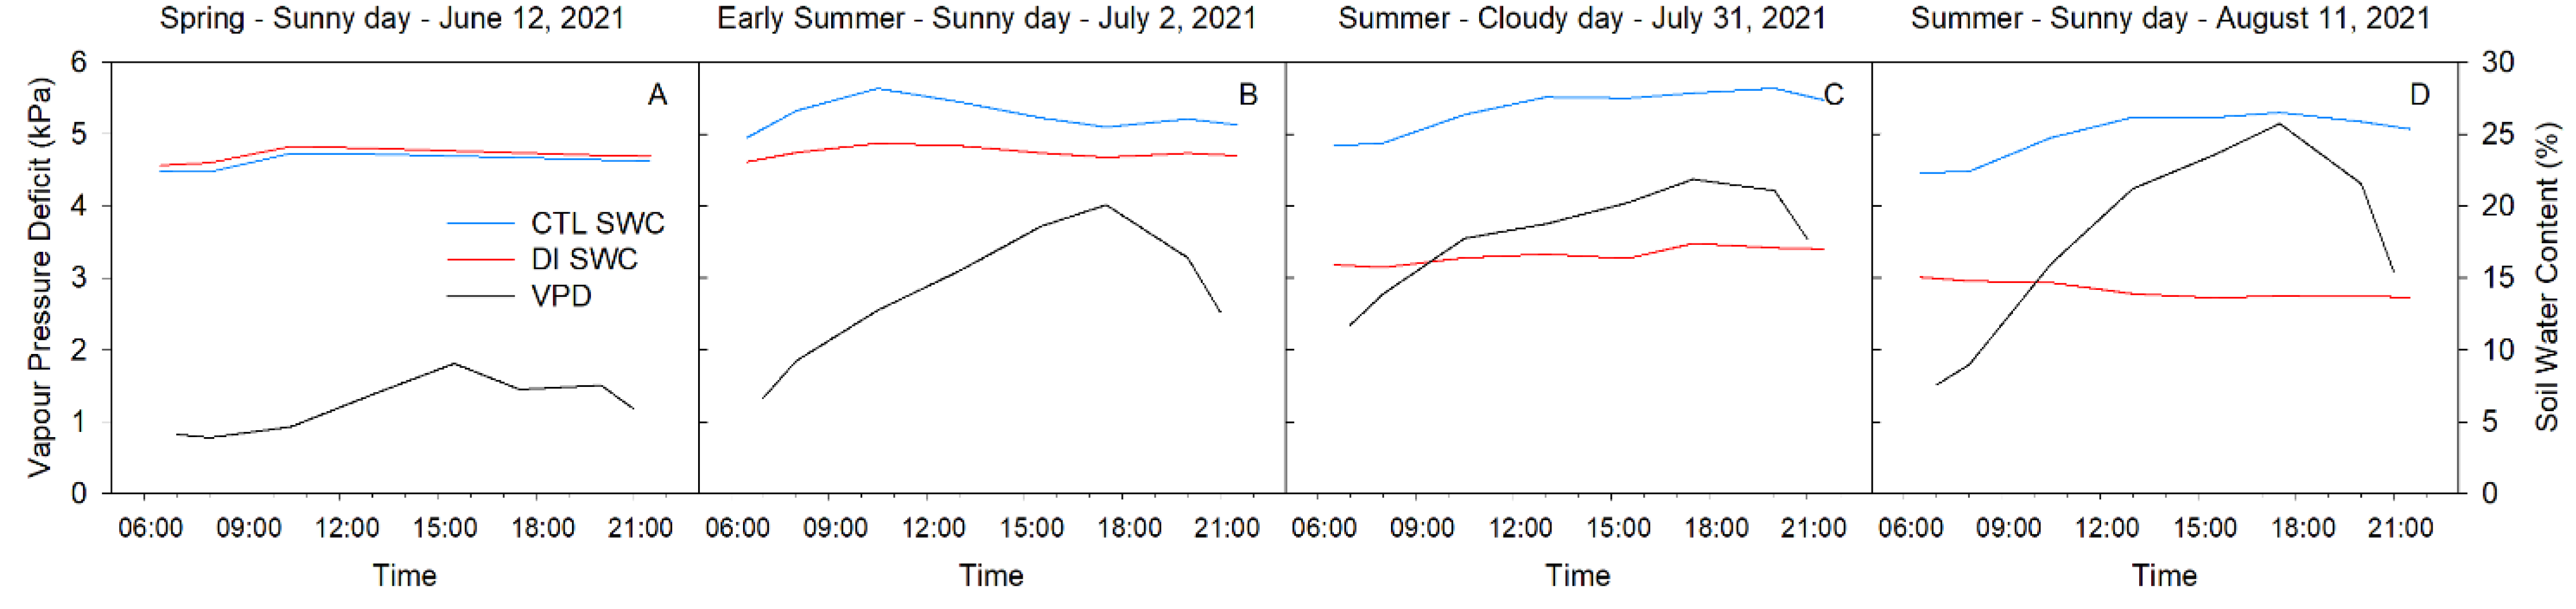
2.1. Weather and Soil Conditions

The meteorological conditions, as well as the soil water content, were different each selected day. However, overall, the daily pattern of variables such as air temperature and vapor pressure deficit (VPD) followed a similar trend with daily maximum and minimum values during the afternoon (16:00 h) and the sunrise (06:00 h), respectively. Reference evapotranspiration was lowest on 12 June 2021 (ET0 = 6.02 mm) and was characterized by mean air temperature and VPD values of 19.3 °C and 1.34 kPa (Figure 1A). Atmospheric demand was higher for the other three days, and the mean air temperature and VPD were 27.5 °C and 2.68 kPa on 2 July (ET0 = 10.16 mm; Figure 1B), 31.2 °C and 3.23 kPa on 31 July (ET0 = 7.62 mm; Figure 1C), and 30.6 °C and 3.25 kPa on 11 August (ET0 = 8.13 mm; Figure 1D). These days represent a range in environmental conditions present during the summer in a hot, semi-arid environment.
Photosynthetically active radiation (PAR) was similar for the three sunny days (12 June, 2 July and 11 August) with maximum values above 1500 µmol m−2 s−1. They were all greater than the cloudy day (31 July) when the maximum PAR values were below 900 µmol m−2 s−1.
Soil water content (SWC) was strongly influenced by the irrigation strategy applied. On 12 June, both treatments (CTL and DI) were equally irrigated to satisfy tree water requirements (100% ETc), so consequently, both treatments were the same (Figure 1A). However, from June 28th onwards, trees from the DI treatment were irrigated to satisfy 50% of the ETc. As such, there were strong differences in soil water content between treatments (Figure 1B–D). SWC was similar for all the selected days in the CTL treatment with daily mean values that ranged between 23 and 28%. However, daily mean SWC values for DI trees were 23% on 2 July, 16% on 31 July, and 14% on 11 August, which showed the progressive depletion of soil water content under trees where DI was applied.

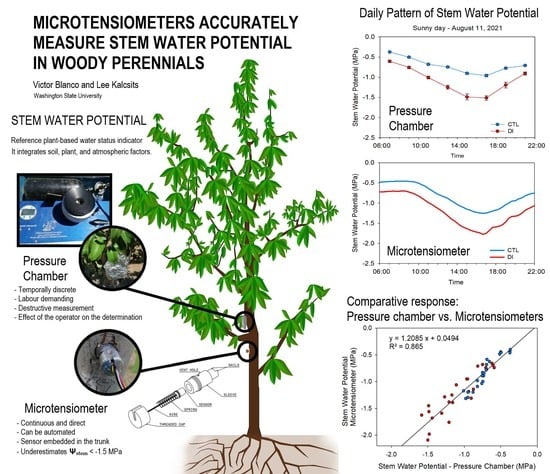
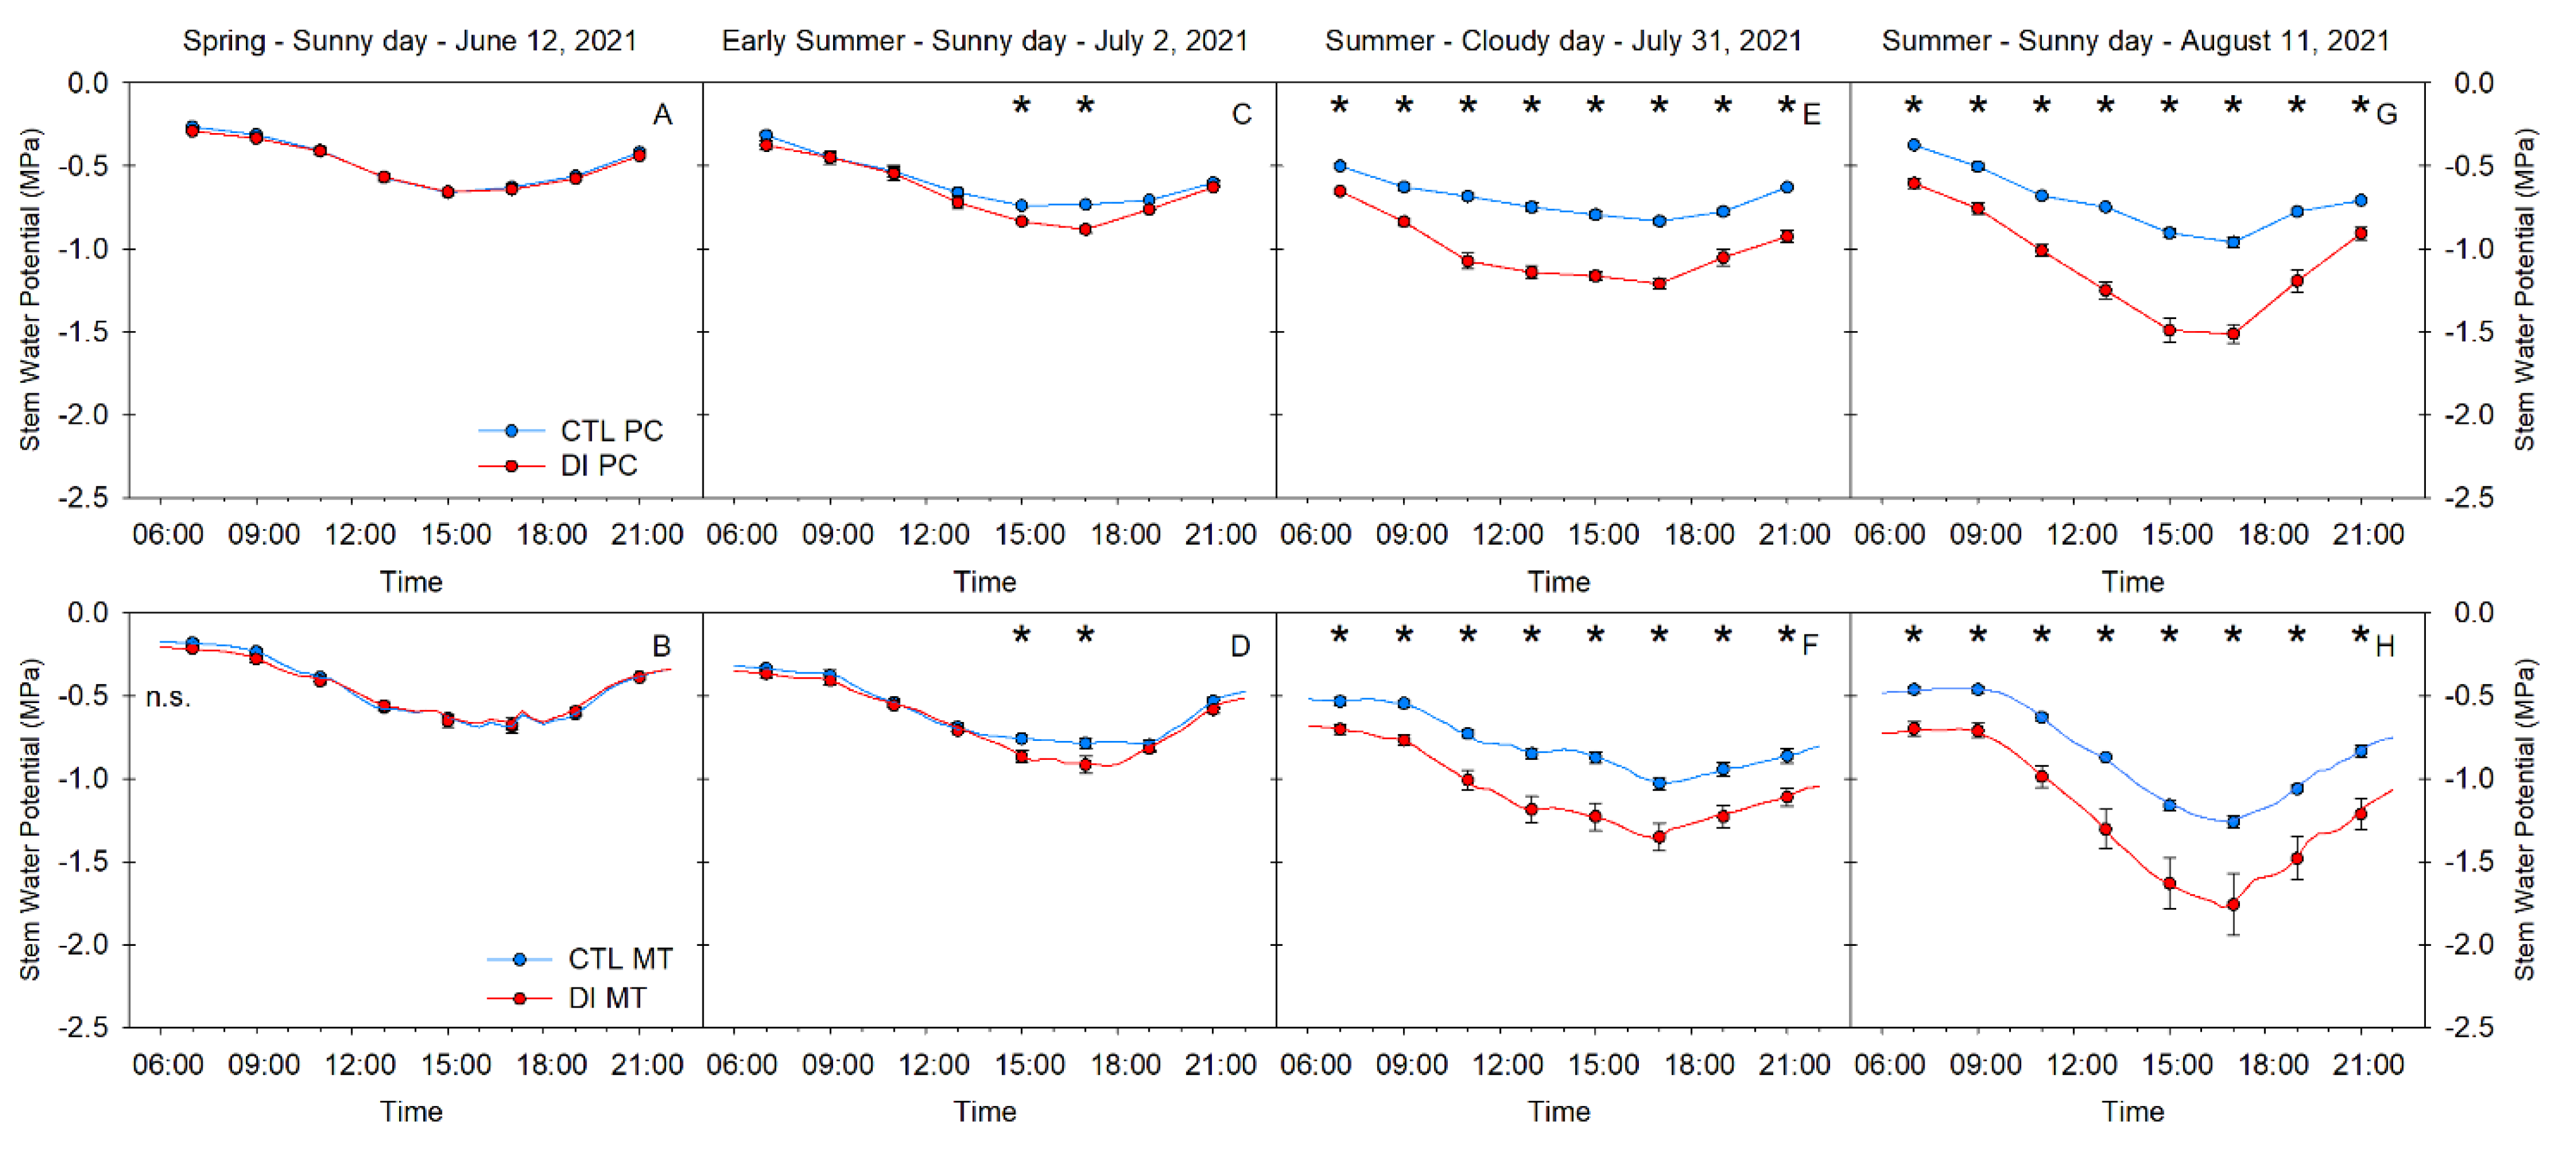
2.2. Stem Water Potential. Diurnal Pattern

Ψstem measured by both the pressure chamber and the microtensiometers was similarly diurnal for all four days of study and was clearly influenced by the environment. Ψstem was correlated with VPD. As evaporative demand increased, Ψstem decreased, reaching the daily minimum value in the early afternoon, after midday, when the VPD reached its maximum value. Once VPD values gradually decreased during the evening, Ψstem continued to recover (Figure 2). Ψstem for CTL trees was highly dependent on atmospheric demand rather than soil moisture. For example, on days with VPD values higher than 5 kPa, Ψstem for CTL trees was greater than −0.90 MPa measured with the pressure chamber and higher than −1.20 MPa when they were measured with microtensiometers (Figure 2G,H).
On the other hand, Ψstem for trees with DI applied, which were under soil water restrictions during the summer (2 July, 31 July, and 11 August), showed minimum values which became progressively more negative during the season due to the combination of high evaporative demand and low water availability in the soil. Daily minimum Ψstem for trees with DI applied decreased from −0.8 MPa on 2 July (Figure 2C,D) to values ranging between −1.5 and −2.0 MPa on 11 August (Figure 2G,H). Similarly, maximum daily Ψstem for trees with DI applied gradually decreased from −0.35 MPa (2 July) to −0.65 MPa (11 August), which indicated that these trees were water-stressed and water status was not able to fully recover during the night.
Ψstem was a sensitive tree water status indicator that was able to distinguish between irrigation treatments. Ψstem was significantly different between irrigation treatments for all the measurements taken on 31 July and 11 August (Figure 2E–H). However, on 2 July, only the early afternoon stem water potential was significantly different between irrigation treatments five days after imposing the deficit irrigation (Figure 2C,D). Both methods of measuring Ψstem were able to differentiate between the two irrigation treatments. Moreover, they showed significant differences on the same day and at the same time, further supporting the agreement between both methods.

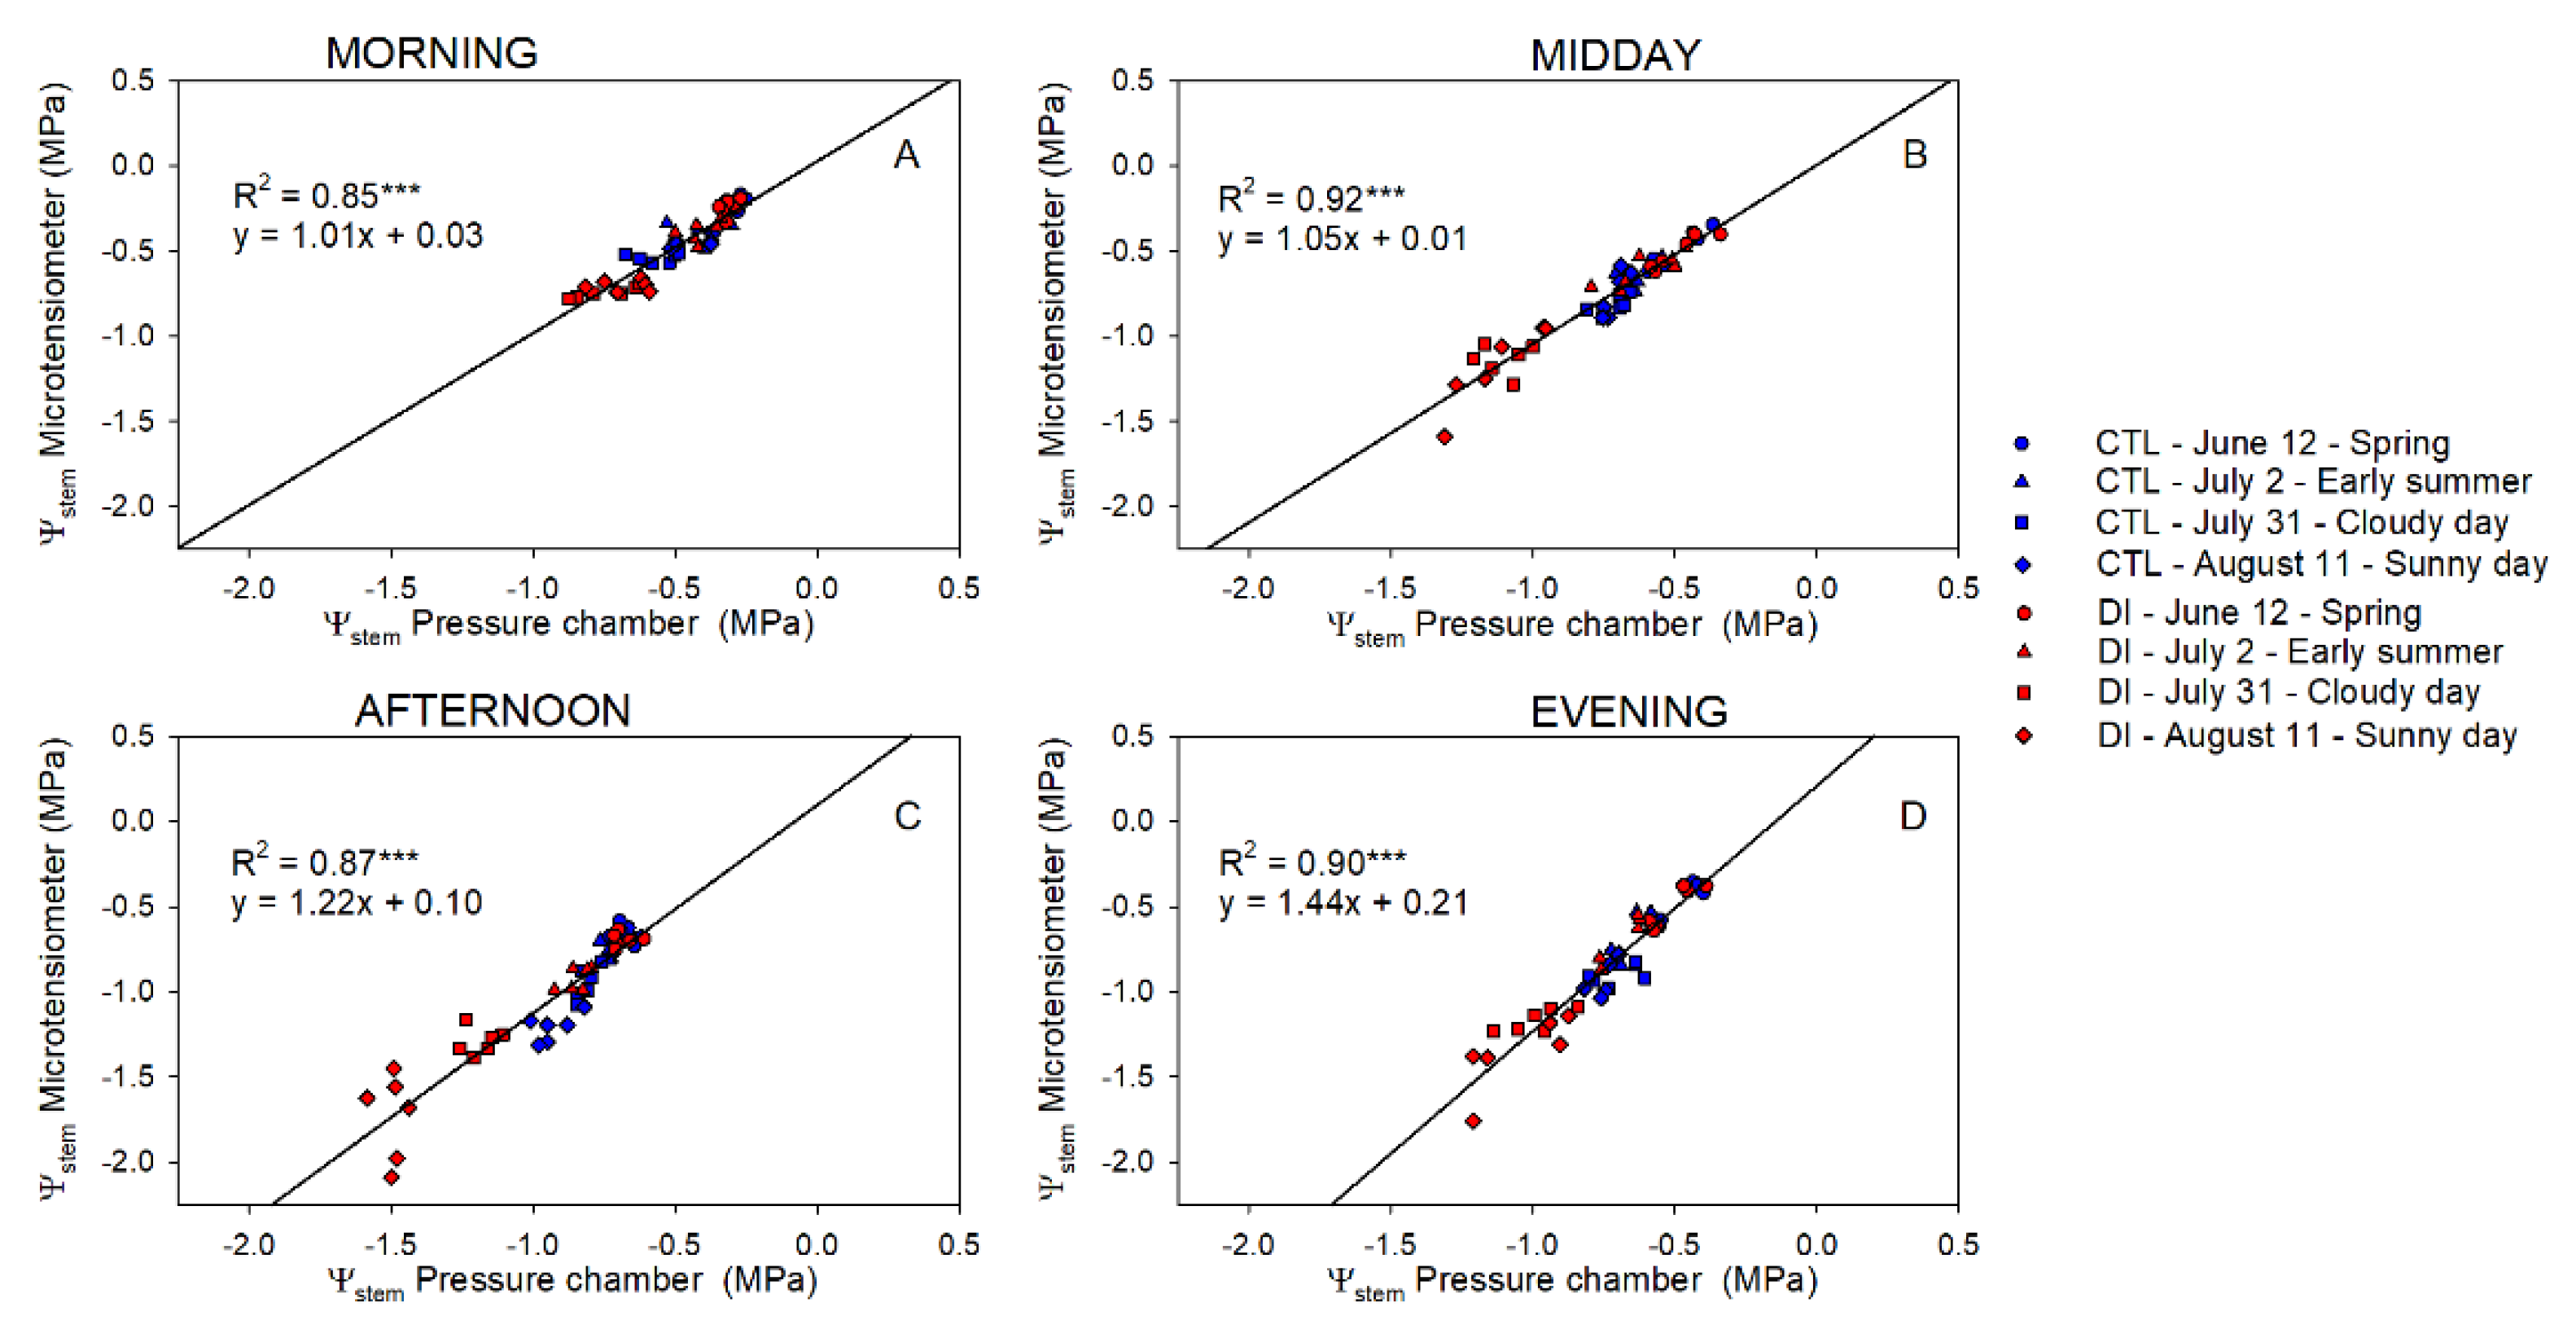
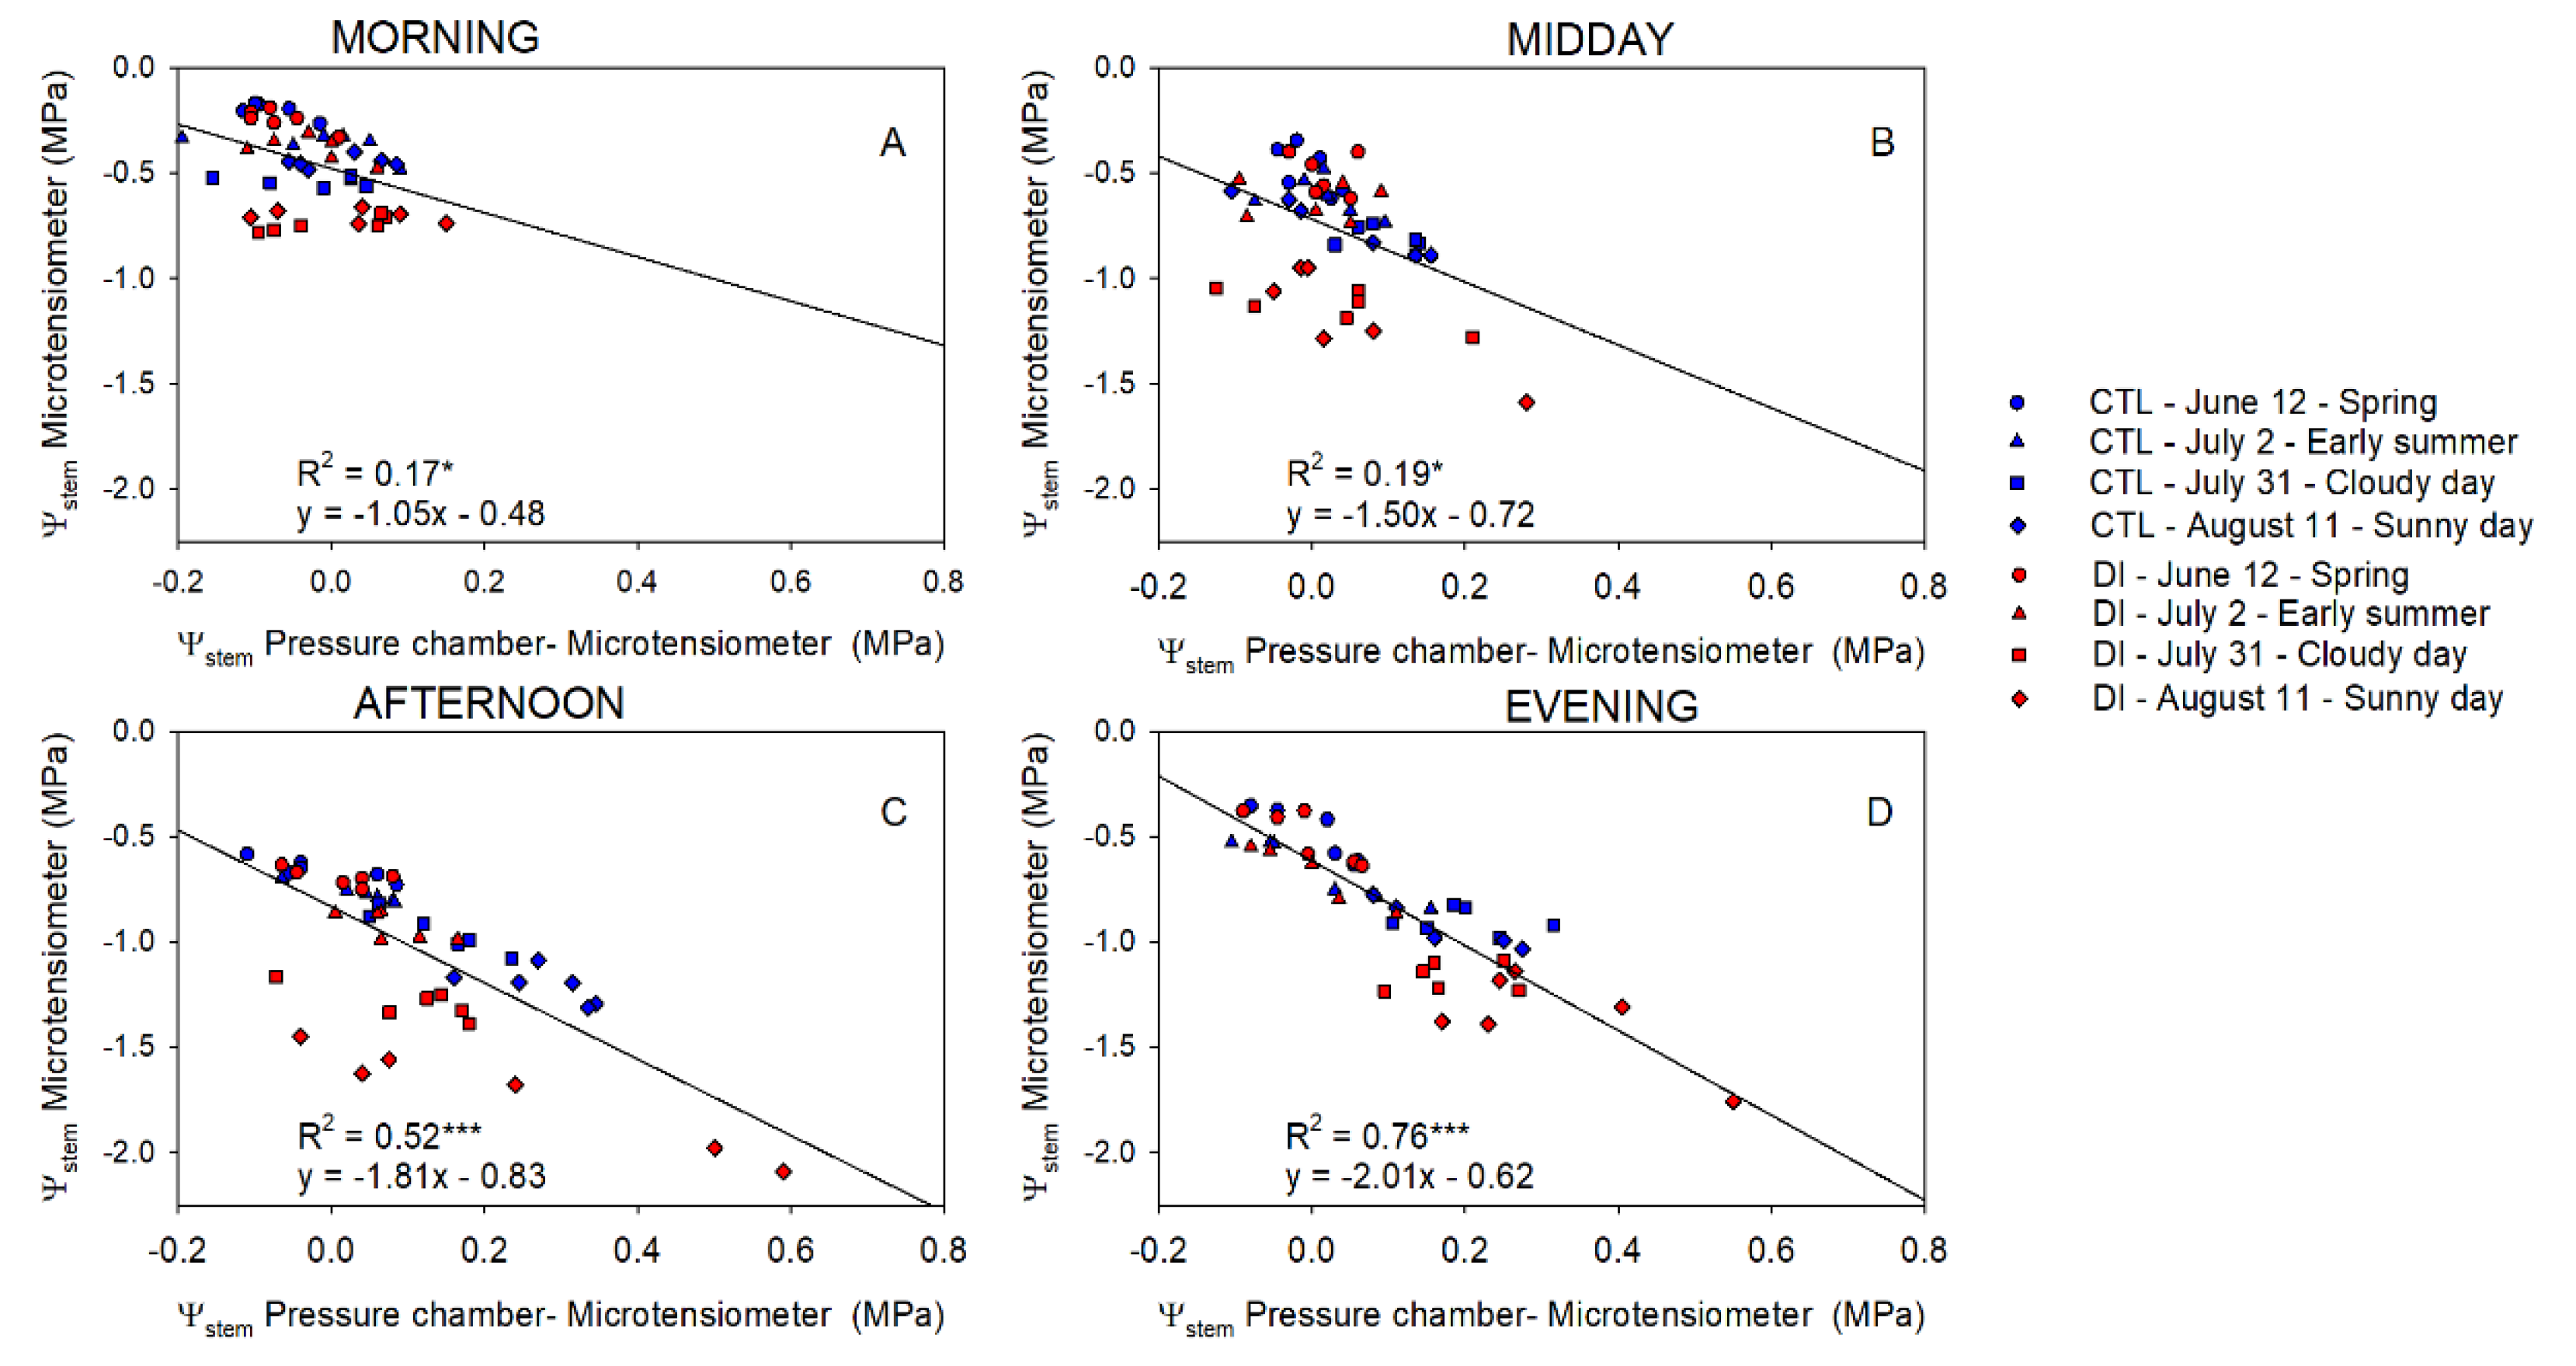
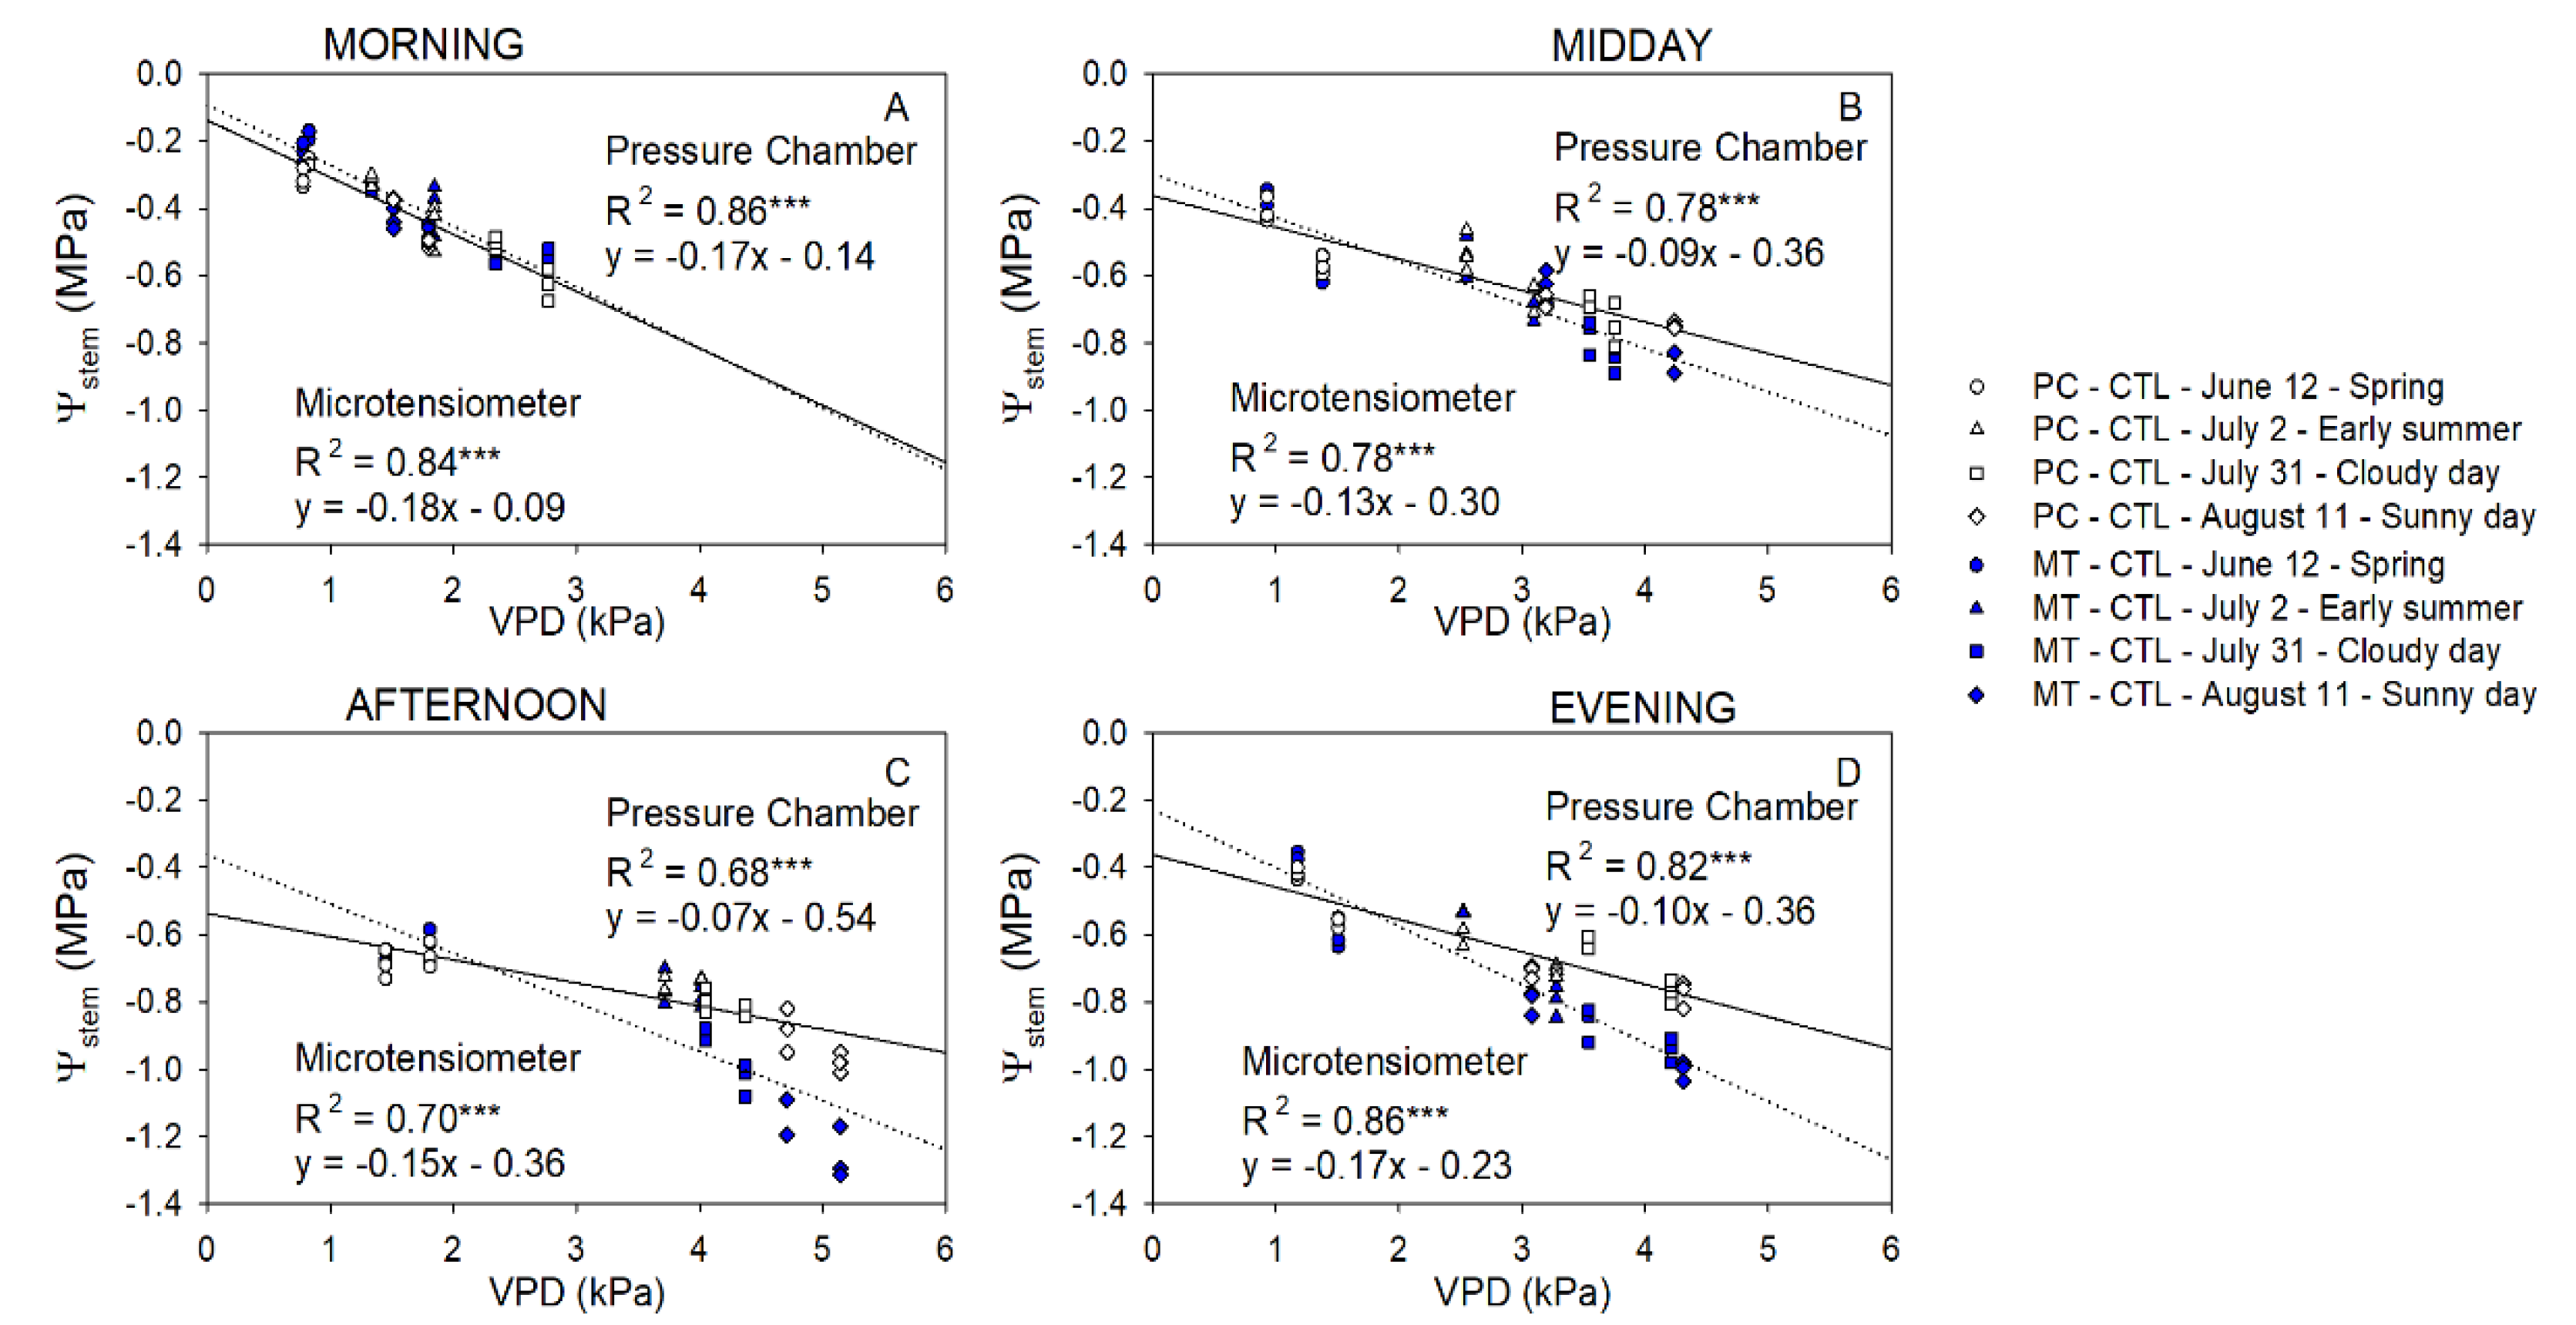
2.3. Stem Water Potential. Comparative Response: Pressure Chamber vs. Microtensiometers

There was a strong linear relationship between the Ψstem measured with PC and MT (p-value < 0.001; R2 ≈ 0.89; Figure 3). However, the linear relationship between them became divergent from the one-to-one line (y = x), highlighting the differences between both methods at lower Ψstem values.
Differences between Ψstem of trees using either CTL or DI strategies ranged between +0.1 and −0.3 MPa in the morning. Differences between the two irrigation treatments were greater when MT were used to measure Ψstem. The greatest differences between the pressure chamber and the microtensiometers were observed when values were the lowest regardless of the time of the day (Figure 4). Ideally, the coefficient of determination between ΨstemPC-MT and Ψstem measured with microtensiometers should be close to zero. However, that was not the case in this experiment. Microtensiometers consistently underestimated Ψstem values below −1.5 MPa, reaching values between 0.3 and 0.6 MPa below those measured with the pressure chamber, as can be seen in DI trees on 11 August, afternoon and evening (Figure 4C,D). Moreover, the influence of the evaporative demand on Ψstem measured with PC and MT was assessed. Both methods showed a strong relationship between Ψstem and VPD (Figure 5).
Ψstem was the most linear and comparable between methods in the morning. The relationship between Ψstem for both methods and VPD started to diverge when VPD decreased below 3 kPa. This trend was also exhibited in the afternoon and in the evening, indicating that Ψstem measured with MT might be more sensitive to evaporative demand (Figure 5).

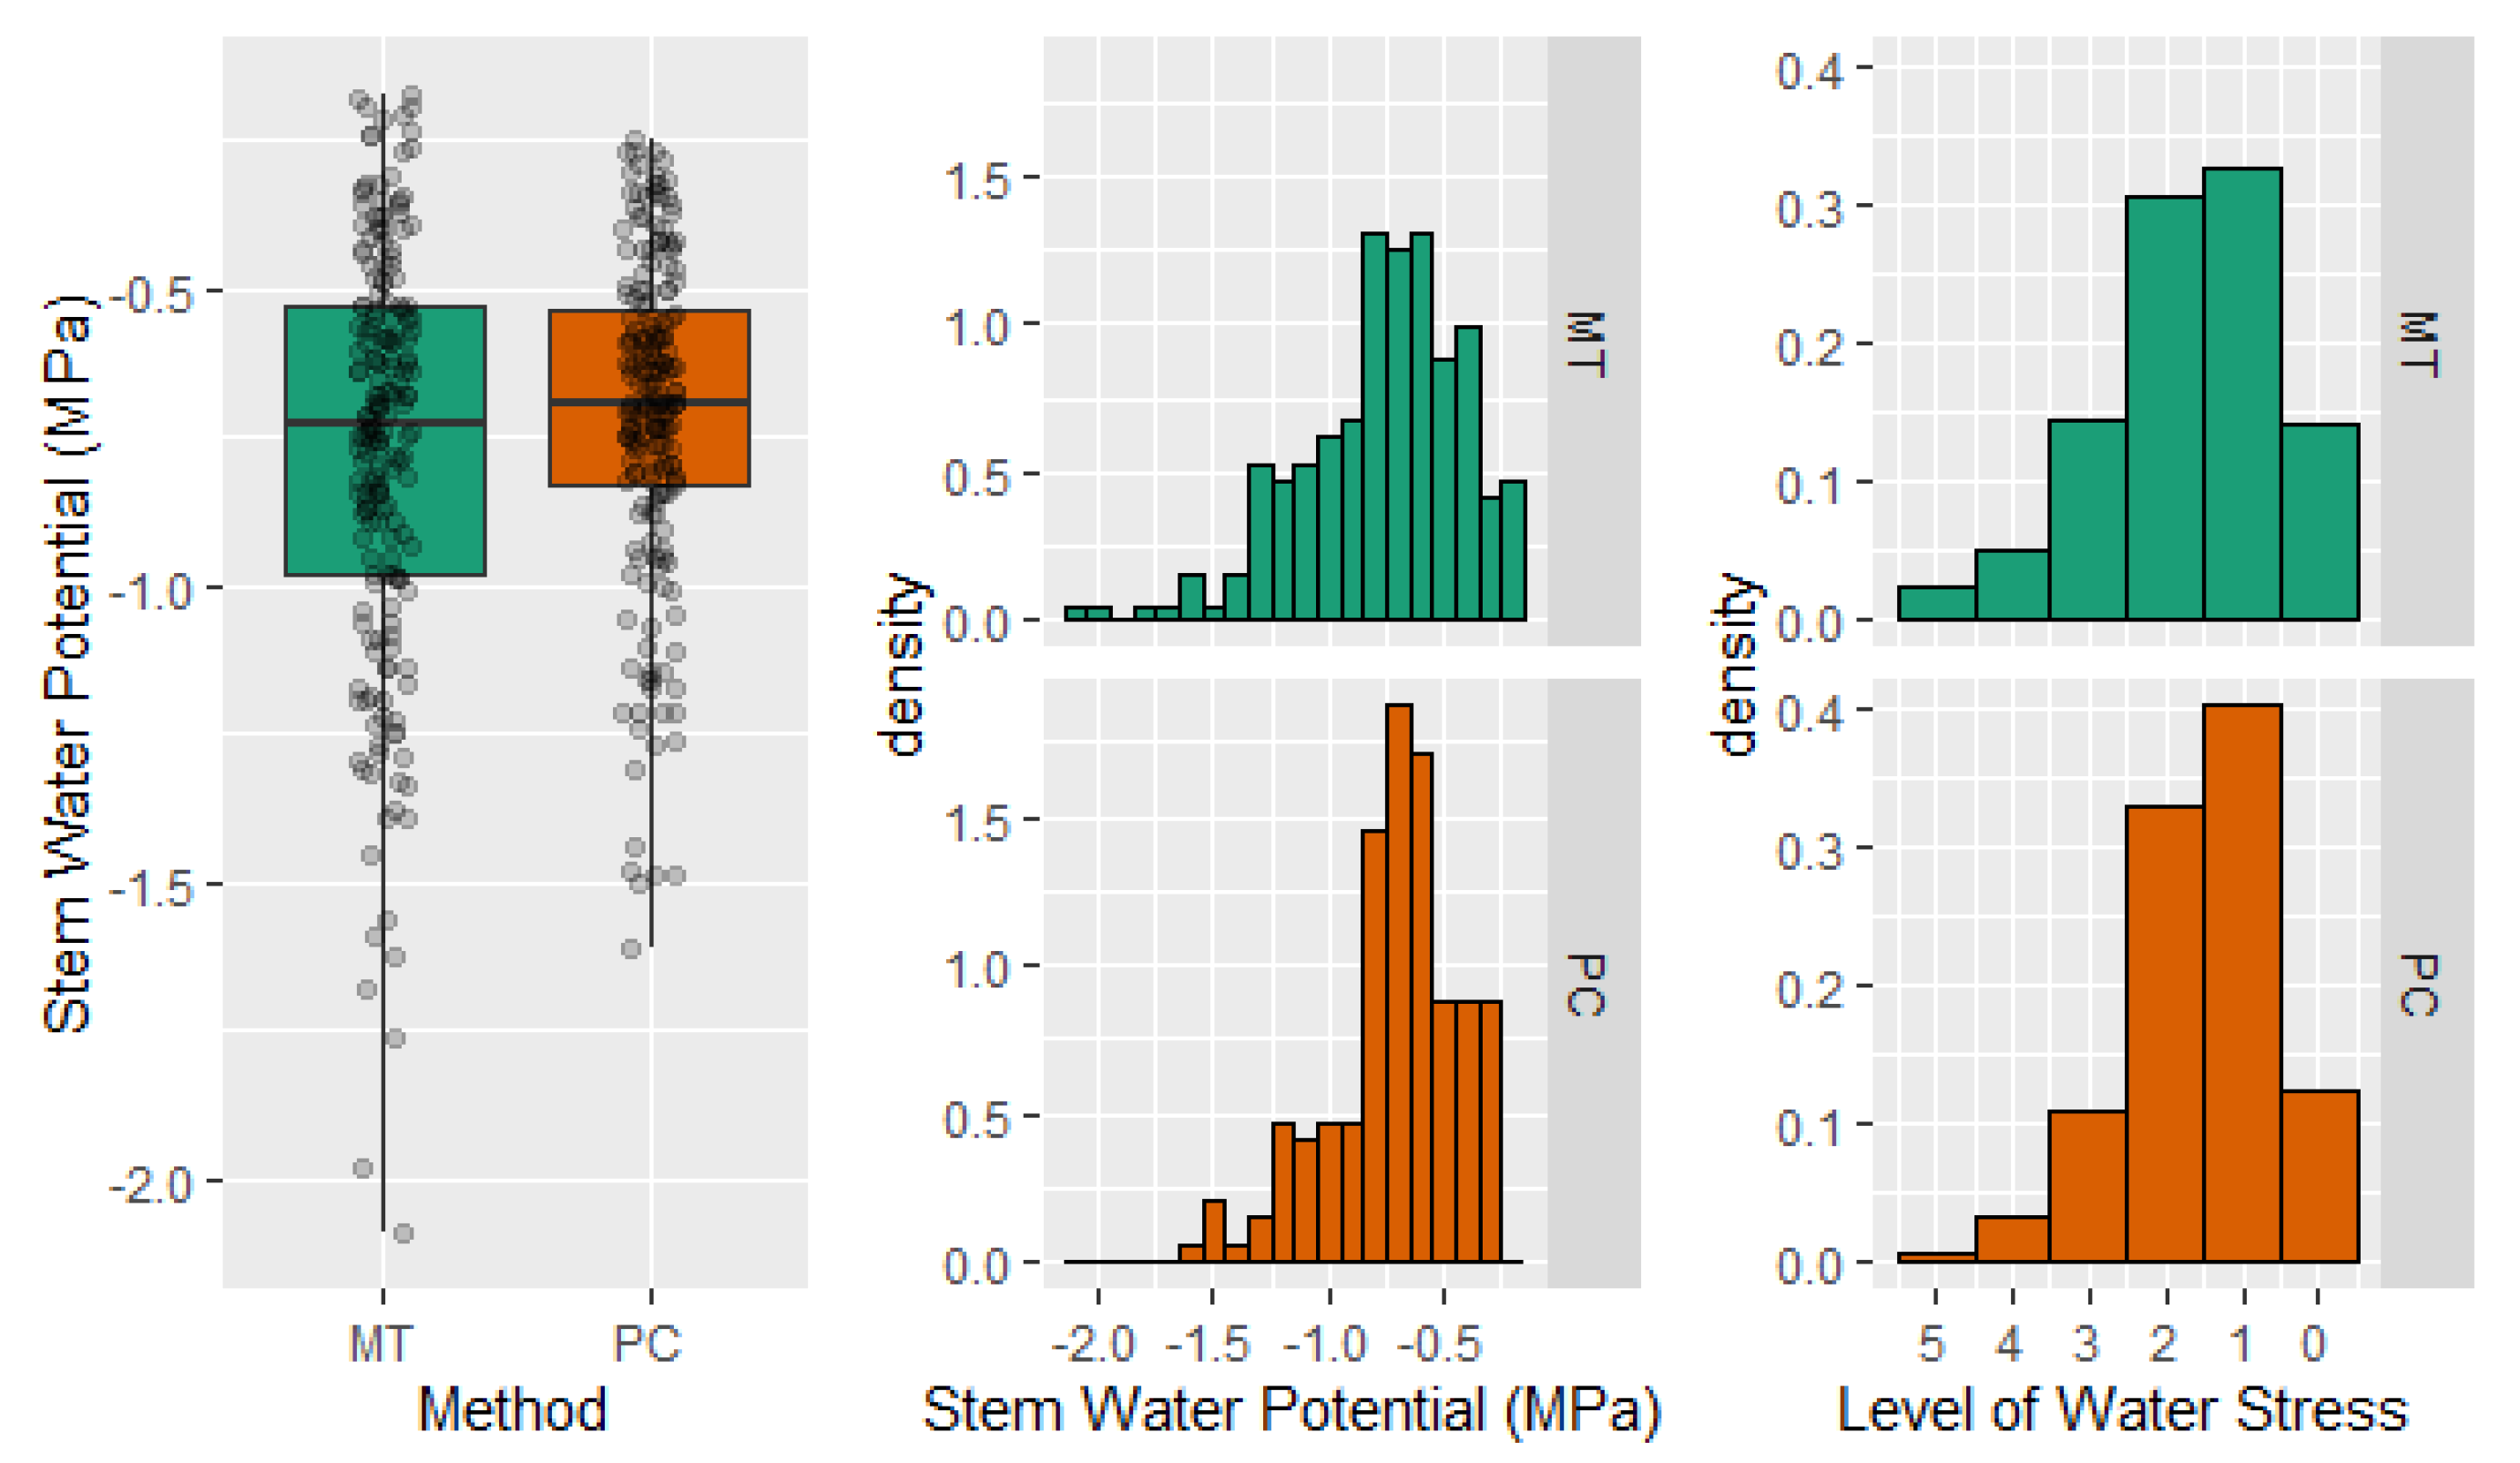
2.4. Stem Water Potential. Level of Tree Water Stress

Pooled data indicated that microtensiometers resulted in a greater dispersion of Ψstem, with values that ranged between −0.2 and −2.1 MPa, while Ψstem measured with the pressure chamber ranged between −0.3 and −1.6 MPa (Figure 6). Similar results were observed when the frequency distribution of measured Ψstem values was calculated for each method. However, when the Ψstem values were translated into values according to a scale of water stress, those differences in the distribution of the data decreased. This new distribution exhibited that the differences in Ψstem between methods generally did not imply a different level of water stress for the tree (Figure 6). These results highlight the applicability of both methods and relativize the differences found between them.

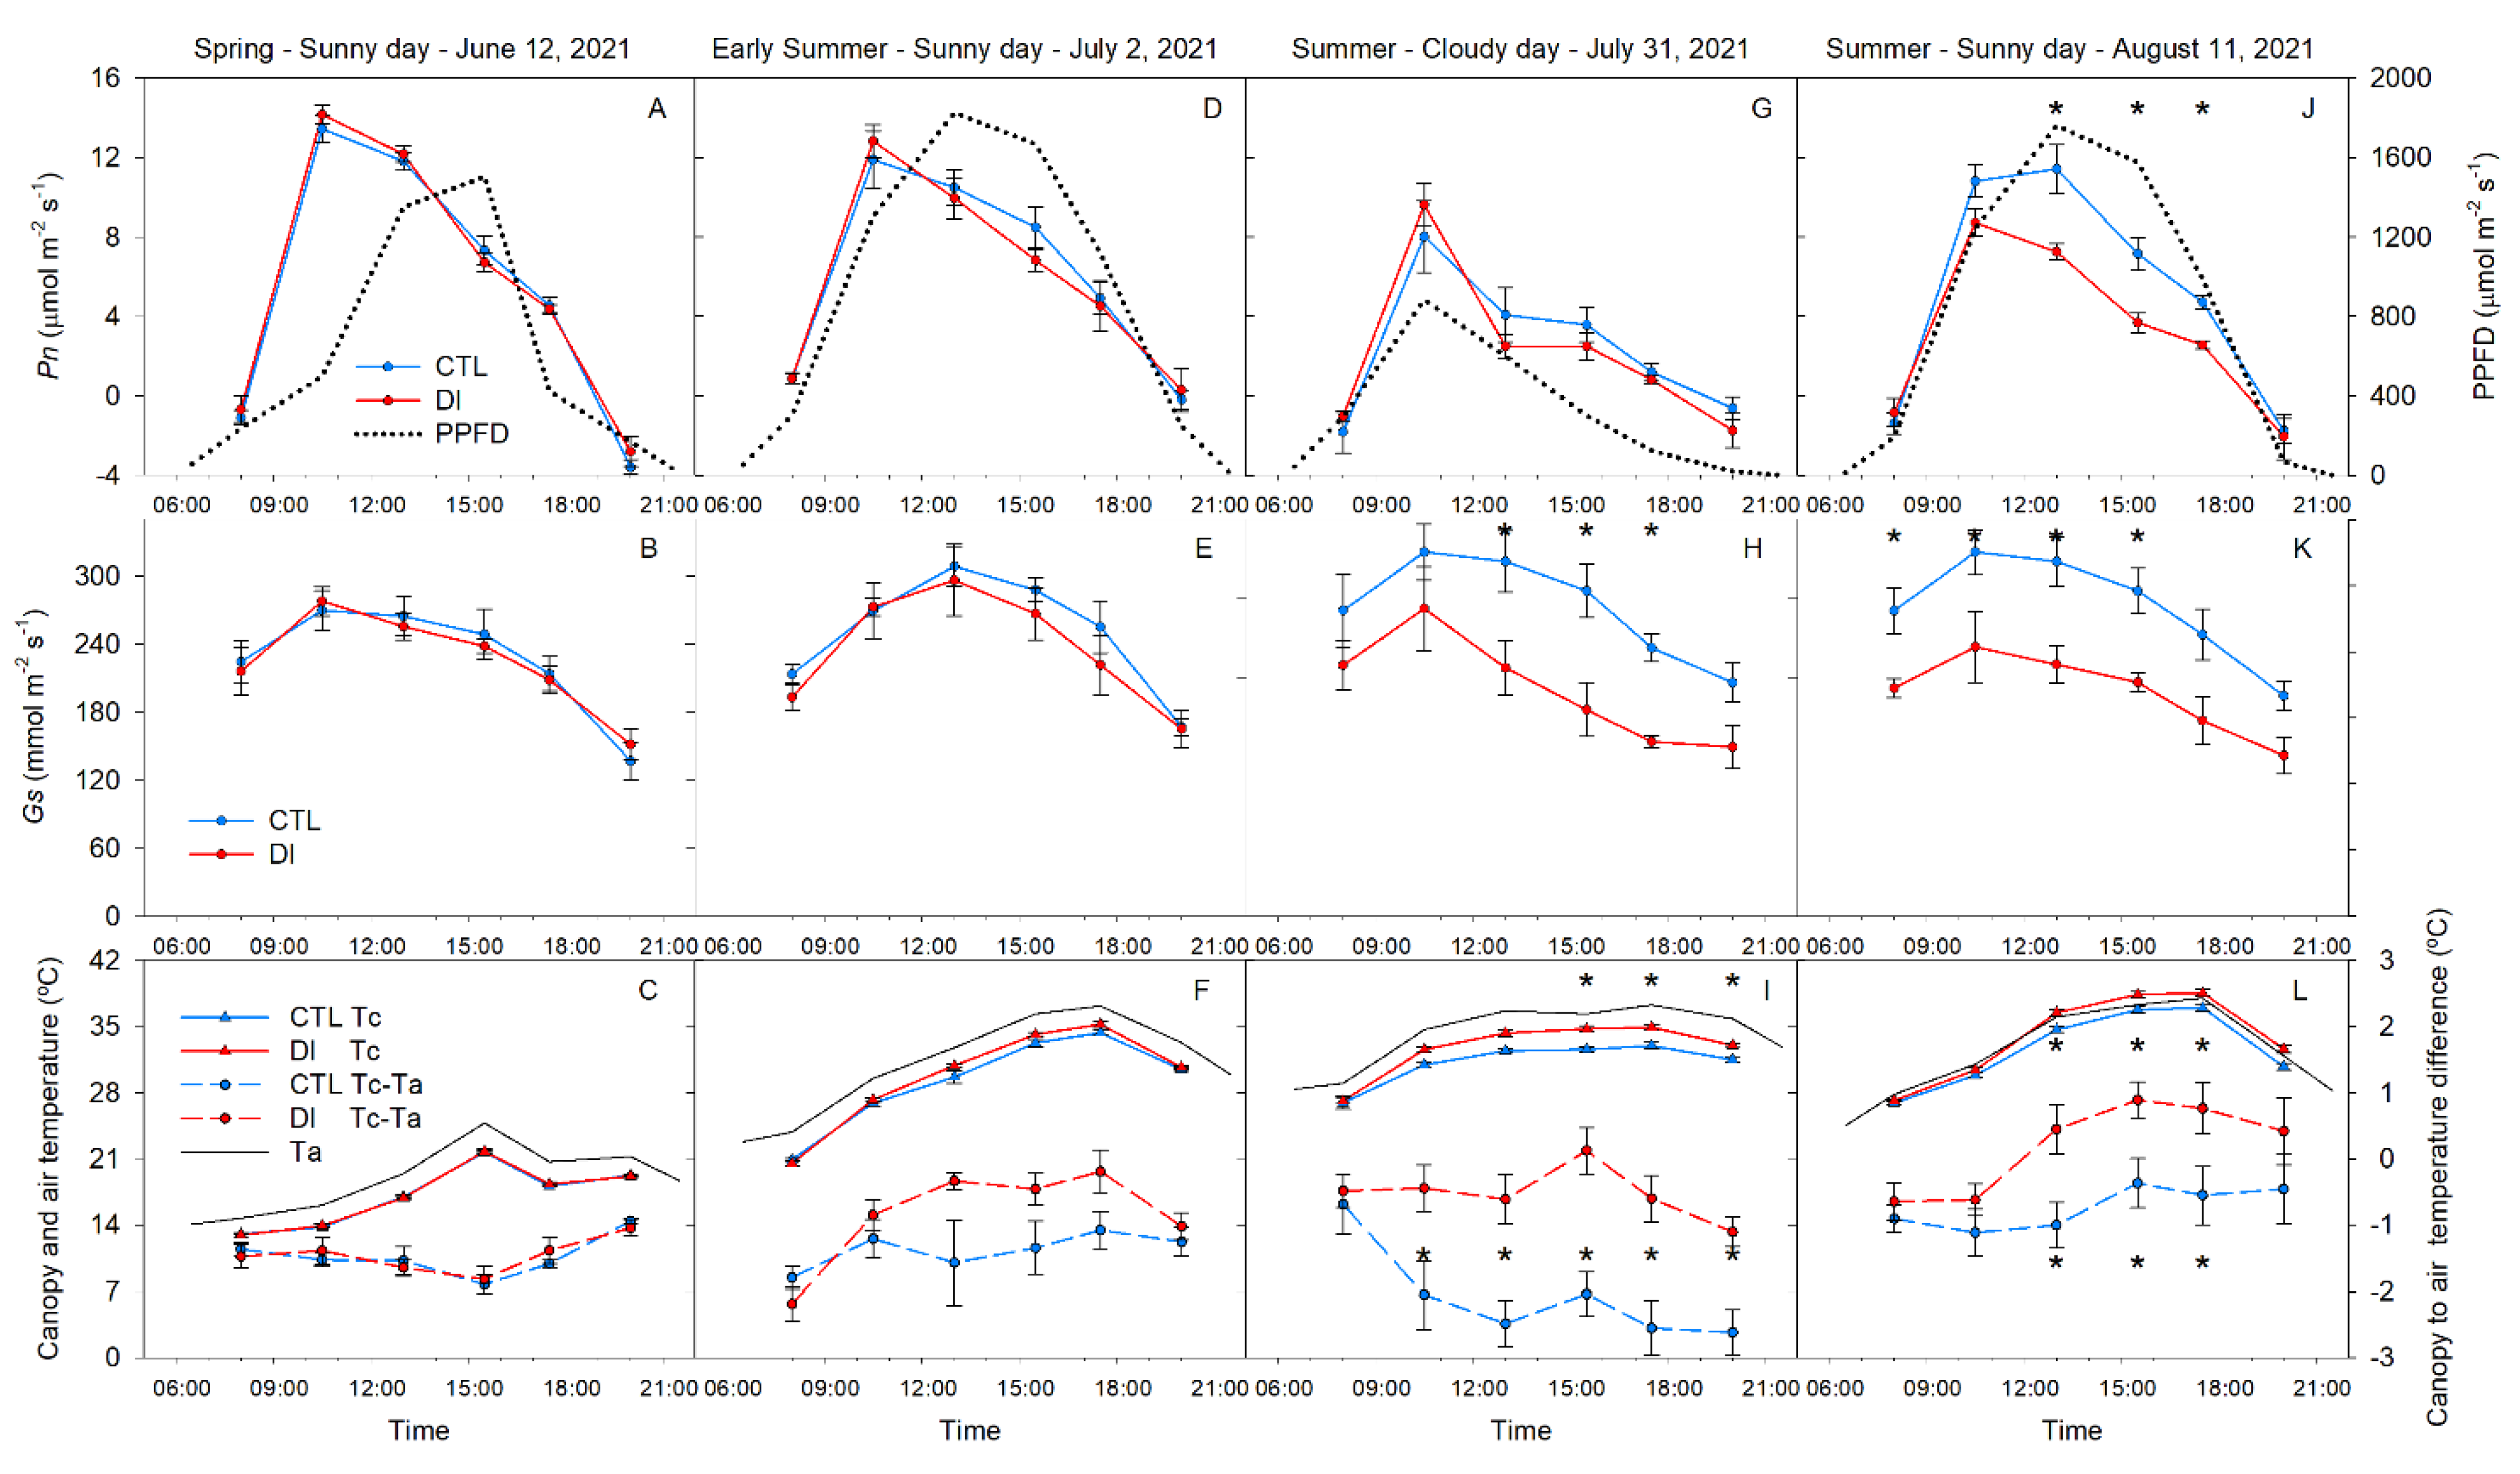
2.5. Gas Exchange and Canopy Temperature. Diurnal Pattern

Leaf gas exchange (stomatal conductance (Gs) and net photosynthesis (Pn)) increased from 08:00 h to 10:30 h (the period of maximum stomatal conductance and carbon assimilation), from 10:30 h to midday; Gs was mostly stable or still increasing at a slow rate while Pn decreased. During the afternoon, leaf gas exchange continued to decrease reaching the daily minimum value in the evening.
There were no differences in Gs or Pn between irrigation treatments on 12 June or 2 July (Figure 7). On 31 July, the cloudy day, Pn values were similar for both treatments and were negatively affected by the lack of solar radiation. Pn was 21 and 35% lower for the cloudy day compared to measurements made on the sunny day for the CTL and DI trees, respectively (Figure 7G,J). CTL trees had significantly greater Pn than trees with DI applied. Similarly, Gs of DI trees was lower for trees where DI was applied compared to the control trees. These differences were the greatest on 11 August, the day with the highest temperature and solar radiation (Figure 7B,E,H,K). On 31 July, although the trees from both treatments maximum Gs by 10:30 h, Gs rapidly decreased in DI trees, while CTL trees decreased at a slower rate (Figure 7).
Canopy temperature (Tc) was heavily influenced by ambient air temperature and the irrigation strategy and was similar to gas exchange measurements. Maximum canopy temperature was observed during the afternoon, 3 h after maximum G was observed. However, like Pn and G, there were no differences in Tc between treatments in the morning (Figure 7L). On the other hand, when the difference between the air (Ta) and the canopy temperature was considered (Tc-Ta), differences appeared earlier at midday (Figure 7I). On the hottest sunny day (11 August), maximum difference between canopy and air temperature (1 °C) occurred at 15:30 in DI trees.

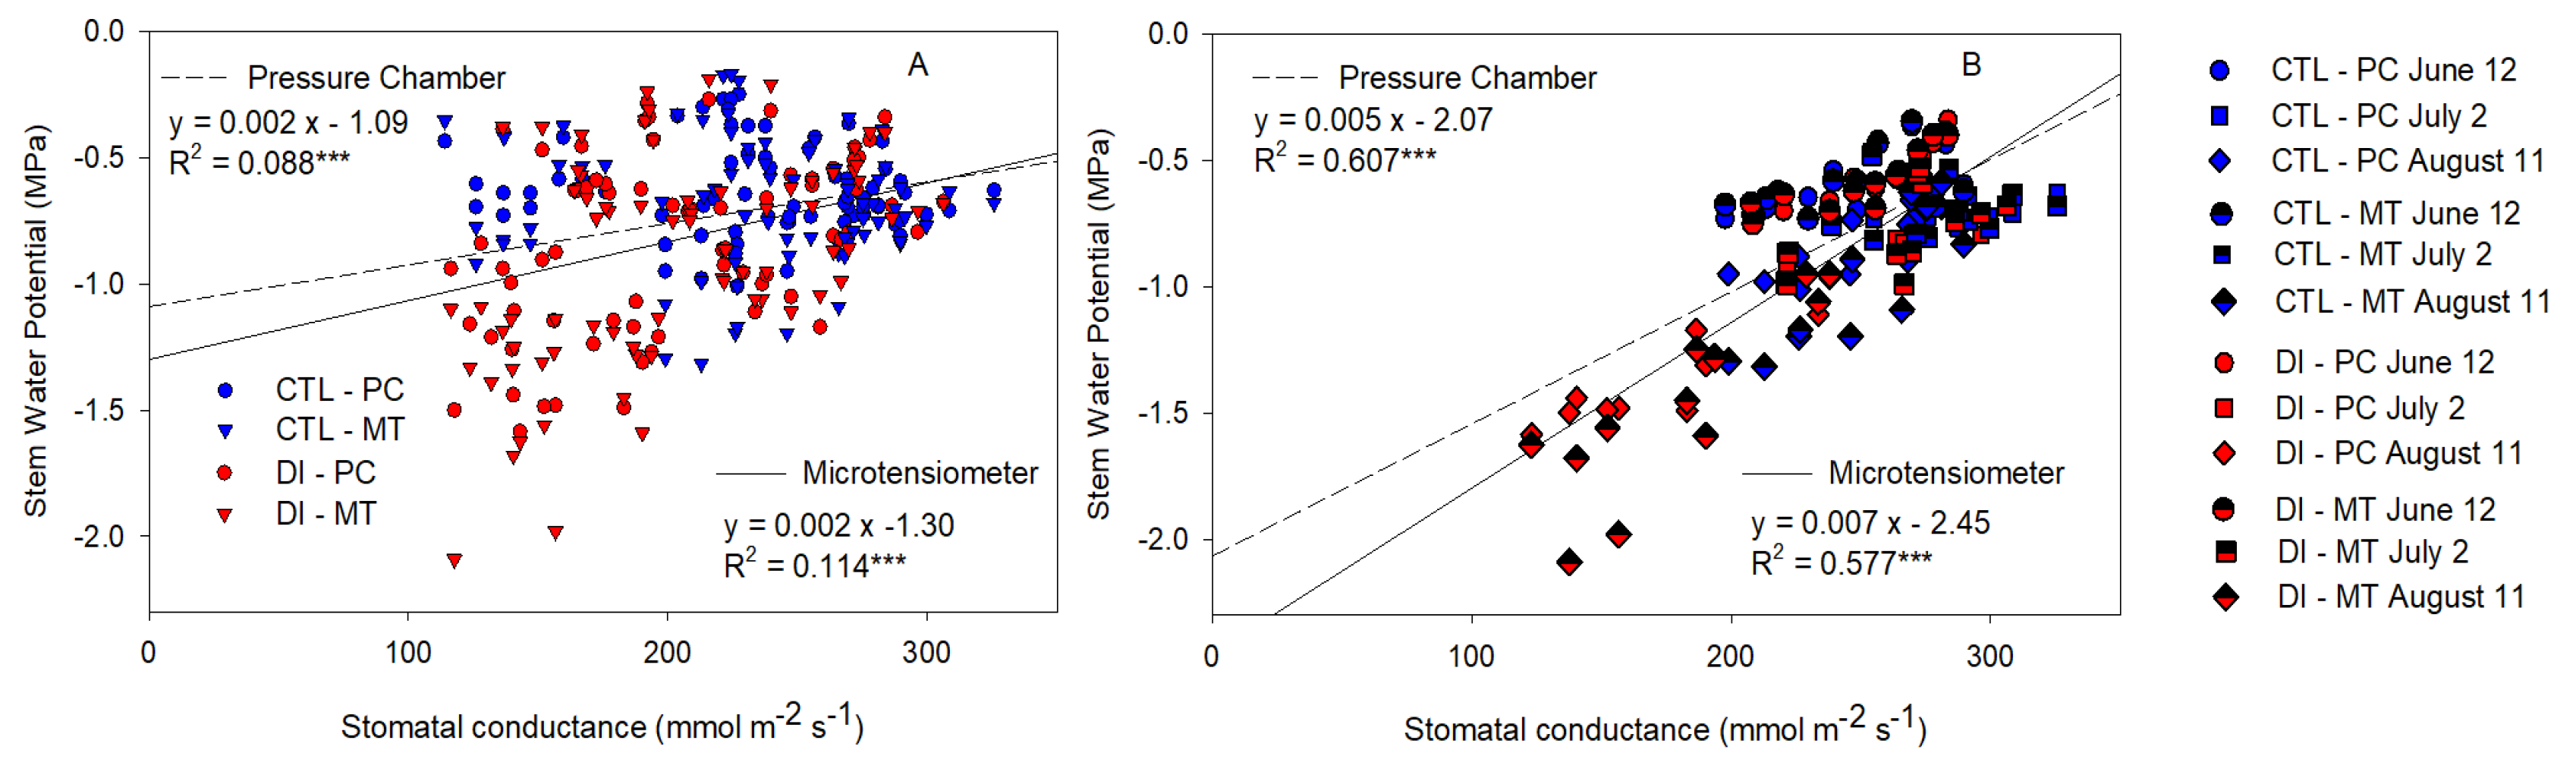
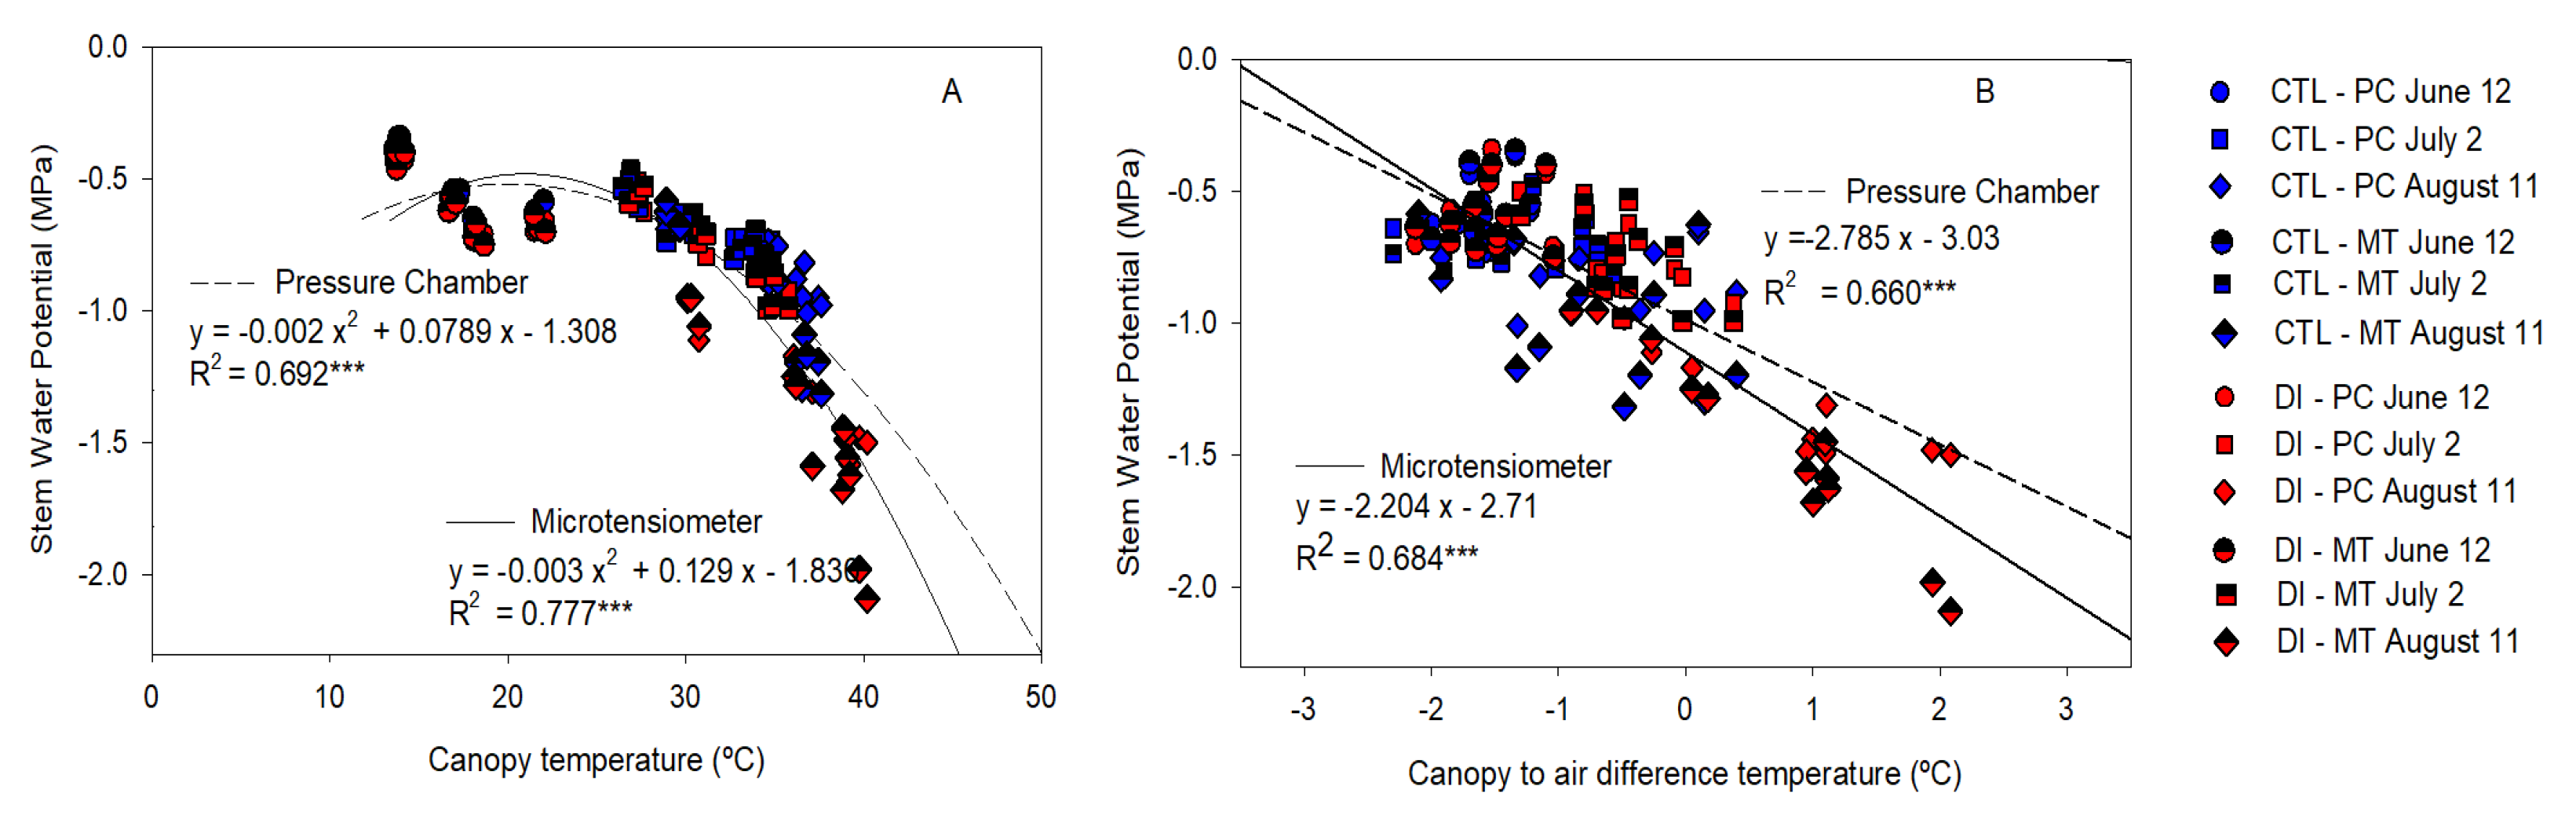
2.6. Stem Water Potential Relationship with Stomatal Conductance and Canopy Temperature

The linear relationships between Gs and Ψstem measured with PC and MT were calculated for all the data (Figure 8A) and when only the data measured between 10:30 and 17:30 h on sunny days were considered (Figure 8B). As expected, the relationship was stronger when only the sunny days were considered. Both methods showed similar and significant relationships with Gs, PC had a greater coefficient of determination when all the values were considered, while MT had a slightly stronger relationship when only the sunny days were taken into account.
In the same vein, canopy temperature resulted strongly related to Ψstem measured by both PC and MT, when the data from 10:30 to 17:30 h of the sunny days were considered (Figure 9A); however, the relationship calculated was not suitable for those Ψstem values higher than −1.0 MPa. On the other hand, when the difference between the canopy and the air temperature was considered, the linear relationship had a better match with the most negative values (Figure 9B).

2.7. Sensitivity Analysis

Ψstem was clearly the plant-based water status indicator with the highest signal intensity (SI) and sensitivity (S) followed by Gs and Tc-Ta. Regarding Ψstem, the mean value of SI for both methods was similar across the day (1.25, Table 1), with differences not exceeding 5% of variability. However, when different days of the season were compared, SI increased as the season progressed from SI values of 1 to 1.5 (Table 2). Furthermore, SI was similar between PC and MT for all days (Table 2).
The coefficient of variation (CV) was slightly lower for PC (0.05) than for MT (0.07). Sensitivity (S) was high for both methods, and S was not below 12 for any of the time periods. When S was compared for each day, S was 24 and 37% higher for PC than for MT. Although both methods were sensitive to changes in tree water status, S was particularly higher for PC in the afternoon, but also in the morning and in the evening, while the microtensiometers were slightly more sensitive at midday.

3. Discussion

Ψstem remains one of the most important indicators of tree water status. It integrates soil, plant, and atmospheric factors and was stable for both methods of measurement in this experiment. It was able to distinguish between irrigation treatments and was sensitive to changes in evaporative demand and radiation throughout the day. Both methods, the PC and the MT, supplied similar Ψstem data (R2 > 0.8; Figure 3) when compared at the same time. However, PC measurements are time-point measurements, and MT provide continuous data. Ψstem is widely regarded as one of the most useful plant water indicators for trees [6,20,21]. However, since Ψstem have traditionally been discrete data, there has been extensive research to identify both direct and indirect assessments of plant water status. Thus, several attempts were made considering easily measured environmental variables such as VPD or air temperature and soil water content/potential [8,22,23], as well as non-destructive, discrete [24,25,26], and continuous [13,27,28] plant-based sensors and high-resolution imagery [29,30,31]. Although these research papers provided interesting results that relate with Ψstem, they also emphasized the necessity of validating their results under different soil and climate conditions as well as under different cultivars. In this sense, the use of Ψstem acquired through MT may be more useful since it is a direct assessment of plant water status.
Other measurements of water status were not as sensitive as Ψstem in this experiment. Ψstem was the first measure to detect water stress five days after water limitations were imposed. Gas exchange (Pn and Gs) and canopy temperature were not significantly different between treatments at that time and resulted in lower signal intensity and sensitivity (Table 2). However, for the two later dates (31 July and 11 August), water limitations affected Pn, Gs, and Tc (Figure 7). The delayed response of leaf gas exchange under water limitations compared to Ψstem has been widely reported [32]. These differences were also limited on 31 July (the cloudy day). Overall, Tc was the indicator with the lowest response, followed by Pn, which on the cloudy day was unable to distinguish between CTL and DI trees despite the great difference in volumetric soil water content. Aside from Ψstem, Tc-Ta and Gs consistently showed differences between irrigation treatments (Figure 7).
In this sense, Ψstem is sometimes not considered to be an early indicator of water stress [33,34]. Specifically, these experiments compared predawn or midday water potential during the first few days of water limitations. These results align with our observations where Ψstem was not able to distinguish between irrigation strategies at these times. However, significant differences between irrigation treatments appeared later in the afternoon (Figure 2 and Figure 4). Predawn water potential has been reported as a reliable tree water status indicator for vines [23,35], while midday stem water potential is the reference tree water status indicator for stone fruit trees [8,36,37] and pome trees [38,39,40]. In our experiment with pear trees, recovery of Ψstem was observed during the early afternoon in fully irrigated trees, but trees with DI applied continued to decrease. The daily minimum values occurred during the early afternoon, mainly on those dates in July and August when the VPD reached the highest daily value (Figure 2). These results contrasted with the general belief that midday water potential reflects the most demanding moment of the day [41] and suggested that measuring Ψstem in anisohydric plants when the VPD is maximum is needed in order to identify early water stress. On 31 July and 11 August, Ψstem of both treatments were significantly different for the entire day, even when VPD, air temperature, and solar radiation were lower on 31 July than on 11 August. The lower sensitivity of Ψstem during the morning and midday compared to the afternoon (Table 1) has been related as an effect of the daily pattern of environmental conditions such as VPD, air temperature, and light intensity. The rapid changes of the environmental conditions during those periods of the day, as well as during the late afternoon, have been reported in warm climates to have a great impact on tree water status and to make measurements less reliable [42].
With respect to both methods compared, Ψstem values obtained using MT resulted in slightly higher variability compared to those measured with the PC (deviation that ranged 20%); however, it increased when the Ψstem decreased (Figure 4). Consequently, the greatest differences between measurements were observed when comparing minimum daily Ψstem values. These occurred during the afternoon and evening of days when evaporative demand was the highest. Minimum Ψstem values measured with MT were almost 0.6 MPa lower than those measured with PC when MT values were below −2.0 Mpa (Figure 6). The underestimation of Ψstem made by the MT could limit its use in those deficit irrigation strategies in which the Ψstem threshold value selected to irrigate the trees is −2.0 Mpa. Ψstem values below −2.0 Mpa have been broadly reported in experiments with olive trees [43], citrus [44], and almond trees [36] under deficit irrigation strategies. On the other hand, in fruit trees such as pears, apples, cherries, peaches, and nectarines, Ψstem values below −2.0 MPa are considered severe water stress and are undesirable as they will have a negative effect on current year fruit quality or yield or fruit quality the next year [45]. In pear trees, values below −1.1 MPa indicate water deficit conditions [46], values below −2.8 MPa induce cropping deficiencies the next year [47], and −3.5 MPa was suggested as the threshold value for vascular embolisms to develop [48]. Ψstem values reported here (Figure 2) were more negative than those reported in deficit irrigation experiments in pear trees under tropical climates [49] but similar to those reported under Mediterranean [50] and Oceanic climates [51]. The days selected to evaluate Ψstem measured using both MT and PC represented a wide range of conditions for the water status of trees. The difference between both methods was apparent when compared against VPD values (Figure 5). There was a stronger linear relationship between VPD and Ψstem measured using MT than between VPD and Ψstem measured using PC. The greatest dependency of Ψstem measured using MT on evaporative demand implies higher data variability and limits the contributions of the soil water availability in the assessment of the tree water status [52]. This situation was particularly clear during the evening when tree water status started to recover. There was an observed mismatch between Ψstem from MT which showed a later recovery than Ψstem from PC (Figure 6). In those measurements taken during the morning, this behavior was not observed.
When Ψstem of CTL and DI trees was compared, it was noticed that the differences in Ψstem between treatments were well differentiated and consistent for both methods (Figure 2). These results emphasize that although MT had greater variability and reported lower minimum values than those obtained with the PC, it can accurately assess tree water status within the range from −0.2 to −2.1 MPa. This covers the most commonly observed ranges in stem water potentials for most fruit trees [45]. Both methods had a similar signal intensity with values that reached 1.5 on 11 August. These values were similar to those reported for Ψstem in nectarine, apple, and pomegranate trees [37,38,53]. However, PC emerged as the method with the highest S due to a slightly lower CV (Table 1 and Table 2). The consistently higher CV of MT might be due to the expected differences found among trees within the same orchard (similar to 10%), but we hypothesize that the installation process might also be a source of variability. MT must be embedded in the trunk of the tree, so a wrong or loose contact between the sensor and the trunk may lead to unstable and highly variable measures and will increase the CV. Regarding the PC, as it is a manual measurement, the main source of variability is the effect of the operator on the Ψstem determination [54]. In this experiment and according to the analyzed data, we can state that both Ψstem methods are highly sensitive, strongly related with other plant water status indicators such as Gs and Tc-Ta and accurate to assess tree water status (Table 2; Figure 8 and Figure 9). Thus, when we compared the distribution of the values measured by each method (Figure 6), we observed that although the MT led to underestimating the minimum values and lightly overestimating the maximum values, and the Ψstem measured with them had greater dispersion, when those values were classified into a water stress scale, the differences between methods decreased, and both PC and MT showed the same distribution pattern (Figure 6). These results suggest that continuous monitoring of Ψstem is possible using MT in automated irrigation systems or as a useful tool to irrigation scheduling in fruit trees.

4. Materials and Methods

4.1. Study Site and Irrigation Treatments

The experiment was conducted during the 2021 growing season at the experimental orchard of the Washington State University located on Rock Island (Washington State, USA, 47°19′ N, 120°04′ W) on a 0.81 ha pear block (Pyrus communis L.), planted in 2007 on a shallow sandy loam soil. “D’Anjou” pear trees were grafted on OHxF.87 rootstock and trained on a central leader system at a tree density of 833 trees per hectare. Horticultural practices (e.g., fertilization, pruning, and weed control) were the same for all trees in the block and followed commercial regular practices. Full bloom was in April, and harvest was in late August. Trees were drip irrigated by a system consisting of a single drip line per tree row and five emitters per tree of 2 L h−1 discharge rate.
Two irrigation treatments were imposed: (1) A control treatment (CTL) irrigated at 100% of crop evapotranspiration (ETc) to ensure non-limiting soil water conditions, and (2) a regulated deficit irrigation treatment (DI), irrigated at 100% of ETc from 1 April to 27 June, and 50% of ETc from 28 June to 15 October. ETc was calculated using the methodology proposed by Allen et al. [55]: ETc = ET0 × Kc × Kr, where ET0 is the reference evapotranspiration, Kc is the crop-specific coefficient reported for adult pear trees [46], and Kr is a factor of localization [56].
Treatments were arranged in a completely randomized block design with three replicates per treatment with six trees in each replicate. Two trees were selected for their uniformity (average ground cover of 41% and mean trunk diameter of 10.5 ± 0.23 cm) within each replicate for measurements.

4.2. Measurements

Four representative days with different atmospheric water demand, air temperature, and solar radiation were selected to evaluate tree water status under a wide range of environmental conditions: (i) a sunny, warm day with low evaporative demand (12 June 2021, which was before DI was initiated); (ii) a hot, sunny day with high evaporative demand (2 July 2021; five days after DI was initiated); (iii) a hot, cloudy day with high evaporative demand (31 July 2021; 35 days after DI was initiated); (iv) a hot, sunny day with high evaporative demand (11 August 2021; 46 days after DI was initiated).

4.2.1. Environmental Data and Soil Water Content

Air temperature, relative humidity, wind speed, precipitation, solar radiation, and reference evapotranspiration were continuously recorded by an AgWeatherNet station located at the experimental orchard (http://www.weather.wsu.edu; 12 August 2021; “Sunrise station”). Two temperature and relative humidity sensors (ATMOS-14, METER Group Inc., Pullman, WA, USA) were also installed in the pear block. Mean air vapor pressure deficit (VPD) was calculated every 15 min using air temperature and relative humidity [52]. Soil volumetric water content (SWC) was obtained with two capacitance/frequency domain sensors (TEROS 11, Meter Group, Pullman, WA, USA) per replicate placed 25 and 50 cm below the surface and 25 cm from the drip emitter.

4.2.2. Gas Exchange and Canopy Temperature

Leaf net photosynthesis (Pn) and stomatal conductance (Gs) were measured in six sun-exposed mature leaves from the outer part of the canopy per treatment. Measurements were made at 8:00, 10:30, 12:30, 15:30, 17:30, and 20:00 h using a portable gas exchange system (LI-6400, Li-Cor Inc., Lincoln, NE, USA) equipped with a 2 cm2 chamber at CO2 concentration of 400 µmol CO2 mol−1 air; the airflow rate inside the chamber was about 400 µmol s−1 and at environmental light and temperature conditions. The chamber incorporates a quantum sensor, and the photosynthetically photon flux density (PPFD) of the photosynthetic active radiation (PAR) was measured at every Pn measurement. The canopy temperature (Tc) was measured at the same time and in the same trees as gas exchange with a compact thermal camera (FLIR C2, FLIR Systems, Wilsonville, OR, USA). Images were taken 1.5 m from the sunny side of the canopy and were analyzed according to Blaya-Ros et al. [25]. The difference between the canopy and air temperature (Tc-Ta) was calculated.

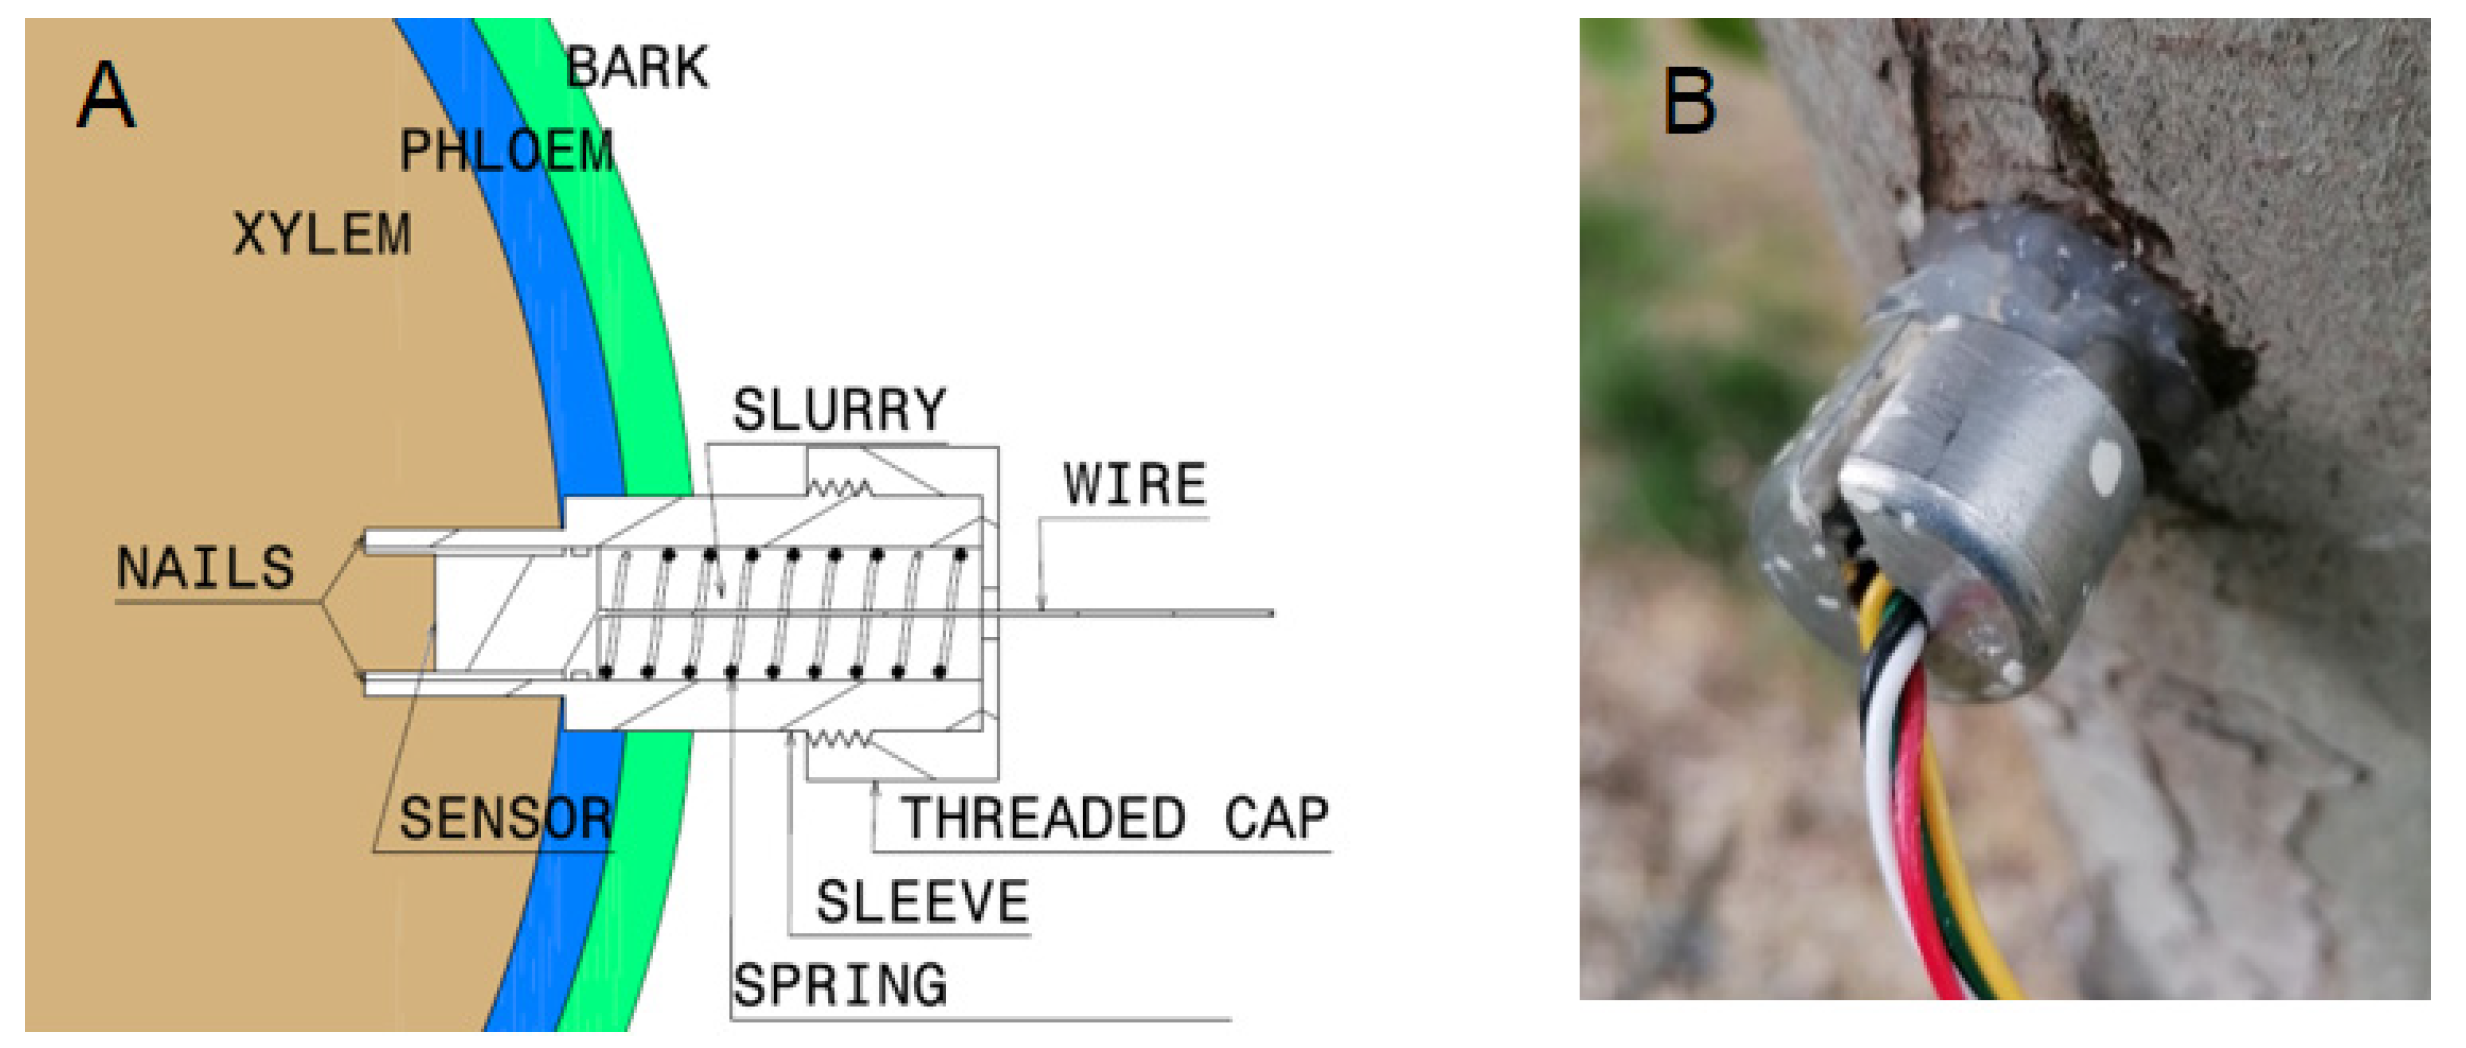
4.2.3. Stem Water Potential

MT (FloraPulse, Davis, CA, USA) were embedded into the tree trunk of six trees for each DI and CTL treatment. The sensors were positioned on the North side of the trunk away from the sunlight. Figure 10 shows the MT installation scheme and the final result in the tree. Ψstem measurements with MT were recorded every 20 min using a solar-powered data logger (FloraPulse, Davis, CA, USA). Ψstem was also measured by using the Scholander pressure chamber (PC) in the same 6 trees at 6:00, 8:00, 10:00, 12:00, 14:00, 16:00, 18:00, and 20:00 h. Ψstem was measured with the PC (Model 615D, PMS Instrument Company, Albany, OR, USA) following methods described by McCutchan and Shackel [7]. Mature and healthy leaves close to the trunk were wrapped with black polyethylene bags and aluminum foil 2 h prior to the measurement. Measures were made on one leaf from each of the six trees per treatment in which the MT were installed.
Ψstem values were classified in a scale from 0 to 5 according to the tree water status, from the absence of water stress (0) to severe water stress (5): 0 for those values higher than −0.4 MPa, 1 between −0.4 and −0.7 MPa, 2 between −0.7 and −1.0 MPa, 3 between −1.0 and −1.3 MPa, 4 between −1.3 and −1.6 MPa, and 5 for lower Ψstem values than −1.6 MPa.

4.3. Sensitivity and Statistical Analysis

Sensitivity (S) was calculated according to Goldhamer and Fereres [57] for Ψstem measured with PC and MT, Gs, and Tc-Ta. S was calculated dividing Signal Intensity (SI), calculated as the ratio of Ψstem between CTL and DI, by the coefficient of variation (CV). Data were analyzed by using analysis of variance (ANOVA) with a significance level of p < 0.05 (IBM SPSS Statistics, SPSS Inc., 24.0 Statistical package, Chicago, IL, USA). Linear regression analysis comparing Ψstem between PC and MT was performed with SigmaPlot 12.5 (Systat Software Inc., San Jose, CA, USA) and RStudio (RStudio Inc., Boston, MA, USA).

5. Conclusions

Microtensiometers provided continuous and accurate information of the tree water status. Ψstem values measured by the MT were strongly related to those measured with the PC across a range in Ψstem normally observed for irrigated woody plants. Both methods were highly sensitive and distinguished between different irrigation treatments. However, Ψstem values measured using MT had greater variability than Ψstem measured using a PC, and Ψstem values below −1.5 MPa were approximately 0.4 MPa lower for MT than PC. Plant water status indicators studied (Pn, Gs, Tc and Ψstem) responded differently to the environmental forcing and to different irrigation strategies and resulted in being influenced by both daily and seasonal patterns. Maximum Pn was observed in the morning while those for Gs and Tc were recorded at midday. On the other hand, Ψstem measured with both the PC and the MT showed the minimum daily values in the afternoon, when the VPD reached the highest daily values. Consequently, we propose measuring the gas exchange in the morning before the stomata closure, and the Ψstem when the maximum evaporative demand is recorded. Thus, according to our results, we conclude that MT represent an accurate continuous method for measuring Ψstem in trees during the growing season across a large range of environmental conditions and soil water content. Future works would be focused on using microtensiometers in automating irrigation systems and assessing if the reference lines and threshold values already proposed for Ψstem measured with the pressure chamber, especially for those trees highly tolerant to drought, could be used or should be adapted to this new and promising method.

Author Contributions

Conceptualization, V.B. and L.K.; methodology, V.B. and L.K.; software, V.B. and L.K.; validation, V.B. and L.K.; formal analysis, V.B. and L.K.; investigation, V.B. and L.K.; resources, V.B. and L.K.; data curation, V.B. and L.K.; writing—original draft preparation, V.B. and L.K.; writing—review and editing, V.B. and L.K.; visualization, V.B. and L.K.; supervision, V.B. and L.K.; project administration, V.B. and L.K.; funding acquisition, V.B. and L.K. All authors have read and agreed to the published version of the manuscript.

Funding

This research was funded by the Washington State Tree Fruit Research Commission Technology Committee. L.K. was partially supported by the USDA National Institute of Food and Agriculture, Hatch project 1014919.

Institutional Review Board Statement

Not applicable.

Informed Consent Statement

Not applicable.

Acknowledgments

V.B. acknowledges the postdoctoral financial support received from the Fundación Séneca (Región de Murcia, Spain, 21261/PD/19).

Conflicts of Interest

The authors declare no conflict of interest.

References

  1. Jones, H.G. Irrigation scheduling—Comparison of soil, plant and atmosphere monitoring approaches. Acta Hortic. 2008, 792, 391–403. [Google Scholar] [CrossRef]
  2. Sui, R. Irrigation Scheduling Using Soil Moisture Sensors. J. Agric. Sci. 2017, 10, 1–11. [Google Scholar] [CrossRef]
  3. Pereira, L.S.; Paredes, P.; Jovanovic, N. Soil Water Balance Models for Determining Crop Water and Irrigation Requirements and Irrigation Scheduling Focusing on the FAO56 Method and the Dual Kc Approach. Agric. Water Manag. 2020, 241, 106357. [Google Scholar] [CrossRef]
  4. Fernández, J.E. Plant-Based Methods for Irrigation Scheduling of Woody Crops. Horticulturae 2017, 3, 35. [Google Scholar] [CrossRef] [Green Version]
  5. Shackel, K. A Plant-Based Approach to Deficit Irrigation in Trees and Vines. HortScience 2011, 46, 173–177. [Google Scholar] [CrossRef] [Green Version]
  6. Naor, A. Midday stem water potential as a plant water stress indicator for irrigation scheduling in fruit trees. Acta Hortic. 2000, 447–454. [Google Scholar] [CrossRef]
  7. McCutchan, H.; Shackel, K.A. Stem-Water Potential as a Sensitive Indicator of Water Stress in Prune Trees (Prunus domestica L. Cv. French). J. Am. Soc. Hortic. Sci. 1992, 117, 607–611. [Google Scholar] [CrossRef] [Green Version]
  8. Blanco, V.; Domingo, R.; Pérez-Pastor, A.; Blaya-Ros, P.J.; Torres-Sánchez, R. Soil and Plant Water Indicators for Deficit Irrigation Management of Field-Grown Sweet Cherry Trees. Agric. Water Manag. 2018, 208, 83–94. [Google Scholar] [CrossRef]
  9. Scholander, P.F.; Bradstreet, E.D.; Hemmingsen, E.A.; Hammel, H.T. Sap Pressure in Vascular Plants. Science 1965, 148, 339–346. [Google Scholar] [CrossRef] [PubMed]
  10. Turner, N.C. Measurement of Plant Water Status by the Pressure Chamber Technique. Irrig. Sci. 1988, 9, 289–308. [Google Scholar] [CrossRef]
  11. Kume, T.; Takizawa, H.; Yoshifuji, N.; Tanaka, K.; Tantasirin, C.; Tanaka, N.; Suzuki, M. Impact of Soil Drought on Sap Flow and Water Status of Evergreen Trees in a Tropical Monsoon Forest in Northern Thailand. For. Ecol. Manag. 2007, 238, 220–230. [Google Scholar] [CrossRef]
  12. Qaderi, M.M.; Martel, A.B.; Dixon, S.L. Environmental Factors Influence Plant Vascular System and Water Regulation. Plants 2019, 8, 65. [Google Scholar] [CrossRef] [PubMed] [Green Version]
  13. Ortuño, M.F.; Conejero, W.; Moreno, F.; Moriana, A.; Intrigliolo, D.S.; Biel, C.; Mellisho, C.D.; Pérez-Pastor, A.; Domingo, R.; Ruiz-Sánchez, M.C.; et al. Could Trunk Diameter Sensors Be Used in Woody Crops for Irrigation Scheduling? A Review of Current Knowledge and Future Perspectives. Agric. Water Manag. 2010, 97, 1–11. [Google Scholar] [CrossRef]
  14. Mancha, L.A.; Uriarte, D.; Prieto, M.d.H. Characterization of the Transpiration of a Vineyard under Different Irrigation Strategies Using Sap Flow Sensors. Water 2021, 13, 2867. [Google Scholar] [CrossRef]
  15. Martínez-Gimeno, M.A.; Castiella, M.; Rüger, S.; Intrigliolo, D.S.; Ballester, C. Evaluating the Usefulness of Continuous Leaf Turgor Pressure Measurements for the Assessment of Persimmon Tree Water Status. Irrig. Sci. 2017, 35, 159–167. [Google Scholar] [CrossRef] [Green Version]
  16. Mira-García, A.B.; Conejero, W.; Vera, J.; Ruiz-Sánchez, M.C. Leaf Water Relations in Lime Trees Grown under Shade Netting and Open-Air. Plants 2020, 9, 510. [Google Scholar] [CrossRef] [PubMed] [Green Version]
  17. He, H.; Turner, N.C.; Aogu, K.; Dyck, M.; Feng, H.; Si, B.; Wang, J.; Lv, J. Time and Frequency Domain Reflectometry for the Measurement of Tree Stem Water Content: A Review, Evaluation, and Future Perspectives. Agric. For. Meteorol. 2021, 306, 108442. [Google Scholar] [CrossRef]
  18. Pagay, V.; Santiago, M.; Sessoms, D.A.; Huber, E.J.; Vincent, O.; Pharkya, A.; Corso, T.N.; Lakso, A.N.; Stroock, A.D. A Microtensiometer Capable of Measuring Water Potentials below −10 MPa. Lab Chip 2014, 14, 2806–2817. [Google Scholar] [CrossRef]
  19. Pagay, V. Evaluating a Novel Microtensiometer for Continuous Trunk Water Potential Measurements in Field-Grown Irrigated Grapevines. Irrig. Sci. 2021. [Google Scholar] [CrossRef]
  20. Girona, J.; Marsal, J.; Lopez Velasco, G. Establishment of Stem Water Potential Thresholds for the Response of “O’Henry” Peach Fruit Growth to Water Stress during Stage III of Fruit Development. Acta Hortic. 2006, 713, 197–201. [Google Scholar] [CrossRef]
  21. Corell, M.; Martín-Palomo, M.J.; Girón, I.; Andreu, L.; Galindo, A.; Centeno, A.; Pérez-López, D.; Moriana, A. Stem Water Potential-Based Regulated Deficit Irrigation Scheduling for Olive Table Trees. Agric. Water Manag. 2020, 242, 106418. [Google Scholar] [CrossRef]
  22. Abrisqueta, I.; Conejero, W.; Valdes-Vela, M.; Vera, J.; Ortuño, M.F.; Ruiz-Sánchez, M.C. Stem Water Potential Estimation of Drip-Irrigated Early-Maturing Peach Trees under Mediterranean Conditions. Comput. Electron. Agric. 2015, 114, 7–13. [Google Scholar] [CrossRef]
  23. Suter, B.; Triolo, R.; Pernet, D.; Dai, Z.; Van Leeuwen, C. Modeling Stem Water Potential by Separating the Effects of Soil Water Availability and Climatic Conditions on Water Status in Grapevine (Vitis vinifera L.). Front. Plant Sci. 2019, 10, 1485. [Google Scholar] [CrossRef] [Green Version]
  24. De Bei, R.; Cozzolino, D.; Sullivan, W.; Cynkar, W.; Fuentes, S.; Dambergs, R.; Pech, J.; Tyerman, S. Non-Destructive Measurement of Grapevine Water Potential Using near Infrared Spectroscopy. Aust. J. Grape Wine Res. 2011, 17, 62–71. [Google Scholar] [CrossRef]
  25. Blaya-Ros, P.J.; Blanco, V.; Domingo, R.; Soto-Valles, F.; Torres-Sánchez, R. Feasibility of Low-Cost Thermal Imaging for Monitoring Water Stress in Young and Mature Sweet Cherry Trees. Appl. Sci. 2020, 10, 5461. [Google Scholar] [CrossRef]
  26. García-Tejero, I.F.; Ortega-Arévalo, C.J.; Iglesias-Contreras, M.; Moreno, J.M.; Souza, L.; Tavira, S.C.; Durán-Zuazo, V.H. Assessing the Crop-Water Status in Almond (Prunus dulcis Mill.) Trees via Thermal Imaging Camera Connected to Smartphone. Sensors 2018, 18, 1050. [Google Scholar] [CrossRef] [Green Version]
  27. Dietrich, L.; Zweifel, R.; Kahmen, A. Daily Stem Diameter Variations Can Predict the Canopy Water Status of Mature Temperate Trees. Tree Physiol. 2018, 38, 941–952. [Google Scholar] [CrossRef]
  28. Scalisi, A.; Marino, G.; Marra, F.P.; Caruso, T.; Lo Bianco, R. A Cultivar-Sensitive Approach for the Continuous Monitoring of Olive (Olea europaea L.) Tree Water Status by Fruit and Leaf Sensing. Front. Plant Sci. 2020, 11, 340. [Google Scholar] [CrossRef] [PubMed]
  29. Bellvert, J.; Adeline, K.; Baram, S.; Pierce, L.; Sanden, B.L.; Smart, D.R. Monitoring Crop Evapotranspiration and Crop Coefficients over an Almond and Pistachio Orchard Throughout Remote Sensing. Remote Sens. 2018, 10, 2001. [Google Scholar] [CrossRef] [Green Version]
  30. Gonzalez-Dugo, V.; Zarco-Tejada, P.; Nicolás, E.; Nortes, P.A.; Alarcón, J.J.; Intrigliolo, D.S.; Fereres, E. Using High Resolution UAV Thermal Imagery to Assess the Variability in the Water Status of Five Fruit Tree Species within a Commercial Orchard. Precis. Agric. 2013, 14, 660–678. [Google Scholar] [CrossRef]
  31. Blanco, V.; Blaya-Ros, P.J.; Castillo, C.; Soto-Vallés, F.; Torres-Sánchez, R.; Domingo, R. Potential of UAS-Based Remote Sensing for Estimating Tree Water Status and Yield in Sweet Cherry Trees. Remote Sens. 2020, 12, 2359. [Google Scholar] [CrossRef]
  32. De la Rosa, J.M.; Conesa, M.R.; Domingo, R.; Pérez-Pastor, A. A New Approach to Ascertain the Sensitivity to Water Stress of Different Plant Water Indicators in Extra-Early Nectarine Trees. Sci. Hortic. 2014, 169, 147–153. [Google Scholar] [CrossRef]
  33. Intrigliolo, D.; Bonet Perez de León, L.; Ferrer, P.; Reig, C.; Mesejo, C.; Soler, E. Usefulness of Stem Dendrometers as Continuous Water Stress Indicators of Loquat Tree Water Status. Acta Hortic. 2011, 887, 149–154. [Google Scholar] [CrossRef]
  34. Tuccio, L.; Lo Piccolo, E.; Battelli, R.; Matteoli, S.; Massai, R.; Scalabrelli, G.; Remorini, D. Physiological Indicators to Assess Water Status in Potted Grapevine (Vitis vinifera L.). Sci. Hortic. 2019, 255, 8–13. [Google Scholar] [CrossRef]
  35. Gaudin, R.; Roux, S.; Tisseyre, B. Linking the Transpirable Soil Water Content of a Vineyard to Predawn Leaf Water Potential Measurements. Agric. Water Manag. 2017, 182, 13–23. [Google Scholar] [CrossRef] [Green Version]
  36. Puerto, P.; Domingo, R.; Torres, R.; Pérez-Pastor, A.; García-Riquelme, M. Remote Management of Deficit Irrigation in Almond Trees Based on Maximum Daily Trunk Shrinkage. Water Relations and Yield. Agric. Water Manag. 2013, 126, 33–45. [Google Scholar] [CrossRef]
  37. Conesa, M.R.; Conejero, W.; Vera, J.; Ramírez-Cuesta, J.M.; Ruiz-Sánchez, M.C. Terrestrial and Remote Indexes to Assess Moderate Deficit Irrigation in Early-Maturing Nectarine Trees. Agronomy 2019, 9, 630. [Google Scholar] [CrossRef] [Green Version]
  38. Naor, A.; Cohen, S. Sensitivity and Variability of Maximum Trunk Shrinkage, Midday Stem Water Potential, and Transpiration Rate in Response to Withholding Irrigation from Field-Grown Apple Trees. HortScience 2003, 38, 547–551. [Google Scholar] [CrossRef] [Green Version]
  39. Reid, M.; Kalcsits, L. Water Deficit Timing Affects Physiological Drought Response, Fruit Size, and Bitter Pit Development for “Honeycrisp” Apple. Plants 2020, 9, 874. [Google Scholar] [CrossRef]
  40. Valverdi, N.A.; Kalcsits, L. Apple Rootstock Genotype Affects Scion Responses to Water Limitations under Field Conditions. Acta Physiol. Plant. 2021, 43, 97. [Google Scholar] [CrossRef]
  41. Remorini, D.; Massai, R. Comparison of Water Status Indicators for Young Peach Trees. Irrig. Sci. 2003, 22, 39–46. [Google Scholar] [CrossRef]
  42. Santesteban, L.G.; Miranda, C.; Marín, D.; Sesma, B.; Intrigliolo, D.S.; Mirás-Avalos, J.M.; Escalona, J.M.; Montoro, A.; de Herralde, F.; Baeza, P.; et al. Discrimination Ability of Leaf and Stem Water Potential at Different Times of the Day through a Meta-Analysis in Grapevine (Vitis vinifera L.). Agric. Water Manag. 2019, 221, 202–210. [Google Scholar] [CrossRef]
  43. Moriana, A.; Pérez-López, D.; Prieto, M.H.; Ramírez-Santa-Pau, M.; Pérez-Rodriguez, J.M. Midday Stem Water Potential as a Useful Tool for Estimating Irrigation Requirements in Olive Trees. Agric. Water Manag. 2012, 112, 43–54. [Google Scholar] [CrossRef]
  44. Romero-Trigueros, C.; Gambín, J.M.B.; Nortes Tortosa, P.A.; Cabañero, J.J.A.; Nicolás Nicolás, E. Isohydricity of Two Different Citrus Species under Deficit Irrigation and Reclaimed Water Conditions. Plants 2021, 10, 2121. [Google Scholar] [CrossRef]
  45. Steduto, P.; Hsiao, T.C.; Fereres, E.; Raes, D. Crop Yield Response to Water. In FAO Irrigation and Drainage; Food and Agriculture Organization of the United Nations: Rome, Italy, 2012; ISBN 978-92-5-107274-5. [Google Scholar]
  46. Marsal, J.; Girona, J.; Naor, A. Crop Yield Response to Water. Pear. In FAO Irrigation and Drainage; Food and Agriculture Organization of the United Nations: Rome, Italy, 2012; ISBN 978-92-5-107274-5. [Google Scholar]
  47. Naor, A.; Stern, R.; Flaishman, M.; Gal, Y.; Peres, M. Effects of Post-Harvest Water Stress on Autumnal Bloom and Subsequent-Season Productivity in Mid-Season ‘Spadona’ Pear. J. Hortic. Sci. Biotechnol. 2006, 81, 365–370. [Google Scholar] [CrossRef]
  48. Marsal, J.; Mata, M.; Arbonàs, A.; Rufat, J.; Girona, J. Water stress limits for vegetative and reproductive growth of barlett pears. Acta Hortic. 2002, 596, 659–663. [Google Scholar] [CrossRef]
  49. Vélez-Sánchez, J.E.; Balaguera-López, H.E.; Alvarez-Herrera, J.G. Effect of Regulated Deficit Irrigation (RDI) on the Production and Quality of Pear Triunfo de Viena Variety under Tropical Conditions. Sci. Hortic. 2021, 278, 109880. [Google Scholar] [CrossRef]
  50. Venturi, M.; Manfrini, L.; Perulli, G.D.; Boini, A.; Bresilla, K.; Corelli Grappadelli, L.; Morandi, B. Deficit Irrigation as a Tool to Optimize Fruit Quality in Abbé Fetél Pear. Agronomy 2021, 11, 1141. [Google Scholar] [CrossRef]
  51. Caspari, H.W.; Behboudian, M.H.; Chalmers, D.J. Water Use, Growth, and Fruit Yield of `Hosui’ Asian Pears under Deficit Irrigation. J. Am. Soc. Hortic. Sci. 1994, 119, 383–388. [Google Scholar] [CrossRef]
  52. Anderegg, W.R.L.; Wolf, A.; Arango-Velez, A.; Choat, B.; Chmura, D.J.; Jansen, S.; Kolb, T.; Li, S.; Meinzer, F.; Pita, P.; et al. Plant Water Potential Improves Prediction of Empirical Stomatal Models. PLoS ONE 2017, 12, e0185481. [Google Scholar] [CrossRef] [Green Version]
  53. Galindo, A.; Rodríguez Hernández, P.; Mellisho, C.D.; Torrecillas, E.; Moriana, A.; Cruz Pérez, Z.; Conejero, W.; Moreno, F.; Torrecillas, A. Assessment of Discretely Measured Indicators and Maximum Daily Trunk Shrinkage for Detecting Water Stress in Pomegranate Trees. Agric. For. Meteorol. 2013, 180, 58–65. [Google Scholar] [CrossRef] [Green Version]
  54. Levin, A.D. Re-Evaluating Pressure Chamber Methods of Water Status Determination in Field-Grown Grapevine (Vitis spp.). Agric. Water Manag. 2019, 221, 422–429. [Google Scholar] [CrossRef]
  55. Allen, R.G.; Pereira, L.S.; Raes, D.; Smith, M. Crop Evapotranspiration—Guidelines for Computing Crop Water Requirements; FAO Irrigation and Drainage, Food and Agriculture Organization of the United Nations: Rome, Italy, 1998; ISBN 92-5-104219-5. [Google Scholar]
  56. Fereres, E.; Martinich, D.A.; Aldrich, T.M.; Castel, J.; Holzapfel, E.; Schulbach, H. Drip Irrigation Saves Money in Young Almond Orchards. Calif. Agric. 1982, 36, 12–13. [Google Scholar]
  57. Goldhamer, D.A.; Fereres, E. Irrigation Scheduling Protocols Using Continuously Recorded Trunk Diameter Measurements. Irrig. Sci. 2001, 20, 115–125. [Google Scholar] [CrossRef]
Figure 1. Diurnal patterns of mean volumetric soil water content (SWC) and vapor pressure deficit (VPD) for four representative days (12 June (A), 2 July (B), 31 July (C), 11 August (D)) during 2021 season.
Plants 10 02780 g001
Figure 2. Diurnal patterns of stem water potential measured with the pressure chamber (PC) (A,C,E,G) or with the microtensiometer (MT) (B,D,F,H) for control (CTL, blue) and deficit-irrigated (DI, red) trees on four representative days (12 June, 2 July, 31 July, 11 August) during the 2021 growing season (N = 6). Asterisks indicate statistically significant differences between irrigation treatments according to ANOVA (p ≤ 0.05).
Plants 10 02780 g002
Figure 3. Relationship between stem water potential measured with the pressure chamber and the microtensiometers for control trees (CTL, blue) and deficit irrigated trees (DI, red) in the morning (A), midday (B), afternoon (C), and evening (D) of four representative days (12 June (circle), 2 July (square), 31 July (triangle), 11 August (diamond)) during 2021 season. (*** p < 0.001).
Plants 10 02780 g003
Figure 4. The linear relationship between stem water potential measured with the microtensiometers and the difference between the pressure chamber and the microtensiometers for control trees (CTL, blue) and deficit irrigated trees (DI, red) in the morning (A), midday (B), afternoon (C), and evening (D) of four representative days (12 June (circle), 2 July (square), 31 July (triangle), 11 August (diamond)) during 2021 season. (* p < 0.05, *** p < 0.001).
Plants 10 02780 g004
Figure 5. Relationship between the stem water potential measured with the microtensiometers (MT, blue) and the pressure chamber (PC, white) with the vapor pressure deficit (VPD) for control trees (CTL) in the morning (A), midday (B), afternoon (C), and evening (D) of four representative days (12 June (circle), 2 July (square), 31 July (triangle), 11 August (diamond)) during 2021 season. (*** p < 0.001).
Plants 10 02780 g005
Figure 6. Stem water potential mean value and distribution according to a 0.1 MPa scale and a water stress scale (0 absence of water stress, 5 severe water stress) for stem water potential values measured during the experiment with the pressure chamber (PC) and the microtensiometers (MT).
Plants 10 02780 g006
Figure 7. Diurnal course of photosynthetic photon flux density (PPFD), net photosynthesis (Pn) (A,D,G,J), stomatal conductance (Gs) (B,E,H,K), canopy temperature (Tc), air temperature (Ta), and the difference between Tc and Ta (Tc-Ta) (C,F,I,L) for control (CTL, blue) trees and deficit-irrigated (DI, red) trees on four representative days (12 June, 2 July, 31 July, 11 August) during the 2021 season (N = 6). Asterisks indicate statistically significant differences between irrigation treatments according to ANOVA (p ≤ 0.05).
Plants 10 02780 g007
Figure 8. Relationship between the stem water potential measured with the microtensiometers (MT) and the pressure chamber (PC) with the stomatal conductance for control trees (CTL, blue) and deficit-irrigated trees (DI, red) of four representative days (12 June (circle), 2 July (square), 31 July (triangle), 11 August (diamond)) (A) and three representative days (12 June (circle), 2 July (square), 11 August (diamond)) from 10:30 to 15:30 h during 2021 season (B). (*** p < 0.001).
Plants 10 02780 g008
Figure 9. Relationship between stem water potential measured with the microtensiometers (MT) and the pressure chamber (PC), and canopy temperature (A) and canopy-to-air temperature (B) for control trees (CTL, blue) and deficit-irrigated trees (DI, red) of three representative days (12 June (circle), 2 July (square), 11 August (diamond)) from 10:30 to 15:30 h during 2021 season. (*** p < 0.001).
Plants 10 02780 g009
Figure 10. Microtensiometer installation scheme (A) and real sensor installed into the tree (B).
Plants 10 02780 g010
Table 1. Sensitivity analysis of stem water potential (Ψstem) measured with the pressure chamber (PC) and the microtensiometers (MT), stomatal conductance (Gs), and canopy-to-air temperature (Tc-Ta) for four periods throughout the day (N = 24).
MorningMidday
ΨstemGsTc-TaΨstemGsTc-Ta
PCMT PCMT
SI 11.261.300.900.711.301.260.830.45
CV0.060.090.100.680.070.070.130.45
S19.4814.449.061.0517.6518.166.531.02
AfternoonEvening
ΨstemGsTc-TaΨstemGsTc-Ta
PCMT PCMT
SI 11.311.260.820.621.231.231.080.72
CV0.040.070.120.370.040.050.200.30
S34.0218.167.001.6729.9323.895.522.42
1 SI: signal intensity (DI CTL−1); CV: coefficient of variation; S: sensitivity (SI CV−1).
Table 2. Sensitivity analysis of stem water potential (Ψstem) measured with the pressure chamber (PC) and the microtensiometers (MT), stomatal conductance (Gs), and canopy-to-air temperature (Tc-Ta) for different days throughout the growing season (N = 24).
12 June2 July
ΨstemGsTc-TaΨstemGsTc-Ta
PCMT PCMT
SI 11.031.081.010.981.091.090.960.66
CV0.060.080.130.390.040.050.150.73
S17.0613.818.032.5327.6021.146.550.91
31 July11 August
ΨstemGsTc-TaΨstemGsTc-Ta
PCMT PCMT
SI 11.431.360.790.311.541.520.870.56
CV0.060.080.110.410.050.070.160.27
S22.6416.477.240.7528.3022.315.512.08
1 SI: signal intensity (DI CTL−1); CV: coefficient of variation; S: sensitivity (SI CV−1).
Publisher’s Note: MDPI stays neutral with regard to jurisdictional claims in published maps and institutional affiliations.

