Article

Flavonoids Accumulation in Fruit Peel and Expression Profiling of Related Genes in Purple (Passiflora edulis f. edulis) and Yellow (Passiflora edulis f. flavicarpa) Passion Fruits

1
College of Horticulture, Fujian Agriculture and Forestry University, Fuzhou 350002, China
2
Institute of Biotechnology, Fujian Academy of Agricultural Sciences, Fuzhou 350003, China
*
Authors to whom correspondence should be addressed.
Plants 2021, 10(11), 2240; https://doi.org/10.3390/plants10112240
Submission received: 5 October 2021 / Revised: 13 October 2021 / Accepted: 18 October 2021 / Published: 20 October 2021
(This article belongs to the Special Issue Advance in Fruit Development)

Abstract

:
Flavonoids play a key role as a secondary antioxidant defense system against different biotic and abiotic stresses, and also act as coloring compounds in various fruiting plants. In this study, fruit samples of purple (Passiflora edulis f. edulis) and yellow (Passiflora edulis f. flavicarpa) passion fruit were collected at five developmental stages (i.e., fruitlet, green, veraison, maturation, and ripening stage) from an orchard located at Nanping, Fujian, China. The contents of flavonoid, anthocyanin, proanthocyanin, and their metabolites were determined using ultra-performance liquid chromatography-mass spectrometry (UPLC-MS), activities of key enzymes involved in flavonoid metabolism were measured, and expression profiling of related genes was done using quantitative real-time PCR (qRT-PCR). The results revealed that total flavonoids, anthocyanins, and procyanidins were found to be increased in the fruit peel of both cultivars with fruit maturity. Total flavonoids, anthocyanins, procyanidins, flavonoid metabolites (i.e., rutin, luteolin, and quercetin), and anthocyanin metabolites (i.e., cyanidin-3-O-glucoside chloride, peonidin-3-O-glucoside, and pelargonidin-3-O-glucoside) were found abundant in the peel of purple passion fruit, as compared to yellow passion fruit. Principle component analysis showed that the enzymes, i.e., C4H, 4CL, UFGT, and GST were maybe involved in the regulation of flavonoids metabolism in the peel of passion fruit cultivars. Meanwhile, PePAL4, Pe4CL2,3, PeCHS2, and PeGST7 may play an important role in flavonoid metabolism in fruit peel of the passion fruit. This study provides new insights for future elucidation of key mechanisms regulating flavonoids biosynthesis in passion fruit.

1. Introduction

The passion fruit (Passiflora edulis Sims.) belongs to the Passifloraceae family, is native to tropical America, and has more than 500 species of which at least 50 or more are edible [1]. It is also called passion flower or egg fruit because it contains apple, guava, banana, strawberry, mango, pineapple, and 130 other kinds of fruit aroma [2,3]. The peel and pulp of passion fruit have many biological functions, such as controlling blood sugar [4], anti-hypertension [5,6], anti-inflammation and reducing fat [7], protecting liver and kidney [8], and regulating cardiac autonomic nerve functions [9]. In addition, passion fruit peel powder can be used as food raw material when added to baking products [10,11]. Passion fruit has high nutritional value and medicinal value and has great development potential [12].
Flavonoids widely exist in various horticultural plants and have a variety of biological activities [13], including chemoprophylaxis, inhibition of tumor growth [14], cancer prevention, anti-inflammation, and anti-oxidation [15], etc. In addition, flavonoids play an important role in preventing UV damage, signal transduction between plant and microorganisms, plant coloration, and defense [15]. The final flavonoid concentration in ripened fruits depends on the balance of flavonoid synthesis, membrane transport, and degradation or utilization [16,17]. In this process, flavonoid metabolism-related enzymes including L-phenylalanine ammonia-lyase (PAL), cinnamate 4-hydrogenase (C4H), 4-coumarate: coenzyme A Ligase (4CL), chalcone synthase (CHS), UPD-3-O- glycosyltransferase (UFGT), and glutathione S-transferase (GST) may potentially play a role in fruit flavonoids biosynthesis and degradation [18,19,20]. The phenylalanine pathway is an important pathway for the synthesis of many secondary metabolites [21]. PAL is the first key enzyme in this pathway, which catalyzes the decomposition of phenylalanine into cinnamic acid and enters the flavonoid synthesis pathway [22,23]. 4CL is diversified by type III polyketone synthase (PKSs) to produce different products [24]. CHS is a key enzyme in the synthesis of naringin chalcone, which belongs to PKSs [25]. UFGT, as a key enzyme in anthocyanin synthesis, stabilizes anthocyanin mainly by attaching the sugar portion to anthocyanin glycogens [26]. GST plays a major role in anthocyanin transport, and the loss of function of these proteins results in the absence of a pigmentation phenotype in plants [27].
At present, Passiflora edulis f. edulis and Passiflora edulis f. flavicarpa are the main cultivated varieties, widely appreciated and accepted by consumers worldwide due to their unique flavor and high medicinal value [28,29]. There are obvious differences in the color of both cultivars during growth and development (especially at the veraison stage), which makes them good material to study the change in color of passion fruit peel [30]. Although the study of flavonoid metabolism pathway in plants has been very clear and in-depth and has been widely reported in fruits such as apples [31], mulberry [32], and grapes [33,34], dynamics of flavonoid contents, the activity of key enzymes encoding flavonoid synthesis and related gene expression during passion fruit development is still unclear. In this study, to explore the synthesis and accumulation mechanism of flavonoids and the regulation mechanism of structural genes in passion fruits, the content of flavonoid metabolites, components, activities of key enzymes related to flavonoid biosynthesis, and related structural genes in peel of purple and yellow passion fruits were analyzed at different developmental stages. It laid the foundation for revealing the mechanism of flavonoid metabolic pathway in passion fruit, functional analysis of related genes, research on bioactive substances, and development and utilization of fruit peel.

2. Results

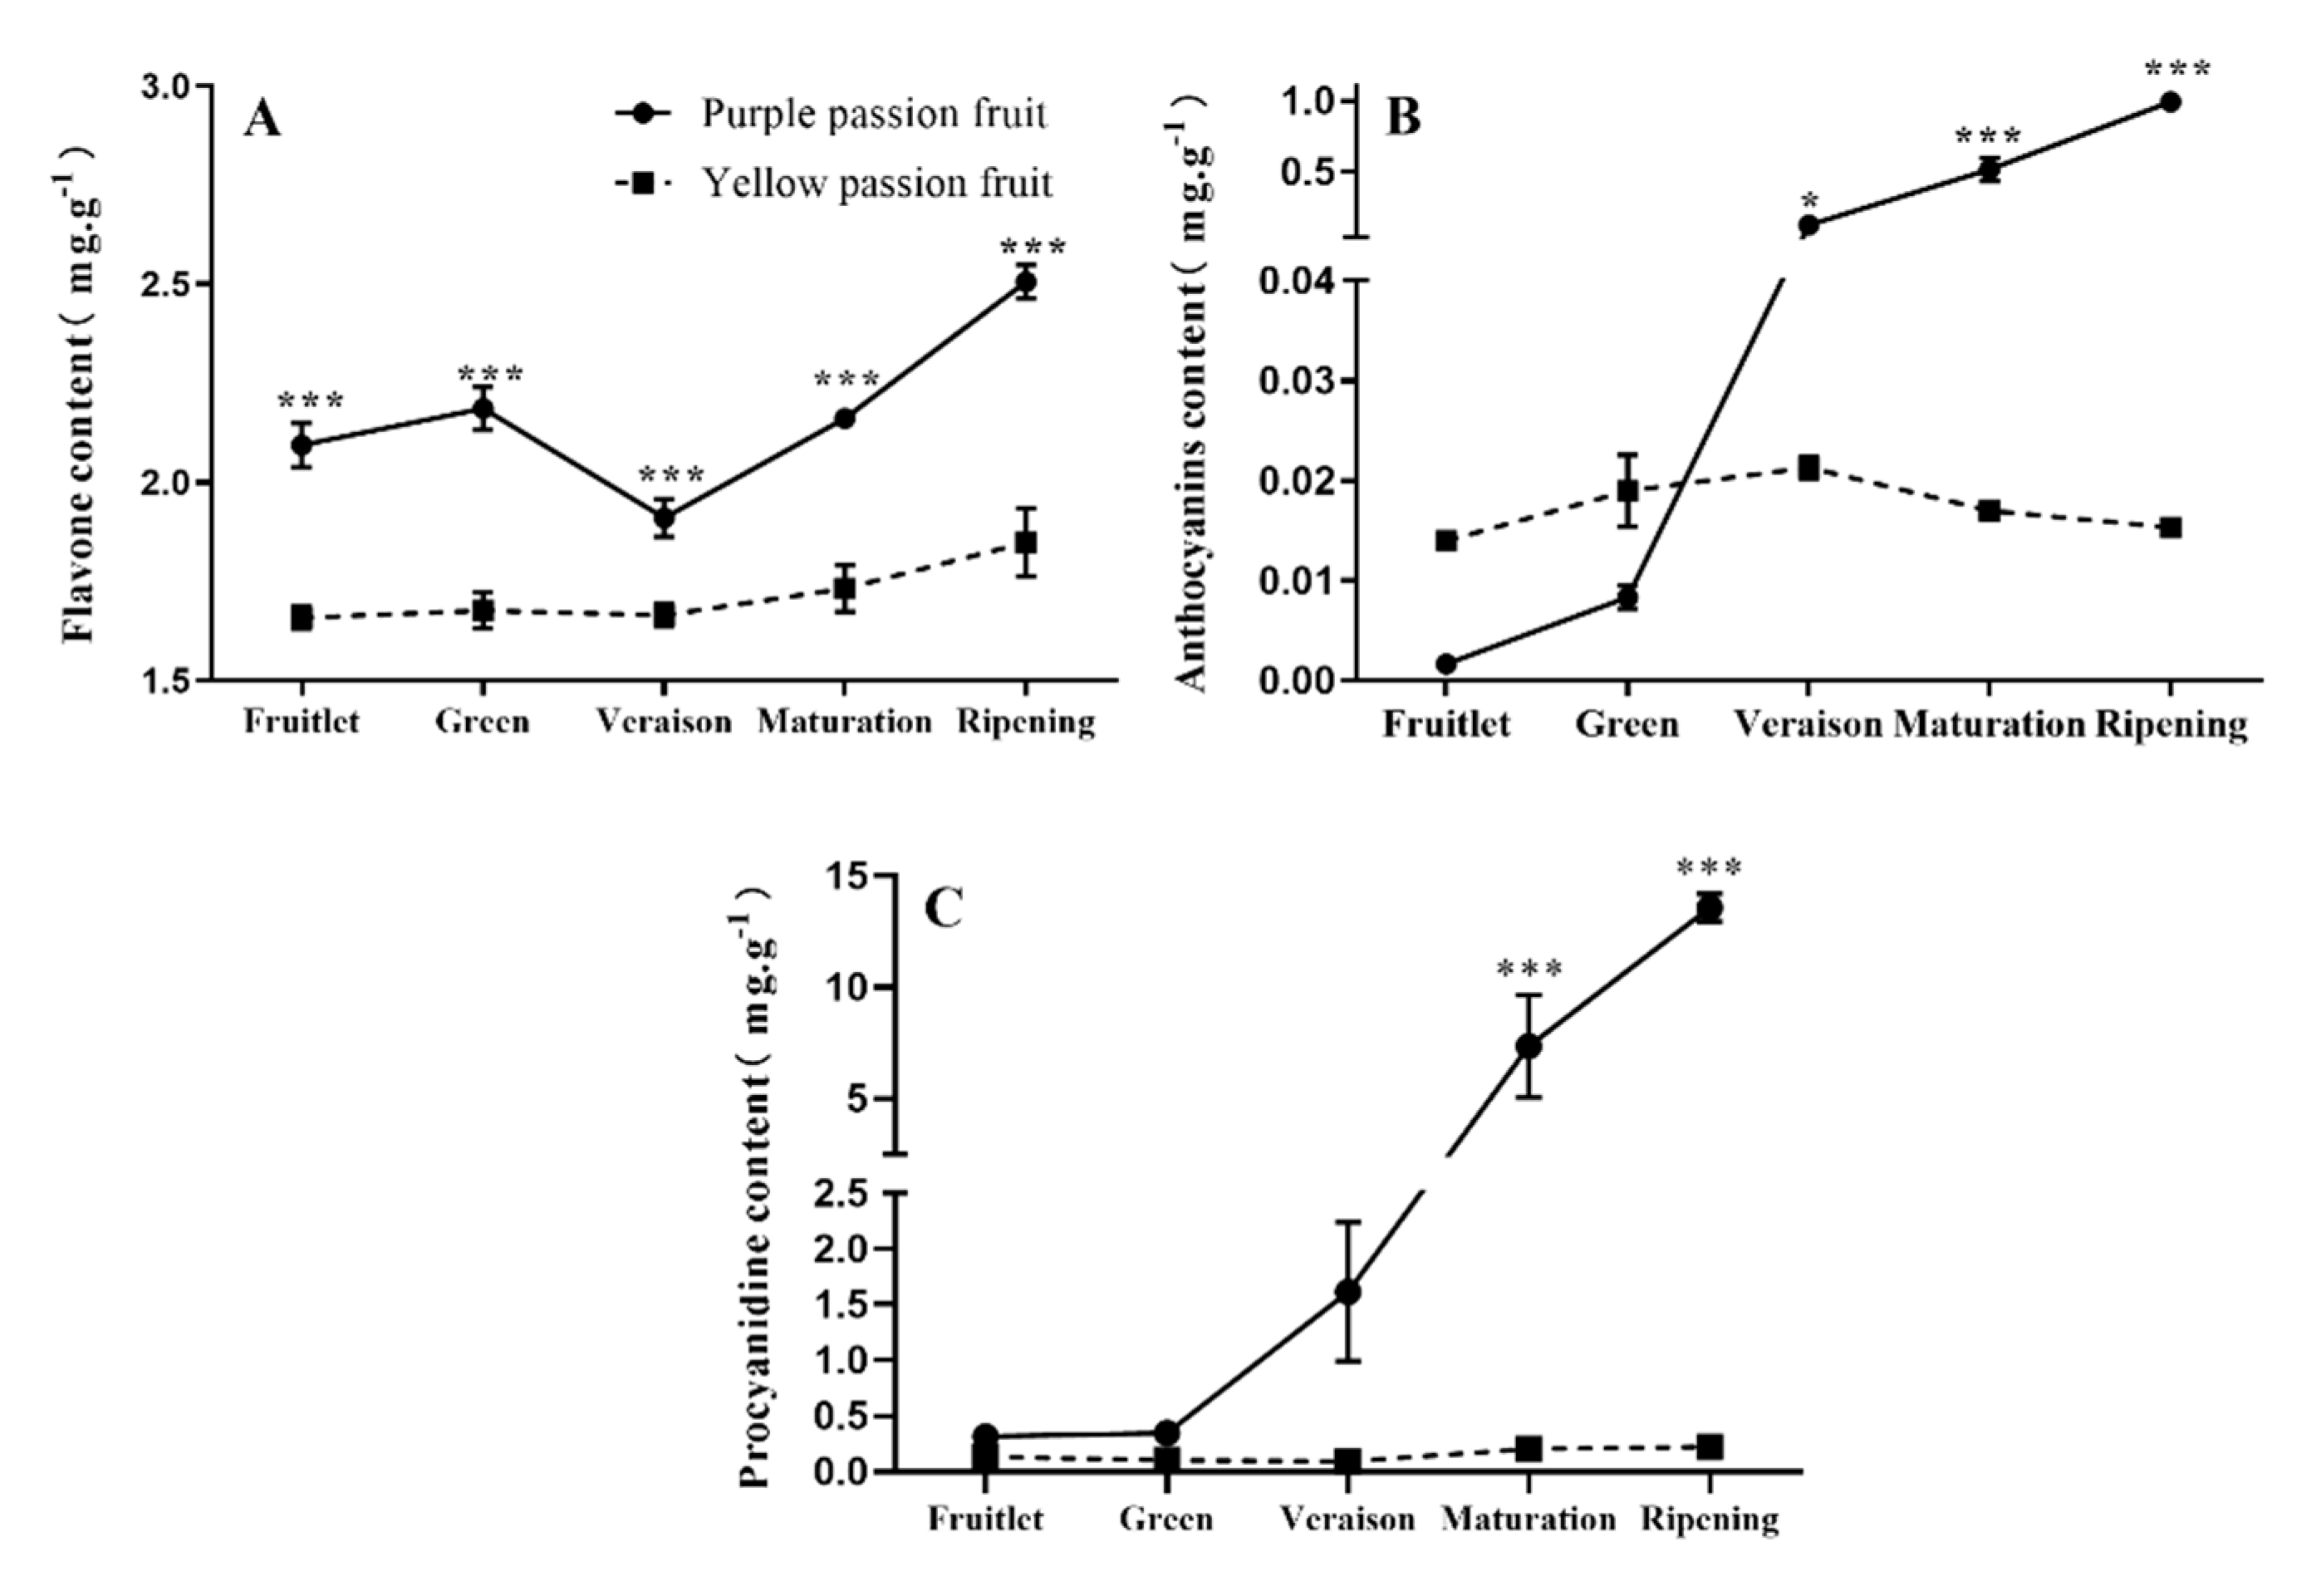
2.1. Total Flavonoids, Anthocyanins, and Procyanidins

The total flavonoid content in the peel of purple passion fruit was significantly higher than that in yellow passion fruit (Figure 1A). With the development and maturity of passion fruit, the changing trend of flavonoids in purple passion fruit and yellow fruit peel showed an inverted “L” pattern, first decreasing and then increasing. The maximum flavonoids (2.5 mg·g−1) were recorded in purple passion fruit at the ripening stage.
Anthocyanin content in the peel of purple passion fruit increased with increase in fruit maturity, while in yellow passion fruit, it increased till the veraison stage and then decreased. The anthocyanin content of purple passion fruit peel was significantly higher from veraison to the ripening stage than that of other stages and reached 1.0 mg·g−1 at late ripening stage (Figure 1B). In purple passion fruit, procyanidin content increased gradually with fruit development, while this profile was scarcely present in yellow passion fruits at all studied stages. The maximum procyanidin (13.58 mg·g−1) was recorded in the peel of purple passion fruit at ripening stage (Figure 1C).

2.2. Flavonoid and Anthocyanin Metabolites

Five flavonoid (i.e., rutin, luteolin, quercetin, apigenin, and kaempferol) and three anthocyanin metabolites (cyanidin-3-O-glucoside chloride, peonidin-3-O-glucoside, and pelargonidin-3-O-glucoside) were determined in the peel of purple and yellow passion fruits. Apigenin and kaempferol were not detected in all fruit samples, and the other three flavonoids were detected in the fruit peel of both cultivars.
The content of flavonoid components measured in purple passion fruit was significantly higher than that in yellow passion fruit. In purple passion fruit peel, the contents of six components increased gradually with fruit development, besides luteolin and quercetin which decreased slightly at the green fruit stage. The contents of rutin, luteolin, and quercetin reached the highest level at the ripening stage in purple passion fruit, 22,569.60, 29.19, and 35.25 ng·g−1, respectively. Similarly, the cyanidin-3-O-glucoside chloride, peonidin-3-O-glucoside, and pelargonidin-3-O-glucoside contents were also the highest in purple passion fruit at the ripening stage, which were 7341.62 ng·g−1, 9793.08 ng·g−1, and 511.92 ng·g−1, respectively. In the yellow passion fruit, the contents of rutin and luteolin decreased at veraison and then increased at the ripening stage. Quercetin continued to decrease with fruit development and was not detected at the ripening stage. The contents of anthocyanin components in yellow passion fruit were far less, as compared with the purple passion fruit (Table 1).

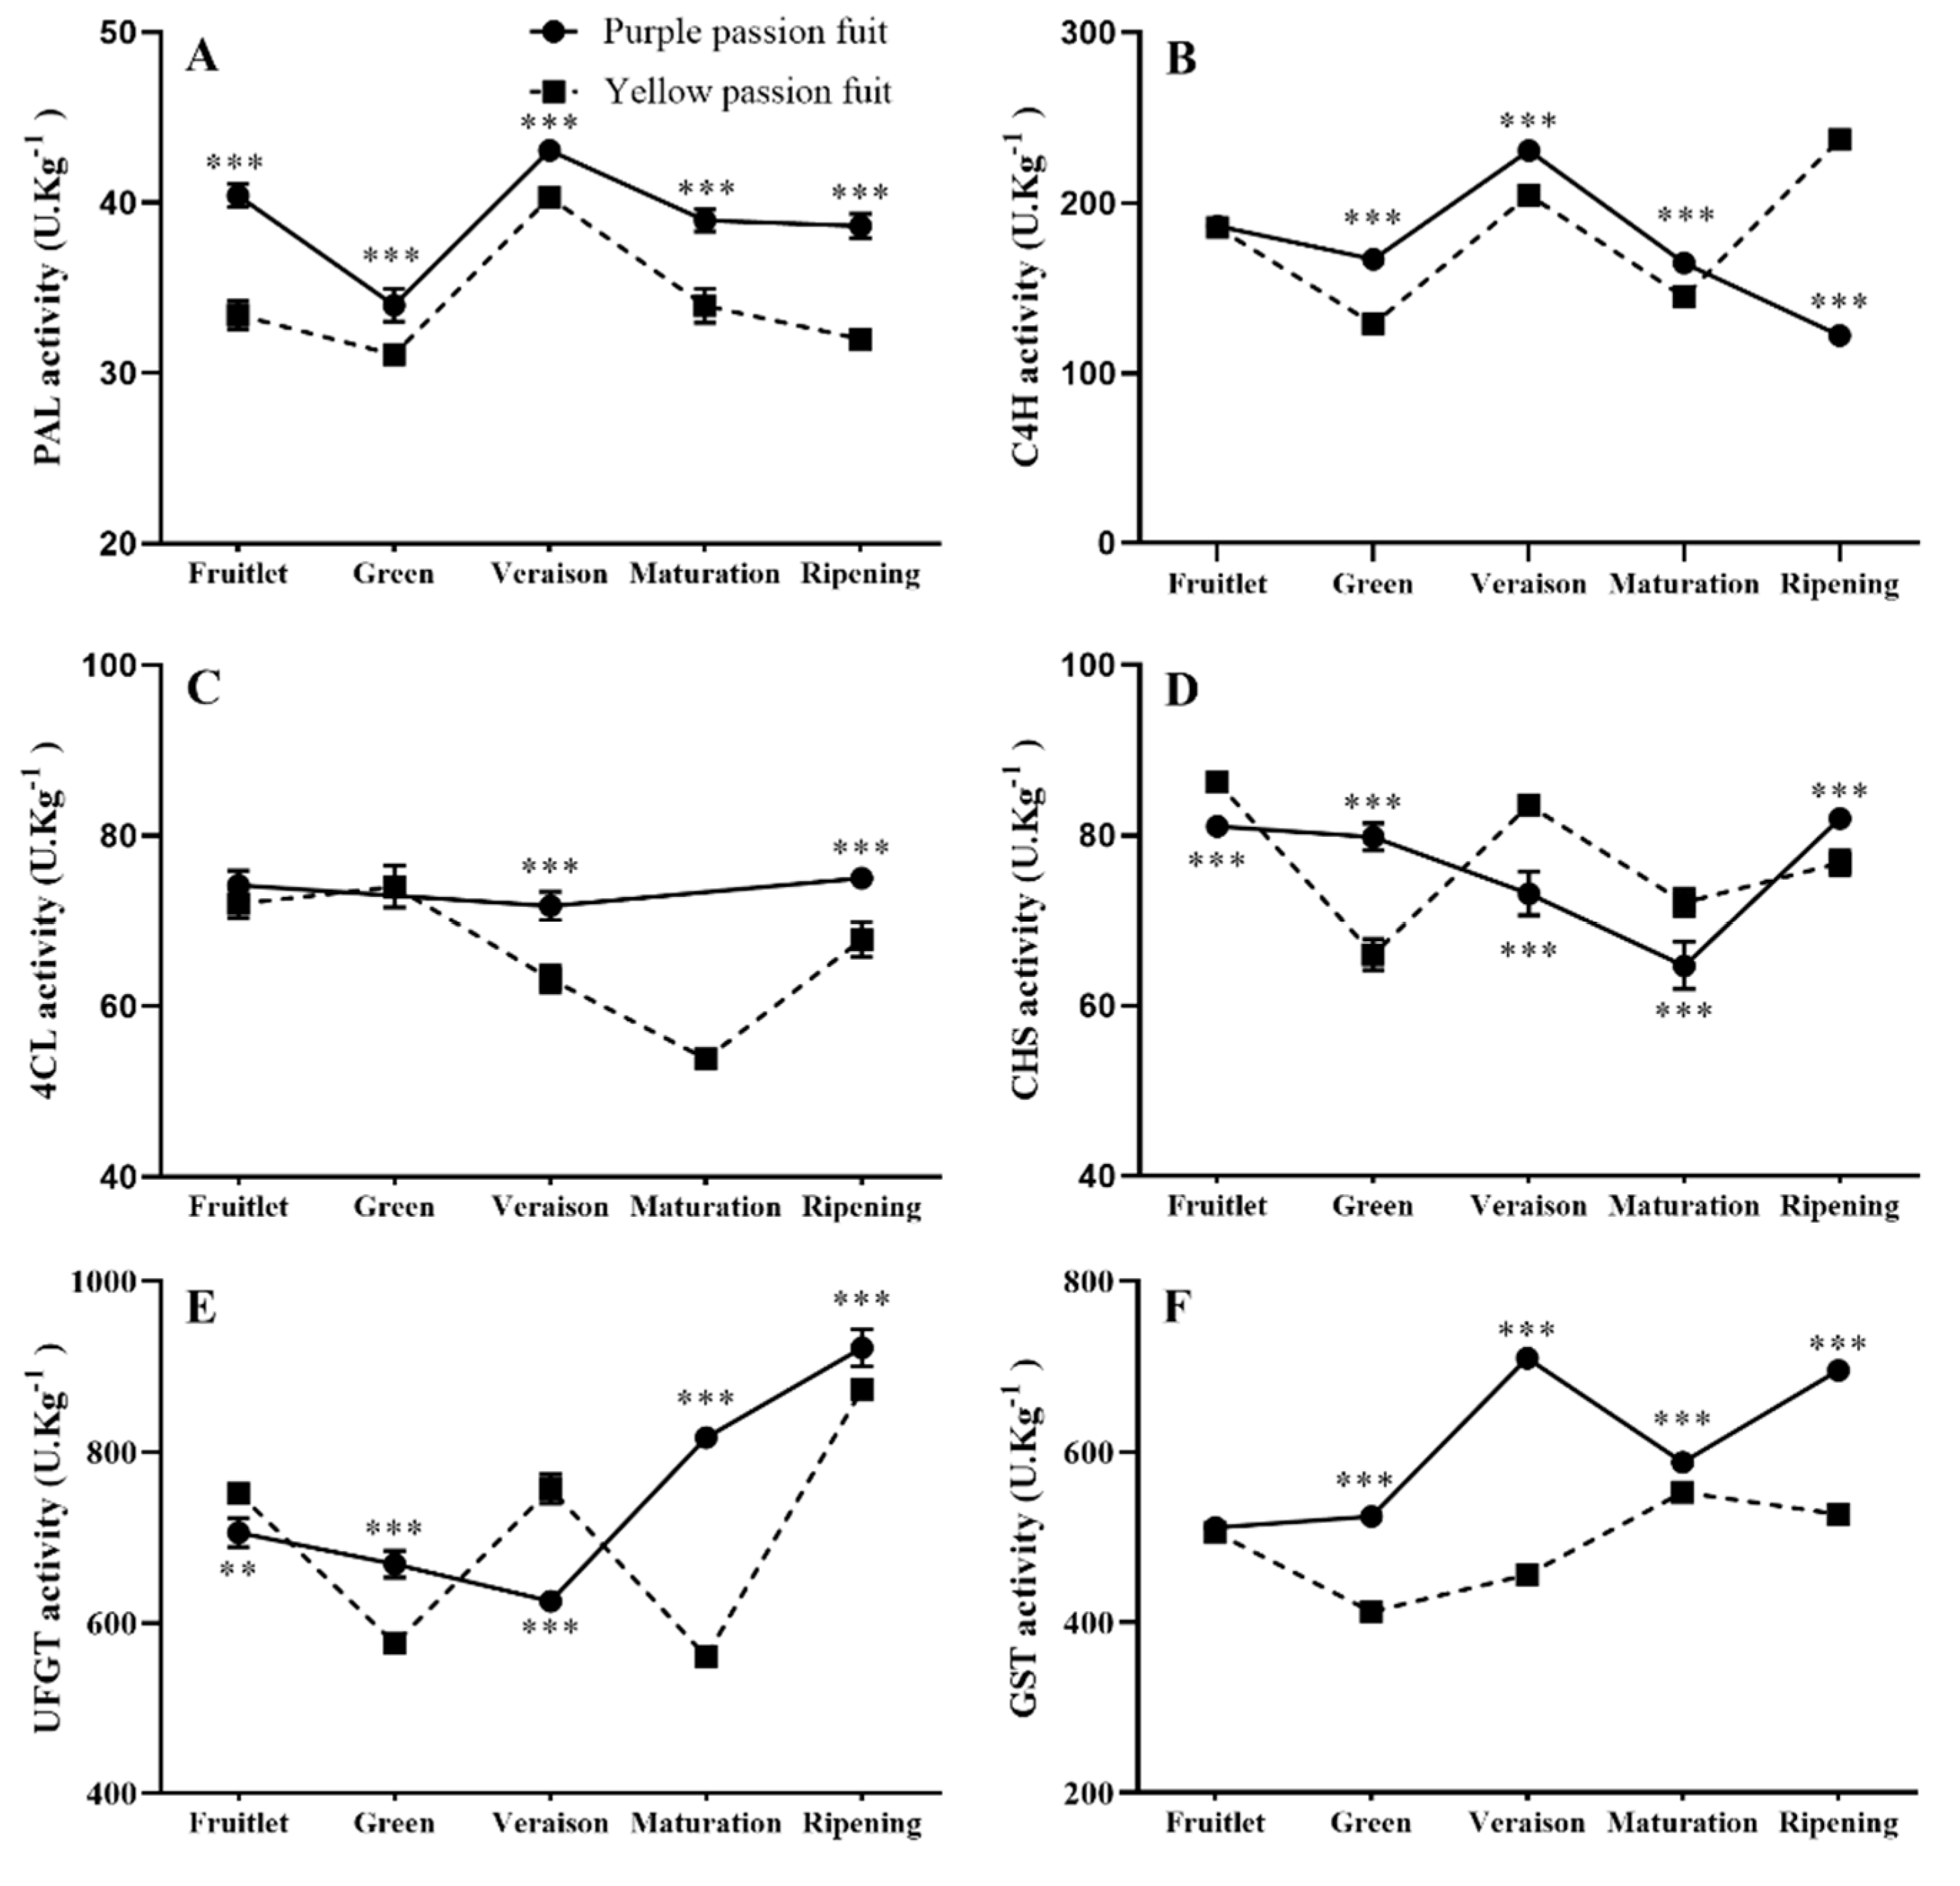
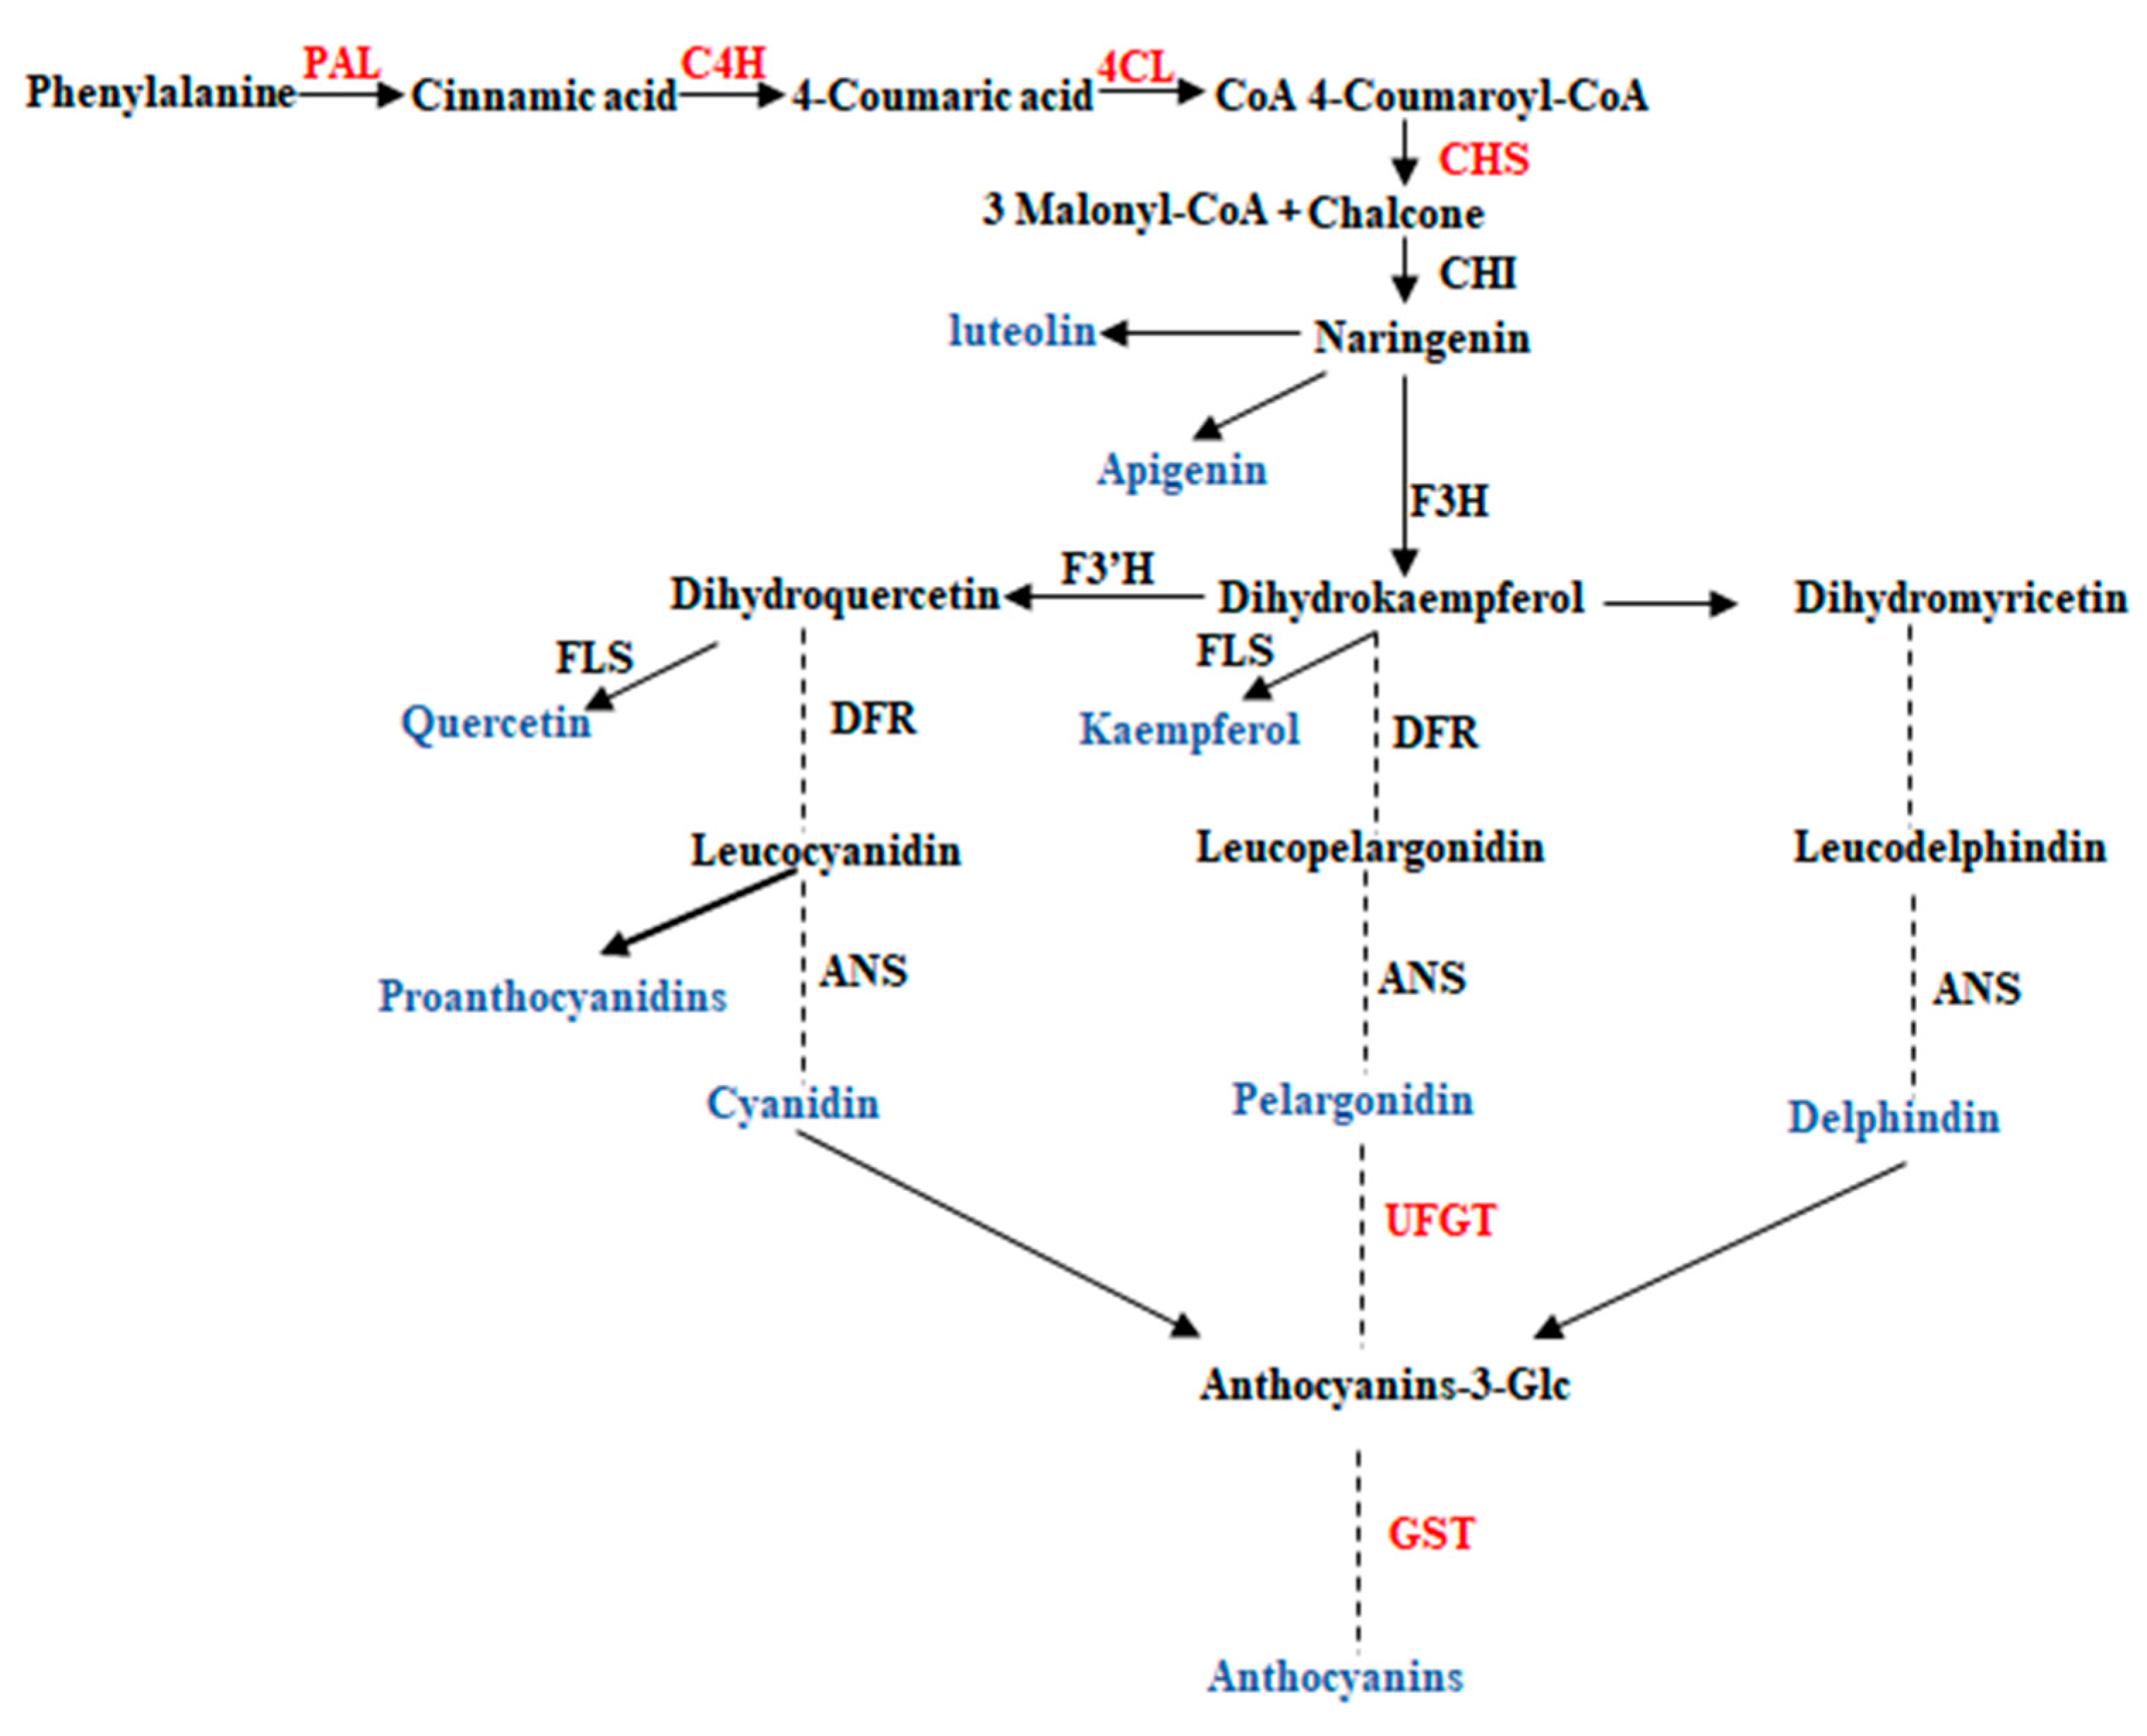
2.3. Key Enzymes Involved in Flavonoids Metabolism

The PAL activity in the peel of both cultivars reached its maximum level (43.31 U·Kg−1) at the veraison stage, and then gradually decreased with fruit maturity. The changing trend of PAL activity in purple passion fruit was significantly higher than that of yellow passion fruit at each stage (Figure 2A). There were significant differences in the C4H enzyme activity of both cultivars at each stage, except for the fruitlet stage. The maximum C4H enzyme activity was recorded in purple (232.10 U·Kg−1) and yellow passion fruit (236.34 U·Kg−1) at the veraison and ripening stage, respectively (Figure 2B). The 4CL activity in purple passion fruit was stable, first decreasing and then increasing slightly during fruit development, and there was no significant difference between fruitlet and maturation stage. In yellow passion fruit, 4CL activity decreased at the maturation stage to the lowest level (53.62 U·Kg−1) and increased at the ripening stage. After the veraison stage, the 4CL activity of purple passion fruit was significantly (p ≤ 0.001) higher than that of yellow passion fruit (Figure 2C).
The CHS activity of the peel of both examined passion fruit cultivars ranged from 65.17 to 86.77 U·Kg−1. The maximum activity was recorded at the green stage of yellow passion fruit. The CHS activity in purple and yellow passion fruit was significantly different, and the variation trend was also different (Figure 2D).
The changes in UFGT activity in the peel of both cultivars were significantly different at different fruit development stages. In purple passion fruit, the UFGT activity decreased at the veraison stage and increased sharply at the maturation and ripening stages. The difference between purple and yellow fruit passion fruit reached the maximum level at the maturation stage, and purple passion fruit was about 250 U·Kg−1 higher than yellow passion fruit (Figure 2E).
There were significant differences in GST activity between purple and yellow passion fruit peel, especially at the veraison and ripening stage. It reached the maximum in purple passion fruit, which was about 1/3 times higher than that in yellow passion fruit (Figure 2F).

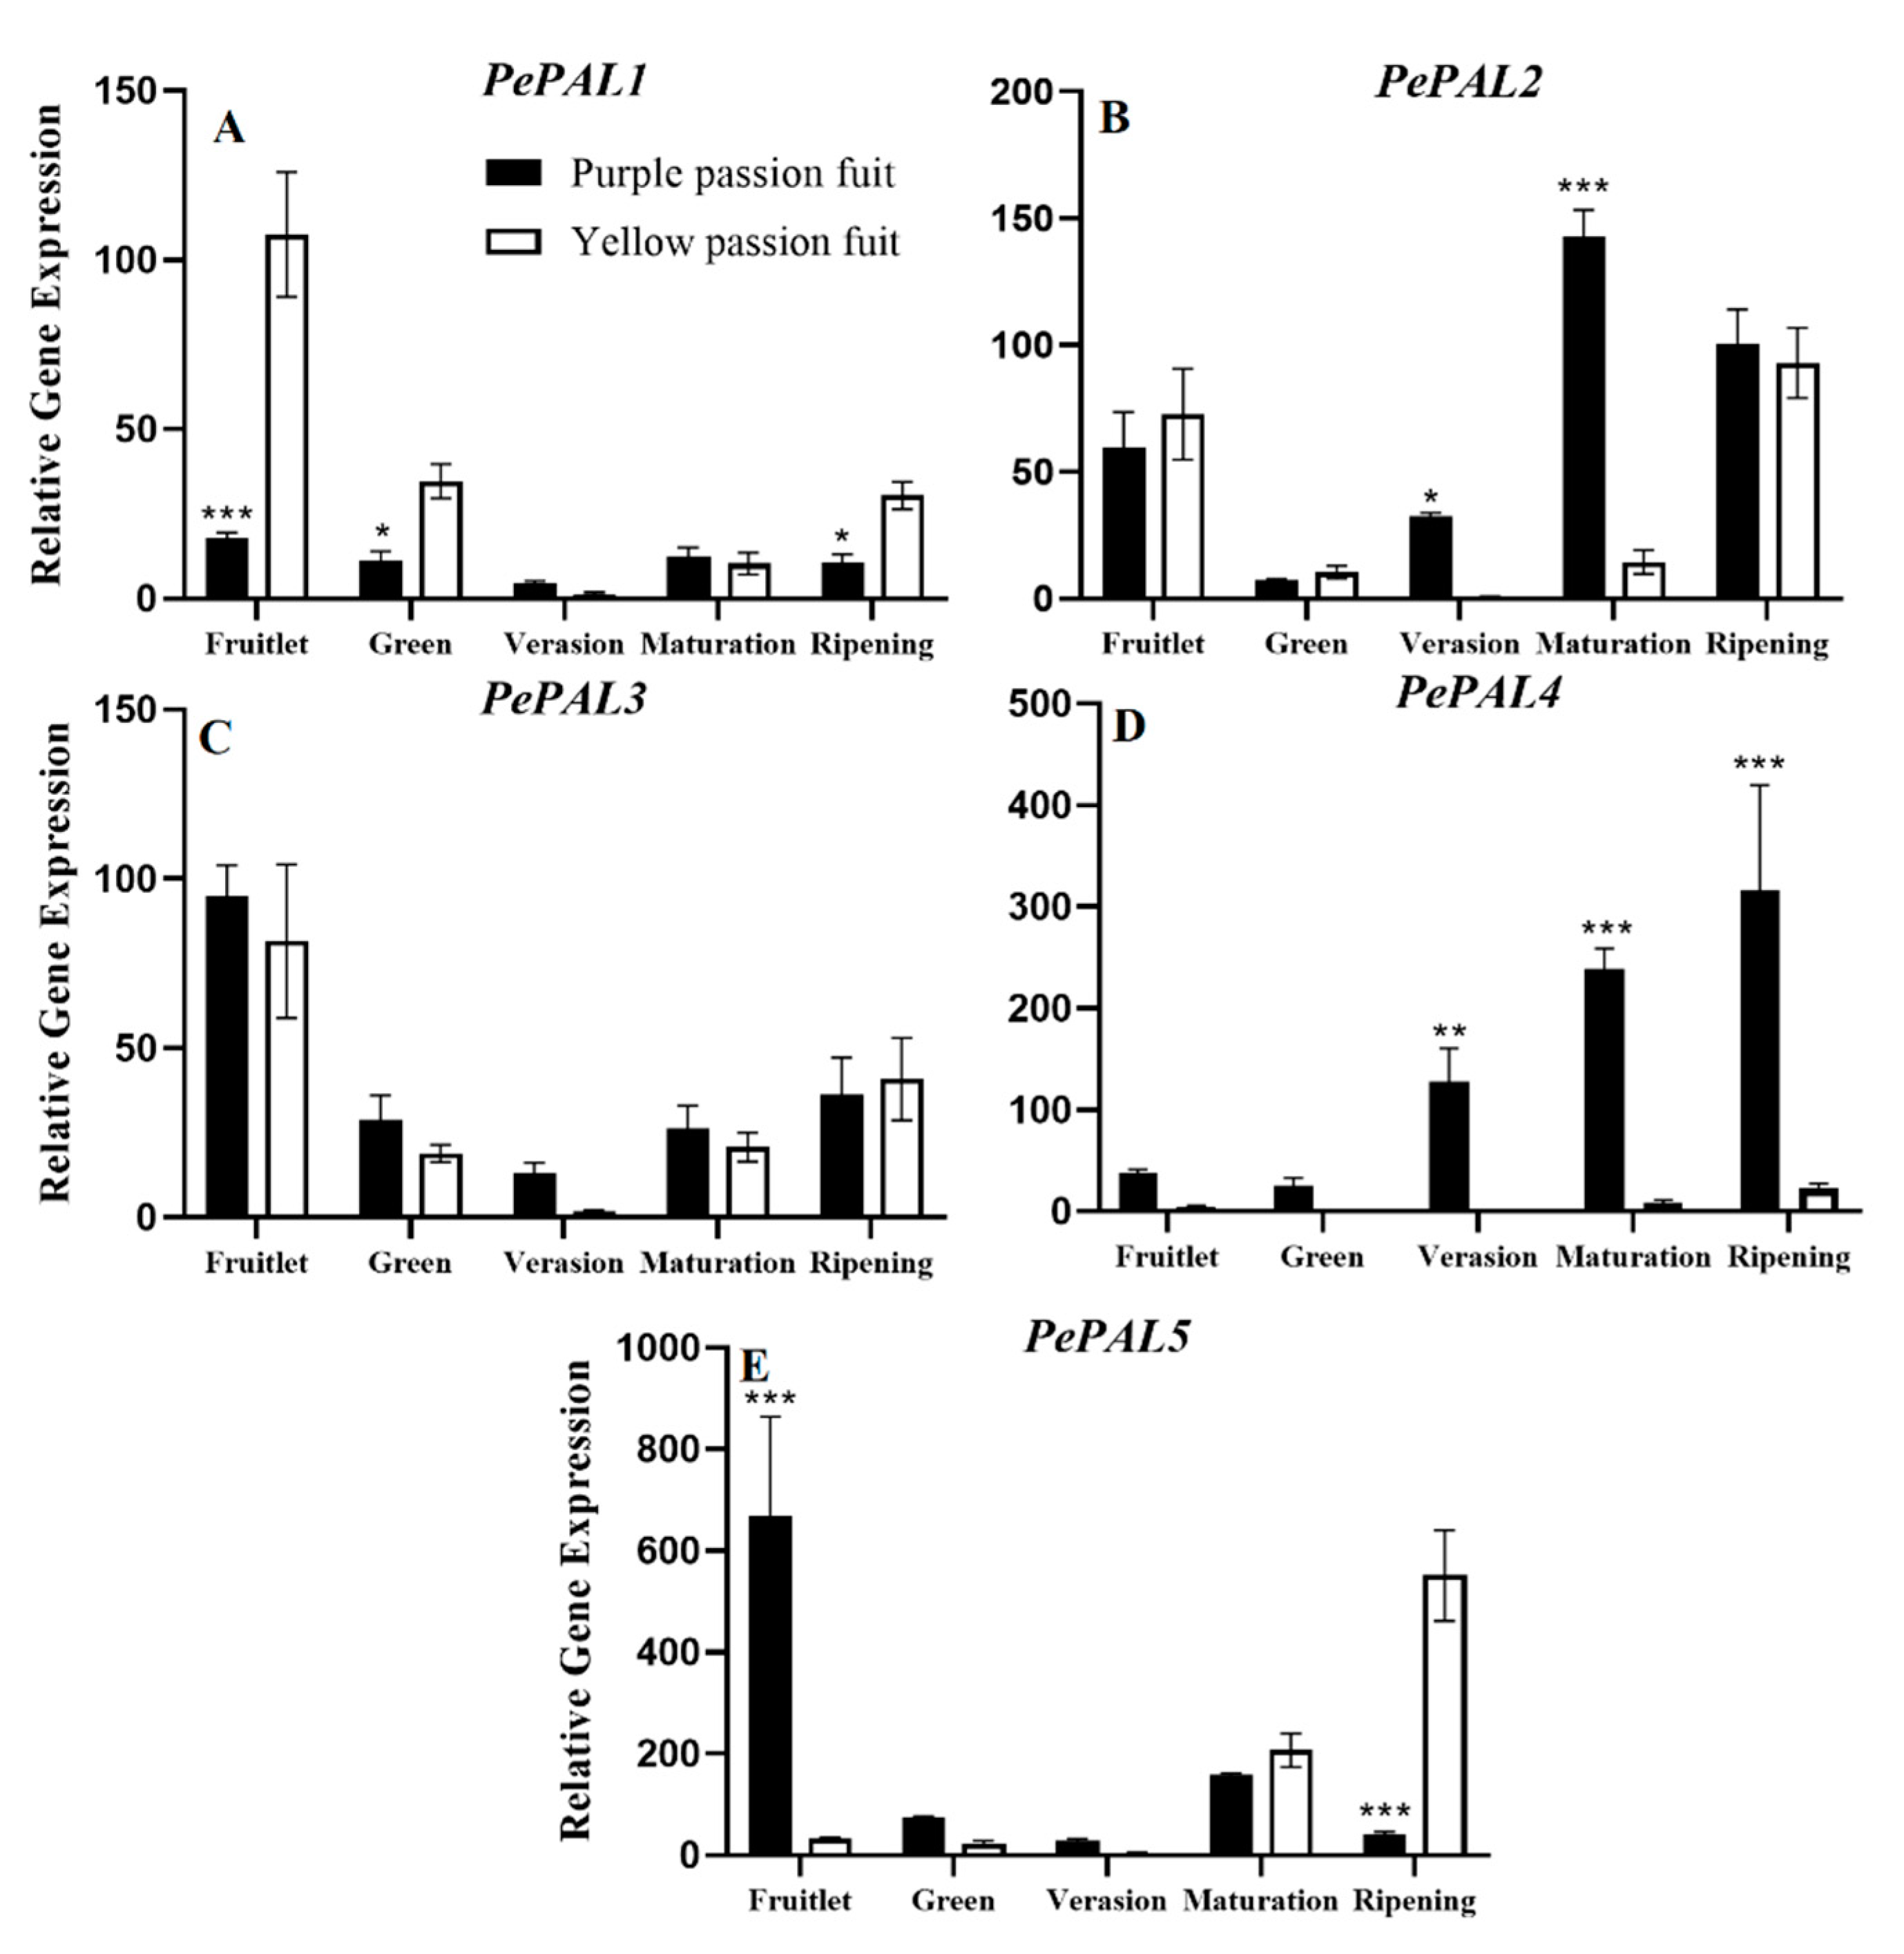
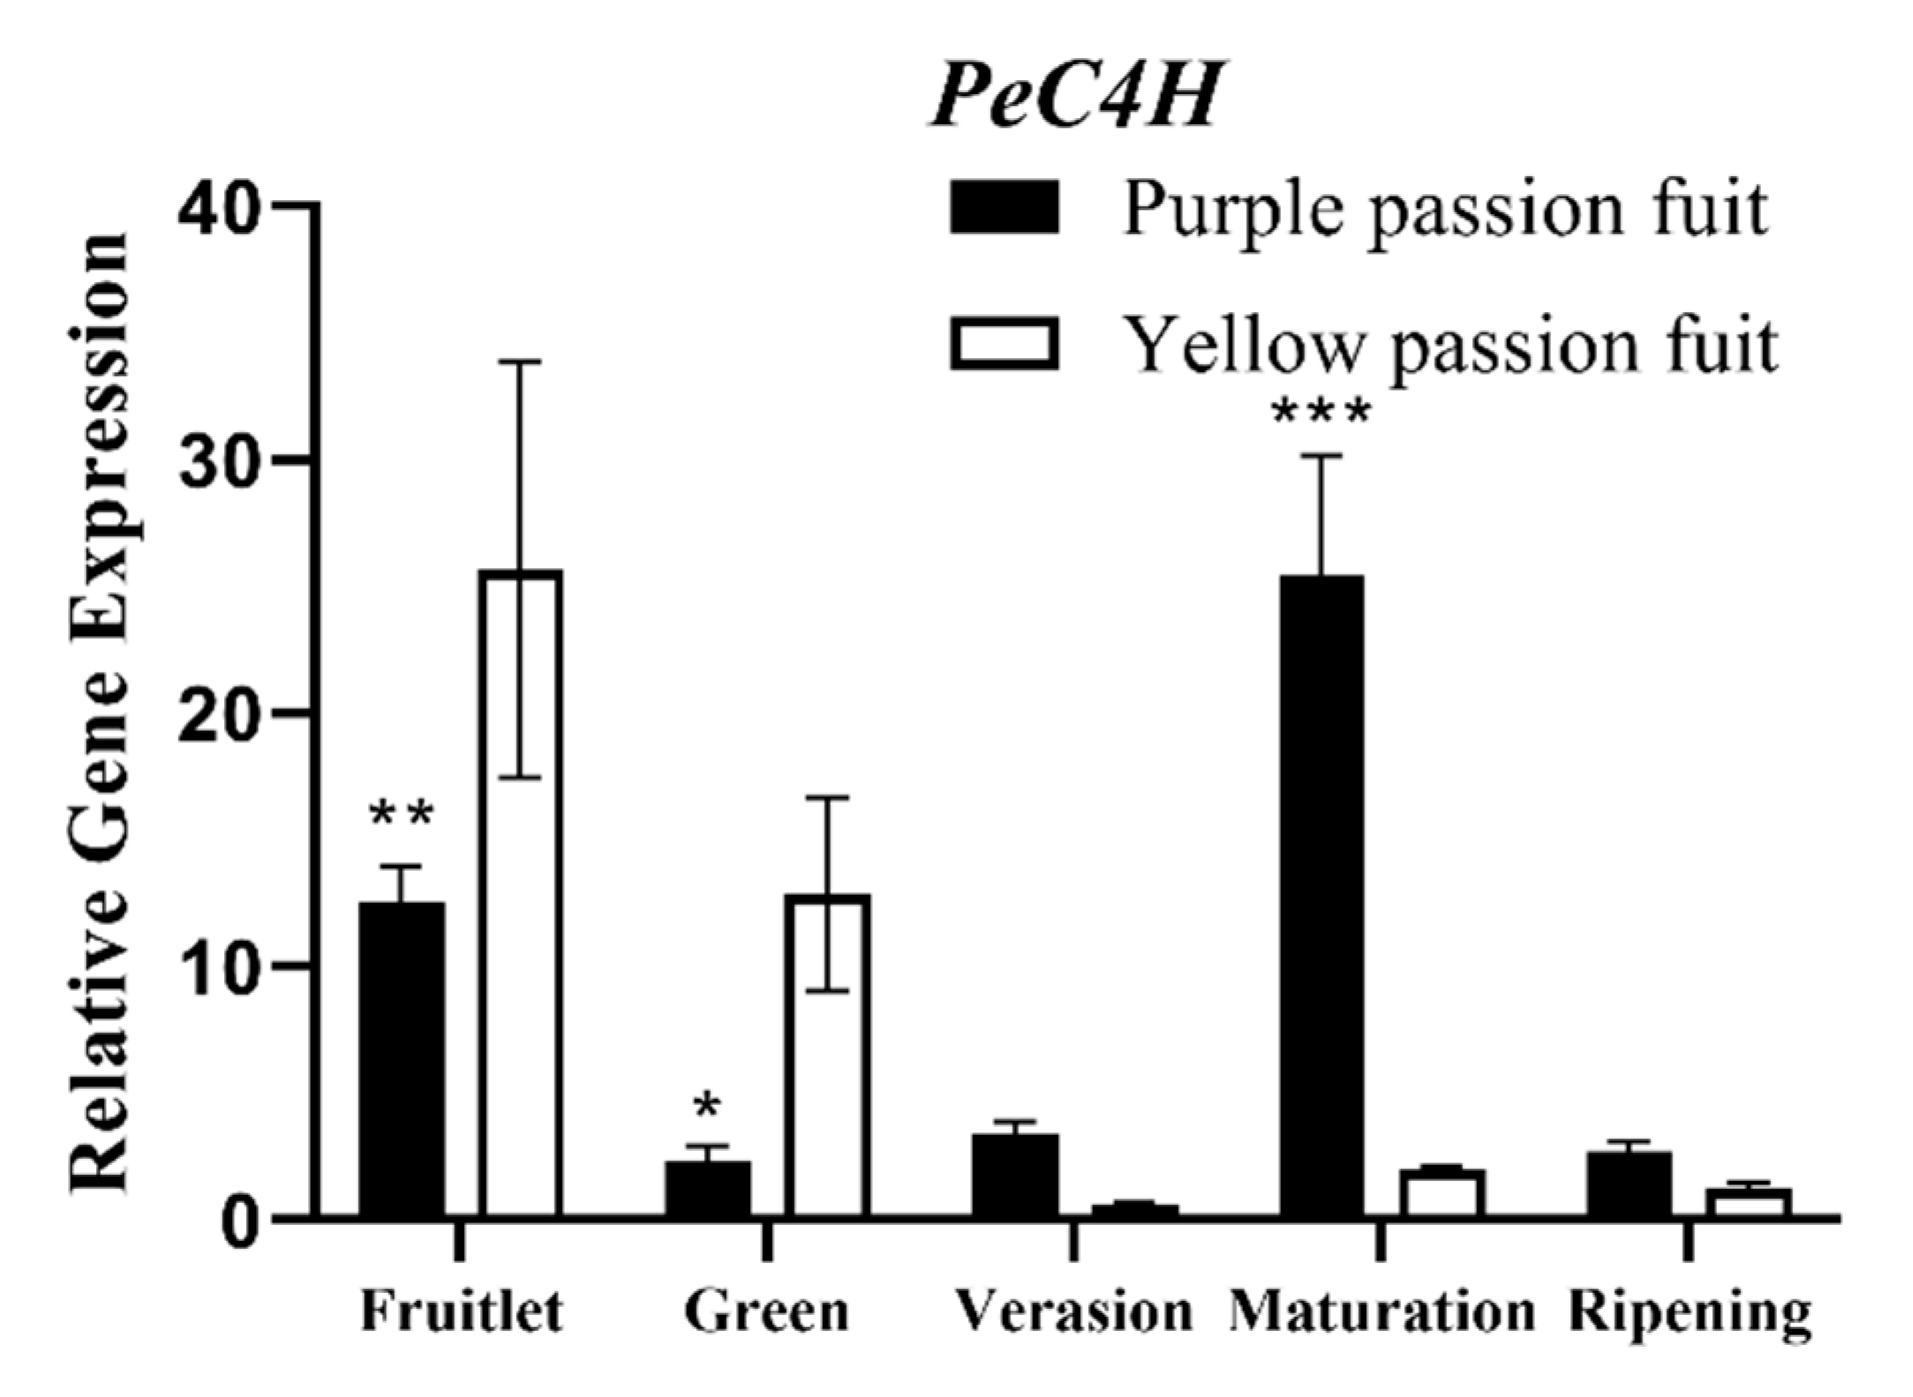
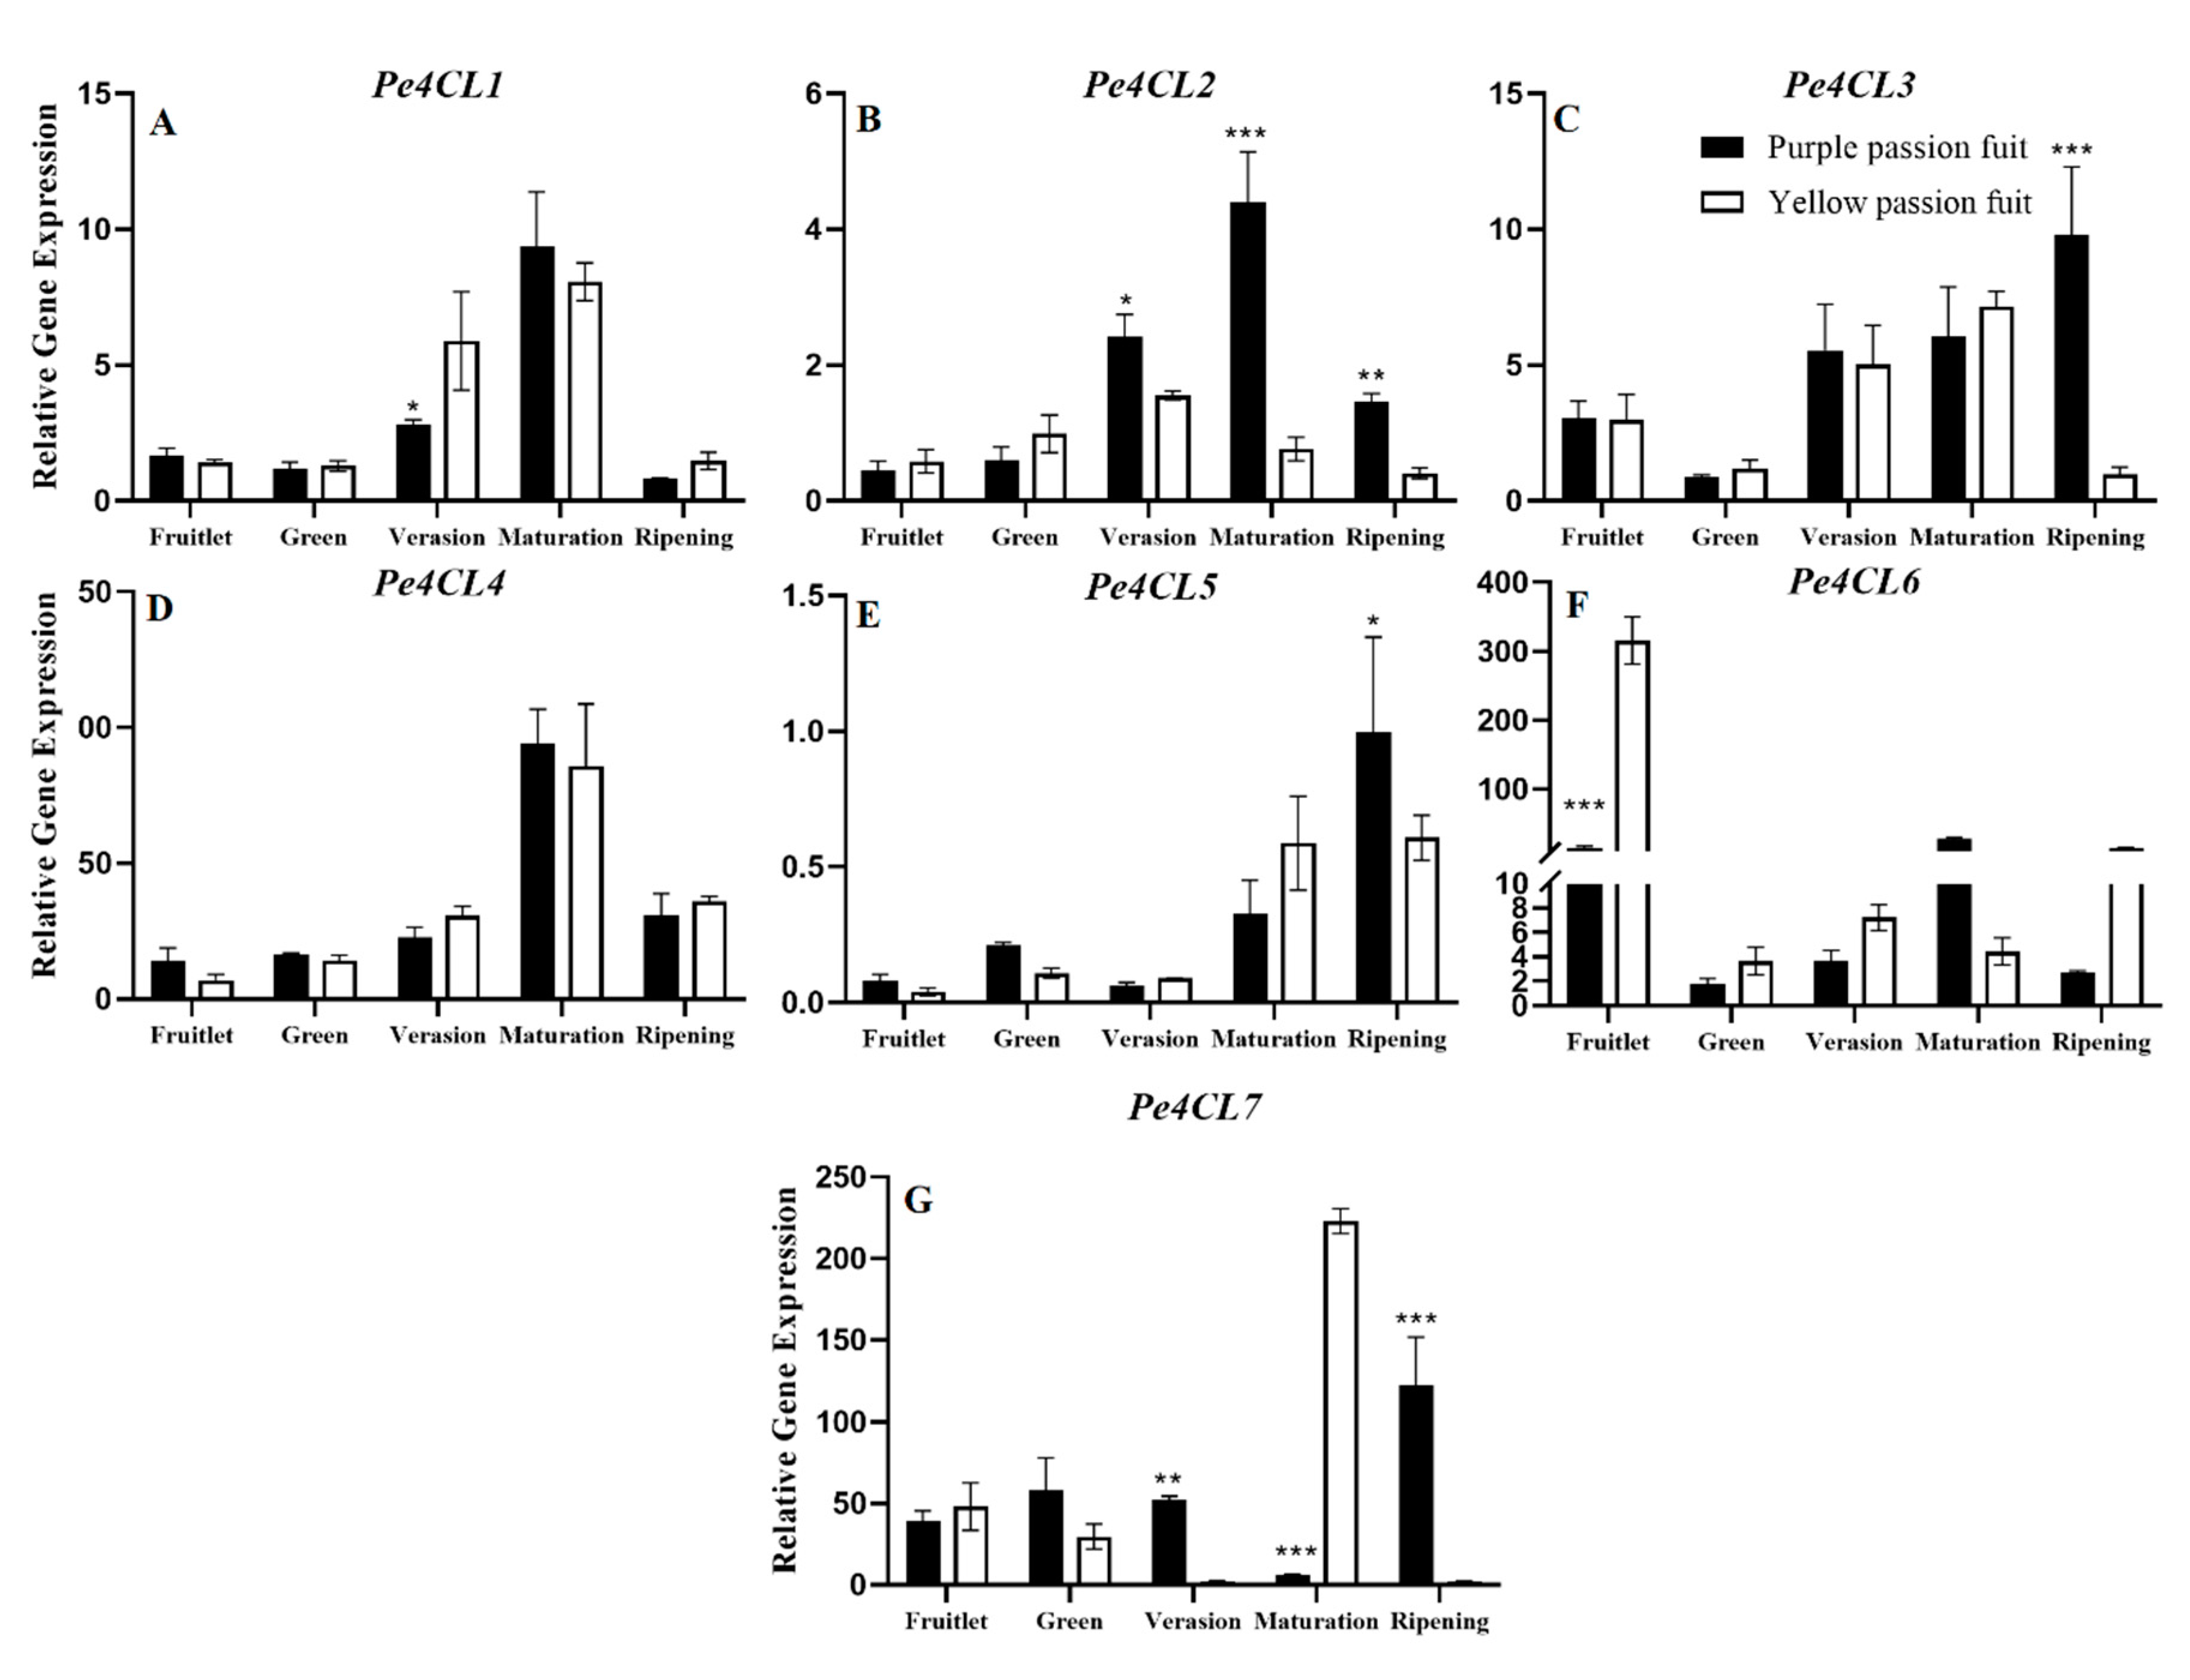
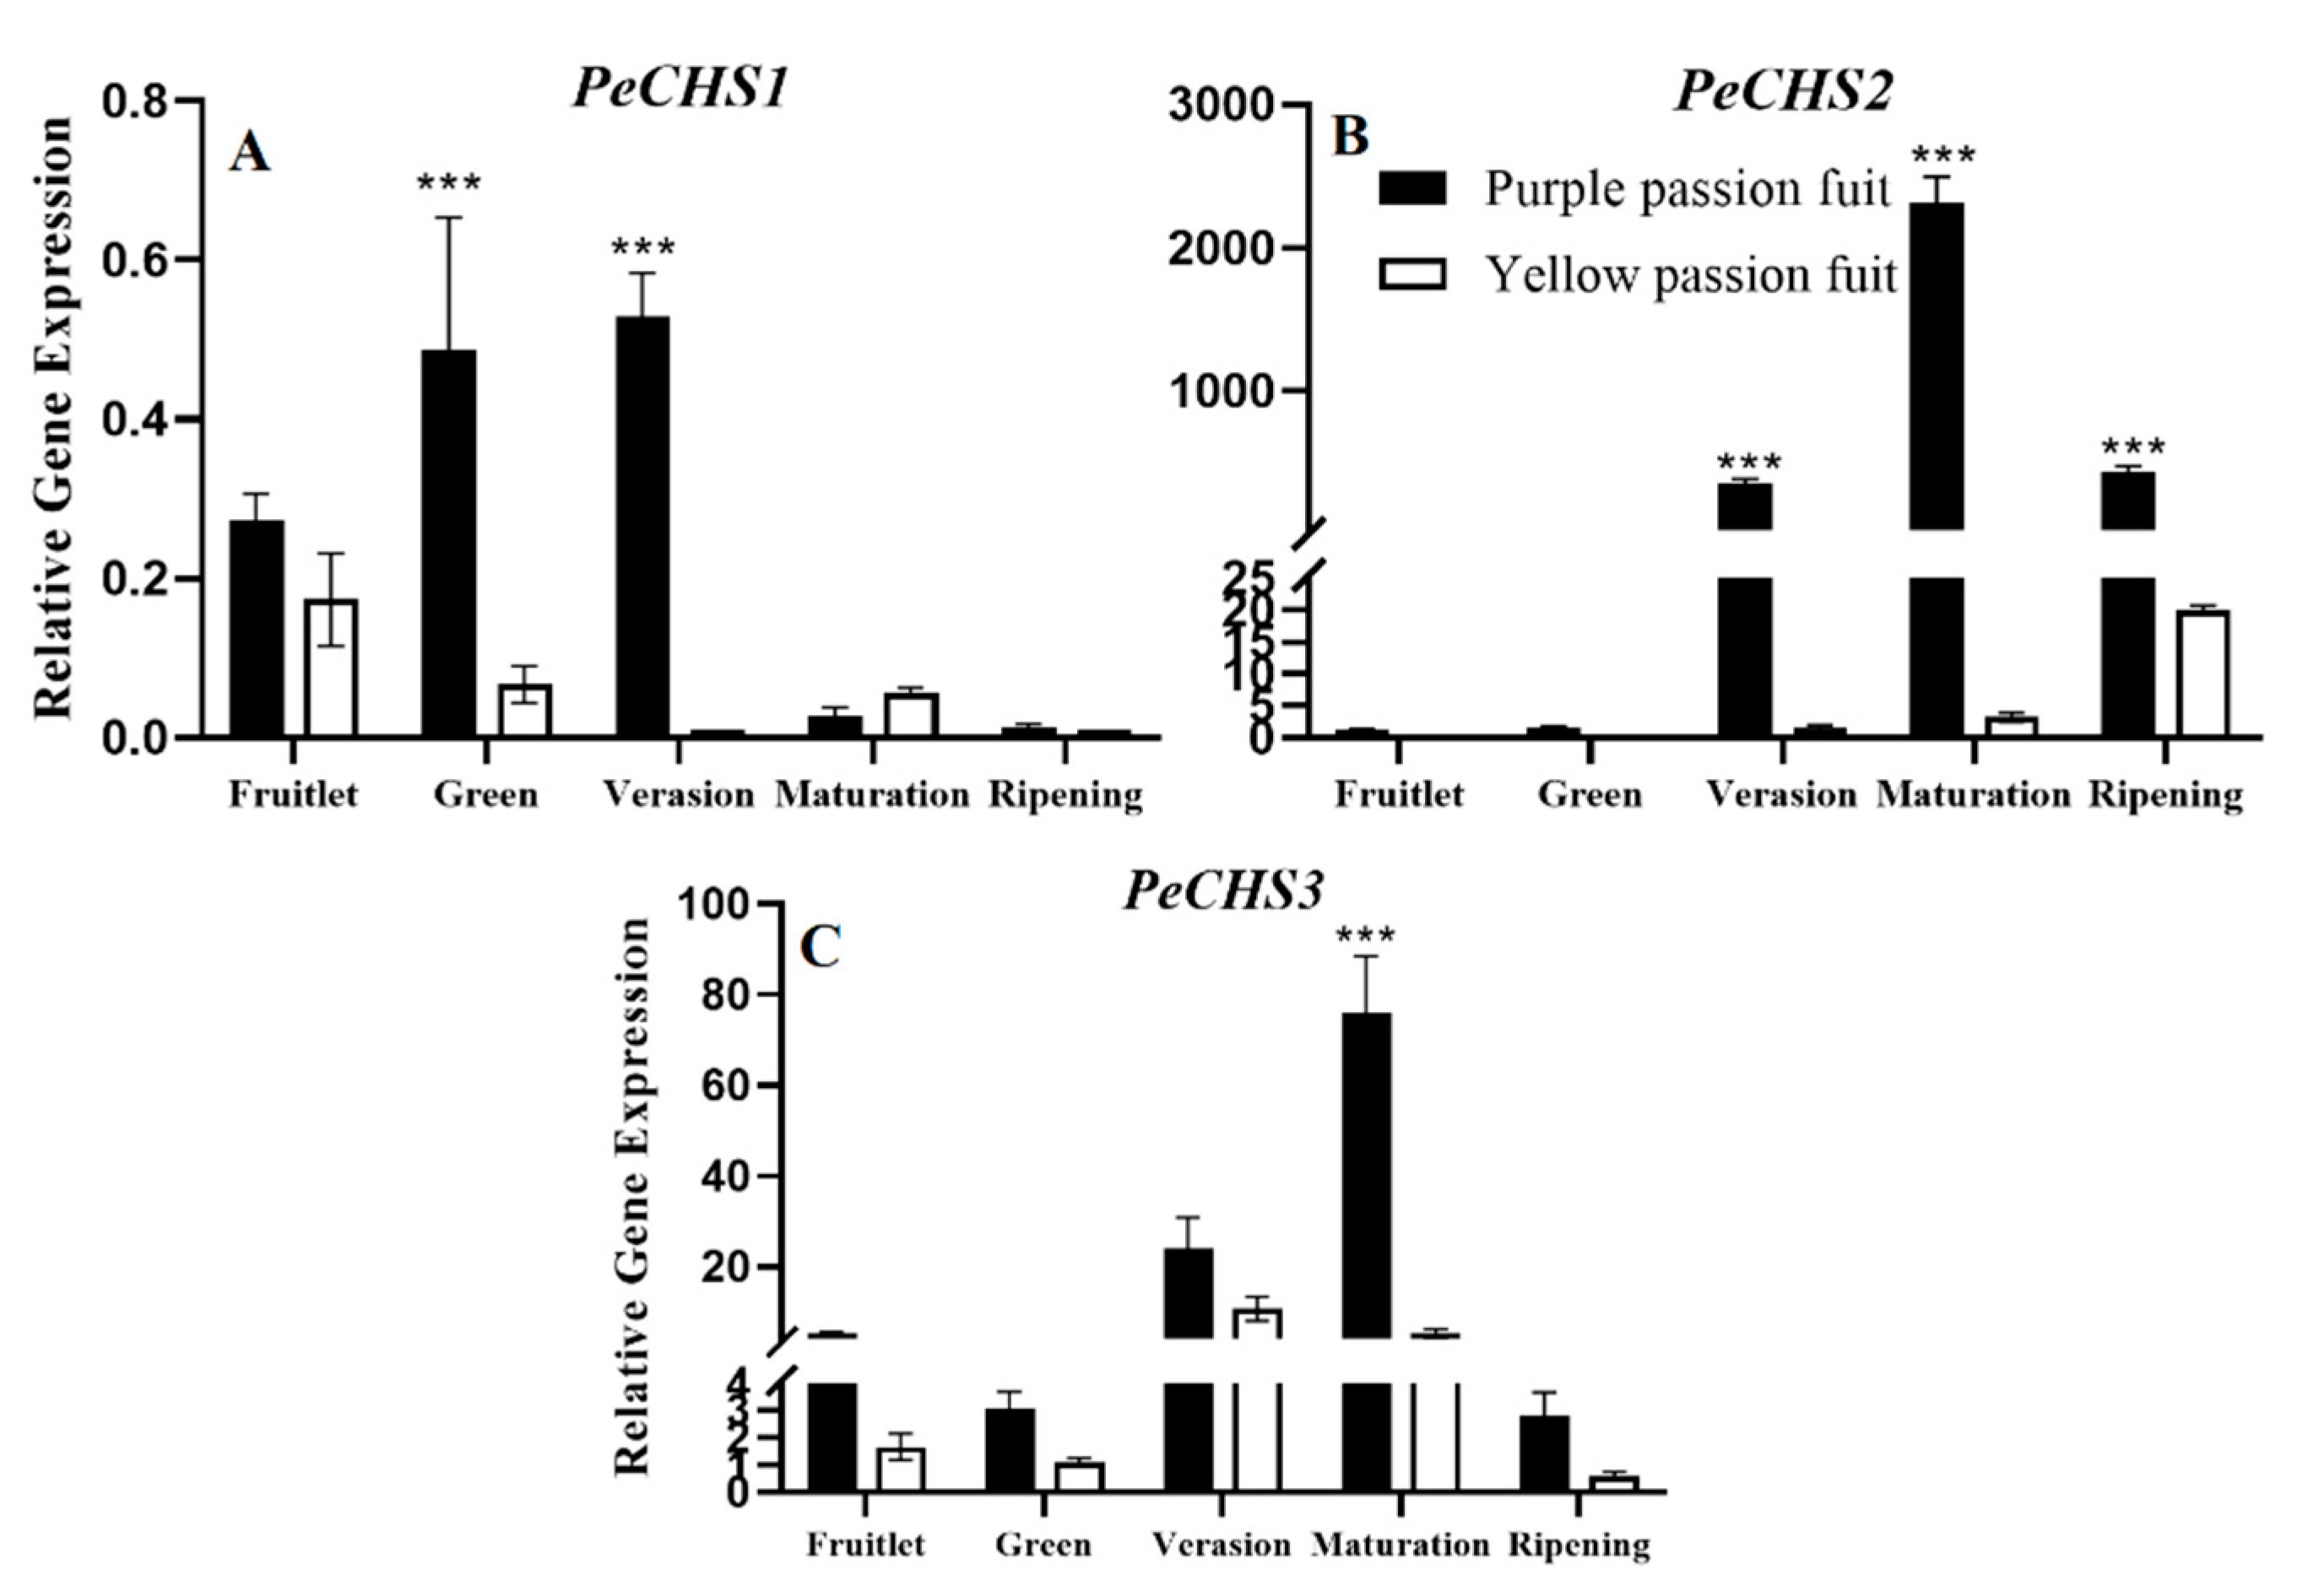
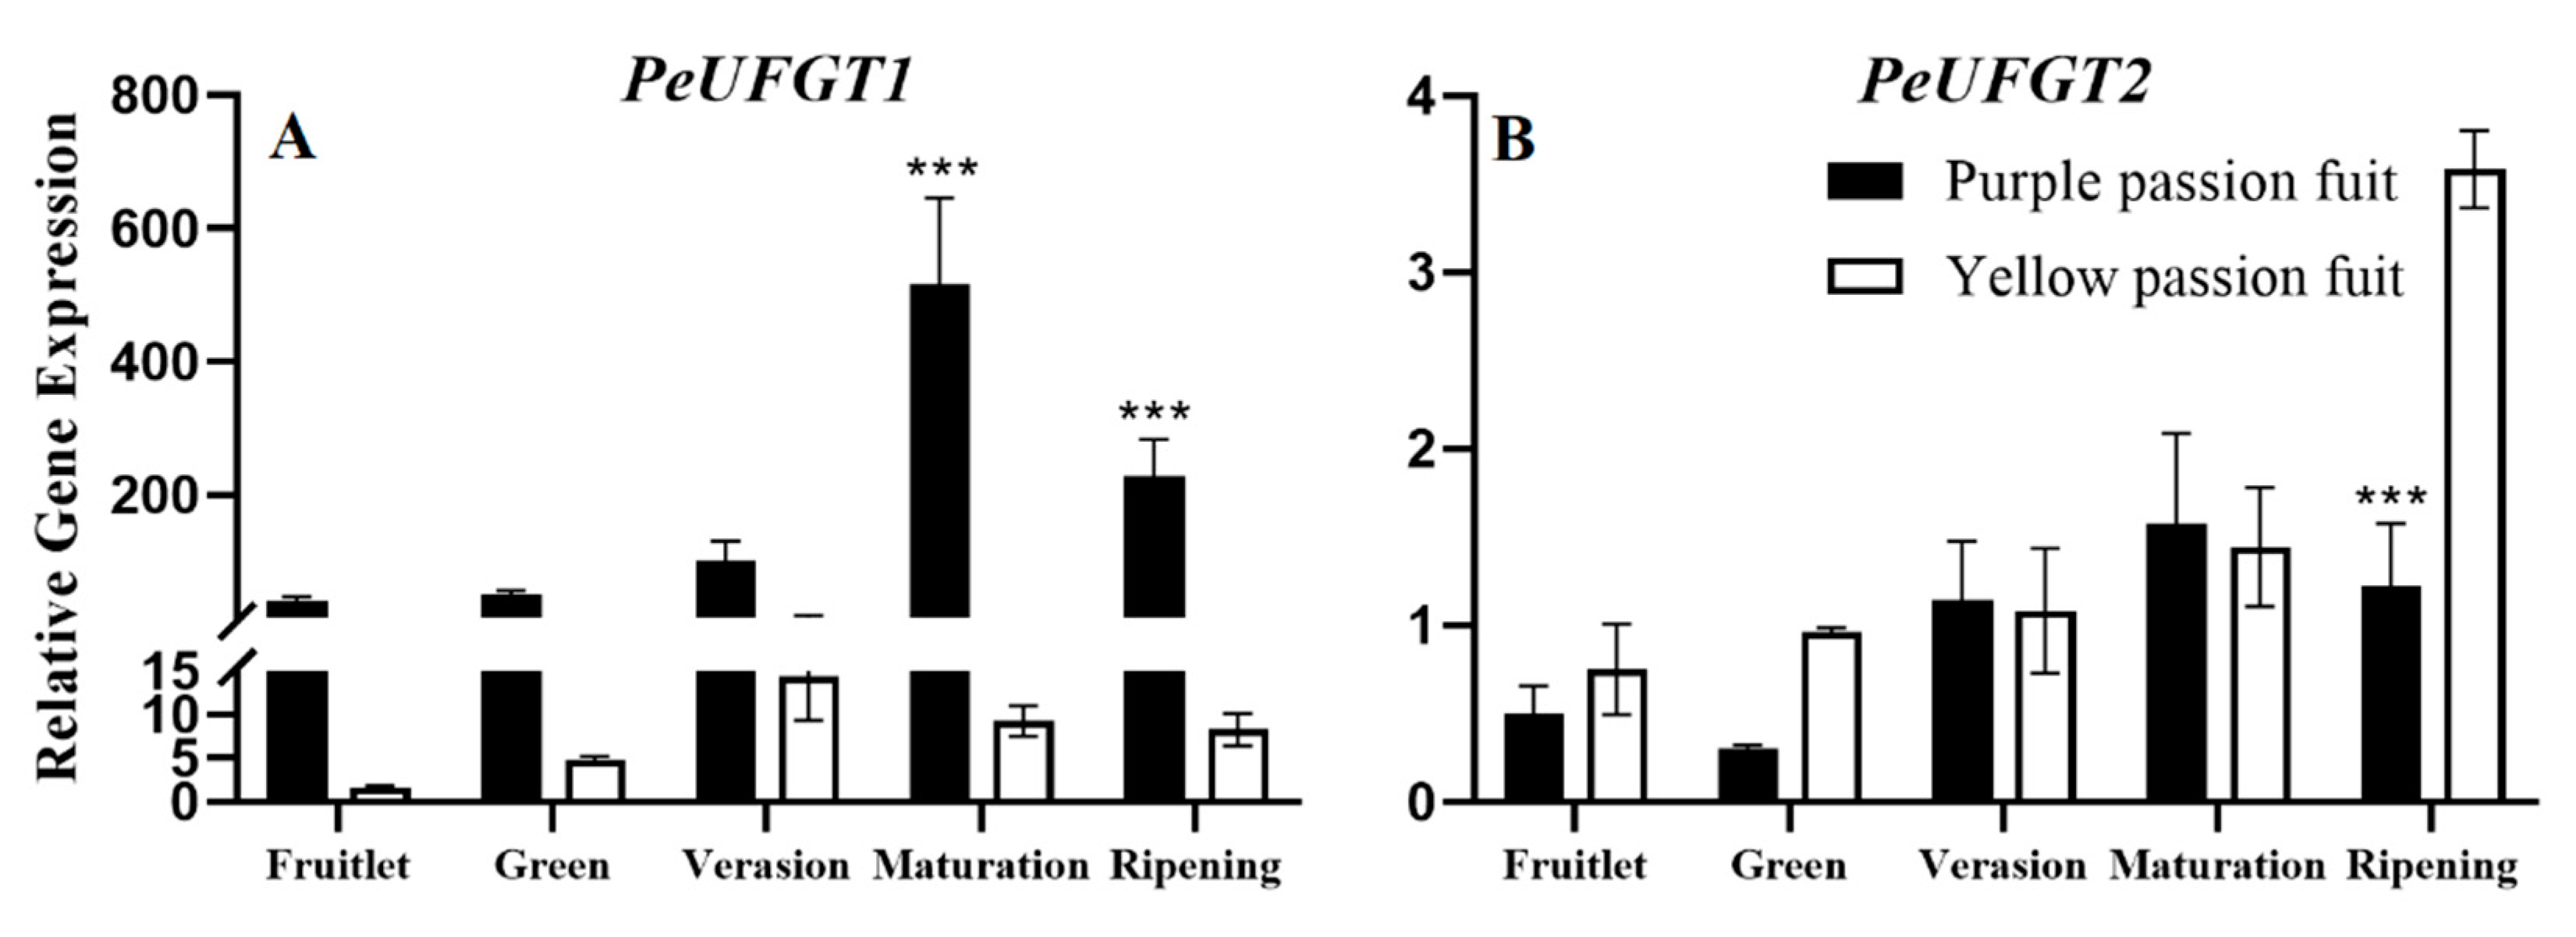
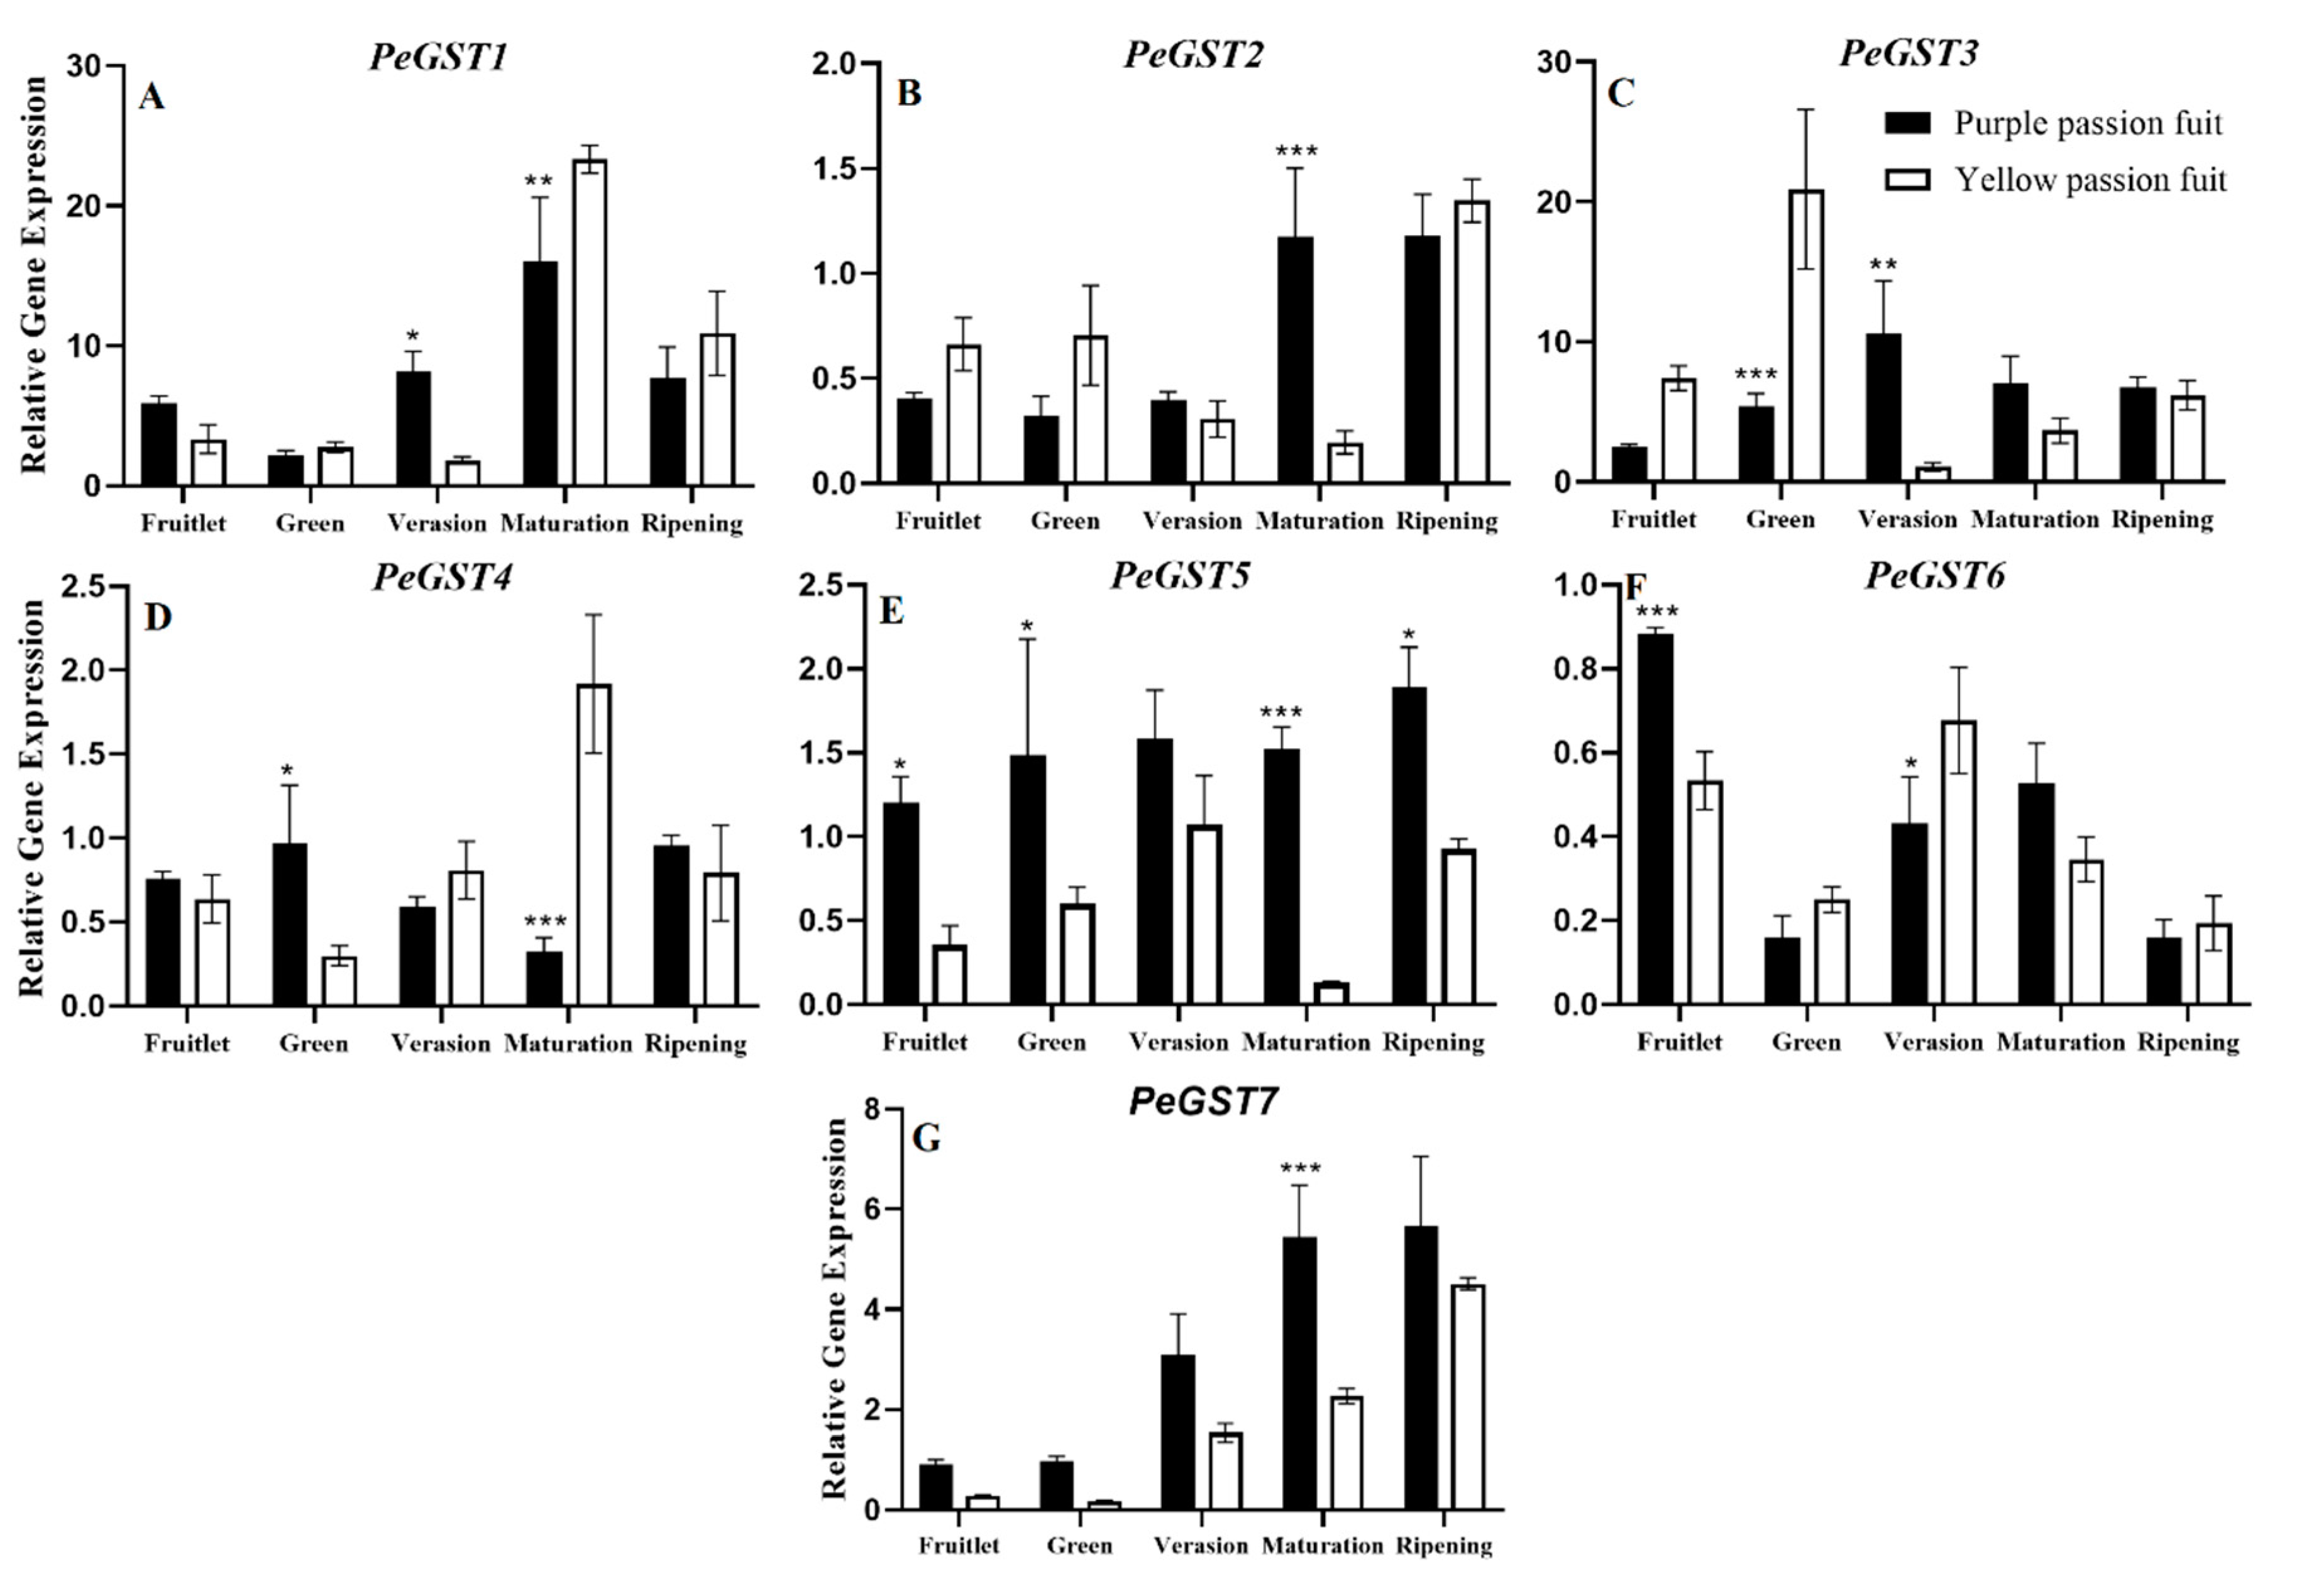
2.4. Expression Profiling of Genes Encoding Key Enzymes for Flavonoid Metabolism

The core genes i.e., PePAL1–5, PeC4H, Pe4CL1–7, PeCHS1–3, PeUFGT1–2, and PeGST1–7 responsible for the biosynthesis of PAL, C4H, 4CL, CHS, UFGT, and GST were studied, respectively. During passion fruit development, the relative expressions of five PePAL genes in both passion fruit cultivars decreased first and then increased, and showed a down-regulated trend before the veraison stage, while it was up-regulated after the veraison stage. The relative expression levels of PePAL2 and PePAL4 in purple passion fruit peel were significantly (p ≤ 0.001) higher than that in yellow passion fruit after the veraison stage. Interestingly, at the ripening stage, purple passion fruit exhibited 14.34-fold more genetic expression of PePAL4 as compared to that of yellow passion fruit. Conversely, the relative expression of PePAL5 was 13.79-times higher in yellow passion fruit compared with purple passion fruit at the fruit ripening stage (Figure 3).
PeC4H1 gene was significantly expressed in fruit peel, and the expression level of PeC4H1 gene was higher in yellow passion fruit before the veraison stage, but significantly increased in purple fruit after the veraison stage, and was higher than that in yellow passion fruit (Figure 4).
The expression patterns of Pe4CL1, Pe4CL2, and Pe4CL4 showed a parabolic pattern, Pe4CL3 and Pe4CL5 showed ‘J’ pattern, and Pe4CL6 and Pe4CL7 varied during fruit development. Pe4CL2, Pe4CL3, and Pe4CL7 were significantly expressed in fruit peel after the veraison stage. Both examined cultivars showed non-significant different in terms of Pe4CL1 and Pe4CL4 expression patterns (Figure 5A,D). Pe4CL2 was significantly (p ≤ 0.001) expressed in purple passion at the maturation stage as compared to yellow passion fruit, showing its highest expression (4.41) (Figure 5B). The maximum expression of Pe4CL3 (9.80) was observed in the peel of purple passion fruit at the fruit ripening stage, which was 10-fold higher than that in yellow passion fruit (Figure 5C). Similarly, purple passion fruit exhibited 1.64-fold higher expression of Pe4CL5 at the ripening stage as compared to yellow passion fruit (p ≤ 0.05) (Figure 5E). The relative expression of Pe4CL6 and Pe4CL7 varied during fruit development of both passion fruit cultivars (Figure 5F,G).
Purple passion fruit showed overall more expression of PeCHS gene in fruit peel compared with yellow passion fruit. The expression of PeCHS1 was the highest (0.53) in purple passion fruit at the veraison stage, which was 48-times higher than that in yellow passion fruit (Figure 6A). The expression levels of PeCHS2 and PECHS3 were highest in purple passion fruit at maturation stage (2309.05 and 75.94, respectively) (Figure 6B,C).
The expression of PeUFGT1 in purple passion fruit was significantly higher than that in yellow passion fruit, which observed a maximum (516.03) at the maturation stage. In terms of PeUFGT2 expression, there was a non-significant difference among both cultivars before the ripening stage, while at the ripening stage yellow passion fruit exhibited 2.94-fold higher expression than that in purple passion fruit (Figure 7).
The expressions of PeGST1 and PeGST2 was significantly different among purple and yellow passion fruit peel at the maturation stage. Yellow passion fruit showed more expression level of PeGST1 (23.33), while purple passion fruit exhibited more PeGST2 expression (1.18) at maturation stage (Figure 8A,B). The expressions of PeGST3 and PeGST4 were higher in yellow passion fruit as compared to purple passion fruit at the green and maturation stage, respectively (Figure 8C,D). The expression levels of PeGST5 and PeGST7 in purple passion fruit were generally higher than those in yellow passion fruit during development, while the other PeGST expressions were different in individual development stages (Figure 8E,G). PeGST6 expression was significantly different (p ≤ 0.001) among both passion fruit cultivars at fruitlet stage, while showed varied pattern at other maturity stages (Figure 8F).

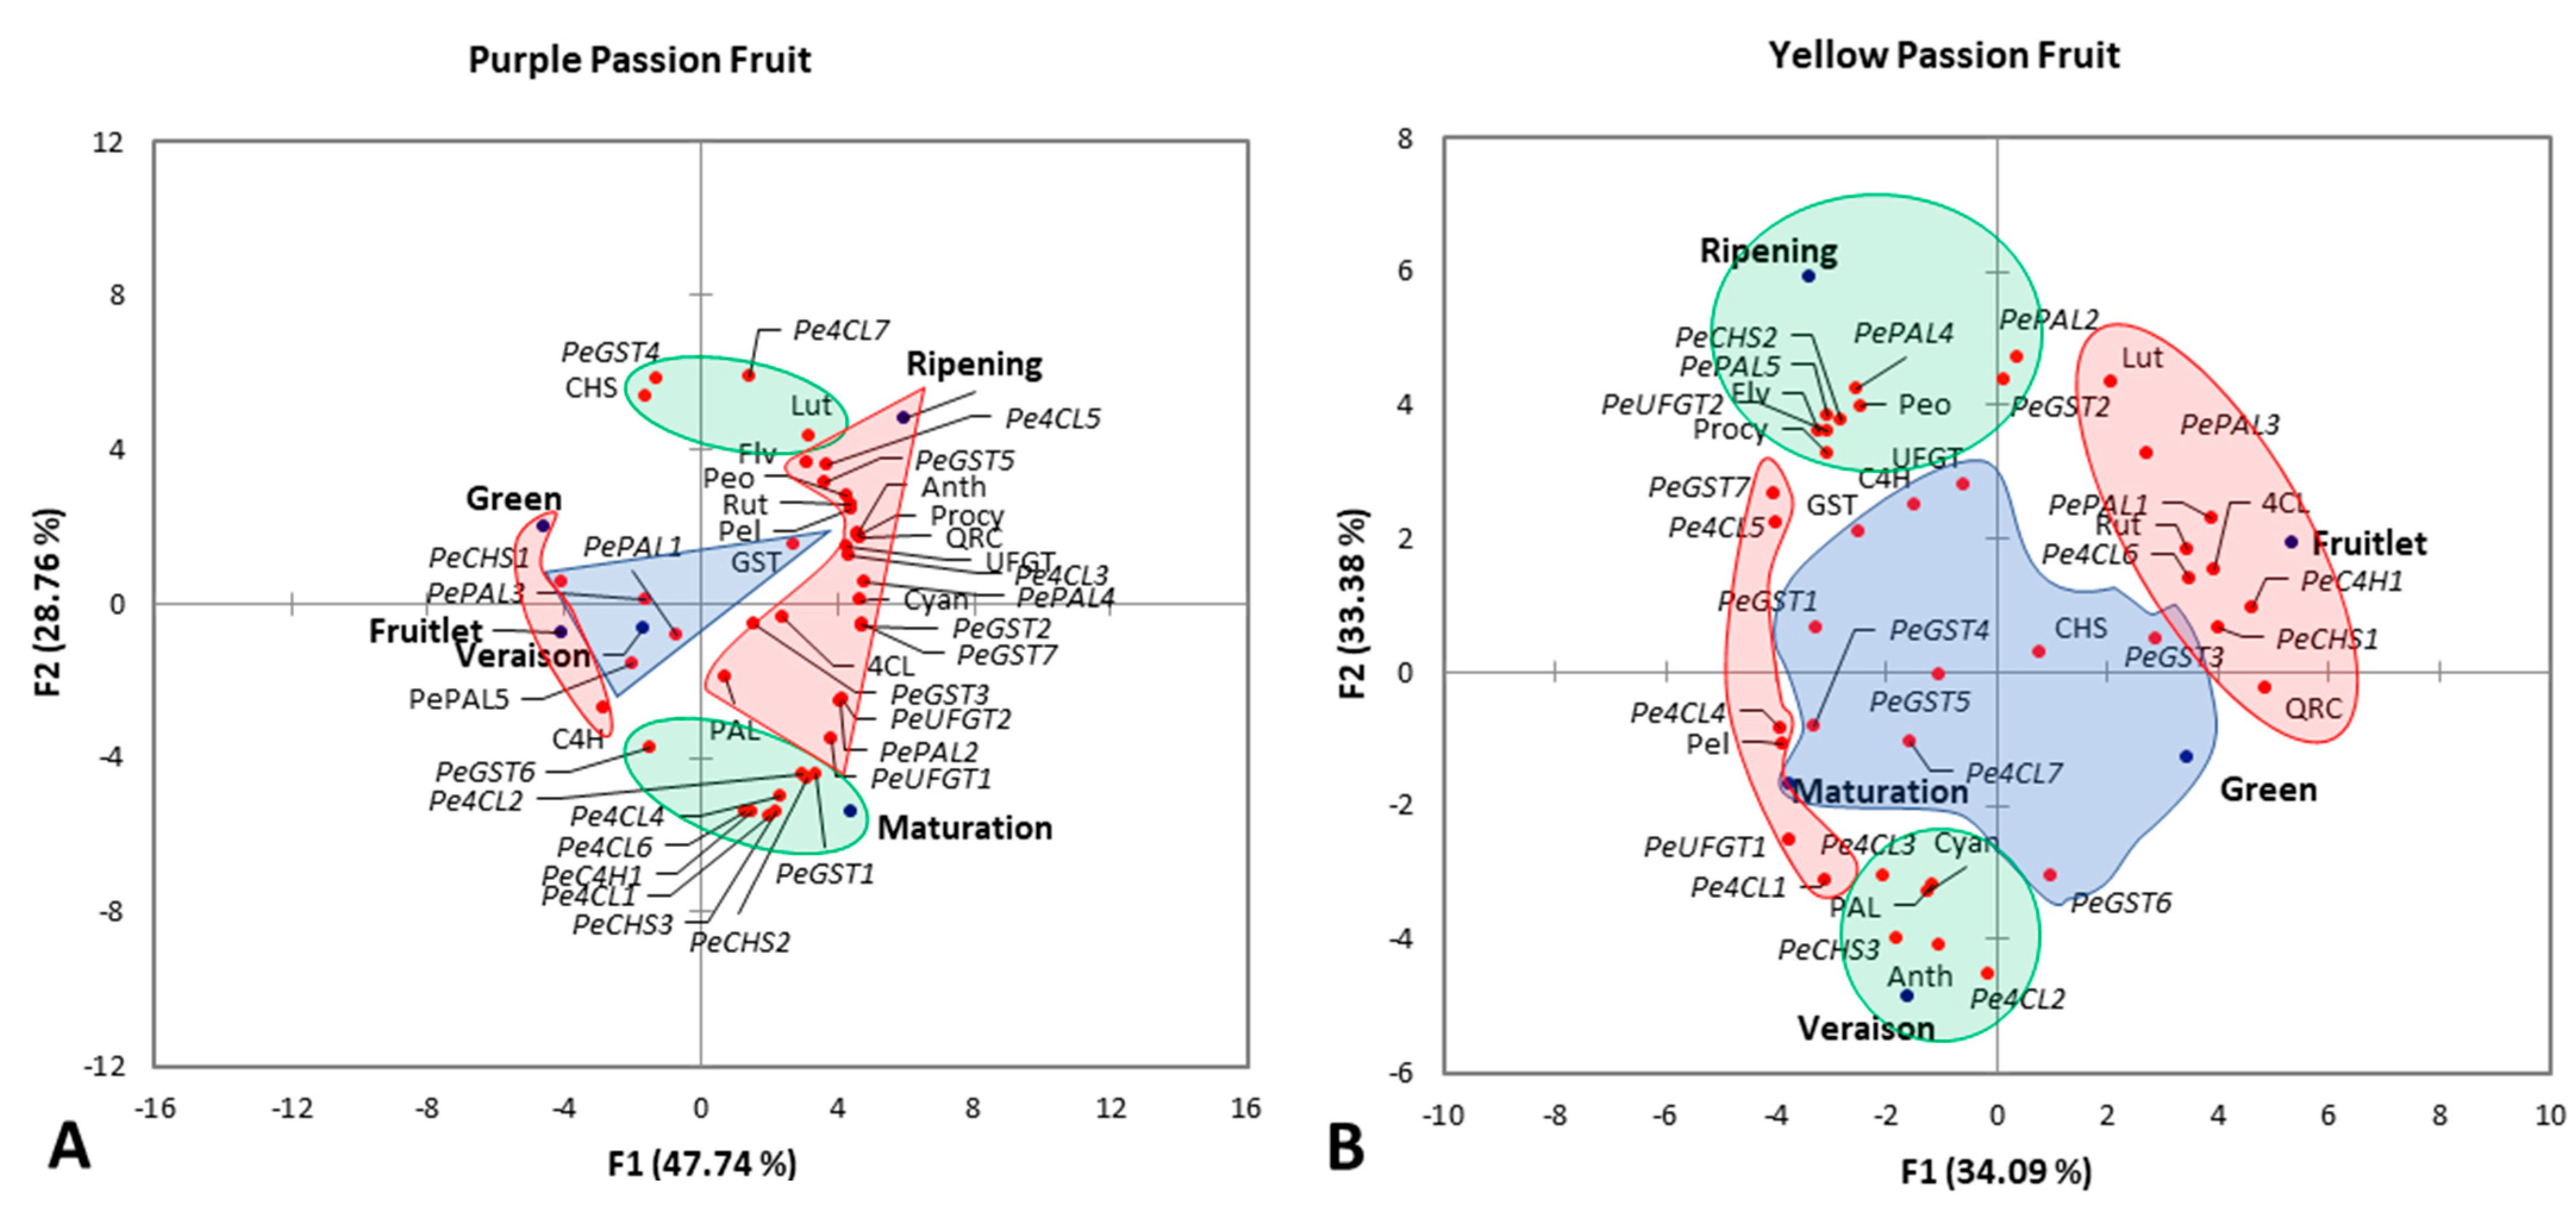
2.5. Principle Component Analysis

2.5.1. Purple Passion Fruit

Principal component analysis (PCA) was conducted to assess the correlation between fruit maturity stages and flavonoid attributes of passion fruit. Based on the highest squared cosine values corresponding to PCA factors (F1, F2 or F3), flavonoids, anthocyanins, procyanidins, flavonoid and anthocyanin metabolites, key enzymes, and relative expressions of genes involved in flavonoids metabolism were clustered around the maturity stages of passion fruit. Factor F1, covering 47.74% variability in data (eigenvalue 19.096), showed clustering of total flavonoids, anthocyanins, procyanidins, rutin, quercetin, cyanidin-3-O-glucoside chloride, peonidin-3-O-glucoside, pelargonidin-3-O-glucoside, UFGT, PePAL2, PePAL4, Pe4CL3, Pe4CL5, PeCHS1, PeUFGT1, PeUFGT2, PeGST2, PeGST5, and PeGST7 with ripening stage of purple passion fruit, suggesting positive correlation of these variable among each other. C4H was significantly correlated with fruitlet and green fruiting stage of passion fruit. This cluster was located opposite to ripening on the F1 axis, suggesting strong negative association of the ripening stage with C4H. The second factor, covering 28.76% variability in data (eigenvalue 11.504), showed clustering of luteolin, CHS, PeC4H1, Pe4CL1, Pe4CL2, Pe4CL4, Pe4CL6, Pe4CL7, PeCHS2, PeCHS3, PeGST1, PeGST4, and PeGST6 with the maturation stage of purple passion fruit. However, the distribution of clusters in two distinct groups on either side of the F2 axis indicated that the maturation stage had positive correlation with PeC4H1, Pe4CL1, Pe4CL2, Pe4CL4, Pe4CL6, PeCHS2, PeCHS3, PeGST1, and PeGST6 but negative correlation with luteolin, CHS, Pe4CL7, and PeGST4. The third factor of PCA, covering 15.92% variability in data (eigenvalue 6.370), showed clustering of GST, PePAL1, PePAL3, PePAL5, and PeGST3 with the veraison stage (Figure 9A).

2.5.2. Yellow Passion Fruit

Factor F1 of PCA, covering 34.09% variability in data (eigenvalue 13.636), showed clustering of rutin, quercetin, pelargonidin-3-O-glucoside, 4CL, PePAL1, PeC4H1, Pe4CL1, Pe4CL4, Pe4CL5, Pe4CL6, PeCHS1, PeUFGT1, and PeGST7 with the fruitlet stage of yellow passion fruit, suggesting positive correlation of these variables among each other. The distribution of clusters in two different groups on either side of F1 axis indicated that the fruitlet stage had positive correlation with rutin, quercetin, 4CL, PePAL1, PeC4H1, Pe4CL1, Pe4CL6, and PeCHS1 but negative correlation with pelargonidin-3-O-glucoside, Pe4CL4, Pe4CL5, PeUFGT1, and PeGST7. The second factor, covering 33.38% variability in data (eigenvalue 13.350), showed clustering of anthocyanins, cyanidin-3-O-glucoside chloride, PAL, PePAL3, Pe4CL2, Pe4CL3, and PeCHS3 with the veraison stage of yellow passion fruit. Total flavonoids, procyanidins, peonidin-3-O-glucoside, PePAL2, PePAL4, PePAL5, PeCHS2, PeUFGT2, and PeGST2 showed positive correlation with ripening stage. The third factor of PCA, covering 18.69% variability in data (eigenvalue 7.476), showed clustering of luteolin, UFGT, C4H, CHS, GST, Pe4CL7, PeGST1, PeGST3, PeGST4, PeGST5, and PeGST6 with the maturation stage of yellow passion fruit (Figure 9B).

3. Discussion

Flavonoids are a widely distributed group of phenolics, occurring virtually in all plant parts. They are a major coloring substance in flowers and fruits. They also play a vital role as a secondary antioxidant defense system against different biotic and abiotic stresses [35]. Flavonoids are located within the centers of ROS generation and in the nucleus of mesophyll cells [36]. Flavonoid components have been reported in the leaves [37], fruit peel [38], and pulp [39] of passion fruit. In current study, the contents of flavonoids, anthocyanins, and procyanidins in fruit peel of purple and yellow passion fruit showed great differences. During fruit growth and development, the contents of flavonoids, anthocyanins, and procyanidins in purple passion fruit peel were significantly higher than that of yellow passion fruit, and the difference reached the maximum at ripening stage (Figure 1).
Five flavonoid (i.e., rutin, luteolin, quercetin, apigenin, and kaempferol) and three anthocyanin components (cyanidin-3-O-glucoside chloride, peonidin-3-O-glucoside, and pelargonidin-3-O-glucoside) were determined by UPLC-MS in the peel of purple and yellow passion fruits (Table 1). Apigenin and kaempferol were almost not detected in all fruit samples (Table S1), but could be detected in passion fruit leaves (unpublished data). Ferreres et al. [37] detected a variety of apigenin substances in the study on the antioxidant activity of passion fruit leaves. During fruit development, flavonoid and anthocyanin components detected in the peel of purple passion fruit were significantly higher than that of yellow passion fruit. Rutin content was the highest among all detected flavonoids, which was consistent with many earlier findings [40,41]. The cyanidin-3-O-glucoside chloride has been considered as the quantitative standard of anthocyanins in many crops [37,42,43], while in the current study, peonidin-3-glucoside was found maximum in the peel of purple and yellow passion fruit among measured anthocyanin components at the ripening stage (Table 1). Luteolin was detected in abundance at earlier stages of fruit ripening in the peel of the fruits of both cultivars. A rare passion fruit variety (Passiflora loefgrenii Vitta.) studied by Argentieri et al. [44] is rich in luteolin, making it a good choice for biopharmaceuticals. The luteolin content at the ripening stage of the purple passion fruit was much higher than that in other growth stages, which can be further studied or used as an important growth stage for the extraction of luteolin.
Flavonols are converted to anthocyanins and other flavonoid substances through the catalysis of different enzymes [45] (Figure 10). Phenylalanine is the direct precursor of flavonoid synthesis, and the first stage is the conversion of phenylalanine to 4-coumaryl CoA. PAL, C4H, and 4CL are the main regulatory enzymes involved in this process [46]. The second stage is the conversion of 4-coumaryl CoA and 3 malonyl CoA to dihydroxyflavonol, which is the key reaction of flavonoid metabolism. CHS, CHI and F3H activity regulate this reaction [47]. The third stage is the synthesis of unmodified anthocyanins [48]. Finally, it is modified by glycosyltransferase (GT) and transported to vacuole by GST [49].
The changes in enzymatic activities fruit growth and development of passion fruit are complicated. The variation trend of PAL activity in both passion fruit cultivars was similar, but the magnitude was significantly different (Figure 2A). PAL activity has been reported different in two rapeseed (Brassica napus) cultivars, and due to difference in PAL activity, different biological activities regulated different metabolic pathways [50]. The changing trend and the activity level of other measured enzymes were also different in the peel of both passion fruit cultivars (Figure 2). The PAL, CHS, C4H, and 4CL genes have important regulatory effects on flavonoid synthesis in plants [51]. The RT-qPCR results of the structural genes corresponding to the six flavonoid metabolism-related enzymes showed that they had different expression patterns in the fruit peel (Figure 3, Figure 4, Figure 5, Figure 6, Figure 7 and Figure 8) of the purple and yellow passion fruit. The relative expression levels of PePAL2,4, PeC4H1, Pe4CL2,3,7, PECHS1–3, PeUFGT1, and PeGST5,7 genes in purple passion fruit were significantly (p ≤ 0.05) higher than those in yellow passion fruit during peel development. The difference of flavonoid metabolites in passion fruit is related to the activity of these enzymes and the differential expression of corresponding structural genes at different developmental stages, and the specific mode of action needs to be further verified. There are seven main metabolic pathways of flavonoids in plants, i.e., anthocyanins pathway, proanthocyanidins (condensed tannins) pathway, flavones pathway, flavanols pathway, isoflavone pathway, tanning anhydride pathway, and Aurones pathway [52]. This study mainly studied the initial stages of the synthesis pathway from phenylalanine to anthocyanin (Figure 10). The key genes i.e., PAL, C4H, 4CL, CHS were involved in the biosynthesis of phenylalanine to chalcone in pathway, and UFGT and GST played a role in the glycosylation and transport of anthocyanins.
In this study, PCA showed that flavonoid metabolites in the peel of purple passion fruit were negatively correlated with C4H and positively correlated with 4CL, UFGT, and GST enzyme activities. Interestingly, C4H and UFGT enzyme activities showed a significant positive correlation with each other in yellow passion fruit peel, while they showed a negative correlation in purple fruit peel. Therefore, these two enzymes are likely to be the key enzymes affecting the metabolism of flavonoids in purple and yellow passion fruit peel (Figure 9). PAL and C4H were positively correlated with flavonoid content in tobacco [53], while CHS expression was significantly positively correlated with anthocyanin content in pomegranate [54]. Flavonoid related synthetic genes showed early and late expression peaks in grape [55], Vaccinium myrtillus [49] and wild apple (Malus Sylvestris L.) [56]. The PCA revealed that PePAL4, Pe4CL2,3, PeCHS2, and PeGST7 may play an important role in flavonoid metabolism in fruit peel of passion fruit. The differential accumulation of flavonoid-related metabolites in both passion fruit cultivars was not only related to enzymatic activity but also structural gene expressions. According to previous studies, it was also related to some transcription factors such as MYB [57], BHLH [58], and WD40 [59], regulation of microRNA during protein expression and, ubiquitination and phosphorylation during protein activation [60].

4. Materials and Methods
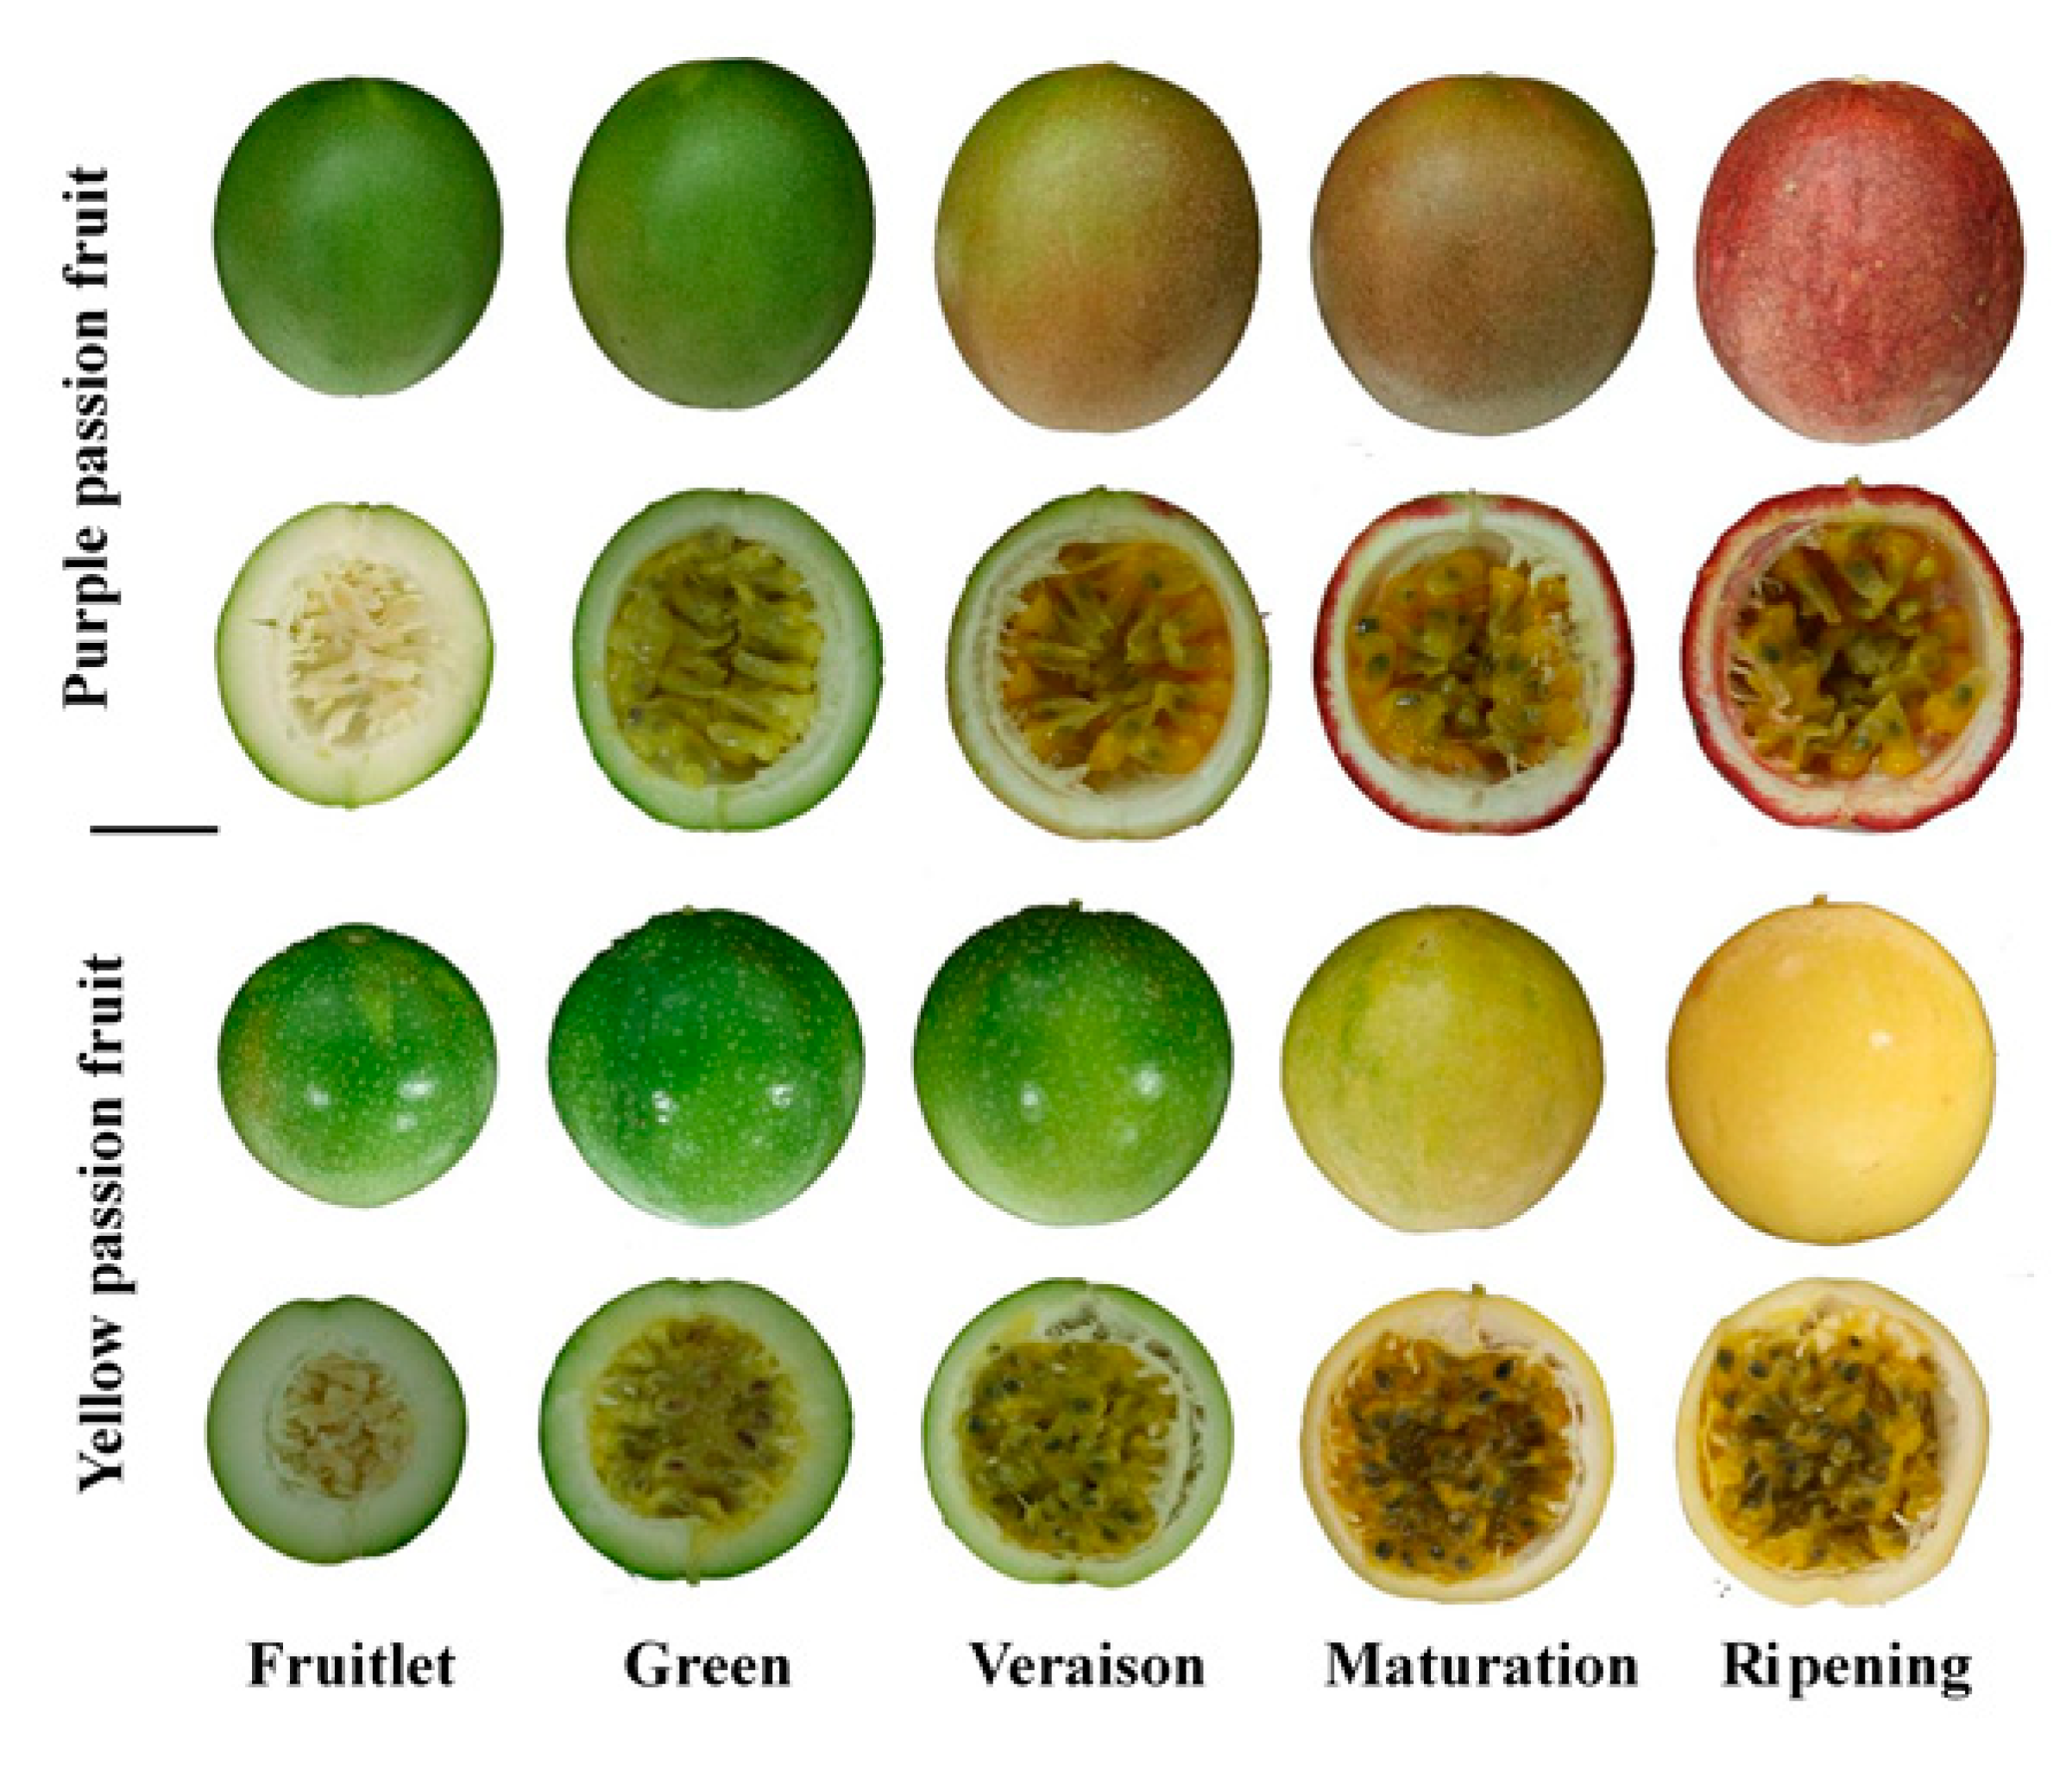
4.1. Plant Material

The plant material of two passion fruit cultivars, i.e., purple passion fruit (Tainong No. 1) and yellow passion fruit (Golden) was obtained from a passion fruit orchard, located at Shaowu county, Nanping city, Fujian province, China (27°22′51.9″ N 117°32′18.4″ E). The 15 passion fruits from each cultivar were sampled at each developmental stage, i.e., fruitlet, green, veraison, maturation, and repining (Figure 11). After shifting the fruits to the laboratory (Institute of Tropical and Subtropical Fruit Trees, College of Horticulture, Fujian Agriculture and Forestry University, China), the peel (separated sponge layer) of five passion fruits were mixed as one biological replicate, with three biological replicates per sample. All samples were stored in −80 °C ultra-low temperature refrigerator for later use.

4.2. Determination of Total Flavonoids, Anthocyanins, and Proanthocyanins

Extraction of total flavonoids was based on the optimization method of Vinatoru et al. [61] with some modifications. Accurately weighed 0.2 g of −80 °C frozen fruit peel was added to 8 mL of 60% ethanol. The solution was subjected to ultrasonic extraction for 40 min, cooling for 20 min, and centrifugation for 10 min (8000 rpm, 20 °C). The 5 mL supernatant was taken and diluted with distilled water to make the final volume of 10 mL. After that, 2 mL aliquot was taken and 3 mL of 60% ethanol and 0.3 mL of 5% NaNO2 were added. After shaking well and waiting for 6 min, 0.3 mL of 10% Al(NO3)3 was added. After shaking and then resting for 6 min, 4 mL of 4% NaOH was added. After shaking well and resting for 12 min, absorbance was measured at 510 nm. Total flavonoid content was calculated using calibration curve (Y = 10.859X − 0.0617, R2 = 0.999) of rutin standard (HPLC grade, ≥98% purity, Solarbio Life Sciences, Beijing, China).
Total anthocyanins were extracted following the protocol earlier described by Kim and Lee [62]. The 0.2 g plant material was added into 10 mL of 1% hydrochloric acid methanol solution and kept for 5 h. After centrifugation at 1000 rpm for 20 min, 10 mL supernatant was used to measure the OD value of the sample at 530 nm and 560 nm. Equation (1) was used to calculate total anthocyanins.
Total   anthocyanins   ( mg · g 1 ) = ( OD 530 0.25 × OD 650 ) ×   volume   of   extraction   liquid   ( mL ) 4.62 × 10⁴ ×   fresh   weight   of   passion   fruit   ( g )   .
Procyanidin content was determined using the method of Hellstrom and Mattila [63], with slight modifications. The 0.5 g sample was accurately weighed in a 10 mL centrifuge tube, 6 mL methanol was added, and ultrasonic treatment (power = 250, yield = 50 kHz) was conducted for 20 min. After being placed at room temperature, the supernatant was centrifuged to measure the absorbance at 546 nm. The procyanidin content was calculated using calibration curve (Y = 0.0038X + 0.0202, R2 = 0.999) of procyanidin standard (HPLC grade, ≥95% purity, Solarbio Life Sciences, Beijing, China).

4.3. Determination of Flavonoid and Anthocyanin Metabolites

For sample preparation, the method earlier described by Henry-Kirk et al. [64] was used with some changes. The 1 g plant material was ground along with liquid nitrogen, and 5 mL of methanol/formic acid/water (80:1:19, v/v/v) was added. Ultrasonic extraction was performed at 45 °C for 60 min, and centrifugation was performed at 12,000 rpm for 10 min, and the supernatant was filtered through MFMillipore™ Membrane Filter (Cat. No. GSWP04700, 0.22 µm pore size) into an Agilent sample bottle for testing. Five standard flavonoids of rutin, quercetin, luteolin, apigenin, and kaempferol (≥98% purity, Solarbio Life Sciences, Beijing, China) were prepared with the concentration of 0.1 mg·mL−1, and three standard anthocyanins of cyanidin-3-O-glucoside chloride (≥98% purity, Solarbio Life Sciences, Beijing, China), peonidin-3-O-glucoside (≥95% purity, Solarbio Life Sciences, Beijing, China), pelargonidin-3-O-glucoside (≥95% purity, Solarbio Life Sciences, Beijing, China) were prepared. Ultra-performance liquid chromatography-mass spectrometry (UPLC-MS) was performed with Waters I-CLASS /XEVO TQS liquid mass spectrometer (Waters Corporation, Milford, MA, USA) for evaluation. The determination was performed on the Agilent-ZORBAX SB-C18 column at the flow rate of 0.3 mL·min−1 and the column temperature was 40 °C. The flavonoid and anthocyanin components were detected at 210 nm. A Waters 2996 diode array detector (Waters Corporation, Milford, MA, USA) was used to detect the eluted peaks. The contents of individual flavonoid or anthocyanin metabolites were calculated using calibration curve of the corresponding standard. All measurements were performed with three replicates. The validation parameters consisted of linearity range, limits of detection, and quantification [65]. The peaks were identified by their retention times, comparing the UV–Visible spectra and spiking with standards. Quantification has been done using an external standard curve with five points (Table 2).

4.4. Enzymes Extraction and Activity Assay

Flavonoid metabolism-related enzymes including L-phenylalanine ammonia-lyase (PAL), cinnamate 4-hydrogenase (C4H), 4-coumarate: coenzyme A Ligase (4CL), chalcone synthase (CHS), UPD-3-O- glycosyltransferase (UFGT), and glutathione S-transferase (GST) were extracted and measured using the Solarbio enzyme activity kits (Solarbio Life Sciences, Beijing, China) according to the manufacturer’s instructions [66,67].

4.5. RNA Extraction and Real-Time Quantitative PCR

Based on transcriptome data of passion fruit at different developmental stages, differential candidate sequences of PAL, C4H, 4CL, CHS, UFGT, and GST were identified by KEGG metabolic pathway analysis of phenylalanine, flavonoids, and isoflavones enriched in passion fruit. Local BLAST screening of homologous genes was performed by BioEdit software (v 7.2). Then, the preliminarily obtained genes were put into NCBI for BLAST comparison and SMART (http://smart.embl-heidelberg.de/, accessed on 16 November 2020) conserved domain analysis to screen out the preliminary candidate genes. The genes were compared with those from the published passion fruit genome (http://ftp.cngb.org/pub/CNSA/data3/CNP0001287/CNS0275691/CNA0017758/, accessed on 16 November 2020). According to the Unigenes sequence in the transcriptome, qRT-PCR specific primers were designed using Primer 5 online software [68] (Table S2). TIANGEN polysaccharide polyphenol plant TOTAL RNA extraction kit (centrifugal column) was used to extract total RNA from yellow and purple passion fruit at different developmental stages in strict accordance with the instructions. The first strand of cDNA was synthesized using TaKaRa’s quantitative reverse transcription kit, and fluorescence quantitative PCR was performed using LightCycler® 96 quantitative instrument (Roche Applied Science, Penzberg, Germany).
The reaction mixture contained 10 µL 2 × RealStar Green Fast Mixture (GenStar, Bejing, China), 1 µL cDNA, 0.25 µM of each primer, and water was added to make a final volume of 20 µL. Cycling conditions were as follows: 95 °C for 2 min, 40 cycles of 95 °C for 5 s, and 60 °C for 30 s. The 60 S ribosomal protein was used as an internal control, and the relative gene expression was calculated using the 2−ΔΔct method [69]. Three independent biological replicates were analyzed for each sample.

4.6. Statistical Data Analysis

Collected data at each fruit maturity stage were subjected to one-way analysis of variance (ANOVA) using GraphPad Prism 8.0.1 (https://www.graphpad.com/scientific-software/prism/, accessed on 21 June 2021). Comparison between ‘yellow’ and ‘purple’ passion fruit for each developmental stage was performed using Student’s t-test. Flavonoid metabolites of each cultivar were compared between different developmental stages using Fisher’s least significant difference technique through analytical software package “SPSS statistics 21.0” (IBM Inc., New York, NY, USA). Principle component analysis and correlation coefficient values were determined with Pearson (n) method using the XLSTAT ver. 2019.

5. Conclusions

In this study, the flavonoids biosynthesis mechanism of two passion fruit cultivars having fruits of different color (purple and yellow) was studied. The content of flavonoid components and metabolites, activities of key enzymes related to its biosynthesis, and expressions of flavonoids-related structural genes in fruit peel of both passion fruit cultivars were analyzed at different developmental stages. The results revealed that the maximum content of flavonoid metabolites was observed in the peel of purple passion fruit. The dynamics of the flavonoid contents measured in the current study were not solely controlled by a single enzyme but were regulated by the integrated activity of different enzymes such as PAL, C4H, 4CL, CHS, UFGT, and GST. Among them, C4H, 4CL, UFGT, and GST played a significant role in flavonoids accumulation in passion fruit peel. PePAL4, Pe4CL2,3, PeCHS2, and PeGST7 had a great influence on the metabolism of flavonoids in fruit peel. These results provided new insight into the characteristics of flavonoids metabolism and are a valuable resource for future research on molecular breeding in passion fruit.

Supplementary Materials

The following are available online at www.mdpi.com/2223-7747/10/11/2240/s1, Table S1: The content of apigenin and kaempferol in fruit peel of purple and yellow passion fruits during fruit development. Table S2: Sequences of primer pairs of genes responsible for flavonoids metabolism in passion fruit.

Author Contributions

Conceptualization, M.S. and F.C.; methodology, M.S., Y.H., S.M., H.M.R., and Q.Y.; software, M.M.A.; validation, M.M.A. and F.C.; data curation, M.M.A.; writing—original draft preparation, M.S. and M.M.A.; writing—review and editing, B.L., Z.L. and F.C.; supervision, F.C.; project administration, F.C.; funding acquisition, F.C. All authors have read and agreed to the published version of the manuscript.

Funding

This research was funded by Plant Biological Seedling Science and Technology Innovation Team (CXTD2021009-03) and Enterprise Technology Development Contract (2020-3501-04-001995).

Institutional Review Board Statement

Not applicable.

Informed Consent Statement

Not applicable.

Conflicts of Interest

The authors declare no conflict of interest.

References

  1. Rodriguez-Amaya, D.B. Passion Fruits. In Encyclopedia of Food Sciences and Nutrition; Academic Press: Cambridge, MA, USA, 2003; pp. 4368–4373. [Google Scholar]
  2. Huo, D.; Lan, J.; Ma, L.-L.; Hou, C.-J.; Yang, P. Function of Passiflor and its comprehensive processing utility. Sci. Technol. Food Ind. 2012, 19, 391–395. [Google Scholar] [CrossRef]
  3. Zhang, X.; Wei, X.; Ali, M.M.; Rizwan, H.M.; Li, B.; Li, H.; Jia, K.; Yang, X.; Ma, S.; Li, S.; et al. Changes in the Content of Organic Acids and Expression Analysis of Citric Acid Accumulation-Related Genes during Fruit Development of Yellow (Passiflora edulis f. flavicarpa) and Purple (Passiflora edulis f. edulis) Passion Fruits. Int. J. Mol. Sci. 2021, 22, 5765. [Google Scholar] [CrossRef]
  4. Sousa, D.F.; Veras, V.S.; Freire, V.E.C.S.; Paula, M.L.; Serra, M.A.A.O.; Costa, A.C.P.J.; da Conceição, S.O. Cunha, M.; Queiroz, M.V.O.; Damasceno, M.M.C.; et al. Effectiveness of Passion Fruit Peel Flour (Passiflora edulis L.) versus Turmeric Flour (Curcuma longa L.) on Glycemic Control: Systematic Review and Meta-Analysis. Curr. Diabetes Rev. 2020, 16, 450–456. [Google Scholar] [CrossRef]
  5. Konta, E.M.; Almeida, M.R.; do Amaral, C.L.; Darin, J.D.C.; de Rosso, V.V.; Mercadante, A.Z.; Antunes, L.M.G.; Bianchi, M.L.P. Evaluation of the Antihypertensive Properties of Yellow Passion Fruit Pulp (Passiflora edulis Sims f. flavicarpa Deg.) in Spontaneously Hypertensive Rats. Phytother. Res. 2014, 28, 28–32. [Google Scholar] [CrossRef]
  6. Lewis, B.J.; Herrlinger, K.A.; Craig, T.A.; Mehring-Franklin, C.E.; DeFreitas, Z.; Hinojosa-Laborde, C. Antihypertensive effect of passion fruit peel extract and its major bioactive components following acute supplementation in spontaneously hypertensive rats. J. Nutr. Biochem. 2013, 24, 1359–1366. [Google Scholar] [CrossRef]
  7. Vuolo, M.M.; Lima, G.C.; Batista, Â.G.; Carazin, C.B.B.; Cintra, D.E.; Prado, M.A.; Júnior, M.R.M. Passion fruit peel intake decreases inflammatory response and reverts lipid peroxidation and adiposity in diet-induced obese rats. Nutr. Res. 2020, 76, 106–117. [Google Scholar] [CrossRef]
  8. Nerdy, N.; Ritarwan, K. Hepatoprotective Activity and Nephroprotective Activity of Peel Extract from Three Varieties of the Passion Fruit (Passiflora Sp.) in the Albino Rat. Open Access Maced. J. Med. Sci. 2019, 7, 536–542. [Google Scholar] [CrossRef] [Green Version]
  9. Prasertsri, P.; Booranasuksakul, U.; Naravoratham, K.; Trongtosak, P. Acute Effects of Passion Fruit Juice Supplementation on Cardiac Autonomic Function and Blood Glucose in Healthy Subjects. Prev. Nutr. Food Sci. 2019, 24, 245–253. [Google Scholar] [CrossRef]
  10. Garcia, M.V.; Milani, M.S.; Ries, E.F. Production optimization of passion fruit peel flour and its incorporation into dietary food. Food Sci. Technol. Int. 2020, 26, 132–139. [Google Scholar] [CrossRef]
  11. Viganó, J.; Meirelles, A.A.D.; Náthia-Neves, G.; Baseggio, A.M.; Cunha, R.L.; Maróstica, M.R., Jr.; Meireles, M.A.A.; Gurikov, P.; Smirnova, I.; Martínez, J. Impregnation of passion fruit bagasse extract in alginate aerogel microparticles. Int. J. Biol. Macromol. 2020, 155, 1060–1068. [Google Scholar] [CrossRef]
  12. Liang, D.; Ali, M.M.; Yousef, A.F.; He, Y.; Huang, X.; Li, J.; Yang, Q.; Chen, F. Root Colonization of Piriformospora indica Improves Phyto-Nutritional Composition of Leaves, Stems, Tendrils and Fruits of Passiflora edulis f. edulis. Adv. Food Sci. 2021, 43, 142–149. [Google Scholar]
  13. Ali, M.M.; Anwar, R.; Yousef, A.F.; Li, B.; Luvisi, A.; de Bellis, L.; Aprile, A.; Chen, F. Influence of Bagging on the Development and Quality of Fruits. Plants 2021, 10, 358. [Google Scholar] [CrossRef]
  14. Caltagirone, S.; Rossi, C.; Poggi, A.; Ranelletti, F.O.; Natali, P.G.; Brunetti, M.; Aiello, F.B.; Piantelli, M. Flavonoids apigenin and quercetin inhibit melanoma growth and metastatic potential. Int. J. Cancer 2000, 87, 595–600. [Google Scholar] [CrossRef]
  15. Harborne, J.B.; Williams, C.A. Advances in flavonoid research since 1992. Phytochemistry 2000, 55, 481–504. [Google Scholar] [CrossRef]
  16. Cao, Y.; Han, Y.; Li, D.; Lin, Y.; Cai, Y. Systematic Analysis of the 4-Coumarate:Coenzyme A Ligase (4CL) Related Genes and Expression Profiling during Fruit Development in the Chinese Pear. Genes 2016, 7, 89. [Google Scholar] [CrossRef] [Green Version]
  17. Haskill, J.S.; Häyry, P.; Radov, L.A. Systemic and local immunity in allograft and cancer rejection. Contemp. Top. Immunobiol. 1978, 8, 107–170. [Google Scholar] [CrossRef]
  18. Fu, H.; Qiao, Y.; Wang, P.; Mu, X.; Zhang, J.; Fu, B.; Du, J. Changes of bioactive components and antioxidant potential during fruit development of Prunus humilis Bunge. PLoS ONE 2021, 16, e0251300. [Google Scholar] [CrossRef]
  19. Lister, C.E.; Lancaster, J.E.; Sutton, K.H.; Walker, J.R.L. Developmental changes in the concentration and composition of flavonoids in skin of a red and a green apple cultivar. J. Sci. Food Agric. 1994, 64, 155–161. [Google Scholar] [CrossRef]
  20. Zoratti, L.; Karppinen, K.; Luengo Escobar, A.; Häggman, H.; Jaakola, L. Light-controlled flavonoid biosynthesis in fruits. Front. Plant Sci. 2014, 5, 534. [Google Scholar] [CrossRef]
  21. Qian, Y.; Lynch, J.H.; Guo, L.; Rhodes, D.; Morgan, J.A.; Dudareva, N. Completion of the cytosolic post-chorismate phenylalanine biosynthetic pathway in plants. Nat. Commun. 2019, 10, 15. [Google Scholar] [CrossRef]
  22. Kong, J.-Q. Phenylalanine ammonia-lyase, a key component used for phenylpropanoids production by metabolic engineering. RSC Adv. 2015, 5, 62587–62603. [Google Scholar] [CrossRef]
  23. Singh, R.; Rastogi, S.; Dwivedi, U.N. Phenylpropanoid Metabolism in Ripening Fruits. Compr. Rev. Food Sci. Food Saf. 2010, 9, 398–416. [Google Scholar] [CrossRef]
  24. Lu, Y.; Song, Y.; Zhu, J.; Xu, X.; Pang, B.; Jin, H.; Jiang, C.; Liu, Y.; Shi, J. Potential application of CHS and 4CL genes from grape endophytic fungus in production of naringenin and resveratrol and the improvement of polyphenol profiles and flavour of wine. Food Chem. 2021, 347, 128972. [Google Scholar] [CrossRef]
  25. Flores-Sanchez, I.J.; Verpoorte, R. Plant Polyketide Synthases: A fascinating group of enzymes. Plant Physiol. Biochem. 2009, 47, 167–174. [Google Scholar] [CrossRef]
  26. Li, X.-J.; Zhang, J.-Q.; Wu, Z.-C.; Lai, B.; Huang, X.-M.; Qin, Y.-H.; Wang, H.-C.; Hu, G.-B. Functional characterization of a glucosyltransferase gene, LcUFGT1, involved in the formation of cyanidin glucoside in the pericarp of Litchi chinensis. Physiol. Plant. 2016, 156, 139–149. [Google Scholar] [CrossRef]
  27. Vilperte, V.; Boehm, R.; Debener, T. A highly mutable GST is essential for bract colouration in Euphorbia pulcherrima Willd. Ex Klotsch. BMC Genom. 2021, 22, 208. [Google Scholar] [CrossRef]
  28. Rinaldi, M.M.; Costa, A.M.; Faleiro, F.G.; Junqueira, N.T.V. Conservação pós-colheita de frutos de Passiflora setacea DC. submetidos a diferentes sanitizantes e temperaturas de armazenamento. Braz. J. Food Technol. 2017, 20, e2016046. [Google Scholar] [CrossRef]
  29. Maniwara, P.; Nakano, K.; Boonyakiat, D.; Ohashi, S.; Hiroi, M.; Tohyama, T. The use of visible and near infrared spectroscopy for evaluating passion fruit postharvest quality. J. Food Eng. 2014, 143, 33–43. [Google Scholar] [CrossRef]
  30. Oluoch, P.; Nyaboga, E.N.; Bargul, J.L. Analysis of genetic diversity of passion fruit (Passiflora edulis Sims) genotypes grown in Kenya by sequence-related amplified polymorphism (SRAP) markers. Ann. Agrar. Sci. 2018, 16, 367–375. [Google Scholar] [CrossRef]
  31. Hyson, D.A. A Comprehensive Review of Apples and Apple Components and Their Relationship to Human Health. Adv. Nutr. 2011, 2, 408–420. [Google Scholar] [CrossRef]
  32. Wang, C.-H.; Yu, J.; Cai, Y.-X.; Zhu, P.-P.; Liu, C.-Y.; Zhao, A.-C.; Lü, R.-H.; Li, M.-J.; Xu, F.-X.; Yu, M.-D. Characterization and Functional Analysis of 4-Coumarate:CoA Ligase Genes in Mulberry. PLoS ONE 2016, 11, e0155814. [Google Scholar] [CrossRef]
  33. Azuma, A.; Yakushiji, H.; Koshita, Y.; Kobayashi, S. Flavonoid biosynthesis-related genes in grape skin are differentially regulated by temperature and light conditions. Planta 2012, 236, 1067–1080. [Google Scholar] [CrossRef]
  34. Falginella, L.; Di Gaspero, G.; Castellarin, S.D. Expression of flavonoid genes in the red grape berry of “Alicante Bouschet” varies with the histological distribution of anthocyanins and their chemical composition. Planta 2012, 236, 1037–1051. [Google Scholar] [CrossRef]
  35. Kumar, S.; Pandey, A.K. Chemistry and Biological Activities of Flavonoids: An Overview. Sci. World J. 2013, 2013, 1–16. [Google Scholar] [CrossRef] [Green Version]
  36. Agati, G.; Azzarello, E.; Pollastri, S.; Tattini, M. Flavonoids as antioxidants in plants: Location and functional significance. Plant Sci. 2012, 196, 67–76. [Google Scholar] [CrossRef]
  37. Ferreres, F.; Sousa, C.; Valentão, P.; Andrade, P.B.; Seabra, R.M.; Gil-Izquierdo, Á. New C-Deoxyhexosyl Flavones and Antioxidant Properties of Passiflora edulis Leaf Extract. J. Agric. Food Chem. 2007, 55, 10187–10193. [Google Scholar] [CrossRef]
  38. Domínguez-Rodríguez, G.; García, M.C.; Plaza, M.; Marina, M.L. Revalorization of Passiflora species peels as a sustainable source of antioxidant phenolic compounds. Sci. Total Environ. 2019, 696, 134030. [Google Scholar] [CrossRef]
  39. Zeraik, M.L.; Serteyn, D.; Deby-Dupont, G.; Wauters, J.-N.; Tits, M.; Yariwake, J.H.; Angenot, L.; Franck, T. Evaluation of the antioxidant activity of passion fruit (Passiflora edulis and Passiflora alata) extracts on stimulated neutrophils and myeloperoxidase activity assays. Food Chem. 2011, 128, 259–265. [Google Scholar] [CrossRef]
  40. Memon, A.F.; Solangi, A.R.; Memon, S.Q.; Mallah, A.; Memon, N.; Memon, A.A. Simultaneous Determination of Quercetin, Rutin, Naringin, and Naringenin in Different Fruits by Capillary Zone Electrophoresis. Food Anal. Methods 2017, 10, 83–91. [Google Scholar] [CrossRef]
  41. Balbaa, S.I.; Zaki, A.Y.; El Shamy, A.M. Total Flavonoid and Rutin Content of the Different Organs of Sophora japonica L. J. Assoc. Off. Anal. Chem. AOAC Int. 1974, 57, 752–755. [Google Scholar] [CrossRef]
  42. Yang, Z.; Zhai, W. Optimization of microwave-assisted extraction of anthocyanins from purple corn (Zea mays L.) cob and identification with HPLC–MS. Innov. Food Sci. Emerg. Technol. 2010, 11, 470–476. [Google Scholar] [CrossRef]
  43. Jaiswal, V.; DerMarderosian, A.; Porter, J.R. Anthocyanins and polyphenol oxidase from dried arils of pomegranate (Punica granatum L.). Food Chem. 2010, 118, 11–16. [Google Scholar] [CrossRef]
  44. Argentieri, M.P.; Levi, M.; Guzzo, F.; Avato, P. Phytochemical analysis of Passiflora loefgrenii Vitta, a rich source of luteolin-derived flavonoids with antioxidant properties. J. Pharm. Pharmacol. 2015, 67, 1603–1612. [Google Scholar] [CrossRef]
  45. Waki, T.; Mameda, R.; Nakano, T.; Yamada, S.; Terashita, M.; Ito, K.; Tenma, N.; Li, Y.; Fujino, N.; Uno, K.; et al. A conserved strategy of chalcone isomerase-like protein to rectify promiscuous chalcone synthase specificity. Nat. Commun. 2020, 11, 870. [Google Scholar] [CrossRef]
  46. Liou, G.; Chiang, Y.-C.; Wang, Y.; Weng, J.-K. Mechanistic basis for the evolution of chalcone synthase catalytic cysteine reactivity in land plants. J. Biol. Chem. 2018, 293, 18601–18612. [Google Scholar] [CrossRef] [Green Version]
  47. Jinxia, H.; Lijia, Q.; Ji, Y.; Hao, Y.; Hongya, G. A preliminary study on the origin and evolution of chalcone synthase (CHS) gene in angiosperms. Acta Bot. Sin. 2004, 46, 10–19. [Google Scholar]
  48. Holton, T.A.; Cornish, E.C. Genetics and Biochemistry of Anthocyanin Biosynthesis. Plant Cell 1995, 7, 1071–1083. [Google Scholar] [CrossRef]
  49. Jaakola, L.; Määttä, K.; Pirttilä, A.M.; Törrönen, R.; Kärenlampi, S.; Hohtola, A. Expression of Genes Involved in Anthocyanin Biosynthesis in Relation to Anthocyanin, Proanthocyanidin, and Flavonol Levels during Bilberry Fruit Development. Plant Physiol. 2002, 130, 729–739. [Google Scholar] [CrossRef] [Green Version]
  50. Ni, Y.; Jiang, H.-L.; Lei, B.; Li, J.-N.; Chai, Y.-R. Molecular cloning, characterization and expression of two rapeseed (Brassica napus L.) cDNAs orthologous to Arabidopsis thaliana phenylalanine ammonia-lyase 1. Euphytica 2008, 159, 1–16. [Google Scholar] [CrossRef]
  51. Bai, C.; Xu, J.; Cao, B.; Li, X.; Li, G. Transcriptomic analysis and dynamic expression of genes reveal flavonoid synthesis in Scutellaria viscidula. Acta Physiol. Plant. 2018, 40, 161. [Google Scholar] [CrossRef]
  52. Winkel-Shirley, B. Flavonoid Biosynthesis. A Colorful Model for Genetics, Biochemistry, Cell Biology, and Biotechnology. Plant Physiol. 2001, 126, 485–493. [Google Scholar] [CrossRef] [Green Version]
  53. Qi, Y.; Li, C.; Duan, C.; Gu, C.; Zhang, Q. Integrated Metabolomic and Transcriptomic Analysis Reveals the Flavonoid Regulatory Network by Eutrema EsMYB90. Int. J. Mol. Sci. 2021, 22, 8751. [Google Scholar] [CrossRef]
  54. Zhao, X.; Yuan, Z.; Feng, L.; Fang, Y. Cloning and expression of anthocyanin biosynthetic genes in red and white pomegranate. J. Plant Res. 2015, 128, 687–696. [Google Scholar] [CrossRef]
  55. Boss, P.K.; Davies, C.; Robinson, S.P. Analysis of the Expression of Anthocyanin Pathway Genes in Developing Vitis vinifera L. cv Shiraz Grape Berries and the Implications for Pathway Regulation. Plant Physiol. 1996, 111, 1059–1066. [Google Scholar] [CrossRef] [Green Version]
  56. Kondo, S.; Hiraoka, K.; Kobayashi, S.; Honda, C.; Terahara, N. Changes in the Expression of Anthocyanin Biosynthetic Genes during Apple Development. J. Am. Soc. Hortic. Sci. 2002, 127, 971–976. [Google Scholar] [CrossRef]
  57. Zhai, R.; Wang, Z.; Zhang, S.; Meng, G.; Song, L.; Wang, Z.; Li, P.; Ma, F.; Xu, L. Two MYB transcription factors regulate flavonoid biosynthesis in pear fruit (Pyrus bretschneideri Rehd.). J. Exp. Bot. 2016, 67, 1275–1284. [Google Scholar] [CrossRef] [Green Version]
  58. Zhao, Y.; Zhang, Y.-Y.; Liu, H.; Zhang, X.-S.; Ni, R.; Wang, P.-Y.; Gao, S.; Lou, H.-X.; Cheng, A.-X. Functional characterization of a liverworts bHLH transcription factor involved in the regulation of bisbibenzyls and flavonoids biosynthesis. BMC Plant Biol. 2019, 19, 497. [Google Scholar] [CrossRef]
  59. Liu, Z.; Liu, Y.; Coulter, J.A.; Shen, B.; Li, Y.; Li, C.; Cao, Z.; Zhang, J. The WD40 Gene Family in Potato (Solanum Tuberosum L.): Genome-Wide Analysis and Identification of Anthocyanin and Drought-Related WD40s. Agronomy 2020, 10, 401. [Google Scholar] [CrossRef] [Green Version]
  60. Kim, S.; Hwang, G.; Lee, S.; Zhu, J.-Y.; Paik, I.; Nguyen, T.T.; Kim, J.; Oh, E. High Ambient Temperature Represses Anthocyanin Biosynthesis through Degradation of HY5. Front. Plant Sci. 2017, 8, 1787. [Google Scholar] [CrossRef] [Green Version]
  61. Vinatoru, M.; Mason, T.J.; Calinescu, I. Ultrasonically assisted extraction (UAE) and microwave assisted extraction (MAE) of functional compounds from plant materials. TrAC Trends Anal. Chem. 2017, 97, 159–178. [Google Scholar] [CrossRef]
  62. Kim, I.; Lee, J. Variations in Anthocyanin Profiles and Antioxidant Activity of 12 Genotypes of Mulberry (Morus spp.) Fruits and Their Changes during Processing. Antioxidants 2020, 9, 242. [Google Scholar] [CrossRef] [Green Version]
  63. Hellström, J.K.; Mattila, P.H. HPLC Determination of Extractable and Unextractable Proanthocyanidins in Plant Materials. J. Agric. Food Chem. 2008, 56, 7617–7624. [Google Scholar] [CrossRef]
  64. Henry-Kirk, R.A.; Plunkett, B.; Hall, M.; McGhie, T.; Allan, A.C.; Wargent, J.J.; Espley, R.V. Solar UV light regulates flavonoid metabolism in apple (Malus x domestica). Plant. Cell Environ. 2018, 41, 675–688. [Google Scholar] [CrossRef]
  65. Ribani, M.; Bottoli, C.B.G.; Collins, C.H.; Jardim, I.C.S.F.; Melo, L.F.C. Validation for chromatographic and electrophoretic methods. Quim. Nova 2004, 27, 771–780. [Google Scholar] [CrossRef]
  66. Jiang, Z.; Huang, Q.; Jia, D.; Zhong, M.; Tao, J.; Liao, G.; Huang, C.; Xu, X. Characterization of Organic Acid Metabolism and Expression of Related Genes During Fruit Development of Actinidia eriantha ‘Ganmi 6. ’ Plants 2020, 9, 332. [Google Scholar] [CrossRef] [Green Version]
  67. Hu, M.; Du, J.; Du, L.; Luo, Q.; Xiong, J. Anti-fatigue activity of purified anthocyanins prepared from purple passion fruit (P. edulis Sim) epicarp in mice. J. Funct. Foods 2020, 65, 103725. [Google Scholar] [CrossRef]
  68. Lalitha, S. Primer Premier 5. Biotech Softw. Internet Rep. 2000, 1, 270–272. [Google Scholar] [CrossRef]
  69. Munhoz, C.F.; Santos, A.A.; Arenhart, R.A.; Santini, L.; Monteiro-Vitorello, C.B.; Vieira, M.L.C. Analysis of plant gene expression during passion fruit—Xanthomonas axonopodis interaction implicates lipoxygenase 2 in host defence. Ann. Appl. Biol. 2015, 167, 135–155. [Google Scholar] [CrossRef]
Figure 1. Changes in contents of total flavonoids (A), anthocyanin (B), and procyanidins (C) in the peel of purple and yellow passion fruit during fruit development. Vertical bars indicate means ± SD (n = 3, 5 fruits per replicate). The * and *** represent significance at p ≤ 0.05 and p ≤ 0.001, respectively, among both cultivars according to Student’s t-test.
Plants 10 02240 g001
Figure 2. Changes in PAL (A), C4H (B), 4CL (C), CHS (D), UFGT (E), and GST (F) activities of purple and yellow passion fruit peel during fruit growth and development. Vertical bars indicate means ± SD (n = 3, 5 fruits per replicate). The **, and *** represent significance at p ≤ 0.01, and p ≤ 0.001, respectively, among both cultivars according to Student’s t-test.
Plants 10 02240 g002
Figure 3. Relative expressions of PePAL1-5 (AE) genes in purple and yellow passion fruit peel during fruit growth and development. The relative gene expression was calculated using the 2−ΔΔct method. Vertical bars indicate means ± SD (n = 3, 5 fruits per replicate). The *, **, and *** represent significance at p ≤ 0.05, p ≤ 0.01, and p ≤ 0.001, respectively, among both cultivars according to Student’s t-test.
Plants 10 02240 g003
Figure 4. Relative expressions of PeC4H gene in purple and yellow passion fruit peel during fruit growth and development. The relative gene expression was calculated using the 2−ΔΔct method. Vertical bars indicate means ± SD (n = 3, 5 fruits per replicate). The *, **, and *** represent significance at p ≤ 0.05, p ≤ 0.01, and p ≤ 0.001, respectively, among both cultivars according to Student’s t-test.
Plants 10 02240 g004
Figure 5. Relative expressions of Pe4CL1-7 (AG) genes in purple and yellow passion fruit peel during fruit growth and development. The relative gene expression was calculated using the 2−ΔΔct method. Vertical bars indicate means ± SD (n = 3, 5 fruits per replicate). The *, **, and *** represent significance at p ≤ 0.05, p ≤ 0.01, and p ≤ 0.001, respectively, among both cultivars according to Student’s t-test.
Plants 10 02240 g005
Figure 6. Relative expressions of PeCHS1-3 (AC) genes in purple and yellow passion fruit peel during fruit growth and development. The relative gene expression was calculated using the 2−ΔΔct method. Vertical bars indicate means ± SD (n = 3, 5 fruits per replicate). The *** represents significance at p ≤ 0.001, among both cultivars according to Student’s t-test.
Plants 10 02240 g006
Figure 7. Relative expressions of PeUFGT1 (A) and PeUFGT2 (B) genes in purple and yellow passion fruit peel during fruit growth and development. The relative gene expression was calculated using the 2−ΔΔct method. Vertical bars indicate means ± SD (n = 3, 5 fruits per replicate). The *** represents significance at p ≤ 0.001, among both cultivars according to Student’s t-test.
Plants 10 02240 g007
Figure 8. Relative expressions of PeGST1-7 (AG) genes in purple and yellow passion fruit peel during fruit growth and development. The relative gene expression was calculated using the 2−ΔΔct method. Vertical bars indicate means ± SD (n = 3, 5 fruits per replicate). The *, **, and *** represent significance at p ≤ 0.05, p ≤ 0.01, and p ≤ 0.001, respectively, among both cultivars according to Student’s t-test.
Plants 10 02240 g008
Figure 9. Principal component analysis among total flavonoids, anthocyanins, procyanidins, flavonoid and anthocyanin metabolites, key enzymes, and relative expressions of genes involved in flavonoids metabolism of purple (A) and yellow (B) passion fruit. Clustering of fruit maturity stages and measured attributes into groups (colored shapes) is based on their highest squared cosine values corresponding to the factor, F1 (red), F2 (green) or F3 (blue). Abbreviations: Flv—total flavonoids; Anth—total anthocyanins; Procy—total procyanidins; Rut—rutin; Lut—luteolin; QRC—quercetin; Cyan—cyanidin-3-O-glucoside chloride; Peo—peonidin-3-O-glucoside; Pel—pelargonidin-3-O-glucoside; PAL—L-phenylalanine ammonia-lyase; C4H—cinnamate 4-hydrogenase; 4CL—4-coumarate: coenzyme A Ligase; CHS—chalcone synthase; UFGT—UPD-3-O- glycosyltransferase; GST—glutathione S-transferase.
Plants 10 02240 g009
Figure 10. Flavonoids’ biosynthesis pathway in plants.
Plants 10 02240 g010
Figure 11. Lateral and transverse sections of fruits at different developmental stages of purple and yellow passion fruits.
Plants 10 02240 g011
Table 1. The content of flavonoid and anthocyanin metabolites in fruit peel of purple and yellow passion fruits during fruit development.
CultivarFruiting StageRutin (ng/g)Luteolin (ng/g)Quercetin (ng/g)Cyanidin-3-O-Glucoside Chloride (ng/g)Peonidin-3-O-Glucoside (ng/g)Pelargonidin-3-O-Glucoside (ng/g)
Fruitlet906.99 ± 79.10 c15.62 ± 0.48 b5.55 ± 2.31 c1.48 ± 0.58 d1.13 ± 0.85 c3.53 ± 0.53 c
Green1386.36 ± 132.25 c13.55 ± 0.88 b4.63 ± 4.50 c3.91 ± 0.60 d2.02 ± 0.19 c4.15 ± 0.39 c
PurpleVeraison2384.89 ± 1309.13 c13.50 ± 3.05 b9.01 ± 5.30 c3881.42 ± 572.51 c411.03 ± 310.05 c75.94 ± 32.73 c
Maturation9499.92 ± 692.22 b13.91 ± 1.20 b21.14 ± 3.24 b5927.90 ± 303.74 b3351.67 ± 667.85 b209.71 ± 25.81 b
Ripening22,569.60 ± 3386.66 a29.19 ± 4.52 a35.25 ± 2.31 a7341.62 ± 639.87 a9793.08 ± 3045.70 a511.92 ± 109.69 a
YellowFruitlet779.55 ± 74.56 ab15.30 ± 4.40 a3.08 ± 0.06 a0.70 ± 0.55 c02.54 ± 0.05 c
Green865.34 ± 36.12 abc10.88 ± 0.71 ab3.09 ± 0.06 a5.88 ± 0.51 a03.77 ± 0.48 b
Veraison565.93 ± 54.38 d8.41 ± 0.62 c0.65 ± 0.08 b5.76 ± 1.67 a04.88 ± 0.89 a
Maturation664.39 ± 34.58 bc8.51 ± 0.62 c03.66 ± 1.38 b0.06 ± 0.11 b3.98 ± 0.09 ab
Ripening705.82 ± 168.55 a14.84 ± 4.06 a02.90 ± 0.79 b0.96 ± 0.38 a4.59 ± 0.34 ab
Different lowercase letters represent significant differences (p ≤ 0.05), according to Fisher’s least significant difference (LSD) test SD (n = 3, 5 fruits per replicate).
Table 2. Validation parameters for the ultra-performance liquid chromatography (UPLC) method.
Flavonoid/Anthocyanin ComponentLinearity (r2)Slope (y)Response (Sy)Sy/yLOD *
(µg·mL−1)
LOQ **
(µg·mL−1)
Rutin0.9993030.27375.226219.092163.00190.92
Luteolin0.9996920.27454.972718.111159.76181.11
Quercetin0.9996670.27564.635816.816455.49168.16
Cyanidin-3-O-glucoside chloride0.9985900.27674.331915.652651.65156.52
Peonidin-3-O-glucoside 0.9995060.27574.609616.714755.15167.14
Pelargonidin-3-O-glucoside0.9983510.27544.772017.325457.17173.25
* Limit of detection; ** Limit of quantification.
Publisher’s Note: MDPI stays neutral with regard to jurisdictional claims in published maps and institutional affiliations.

