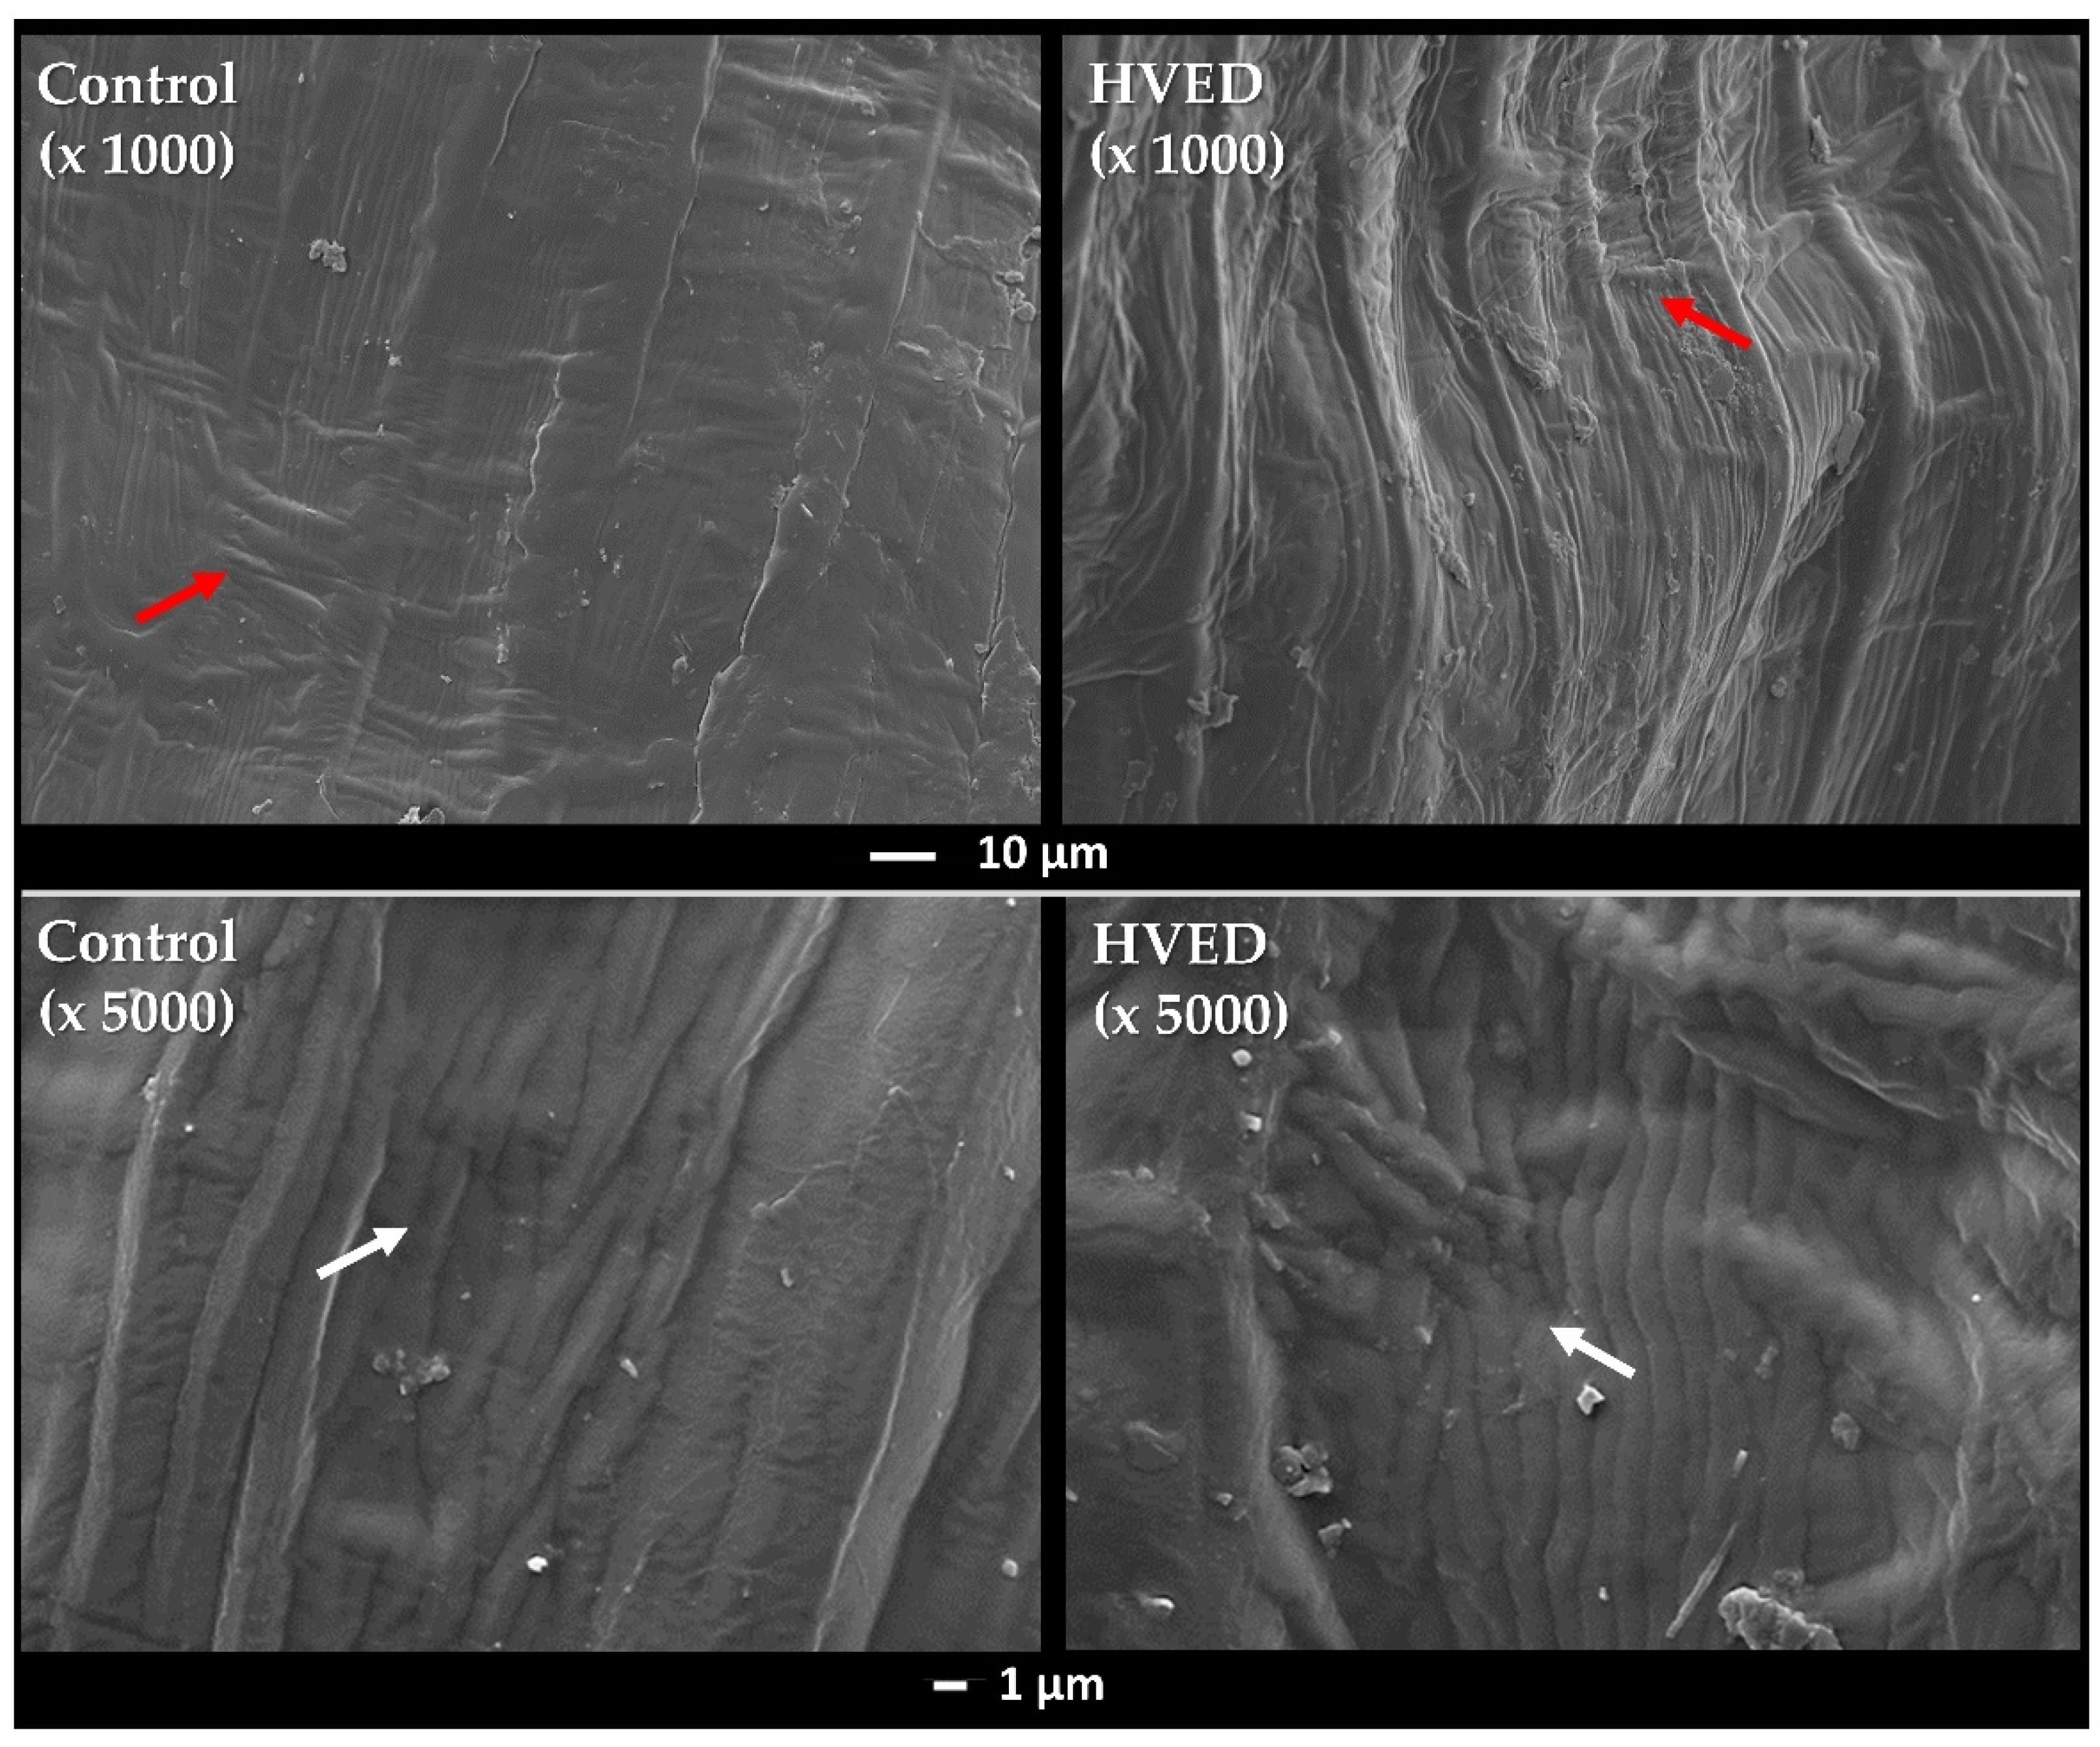
Figure 1.
Selected scanning electron microscopy images of the seed morphology recorded at working distance of 10 mm with an acceleration voltage of 5 kV and magnifications of 1000× and 5000×. As a result of high voltage electrical discharge treatment (HVED), the number of mesh interconnected structures reduced (red arrows) and the wrinkles become more noticeable (white arrows).
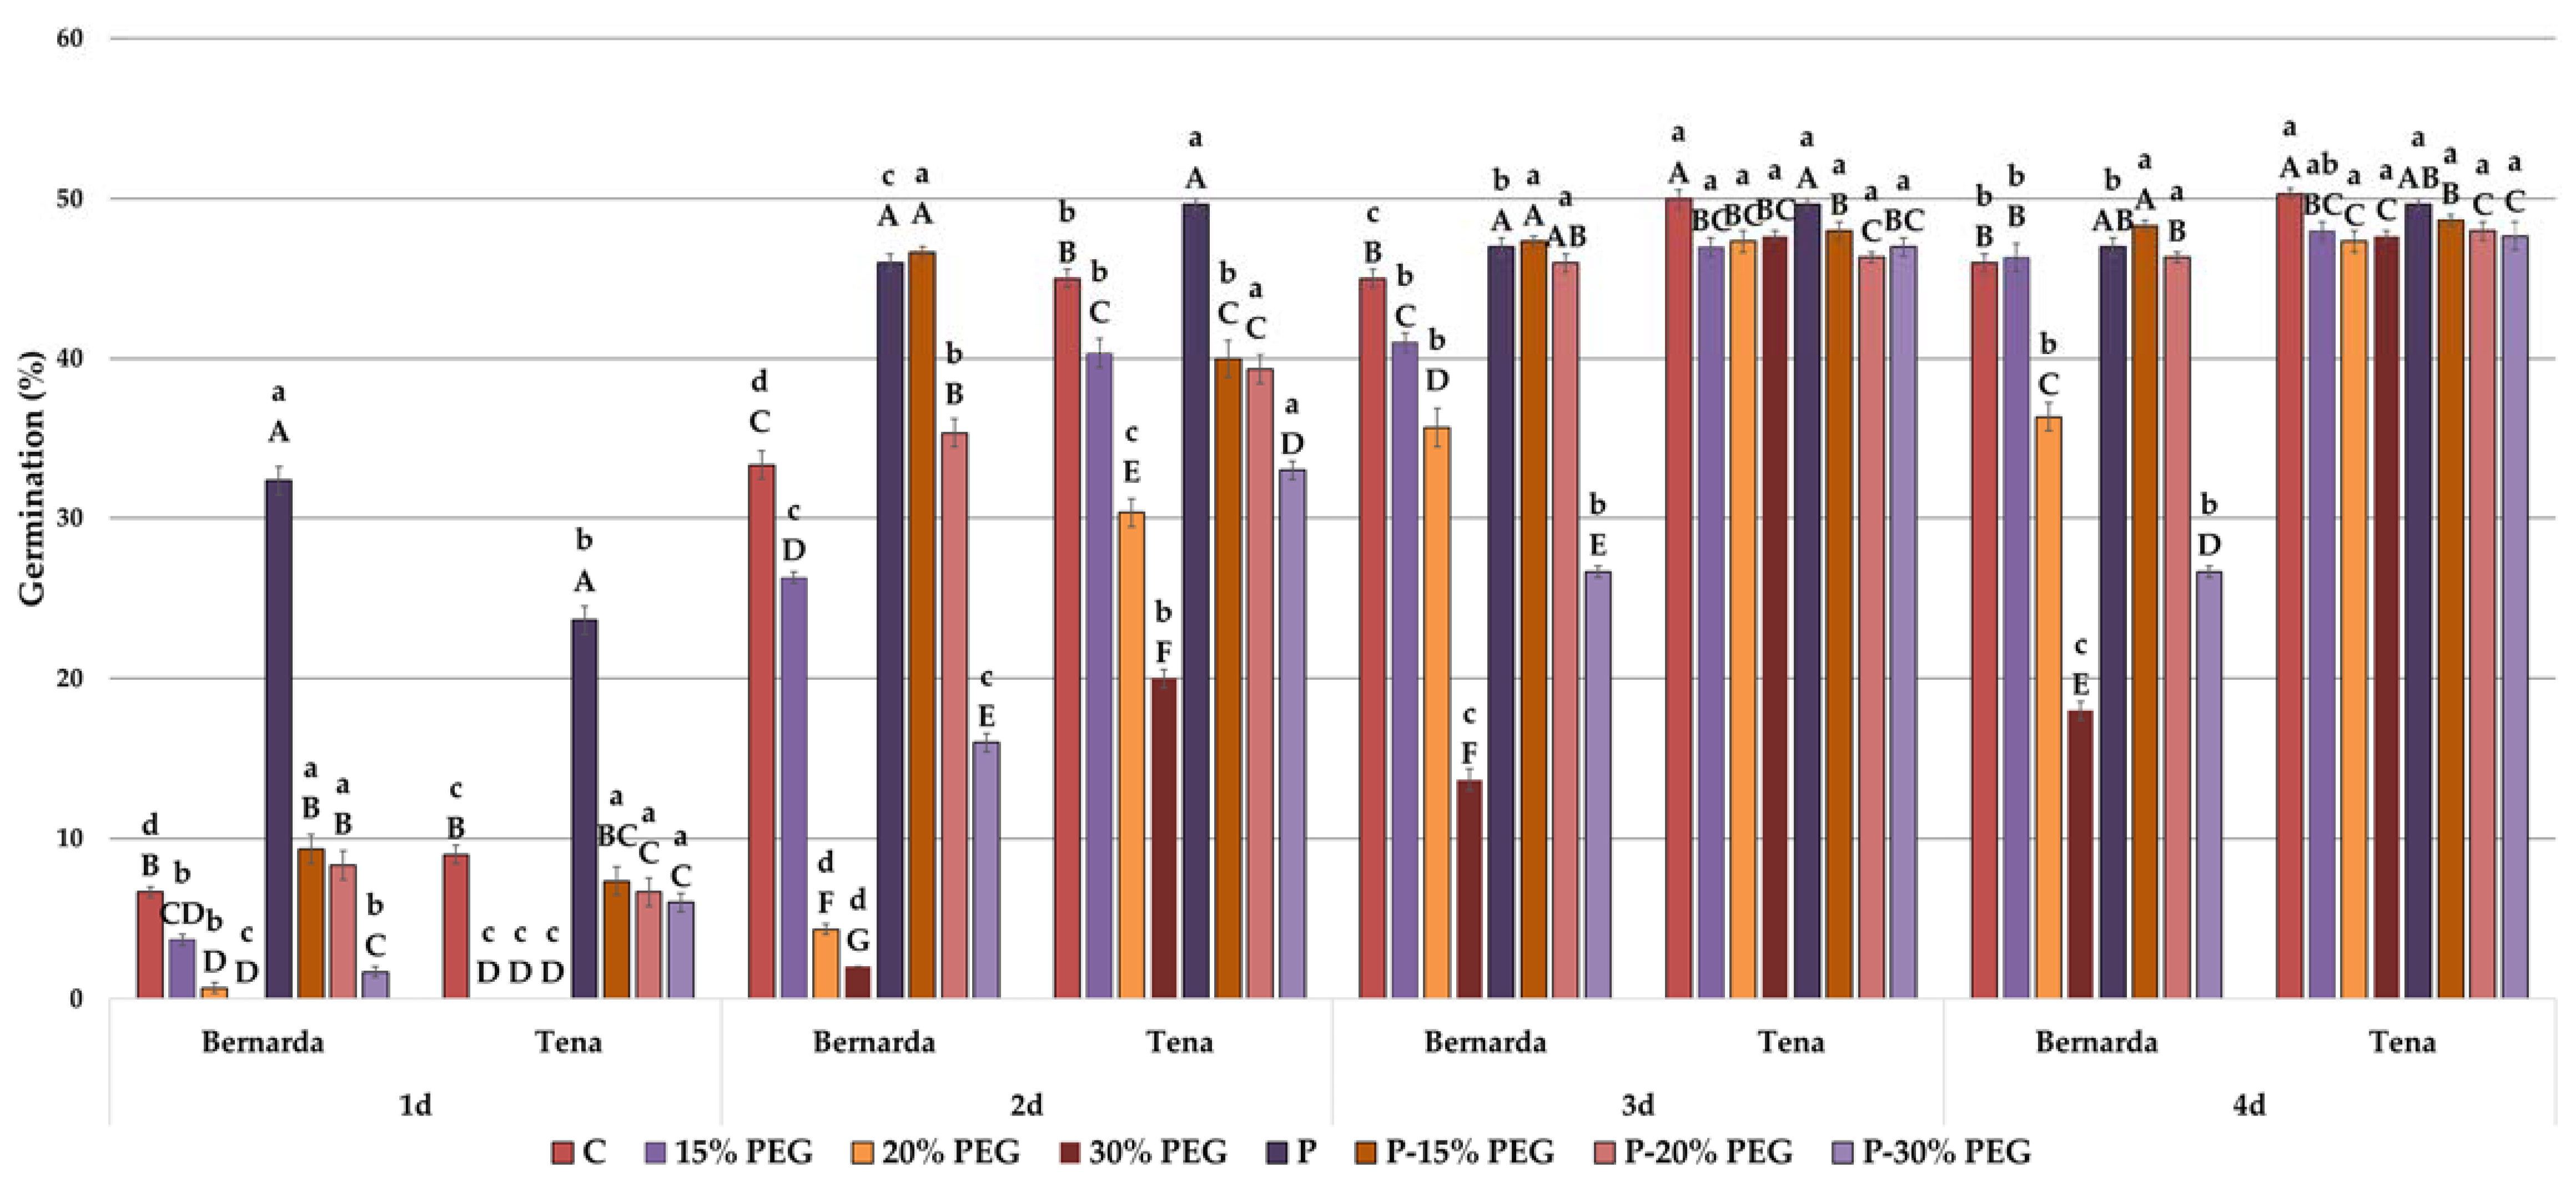
Figure 2.
Germination percentage of two wheat genotypes during 4 days under control (C), drought treatments (15%, 20% and 30% PEG), high voltage electrical discharge (HVED) pre-treatment (P) and combined (P-15% PEG, P-20% PEG and P-30% PEG) treatments. Values are means of three repetitions (100 seeds/repetition) ± S.D. The different capital letters indicate significances among means of different treatments within the same genotype, while lowercase letters indicate significances among means and between genotypes under the same treatment at p < 0.05 using LSD post hoc-test.
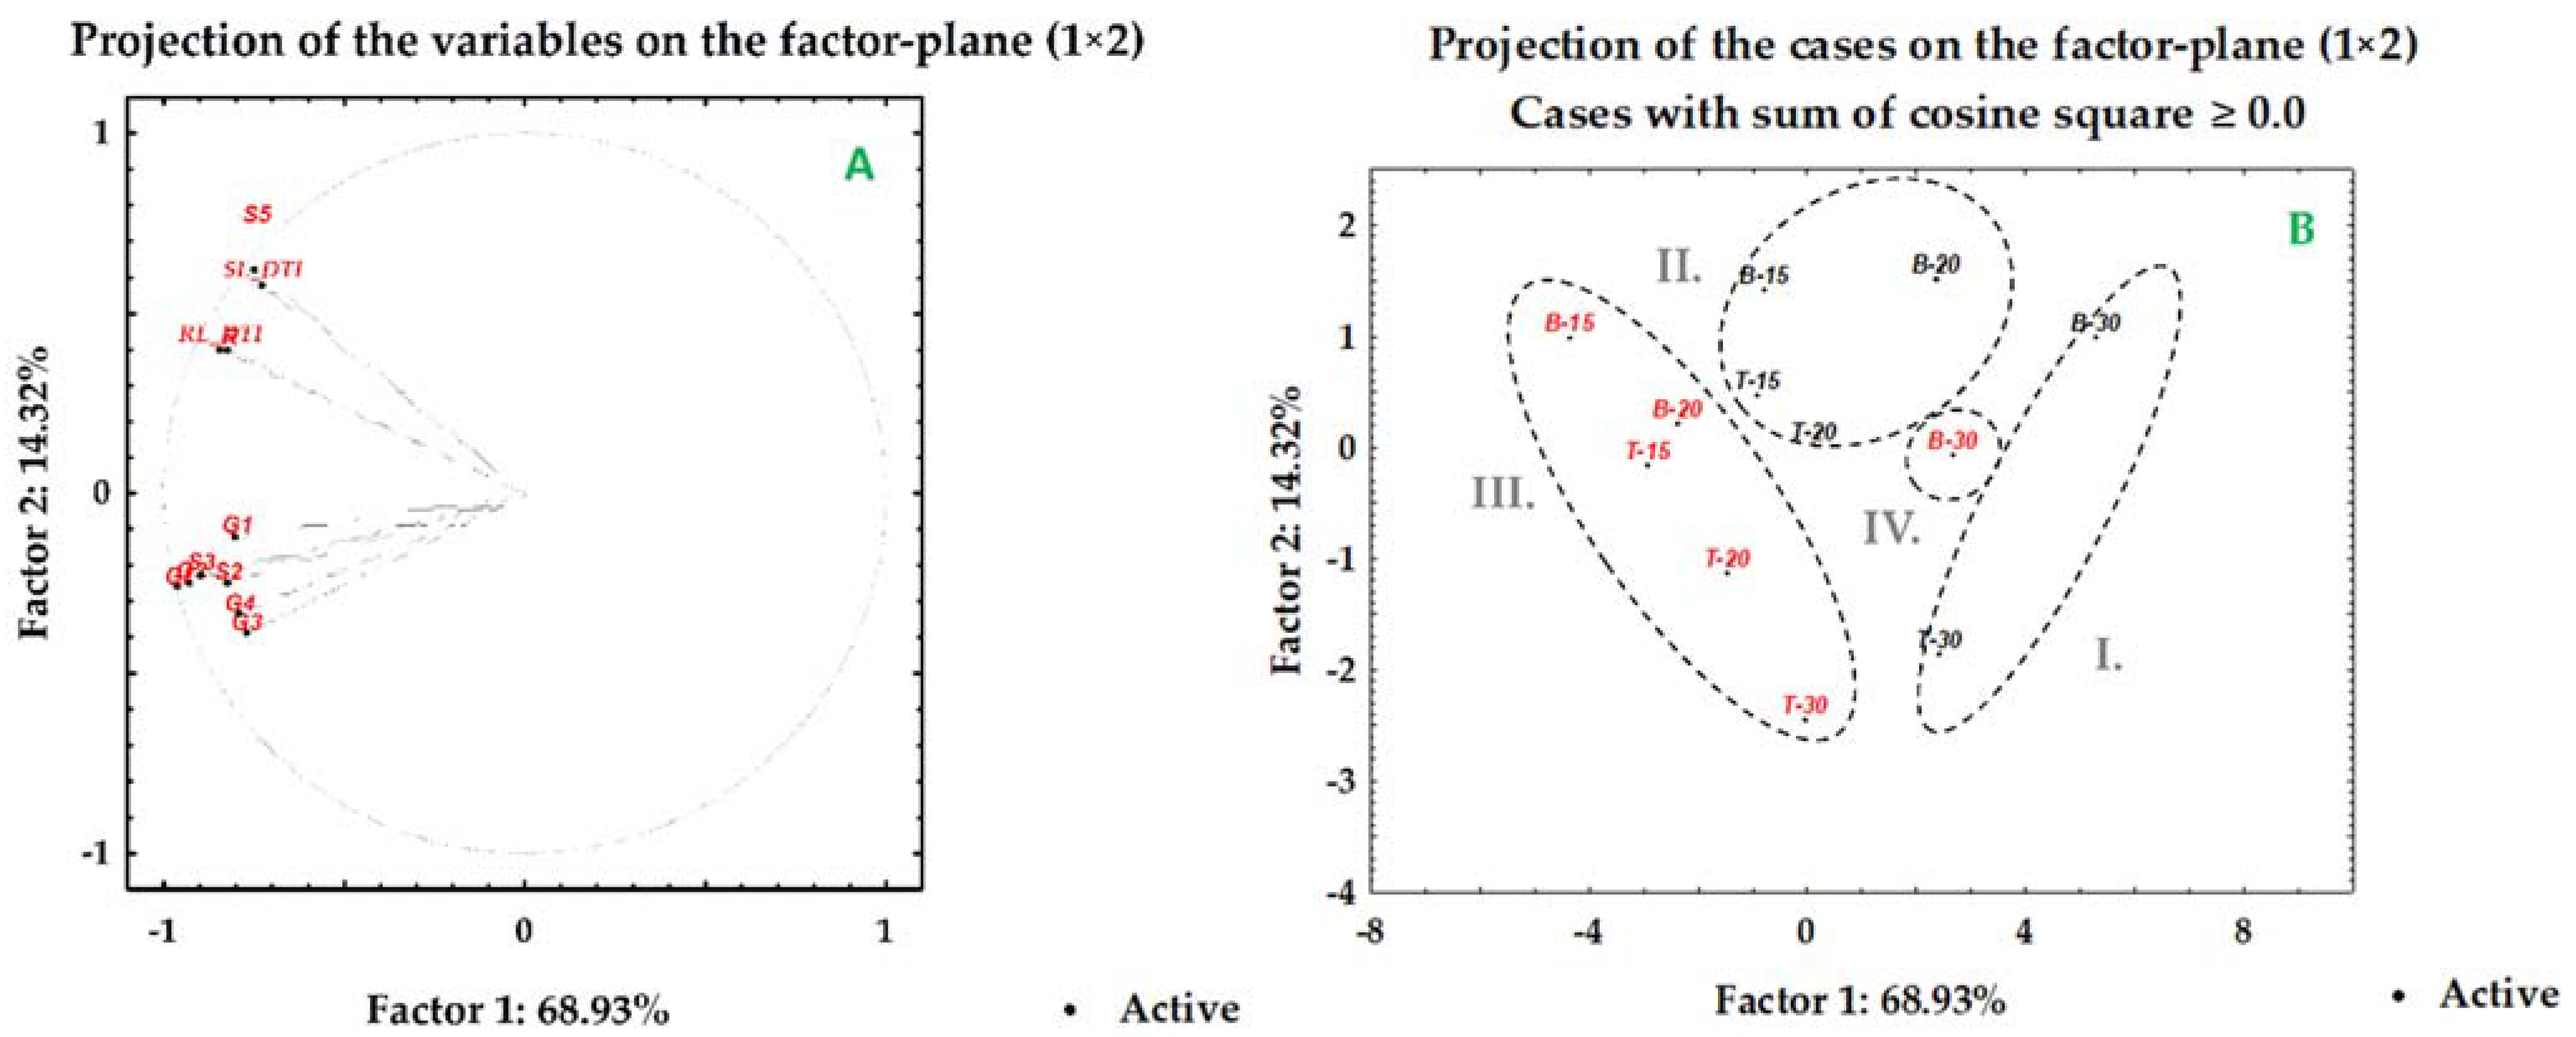
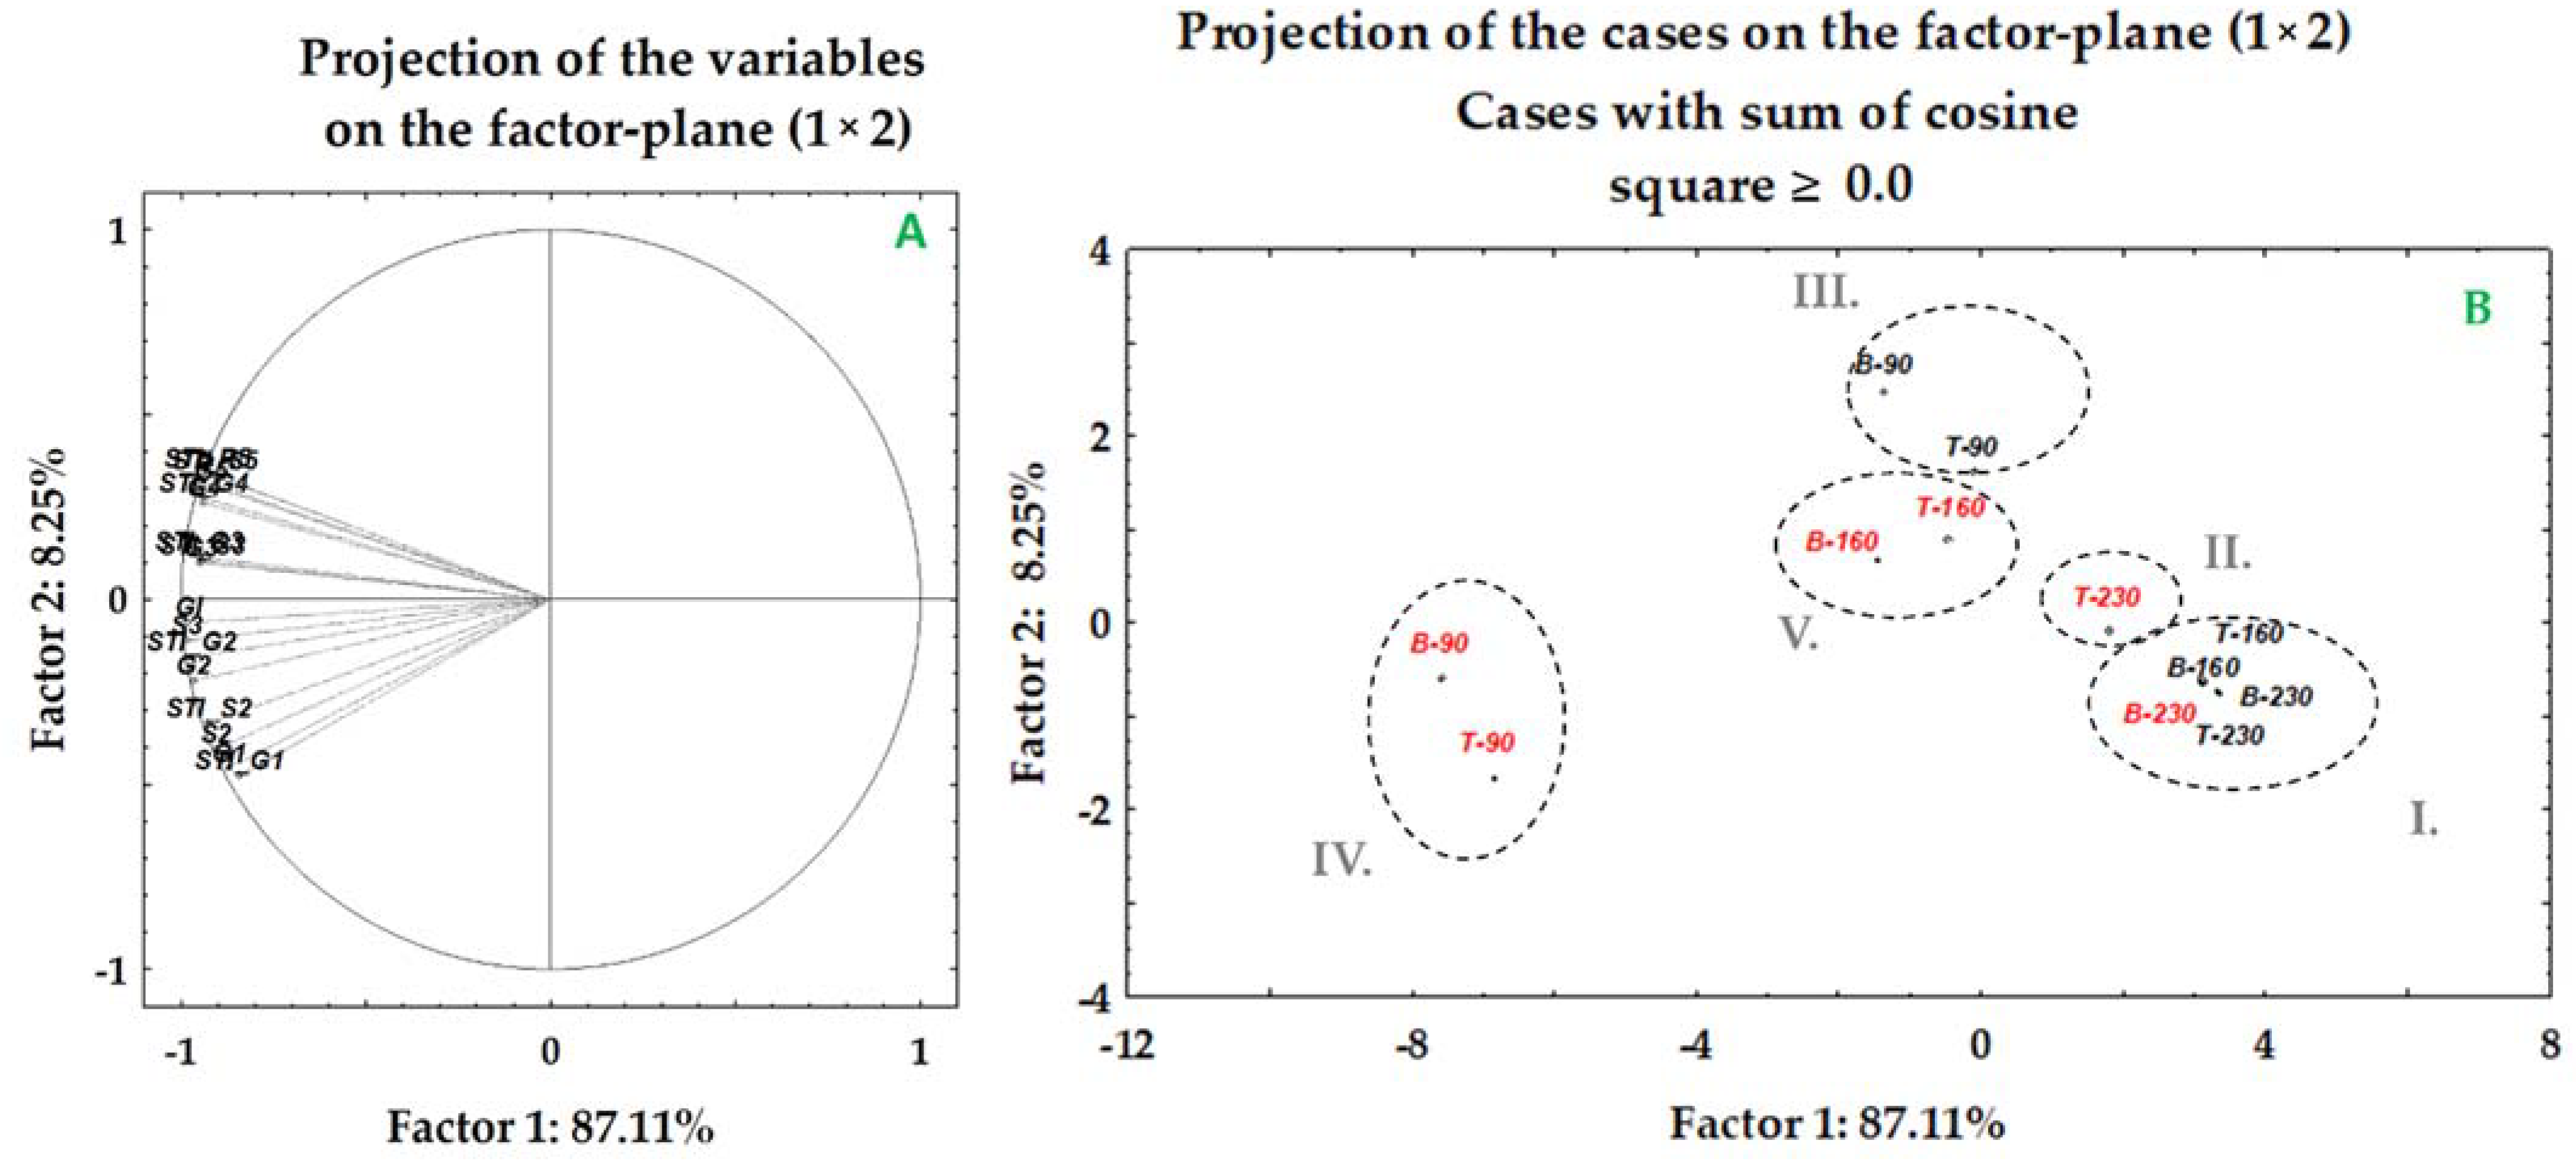
Figure 3.
Principal component analysis of data sets of germination percentages (G), germination index (GI), shoot (S) and root (R) lengths, drought tolerance index for shoot (SL_DTI) and root (RL_DTI) lengths under drought (15%, 20% and 30% PEG) and combined (P-15% PEG, P-20% PEG and P-30% PEG) treatments. Genotypes Bernarda (B) and Tena (T). Factor loadings (A) and scores (B) of first two factors. Numbers beside each variable represent the day of treatment. Red marks present high voltage electrical discharge (HVED) pretreatment.
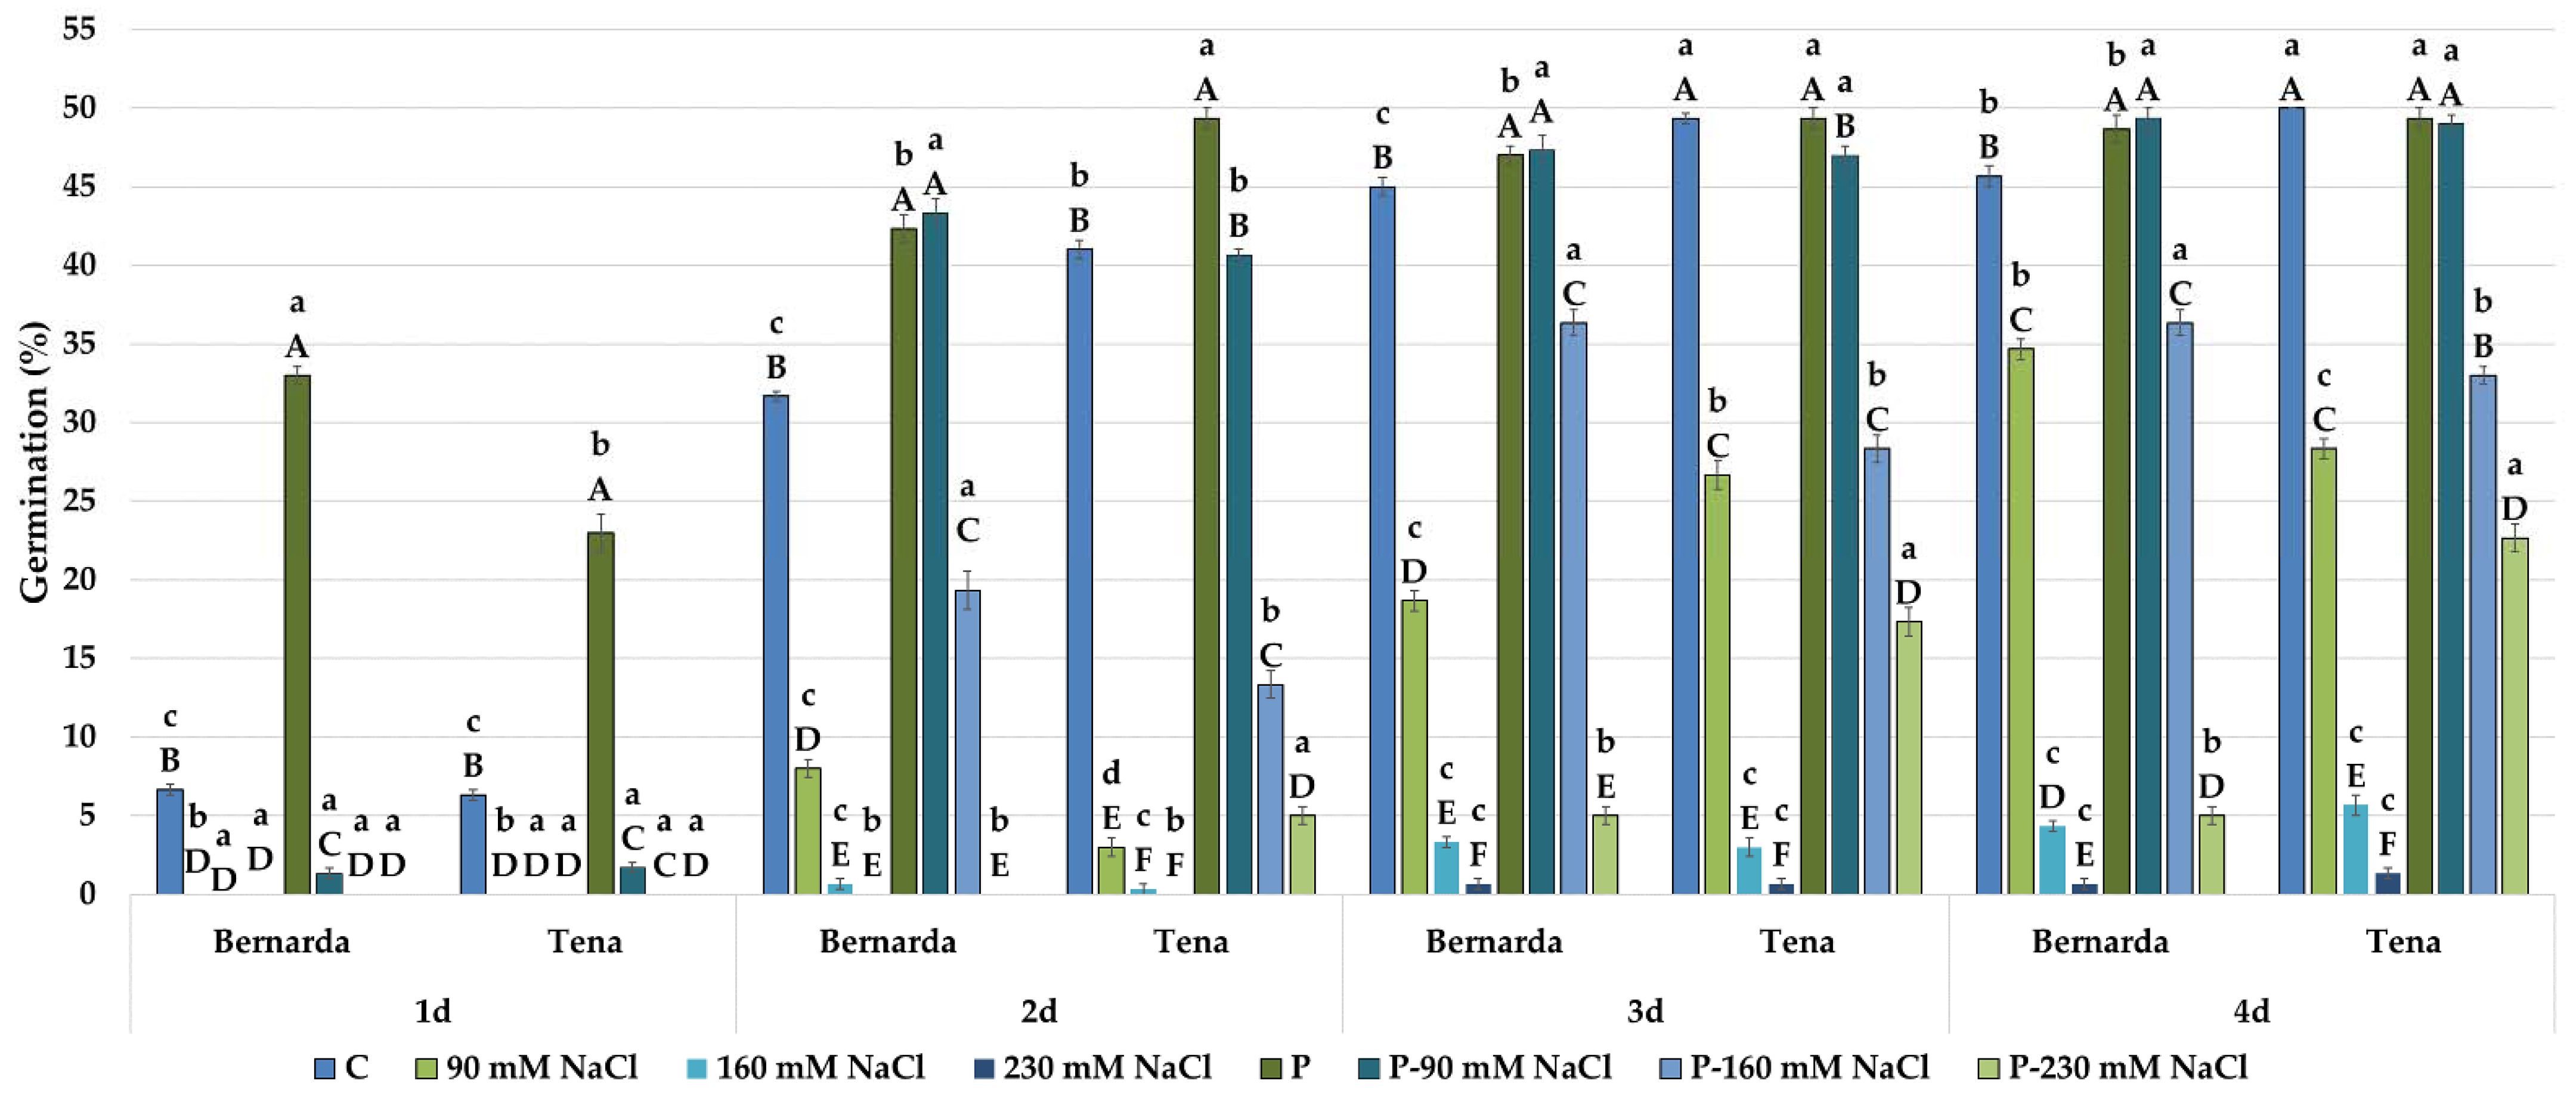
Figure 4.
Germination percentages of two wheat genotypes during 4 days under control (C), salt treatments (90, 160 and 230 mM NaCl), high voltage electrical discharge (HVED) pretreatment (P) and combined (P-90 mM NaCl, P-160 mM NaCl and P-230 mM NaCl) treatments. Values are means of three repetitions (100 seeds/repetition) ± S.D. The different capital letters indicate significances among means of different treatments within the same genotype, while lowercase letters indicate significances among means between genotypes under the same treatment at p < 0.05 using LSD post hoc-test.
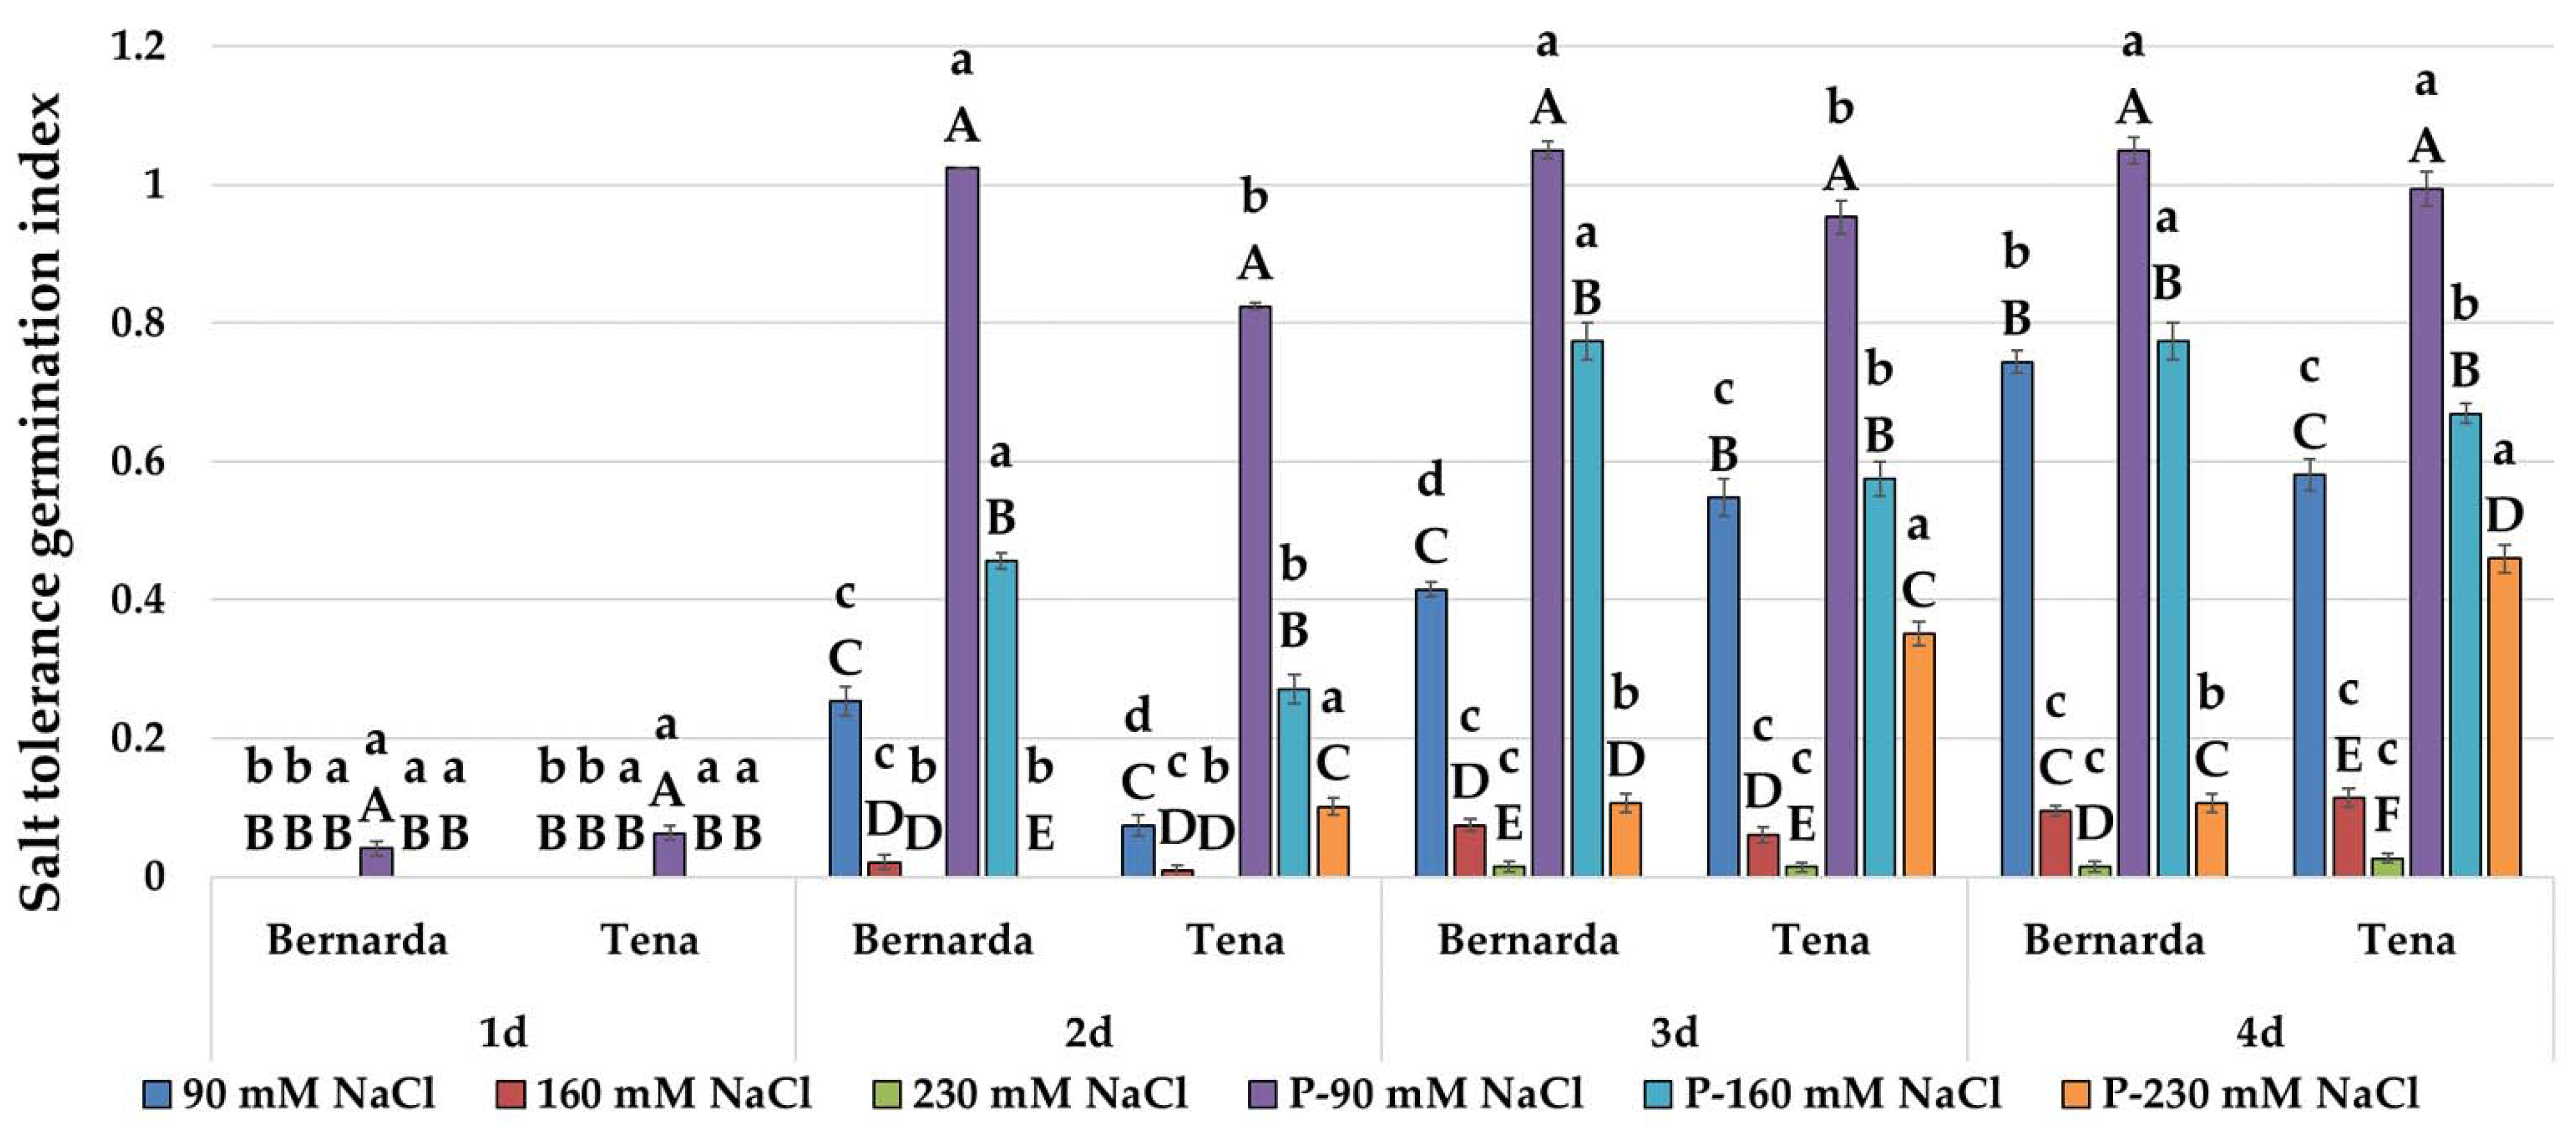
Figure 5.
Salt tolerance germination index (STI_G) of two wheat genotypes during 4 days under salt treatments (90, 160 and 230 mM NaCl), high voltage electrical discharge (HVED) pretreatment (P) and combined (P-90 mM NaCl, P-160 mM NaCl and P-230 mM NaCl) treatments. Values are means of three repetitions (100 seeds/repetition) ± S.D. The different capital letters indicate significances among means of different treatments within the same genotype, while lowercase letters indicate significances among means between genotypes under the same treatment at p < 0.05 using LSD post hoc-test.
Figure 6.
Principal component analysis of data sets of germination percentages (G), the germination index (GI), shoot (S) and root (R) lengths, and salt tolerance indices for germination (STI_G), shoot (STI_DT) and root (STI_R) lengths under salt treatments (90, 16 and 230 mM) and combined (P-90 mM, P-160 mM and P-230 mM NaCl) treatments. Genotypes Bernarda (B) and Tena (T). Factor loadings (A) and scores (B) of first two factors. Numbers beside each variable represent the day of treatment. Red marks represent high voltage electrical discharge (HVED) pretreatment.
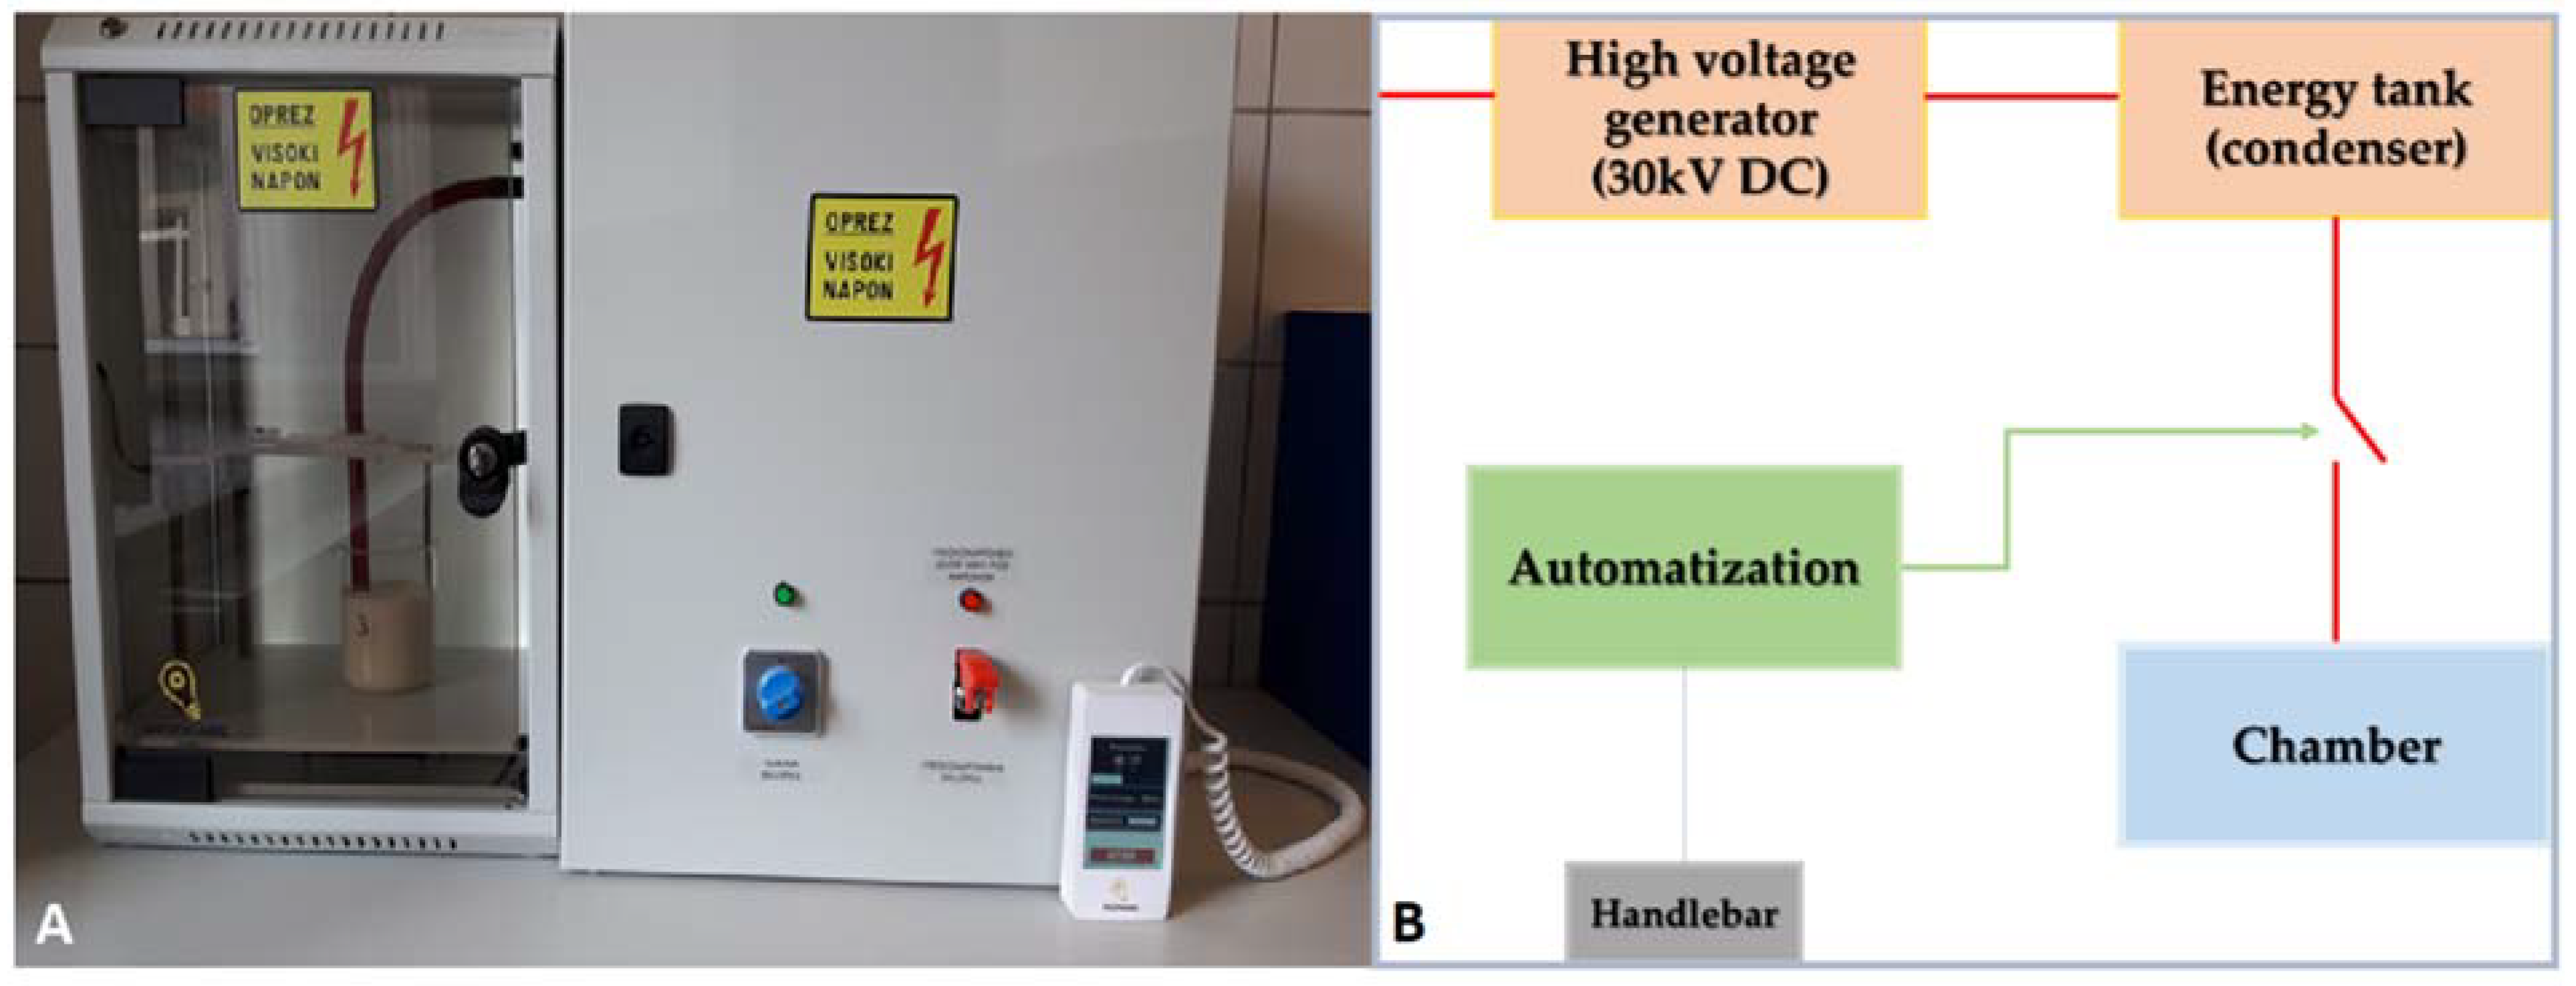
Figure 7.
The high-voltage electrical discharge (HVED) device used in the study (A) and a basic HVED schematic diagram (B).
Figure 7.
The high-voltage electrical discharge (HVED) device used in the study (A) and a basic HVED schematic diagram (B).
Table 1.
The impact of high voltage electrical discharge (HVED) on the electrical conductivity of the water medium of wheat seeds. Values are means of three repetitions (50 seeds/repetition) ± S.D. The different letters indicate significances among means of different treatments and between genotypes under same treatment at p < 0.05 using LSD post hoc-test.
| Pretreatment | Electrical Conductivity (µS/cm/g) |
|---|
| Bernarda | Tena |
|---|
| Control | 66.6 ± 2.6 a | 62.4 ± 2.9 a |
| HVED | 91.8 ± 1.1 b | 97.2 ± 2.1 b |
Table 2.
Germination index of two wheat genotypes during 4 days under control (C), drought (15%, 20% and 30% PEG), salt treatments (90, 160 and 230 mM NaCl), high voltage electrical discharge (HVED) pre-treatment (P) and combined (P-15% PEG, P-20% PEG, P-30% PEG, P-90 mM NaCl, P-160 mM NaCl and P-230 mM NaCl) treatments. Values are means of three repetitions (100 seeds/repetition) ± S.D. The different capital letters indicate significances among means of different treatments within the same genotype, while low case letters indicate significances among means between genotypes under the same treatment at p < 0.05 using LSD post hoc-test.
| Drought | Salt Treatment |
|---|
| | Bernarda | Tena | | Bernarda | Tena |
|---|
| C | 29.54 ± 0.5 dD | 37.35 ± 0.3 cB | C | 28.86 ± 0.3 dB | 32.72 ± 0.8 dB |
| 15% PEG | 23.27 ± 0.6 dE | 25.96 ± 0.4 cE | 90 mM NaCl | 8.24 ± 0.4 cD | 7.43 ± 0.5 cE |
| 20% PEG | 10.51 ± 0.0 cG | 22.22 ± 0.5 bF | 160 mM NaCl | 1.08 ± 0.2 cE | 0.98 ± 0.2 cF |
| 30% PEG | 4.15 ± 0.1 dH | 18.42 ± 0.3 bG | 230 mM NaCl | 0.15 ± 0.1 cE | 0.19 ± 0.1 cF |
| P | 58.98 ± 0.5 aA | 53.67 ± 0.9 bA | P | 59.65 ± 0.6 aA | 53.14 ± 1.2 bA |
| P-15% PEG | 37.74 ± 0.9 aB | 33.36 ± 0.6 bC | P-90 mM NaCl | 28.83 ± 0.7 aB | 26.15 ± 0.0 bC |
| P-20% PEG | 32.15 ± 0.8 aC | 32.14 ± 1.3 aC | P-160 mM NaCl | 15.58 ± 0.3 aC | 13.45 ± 0.8 dB |
| P-30% PEG | 13.78 ± 0.1 cF | 29.19 ± 0.8 aD | P-230 mM NaCl | 1.15 ± 0.1 bE | 6.18 ± 0.0 aE |
Table 3.
Germination index of drought resistance (GIDR) in WP group of plants (without pre-treatment) and high voltage electrical discharge (HVED) pre-treated group under control and different PEG levels.
Table 3.
Germination index of drought resistance (GIDR) in WP group of plants (without pre-treatment) and high voltage electrical discharge (HVED) pre-treated group under control and different PEG levels.
| Treatment | WP Group | HVED |
|---|
| PEG | Bernarda | Tena | Bernarda | Tena |
|---|
| 15% | 0.79 | 0.69 | 0.64 | 0.62 |
| 20% | 0.36 | 0.59 | 0.55 | 0.60 |
| 30% | 0.14 | 0.49 | 0.23 | 0.54 |
Table 4.
Shoot length (mm) of two wheat genotypes at 2, 3 and 5 days of growth under control (C), drought treatments (15%, 20% and 30% PEG), salt treatments (90, 160 and 230 mM NaCl), high voltage electrical discharge (HVED) pretreatment (P) and combined (P-15% PEG, P-20% PEG, P-30% PEG, P-90 mM NaCl, P-160 mM NaCl and P-230 mM NaCl) treatments. Values are means of three repetitions (10 plants/repetition) ± S.D. The different capital letters indicate significances among means of different treatments within the same genotype, while lowercase letters indicate significances among means between genotypes under the same treatment at p < 0.05 using LSD post-hoc test.
| Drought | Salt Treatment |
|---|
| | 2d | 3d | 5d | | 2d | 3d | 5d |
|---|
| | Bernarda | Tena | Bernarda | Tena | Bernarda | Tena | | Bernarda | Tena | Bernarda | Tena | Bernarda | Tena |
|---|
| C | 5.2 ± 0.2 dB | 6.4 ± 0.1 bB | 13 ± 0.2 dD | 17.8 ± 0.2 cD | 84 ± 0.5 bB | 75.7 ± 0.3 dB | C | 5.7 ± 0.2 bB | 6.0 ± 0.2 bB | 13.2 ± 0.2 dC | 17.8 ± 0.2 cB | 82.9 ± 0.3 bB | 75.7 ± 0.3 dB |
| 15% PEG | 3.5 ± 0.3 bCD | 2.7 ± 0.1 cE | 8.5 ± 0.5 cF | 12.8 ± 0.5 bF | 70.2 ± 0.6 bD | 58.0 ± 0.6 dD | 90 mM NaCl | 0 ± 0.0 bE | 0 ± 0.0 bE | 5.1 ± 0.2 cD | 3.3 ± 0.1 dD | 41.7 ± 0.6 bD | 21.0 ± 0.4 dD |
| 20% PEG | 0 ± 0.0 dE | 2.3 ±0.2 cE | 5.0 ± 0 cG | 12.4 ± 0.4 bF | 54.3 ± 0.7 bcF | 54.1 ± 0.3 abF | 160 mM NaCl | 0 ± 0.0 bE | 0 ± 0.0 bE | 0 ± 0.0 cF | 0 ± 0.0 cF | 0 ± 0.0 cF | 0 ± 0.0 cG |
| 30% PEG | 0 ± 0.0 cE | 0 ± 0.0 cF | 2.7 ± 0.1 dH | 8.2 ± 0.3 cG | 38.0 ± 0.6 aG | 21.3 ± 0.7 cH | 230 mM NaCl | 0 ± 0.0 aE | 0 ± 0.0 aE | 0 ± 0.0 bF | 0 ± 0.0 bF | 0 ± 0.0 bF | 0 ± 0.0 cG |
| P | 5.8 ± 0.1 cA | 7.0 ± 0.1 aA | 30.8 ± 0.2 aA | 24.4 ± 0.2 bA | 91.7 ± 0.6 aA | 81.0 ± 0.2 cA | P | 6.2 ± 0.1 bA | 7.2 ± 0.1 aA | 31.0 ± 0.2 aA | 24.4 ± 0.2 bA | 91.1 ± 0.4 aA | 81.2 ± 0.2 cA |
| P-15% PEG | 5.8 ± 0.2 aA | 6.0 ± 0.1 aBC | 24.2 ± 0.1 aB | 23.2 ± 0.1 aB | 80.8 ± 0.7 aC | 63.0 ± 0.3 cC | P-90 mM NaCl | 3.0 ± 0.0 aC | 3.1 ± 0.1 aC | 14.7 ± 0.2 aB | 13.1 ± 0.2 bC | 52.3 ± 0.6 aC | 34.9 ± 0.3 cC |
| P-20% PEG | 3.8 ± 0.2 Bc | 5.3 ± 0.2 aD | 18.9 ± 0.3 aC | 19.4 ± 0.3 aC | 56.3 ± 0.8 aE | 56.1 ± 0.7 abE | P-160 mM NaCl | 1.0 ± 0.0 aD | 1.0 ± 0.0 aD | 3.6 ± 0.2 aE | 3.0 ± 0.0 bD | 18.6 ± 0.5 aE | 15.3 ± 0.3 bE |
| P-30% PEG | 3.0 ± 0.3 bD | 5.6 ± 0.2 aCD | 11.4 ± 0.3 cE | 15.1 ± 0.2 bE | 39.8 ± 0.6 aG | 35.1 ± 0.4 bG | P-230 mM NaCl | 0 ± 0.0 aE | 0 ± 0.0 aE | 0 ± 0.0 bF | 1.0 ± 0.0 aE | 0 ± 0.0 bF | 1.0 ± 0.0 aF |
Table 5.
Root length (mm) of two wheat genotypes after 5 days of growth under control (C), drought treatments (15%, 20% and 30% PEG), salt treatments (90, 160 and 230 mM NaCl), high voltage electrical discharge (HVED) pretreatment (P) and combined (P-15% PEG, P-20% PEG, P-30% PEG, P-90 mM NaCl, P-160 mM NaCl and P-230 mM NaCl) treatments. Values are means of three repetitions (10 plants/repetition) ± S.D. The different capital letters indicate significances among means of different treatments within the same genotype, while lowercase letters indicate significances among means between genotypes under the same treatment at p < 0.05 using LSD post-hoc test.
| Drought | Salt Treatment |
|---|
| | Bernarda | Tena | | Bernarda | Tena |
|---|
| C | 100.64 ± 0.9 aB | 99.50 ± 0.5 bA | C | 100.73 ± 1.0 bB | 100.60 ± 1.5 bA |
| 15% PEG | 77.60 ± 0.7 cD | 77.50 ± 0.9 cD | 90 mM NaCl | 46.00 ± 0.6 cD | 35.40 ± 0.8 dC |
| 20% PEG | 67.36 ± 1.1 bE | 66.10 ± 0.9 bD | 160 mM NaCl | 0.00 ± 0.0 cF | 0.00 ± 0.0 cF |
| 30% PEG | 46.75 ± 0.7 cG | 58.50 ± 0.9 aF | 230 mM NaCl | 0.00 ± 0.0 bF | 0.00 ± 0.0 bF |
| P | 110.10 ± 0.7 aA | 99.50 ± 0.8 bA | P | 109.30 ± 1.2 aA | 100.90 ± 1.3 bA |
| P-15% PEG | 99.20 ± 0.8 aBC | 80.60 ± 0.6 bB | P-90 mM NaCl | 63.20 ± 0.8 aC | 49.70 ± 0.7 bB |
| P-20% PEG | 97.40 ± 0.5 aC | 60.90 ± 0.7 cE | P-160 mM NaCl | 30.00 ± 0.8 aE | 28.10 ± 0.9 bD |
| P-30% PEG | 59.90 ± 0.5 aF | 54.10 ± 0.7 bG | P-230 mM NaCl | 0.00 ± 0.0 bF | 3.30 ± 0.1 aE |
Table 6.
Shoot (SL_DTI) and root (RL_DTI) length drought tolerance index of two wheat genotypes after 5 days of growth under drought treatments (15%, 20% and 30% PEG), combined (P-15% PEG, P-20% PEG and P-30% PEG) treatments, and high voltage electrical discharge (HVED) pre-treatment (P). Values are means of three repetitions (10 plants/repetition) ± S.D. The different capital letters indicate significances among means of different treatments within the same genotype, while lowercase letters indicate significances among means between genotypes under the same treatment at p < 0.05 using LSD post-hoc test.
| SL_DTI | RL_DTI |
|---|
| | Bernarda | Tena | | Bernarda | Tena |
|---|
| 15% PEG | 83.57 ± 0.6 bB | 76.62 ± 0.8 cA | 15% PEG | 77.56 + 0.9 cB | 77.91 ± 1.1 cB |
| 20% PEG | 64.66 ± 0.9 bC | 71.48 ± 0.5 aB | 20% PEG | 67.77 + 1.1 bC | 66.45 ± 0.9 bC |
| 30% PEG | 45.27 ± 0.9 aE | 28.13 ± 0.9 bE | 30% PEG | 45.96 + 0.3 cE | 58.80 ± 0.9 aD |
| P-15% PEG | 88.15 ± 0.9 aA | 77.78 ± 0.5 cA | P-15% PEG | 90.10 + 0.6 aA | 81.06 ± 0.9 bA |
| P-20% PEG | 61.44 ± 1.1 cD | 69.25 ± 0.8 aC | P-20% PEG | 88.51 + 0.8 aA | 61.22 ± 0.6 cD |
| P-30% PEG | 43.42 ± 0.8 aF | 43.33 ± 0.6 aD | P-30% PEG | 54.43 + 0.7 bD | 54.40 ± 0.8 bE |
Table 7.
Spearman’s correlation coefficients (r-values) among germination (G), shoot (S) and root (R) length, shoot length drought tolerance index (SL_DT), root length drought tolerance index (RL_DT) under drought treatments and high voltage electrical discharge (HVED) pretreatment (*, **, ***, significant at the 0.05, 0.01 and 0.001 levels). Numbers next to capital letters represent the treatment day.
| Treatment | HVED | G1 | G2 | G3 | G4 | S2 | S3 | S5 | R | SL_DTI5 | SL_DTI5 |
|---|
| Treatment | 1.000 | | | | | | | | | | |
| HVED | 0.000 ns | 1.000 | | | | | | | | | |
| G1 | −0.362 * | 0.809 *** | 1.000 | | | | | | | | |
| G2 | −0.590 *** | 0.522 ** | 0.656 *** | 1.000 | | | | | | | |
| G3 | −0.502 ** | 0.233 ns | 0.430 ** | 0.794 *** | 1.000 | | | | | | |
| G4 | −0.557 *** | 0.188 ns | 0.445 ** | 0.806 *** | 0.987 *** | 1.000 | | | | | |
| S2 | −0.430 ** | 0.731 *** | 0.795 *** | 0.805 *** | 0.520 ** | 0.547 *** | 1.000 | | | | |
| S3 | −0.462 ** | 0.784 *** | 0.807 *** | 0.867 *** | 0.613 *** | 0.581 *** | 0.807 *** | 1.000 | | | |
| S5 | −0.906 *** | 0.194 ns | 0.506 ** | 0.537 ** | 0.289 ns | 0.345 * | 0.521 ** | 0.515 ** | 1.000 | | |
| R | −0.748 *** | 0.296 ns | 0.592 *** | 0.591 *** | 0.500 ** | 0.506 ** | 0.384 ns | 0.601 *** | 0.764 *** | 1.000 | |
| SL_DTI5 | −0.953 *** | 0.081 ns | 0.400 * | 0.565 *** | 0.354 * | 0.414 * | 0.501 ** | 0.479 ** | 0.975 *** | 0.695 *** | 1.000 |
| SL_DTI5 | −0.831 *** | 0.216 ns | 0.553 *** | 0.623 *** | 0.582 *** | 0.596 *** | 0.396 * | 0.591 *** | 0.783 *** | 0.976 *** | 0.748 *** |
| | | ![Plants 10 02137 i001]() | |
| | | −1 | | | 0 | | | 1 | | | |
Table 8.
Salt tolerance shoot index (STI_S) and salt tolerance root index (STI_R) of two wheat genotypes at 2, 3 and 5 days of growth under salt treatments (90, 160 and 230 mM NaCl), combined (P-90 mM NaCl, P-160 mM NaCl and P-230 mM NaCl) treatments, and high voltage electrical discharge (HVED) pretreatment (P). Values are means of three repetitions (100 seeds/repetition) ± S.D. The different capital letters indicate significances among means of different treatments within the same genotype, while lowercase letters indicate significances among means and between genotypes under the same treatment at p < 0.05 using LSD post hoc-test.
| Treatment | STI_S | STI_R |
|---|
| | 2d | 3d | 5d | | Bernarda | Tena |
|---|
| | Bernarda | Tena | Bernarda | Tena | Bernarda | Tena | |
|---|
| 90 mM NaCl | 0.00 + 0.0 bC | 0.00 + 0.0 bC | 0.39 + 0.0 cB | 0.19 + 0.0 dB | 0.50 + 0.0 bB | 0.28 + 0.0 dB | 90 mM NaCl | 0.46 + 0.0 bB | 0.36 + 0.0 dB |
| 160 mM NaCl | 0.00 + 0.0 bC | 0.00 + 0.0 bC | 0.00 + 0.0 cD | 0.00 + 0.0 cE | 0.00 + 0.0 cD | 0.00 + 0.0 cE | 160 mM NaCl | 0.00 + 0.0 bD | 0.00 + 0.0 bE |
| 230 mM NaCl | 0.00 + 0.0 aC | 0.00 + 0.0 aC | 0.00 + 0.0 bD | 0.00 + 0.0 bE | 0.00 + 0.0 bD | 0.00 + 0.0 bE | 230 mM NaCl | 0.00 + 0.0 bD | 0.00 + 0.0 bE |
| P-90 mM NaCl | 0.42 + 0.0 aA | 0.43 + 0.0 aA | 0.63 + 0.0 aA | 0.54 + 0.0 bA | 0.57 + 0.0 aA | 0.43 + 0.0 cA | P-90 mM NaCl | 0.57 + 0.0 aA | 0.49 + 0.0 cA |
| P-160 mM NaCl | 0.14 + 0.0 aB | 0.14 + 0.0 aB | 0.16 + 0.0 aC | 0.12 + 0.0 bC | 0.20 + 0.0 aC | 0.19 + 0.0 bC | P-160 mM NaCl | 0.27 + 0.0 aC | 0.28 + 0.0 aC |
| P-230 mM NaCl | 0.00 + 0.0 aC | 0.00 + 0.0 aC | 0.00 + 0.0 bD | 0.04 + 0.0 aD | 0.00 + 0.0 bD | 0.01 + 0.0 aD | P-230 mM NaCl | 0.00 + 0.0 bD | 0.03 + 0.0 aD |
Table 9.
Spearman’s correlation coefficients (r-values) among germination (G), shoot (S) and root (R) lengths, salt tolerance germination index (STI_G), and salt tolerance shoot (STI_S) and root (STI_R) indices under salt stress and high electrical discharge (HVED) pretreatment (*, **, ***, significant at 0.05, 0.01 and 0.001 level). Numbers next to capital letters represent the treatment day.
| | Treatment | HVED | S2 | S3 | S5 | R | G1 | G2 | G3 | G4 | GI | STI_S5 | STI_R5 | STI_G1 | STI_G2 | STI_G3 | STI_G4 |
|---|
| Treatment | 1 | | | | | | | | | | | | | | | | |
| HVED | 0.000 | 1 | | | | | | | | | | | | | | | |
| S2 | −0.550 *** | 0.591 *** | 1 | | | | | | | | | | | | | | |
| S3 | −0.728 *** | 0.463 ** | 0.931 *** | 1 | | | | | | | | | | | | | |
| S5 | −0.853 *** | 0.285 | 0.713 *** | 0.882 *** | 1 | | | | | | | | | | | | |
| R | −0.866 *** | 0.325 | 0.714 *** | 0.869 *** | 0.977 *** | 1 | | | | | | | | | | | |
| G1 | −0.229 ns | 0.420 * | 0.427 ** | 0.372 * | 0.378 * | 0.397 ns | 1 | | | | | | | | | | |
| G2 | −0.612 *** | 0.609 *** | 0.972 *** | 0.960 *** | 0.807 *** | 0.806 *** | 0.444 ** | 1 | | | | | | | | | |
| G3 | −0.702 *** | 0.634 *** | 0.849 *** | 0.884 *** | 0.837 *** | 0.885 *** | 0.445 ** | 0.912 *** | 1 | | | | | | | | |
| G4 | −0.759 *** | 0.567 *** | 0.772 *** | 0.863 *** | 0.895 *** | 0.929 *** | 0.425 ** | 0.861 *** | 0.969 *** | 1 | | | | | | | |
| GI | −0.669 *** | 0.635 *** | 0.935 *** | 0.946 *** | 0.846 *** | 0.866 *** | 0.502 ** | 0.982 *** | 0.970 *** | 0.932 *** | 1 | | | | | | |
| STI_S5 | −0.871 *** | 0.261 ns | 0.696 *** | 0.873 *** | 0.997 *** | 0.981 *** | 0.357 * | 0.787 *** | 0.832 *** | 0.896 *** | 0.832 *** | 1 | | | | | |
| STI_R5 | −0.879 *** | 0.303 ns | 0.697 *** | 0.858 *** | 0.971 *** | 0.996 *** | 0.367* | 0.783 *** | 0.875 *** | 0.926 *** | 0.847 *** | 0.979 *** | 1 | | | | |
| STI_G1 | 0.000 | 0.288 ns | 0.075 ns | 0.035 ns | 0.007 ns | 0.071 ns | 0.750 *** | 0.049 ns | 0.152 ns | 0.173 ns | 0.140 ns | 0.015 ns | 0.076 ns | 1 | | | |
| STI_G2 | −0.466 ** | 0.305 ns | 0.598 ** | 0.599 *** | 0.442 ** | 0.482 ** | 0.045 ns | 0.548 *** | 0.519 ** | 0.566 *** | 0.542 *** | 0.478 ** | 0.514 ** | 0.187 ns | 1 | | |
| STI_G3 | −0.518 ** | 0.208 ns | 0.390 * | 0.460 ** | 0.401 * | 0.483 ** | 0.101 ns | 0.364 * | 0.501 ** | 0.571 *** | 0.434 ** | 0.454 ** | 0.528 *** | 0.318 ns | 0.884 *** | 1 | |
| STI_G4 | −0.538 *** | 0.133 ns | 0.289 ns | 0.409 * | 0.440 ** | 0.500 ** | 0.082 ns | 0.295 ns | 0.440 ** | 0.566 *** | 0.373 * | 0.492 ** | 0.547 *** | 0.307 ns | 0.845 *** | 0.970 *** | 1 |
| | | | | ![Plants 10 02137 i002]() | | | | | | |


