1. Introduction
Waterlogging is a severe abiotic stress occurring when the soil profile surrounding a plant’s root system becomes oversaturated with excess water. Waterlogging is part of the broader stress of flooding, which encompasses both situations where the soil profile is oversaturated and when visual ponding occurs above the soil surface [
1]. Waterlogging can occur anytime soil moisture levels rise above the field capacity. Water inputs exceed a soil’s ability to move water off the soil surface and drain internally. Excessive moisture levels result in the aerated pore space filling with water. A water-filled pore space leads to soil oxygen levels rapidly depleting as the transfer of oxygen and other gasses is blocked between the soil and the atmosphere. Oxygen diffuses 10,000 times more slowly in water than in air [
2,
3].
Excess moisture can come from extreme rainfall events, over-irrigation, and rainfall occurring soon after irrigation, among other factors [
4]. Poor soil structure caused by natural or human influences may also restrict the internal drainage within the soil and further worsen waterlogging [
5]. As the soil remains waterlogged, the soil redox potential declines [
6], and the accumulation of reduced substances can reach phytotoxic levels [
7]. Additionally, soil pH has been reported to increase due to protons’ consumption by reducing Fe and Mn oxides [
6]. However, Drew et al. [
8] suggest that the shortage of the oxygen available to plant roots is still the main factor restricting plant productivity.
Globally, waterlogging restricts an estimated 10–12% of all agricultural lands annually [
9], and flooding affects over 17 million km
2 of land surface [
10]. Waterlogging ranked second to drought in the United States in terms of abiotic stress’ contribution to crop production losses from 2000 to 2017 [
1,
11]. Early research suggests that 15.7% of US agricultural soils are impaired by wet conditions, and 16.4% of crop insurance payments from 1939 to 1978 resulted from excessive water [
12]. Despite waterlogging appearing as a significant limiting factor to agriculture throughout history, the harmful impacts on production have worsened following increases in the frequency of extreme precipitation events over the past 50 years [
1]. These extreme precipitation events include a general upward trend of total precipitation correlated with an increased frequency of heavy and extreme precipitation events [
13]. Global climate models consistently forecast these trends into the future [
14]. Specifically in the Lower Mississippi River Alluvial Valley (LMRAV), increasing trends in annual precipitation and mean wet days are occurring [
15]. For example, an increase in spring precipitation was reported in the northern LMRAV; conversely, precipitation in the southern LMRAV is increasing more in the fall, often related to hurricane formation [
15]. As target-planting dates for corn are pushed earlier into the spring, corn will be increasingly vulnerable to extreme moisture levels during early vegetative growth stages.
Previous research outlines waterlogging as a significant yield-limiting factor for corn production. Singh et al. [
16] indicated that yields in low-lying topographic areas were significantly lower in years when waterlogging occurred. Waterlogging for 10 days has been reported to significantly reduce yields, dry matter accumulation, and canopy height [
17]. Field studies have suggested a 4.69% decline in yield for each day of waterlogging up to seven days, compared to the non-flooded control [
3]. Research has also established that corn is more vulnerable at early growth stages; Ren et al. [
18] report a more significant yield loss occurring from six days of waterlogging occurring at V3 than V6 and VT.
Although the research indicates the damaging effects of waterlogging on corn yield, no systematic evaluation of the impact of various waterlogging durations on corn morphology has been conducted to our knowledge. A systematic study will help unravel the relationships between the duration of waterlogging stress, soil oxygen levels, and corn morphological growth and development. In addition, field studies examining the impact of waterlogging on corn production can be influenced by confounding factors such as nitrogen availability post waterlogging. The same rainfall events that cause waterlogging can disrupt nitrogen availability through runoff and leaching. The low oxygen environment arising under waterlogging conditions also creates a favorable environment for further nitrogen loss through denitrification. For example, Kaur et al. [
3] concluded that additional rescue N applications at V10 helped reduce some yield reduction compared to non-treated controls when plants were waterlogged for seven days at the V6 growth stage. Therefore, identifying and isolating the impact of waterlogging on corn morphological dynamics would be best conducted under conditions in which plant nutrients are freely available and non-limiting for plant uptake.
The objectives of this study were to: (1) quantify the effects of increasing durations of waterlogging from 0 to 14 days occurring at an early vegetative growth stage on shoot and root morphology, (2) determine relationship trends between waterlogging duration, soil O2, and growth and development parameters, and (3) compare the magnitude of the impact of waterlogging stress among all measured growth and development parameters.
2. Materials and Methods
2.1. Experimental Facilities
Two experiments (Experiment 1, Exp. 1; Experiment 2, Exp. 2) were conducted outdoors in pots during the 2017 and 2018 growing seasons at the Environmental Plant Physiology Laboratory at the Mississippi Agricultural and Forestry Experiment Station, Mississippi State University, MS, USA (33°28′ N, 88°47′ W). The pot-culture facility includes 30.5 × 15.2 cm polyvinylchloride (PVC) pots constructed with a small drain hole at the bottom. The pots were arranged in a twin-row configuration with extra border pots on both ends. A drip irrigation system combined with a customized nutrient solution provided a precise control over soil moisture and nutrition. Rain shelters were constructed as mini hoop-houses and placed over the pots during the experimental period to ensure outside precipitation did not affect the experiment. These rain shelters were constructed with clear plastic not to inhibit photosynthetically active radiation. In addition, they were well ventilated to prevent extreme temperature elevation. The environmental conditions, including temperature, CO
2 level, and solar radiation, under which each experiment was conducted are provided in
Table 1.
2.2. Experimental Set-Up
Six polyvinyl (PVC) pots (15.24 cm diameter, 30.48 cm height, and 5.5 L volume) per treatment were initially filled with one inch of clean pea gravel, 500 g gravel to aid drainage. The pots were then filled with growth media consisting of a 3:1 ratio of fine sand (particle size less than 0.3 mm) and ground topsoil. The soil medium is sandy loam with 87% sand, 2% clay, and 11% silt. Four seeds were initially sown in each pot. Upon emergence, the plants were thinned to one plant per pot. Each pot was irrigated with a full-strength Hoagland’s complete nutrient solution [
19] thrice per day for 90 s throughout the experiment to ensure that the pots were maintained at field capacity. This solution ensures that all necessary nutrients are readily available for plant uptake. Similar pot culture facilities and methods have been used to study soybean and moisture stress [
20], rice and moisture stress [
21], rice and salinity stress [
22], cowpea and drought stress [
23], and sorghum and nitrogen stress [
24].
2.3. Plant Materials
Two corn hybrids were tested during this study. Pioneer P2089VYHR (Corteva, Inc., Wilmington, DE, USA) was grown in the first experiment, and Agrigold A6659 (Agrigold Inc., St. Francisville, IL, USA) was grown in the second.
2.4. Waterlogging Treatments
Soil moisture was maintained at optimal field capacity until the plants reached the second leaf (V2) growth stage. Waterlogging treatments were imposed by plugging the drain hole at the bottom of each pot with a small wooden peg. The treated pots were filled to the soil surface with the Hoagland’s nutrient solution. Water levels were continuously monitored twice each day to ensure that the treatments were continuously maintained for the appropriate assigned duration. Apogee SO-110 soil oxygen sensors (Apogee Instruments, Inc., Logan, UT, USA) were placed into three randomly selected pots per treatment to continuously monitor the soil oxygen level and temperature throughout the experimental period. Once the duration of treatment had passed, the wooden drain plug in the respective experimental unit was removed, and the pot was fully drained. Soil moisture was then maintained at field capacity for the duration of the experiment. The treatments included a 0 days treatment, which we considered the control treatment, displaying the plant’s potential under non-waterlogged conditions, and 2, 4, 6, 8, 10, 12, and 14 days of waterlogging.
2.5. Measurements
The measurements detailed below were collected at the final harvest, 15 days after the treatments were initially imposed (DAT) and 23 days after the seeds were sown (DAS).
2.5.1. Pigment Estimation
The leaf chlorophyll content (CHL, μg/cm2), flavonoids (FLAV, unitless), anthocyanins (ANTH, unitless), and nitrogen balance index (NBI, unitless) were measured on the uppermost leaf with a developed collar using a handheld Dualex® Scientific instrument (Force A DX16641, Paris, France).
2.5.2. Shoot Morphology
Plant height (PH, cm plant−1) was measured by hand with a standard metric ruler as the distance from the soil surface to the highest leaf collar. Leaf number (LN, no. plant−1) was counted as the total number of fully developed leaves with a collar. The plants were then cut at the soil surface; all leaf material was separated from the stem and measured for leaf area (LA, cm2 plant−1) using an LI-3100 leaf area meter (LiCor Inc., Lincoln, NE, USA).
2.5.3. Root Morphology
After the above-ground plant parts were removed, root systems and soil media were gently removed from the PVC pots and washed with a gentle stream of water over a wire mesh sieve to remove soil media until the roots were clean. Individual root systems were floated in a 400 × 300 cm acrylic tray filled with 5 mm water. Once placed on the trays, the roots were carefully untangled using plastic forceps to minimize roots’ overlap to ensure quality imagery. An Epson Expression 11000XL scanner captured root morphology images at a 800 dpi resolution (Epson America, Inc., Long Beach, CA, USA). These images were analyzed by WinRHIZO Pro 2009C software (Regent Instruments, Inc., Québec, QC, Canada). The digitized output from the analysis quantified the multiple root growth and development parameters for each plant: root tips (RT, no plant−1), root forks (RF, no plant−1), total root length (TRL, cm plant−1), root surface area (RSA, cm2 plant−1), and root volume (RV, cm3 plant −1)
2.5.4. Biomass Allocation
After the plant components were analyzed to the extent aforementioned, separate plant parts were individually bagged. The samples were oven-dried on-site at 80 °C for three days to ensure a constant weight was reached. These samples were weighed for leaf dry weight (LDW, g plant−1), stem dry weight (StDW, g plant−1), and root dry weight (RDW, g plant−1). The total dry weight (TDW, g plant−1) was calculated as the sum of all three components per plant.
2.6. Waterlogging Stress Response Index
A waterlogging stress response index (WSRI) was calculated for each measured parameter to normalize the impact of flood stress on a comparable scale. This index was derived from the environmental productivity index (EPI) concept initially introduced [
25] to model the impact of multiple environmental stresses on cactus productivity. Reddy et al. [
26] also used the EPI concept to model the effect of multiple environmental stresses on cotton (
Gossypium hirsutum) photosynthesis.
This study modified the EPI concept to model the waterlogging impact on multiple plant growth and development traits. The WSRI concept involves normalizing each parameter’s mean-observed values by dividing the mean values under stress by the value of the respective parameter under the 0 days treatment or control conditions. Thus, the indices’ values range from 1, where waterlogging stress is not limiting the parameter, to 0, where waterlogging is fully limiting. We can use this method to normalize data to compare waterlogging’s impact among parameters measured with different units. The values portray a fractional value of maximal potential performance for each parameter of each hybrid. The index values were derived using Equation (1).
where WSRI
pt is the waterlogging stress response index of parameter
p at treatment
t, p
c is the value of parameter
p at 0 days of waterlogging (control), and p
t is the parameter
p at treatment
t.
2.7. Statistical Analysis
In both experiments, a completely randomized design (CRD) was utilized. The treatments were assigned to experimental units (pots) completely randomly in both experiments. In addition, this study included the use of two different hybrids, with each utilized in a separate experiment. Thus, the analysis was conducted as two independent experiments, and no direct statistical comparisons were made between the two hybrids. A similar experimental design and analysis were performed by Reddy et al. [
27] to model the effects of UV-B radiation on two separate corn genotypes.
The analysis of variance testing was completed using the PROC GLM procedure in SAS 9.2 to determine the significance of treatment effects. Treatment means were separated using Fisher’s LSD at an alpha level of 0.05 (SAS Institute, Cary, NC, USA). Graphing and graphical functions were created using SigmaPlot 13 (Systat Software, Inc., San Jose, CA, USA).
3. Results and Discussion
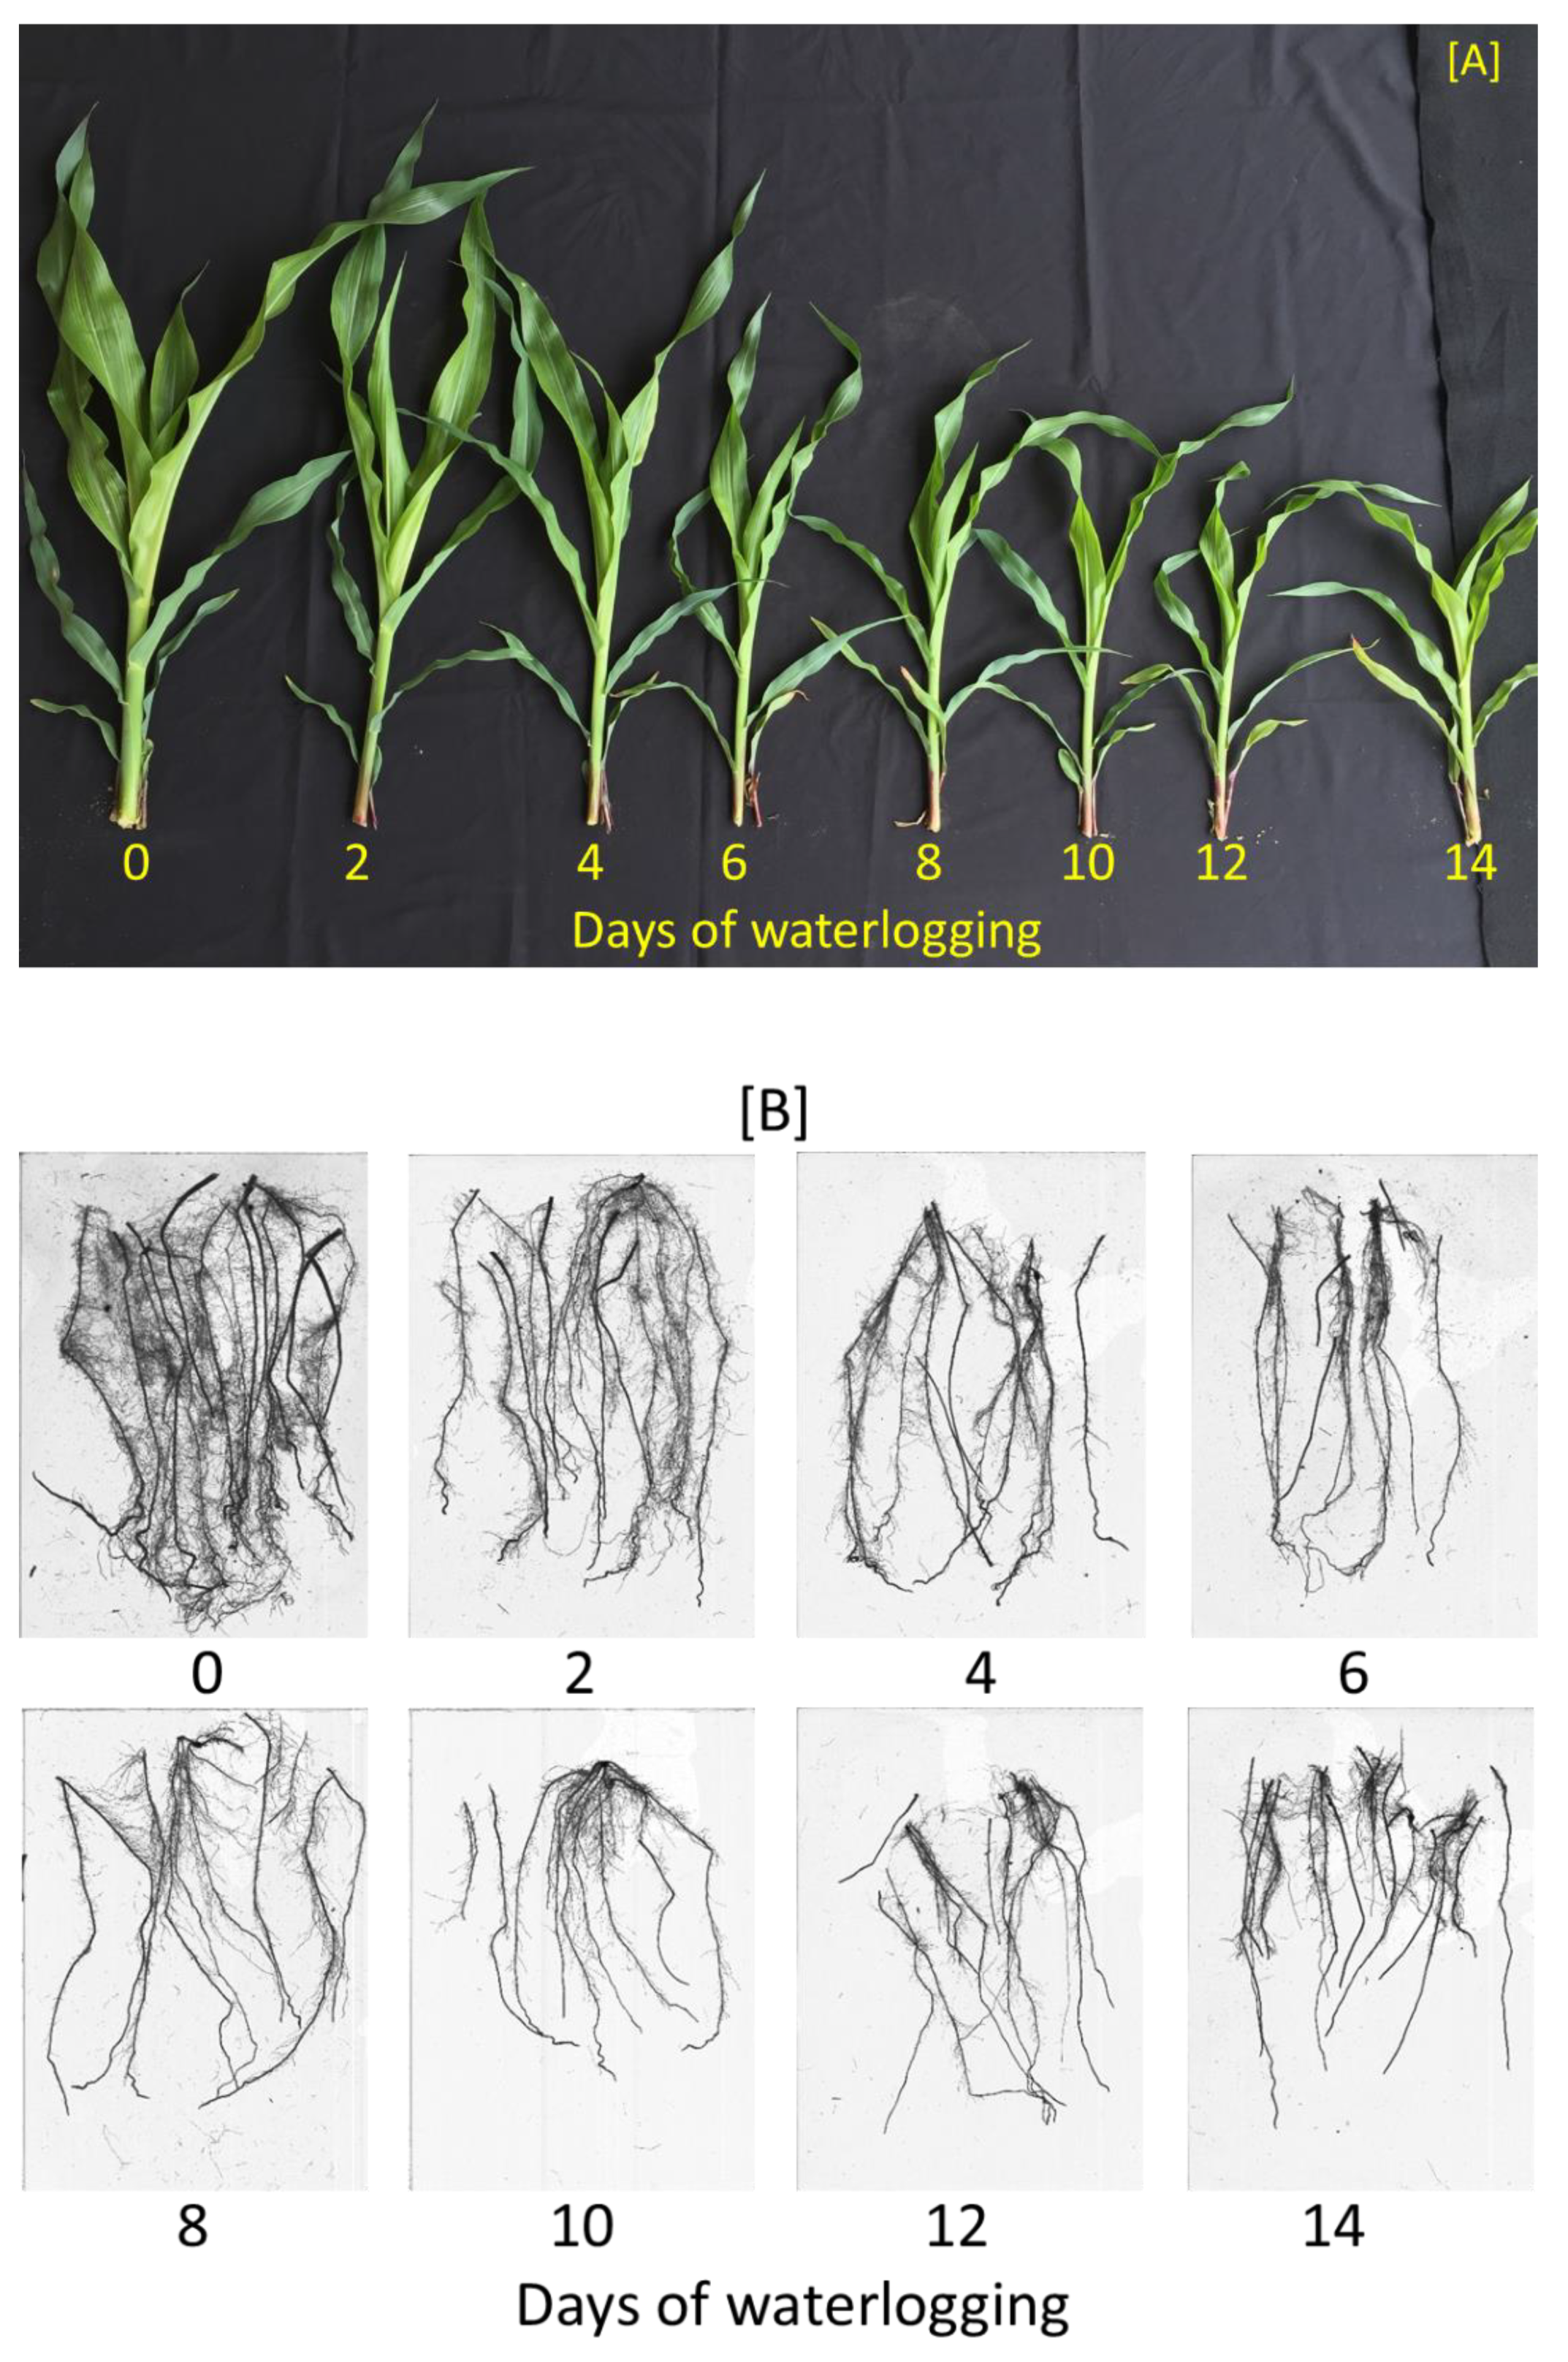
In both experiments, soil waterlogging treatments significantly affected all plant growth, development, and physiology parameters except for the root: shoot ratio and flavonoids index (
Table 2). Visually, as the waterlogging duration increased, the plants were stunted with smaller and fewer leaves (
Figure 1A). In addition, below the soil surface, increasing the waterlogging durations caused the root systems to appear thinner and shallower (
Figure 1B).
3.1. Environmental Conditions and Soil Oxygen
During the experimental period of both experiments, the treatments significantly decreased the soil oxygen fraction (
Figure 2). Pots subjected to the 0 days treatment, which we considered the control, maintained a steady soil O
2 fraction throughout the experimental period. The average soil O
2 fraction for the 0 days treatment was 19.6 for Experiment 1 (Exp. 1) and 18.54 for Experiment 2 (Exp. 2). As treatments were terminated at the end of each treatment period, the pots rapidly drained, and the soil O
2 fraction quickly recovered. Oxygen approached the equivalent level of the 0 days treatment within 2 days of respective treatment termination. Overall, the soil O
2 fraction was lower for the 0 days treatment for Exp. 2 and declined faster as the treatment duration was prolonged. The discrepancy of the soil O
2 fraction and the decline rate between the two experiments may be due to the observed differences in air temperature, soil temperature, and solar radiation during the two experimental periods (
Table 1). Specifically, air temperature and soil temperature were warmer, and daily solar radiation was higher during Exp. 2.
Further, the warmer environmental conditions may explain the higher growth potential observed under the 0 days treatment in Exp. 2. However, due to the experimental design of this study, the effects of different hybrids cannot be statistically separated from the impact of environmental conditions and their interaction. Therefore, each experiment was independently analyzed, and no direct comparisons between the hybrids were made.
3.2. Root Morphology
Root systems are directly impacted when waterlogging occurs, as they are the first to suffer from oxygen deprivation [
28,
29]. As soil oxygen levels begin to deplete, plants can signal the decline and slow their metabolism as a rescue mechanism to reduce the plant’s demand for oxygen [
2]. When oxygen levels further decline and become more hypoxic, the respiration in the root system begins to switch from aerobic to anaerobic fermentation in an attempt to maintain an energy supply as oxygen supplies diminish [
7]. Unfortunately, anaerobic fermentation produces less energy than aerobic respiration, and toxic byproducts accumulate within plant cells. These toxins become harmful, as they contribute to the injury and death of root cells and root decay [
7,
8].
3.2.1. Root Growth
Total root length (TRL), root surface area (RSA), and root volume (RV) represent the vastness of soil the root system can reach and the total surface in which water and nutrient uptake can occur [
30]. A plant’s productivity is directly related to its root system’s ability to explore the soil and forage for moisture and nutrients (root length) and its morphological capacity to uptake the available water and nutrients (root surface area).
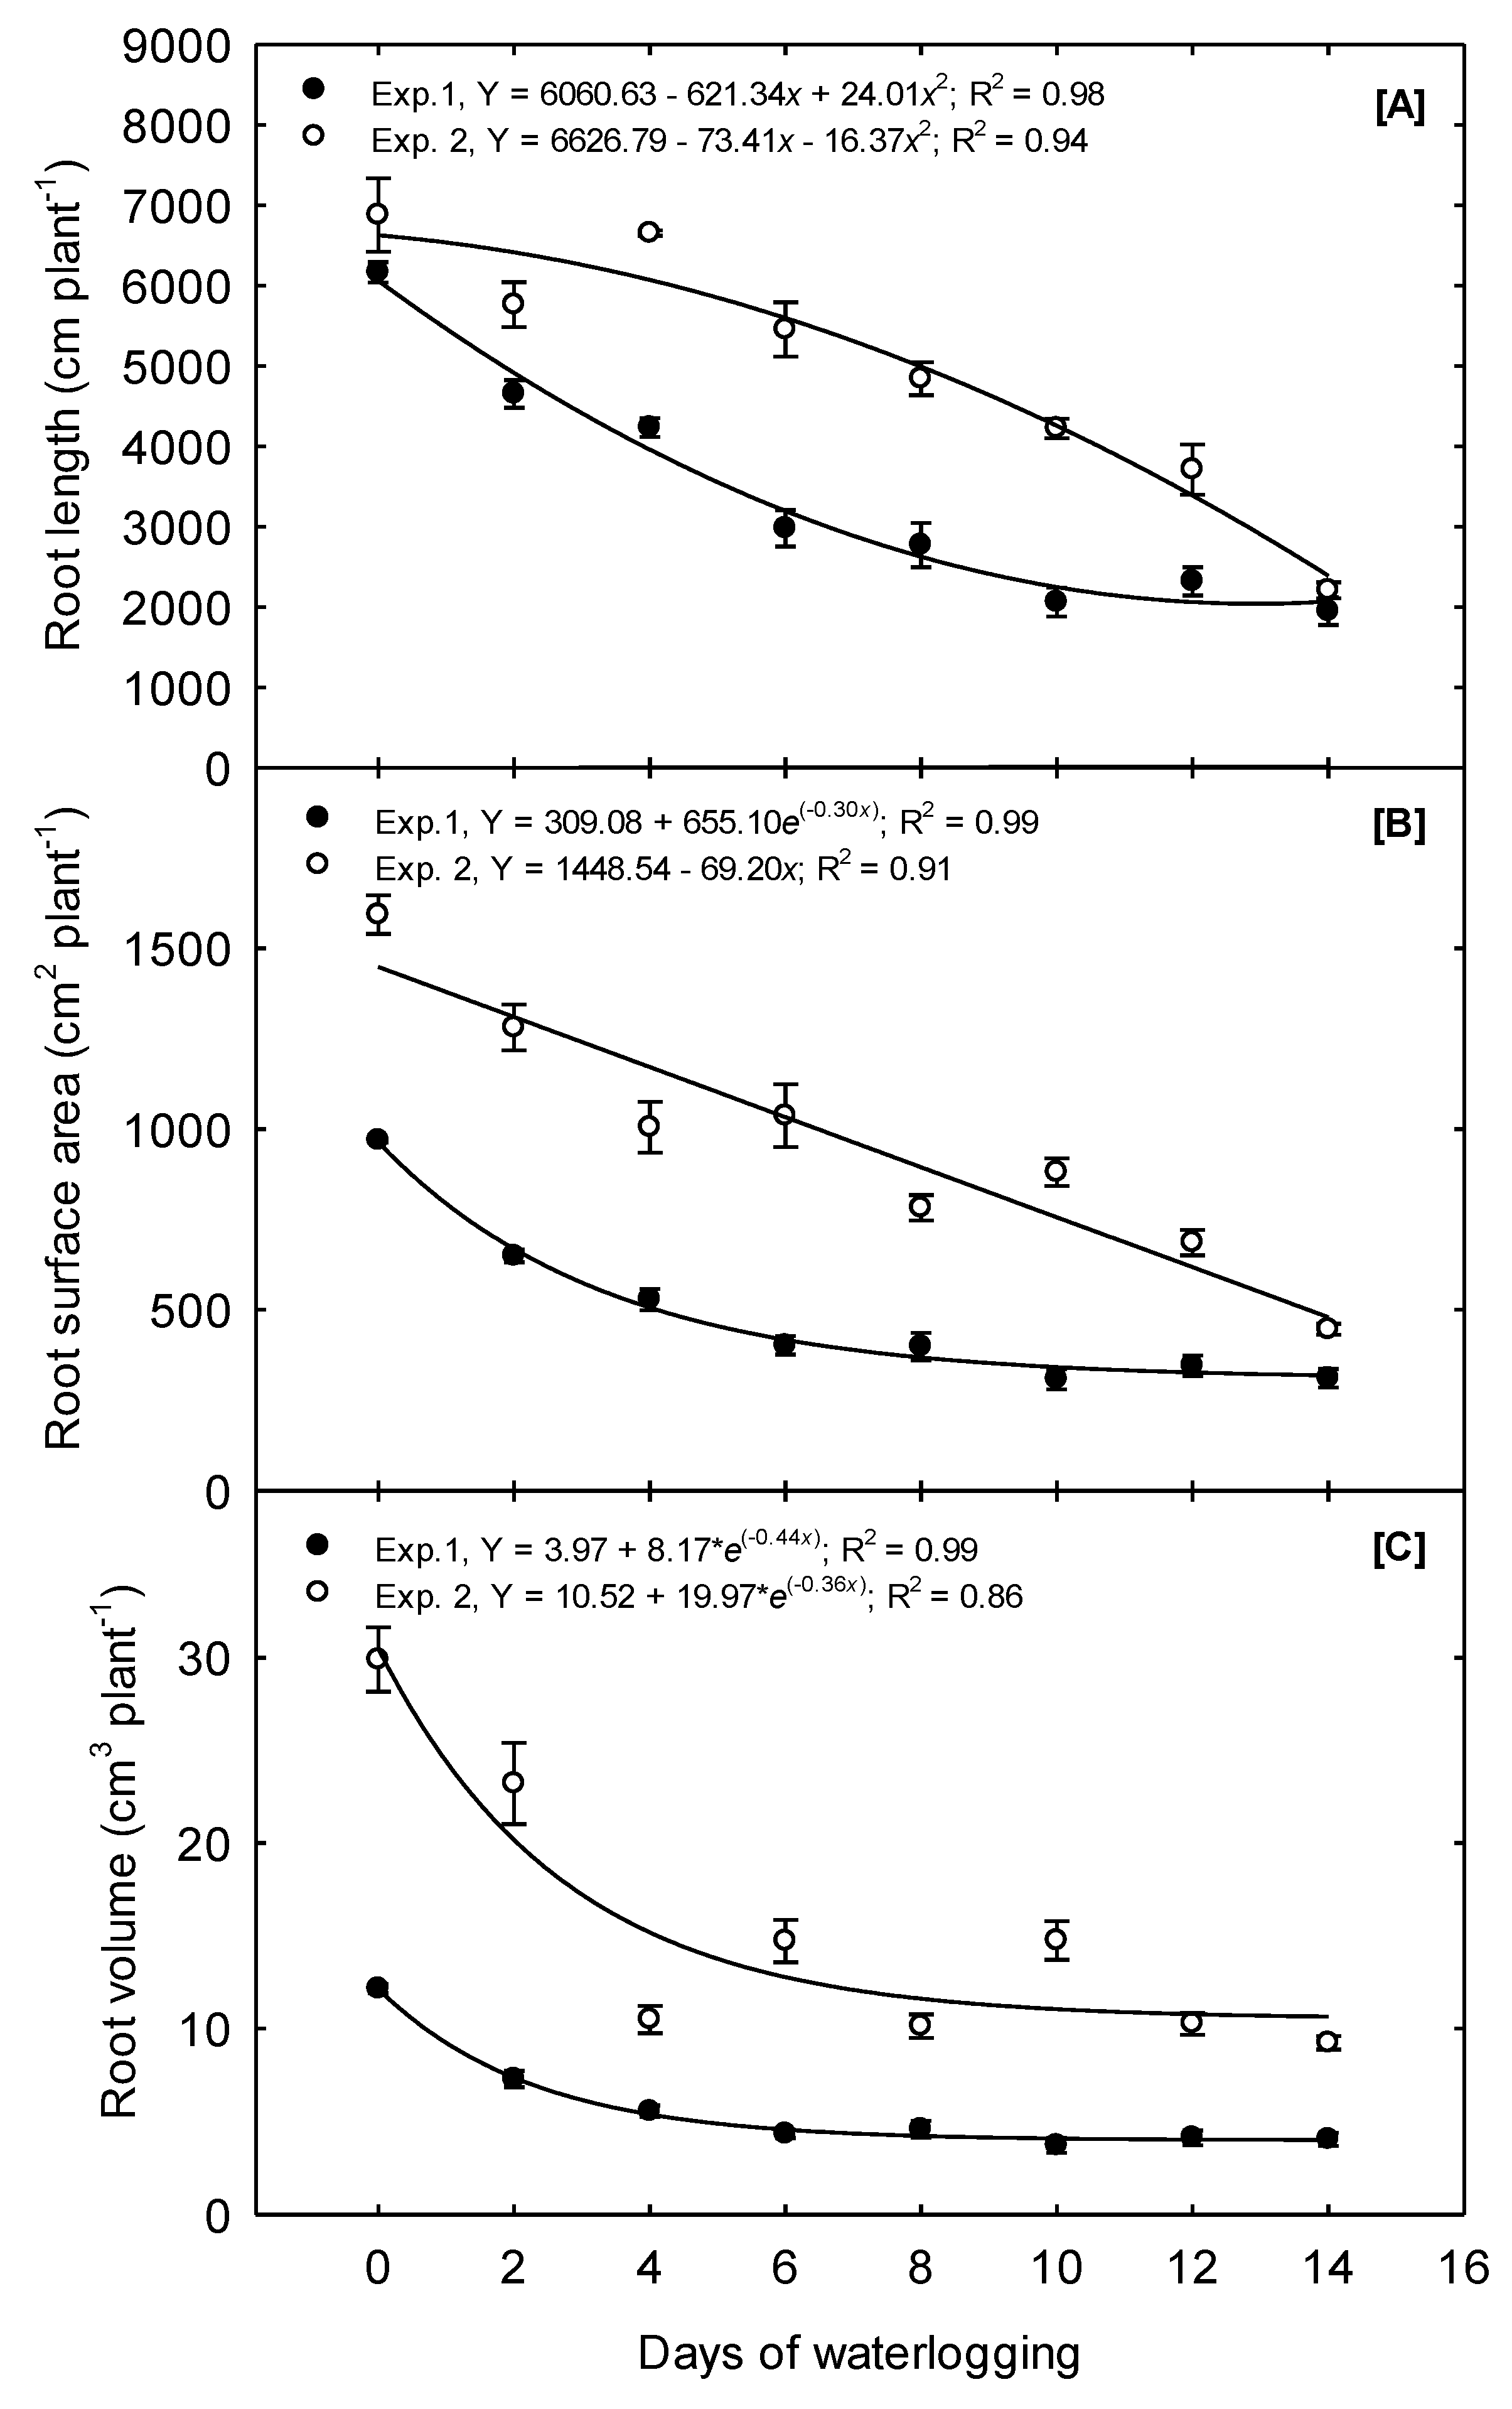
In Exp. 1, just two days of waterlogging resulted in a 24.5% reduction in the total root length (
Figure 3A). Overall, the total root length quadratically declined as waterlogging treatments increased from 0 to 14 days. The steepest decline occurred as waterlogging increased from 0 to 8 days, and no differences in TRL occurred between the 10, 12, and 14 days treatments (
Table 2). The response of TRL to waterlogging treatments differed in Exp. 2; a convex quadratic function best described the relationship to waterlogging duration, with the most significant decline in TRL occurring as the treatments increased from 6 to 14 days.
The RSA per plant decreased quadratically in Exp. 1 as treatments were prolonged from 0 to 6 days (
Figure 3B). The final root surface area was reduced by 33%, 58.5%, and 67.9% because of 2, 6, and 14 days of waterlogging, respectively, compared to the 0 days treatment. No differences occurred due to the 6 to 14 days treatment; thus, linear decay functions best described the overall relationship between RSA and waterlogging duration (
Table 2). In Exp. 2, the root surface area declined linearly as waterlogging time was increased from 0 to 14 days at a rate of 4.4% day
−1. The highest RSA, of 1592, was observed under the 0 days treatment, and the lowest, of 446, was observed under the 14 days treatment, a total decline of 72%.
The RV in Exp. 1 followed trends similar to those observed for RSA. The RV declined from its highest value of 12.15 under the 0 days treatment to 4.32 under the 6 days treatment, a decrease of 64% (
Figure 3C). No differences were observed in the mean RV between the 6 and 14 days treatments (
Table 2); therefore, the exponential decay functions best described the overall relationship. In Exp. 2, RV declined linearly as the treatment increased from 0 to 4 days at a rate of 16.25% day
−1. The mean RV did not significantly differ among the 4 to 14 days treatments. An exponential decay function also best described the overall relationship between RV and waterlogging in Exp. 2.
Our results agree with Ren et al. [
18], who reported a decrease in the corn root absorption area after six days of waterlogging and expand upon their results to suggest that the severity of the decline in the root absorption area depends on the duration of waterlogging.
3.2.2. Root Development
Root tips are critical components for nutrient and water uptake; the uptake occurs more predominantly near the tips due to a higher expression of nutrient transporters and water channels than in other parts of the root structure [
31]. Therefore, root tips are also particularly susceptible to hypoxic conditions. If anaerobic conditions remain too long, cell death in the root tips can occur due to cytoplasmic acidosis caused by the lactic acid synthesis of anaerobic respiration. This can result in permanent damage to the plant. However, if hypoxic conditions gradually precede anoxia, corn root tips have been shown to survive continuous anoxia for up to 4 days [
8].
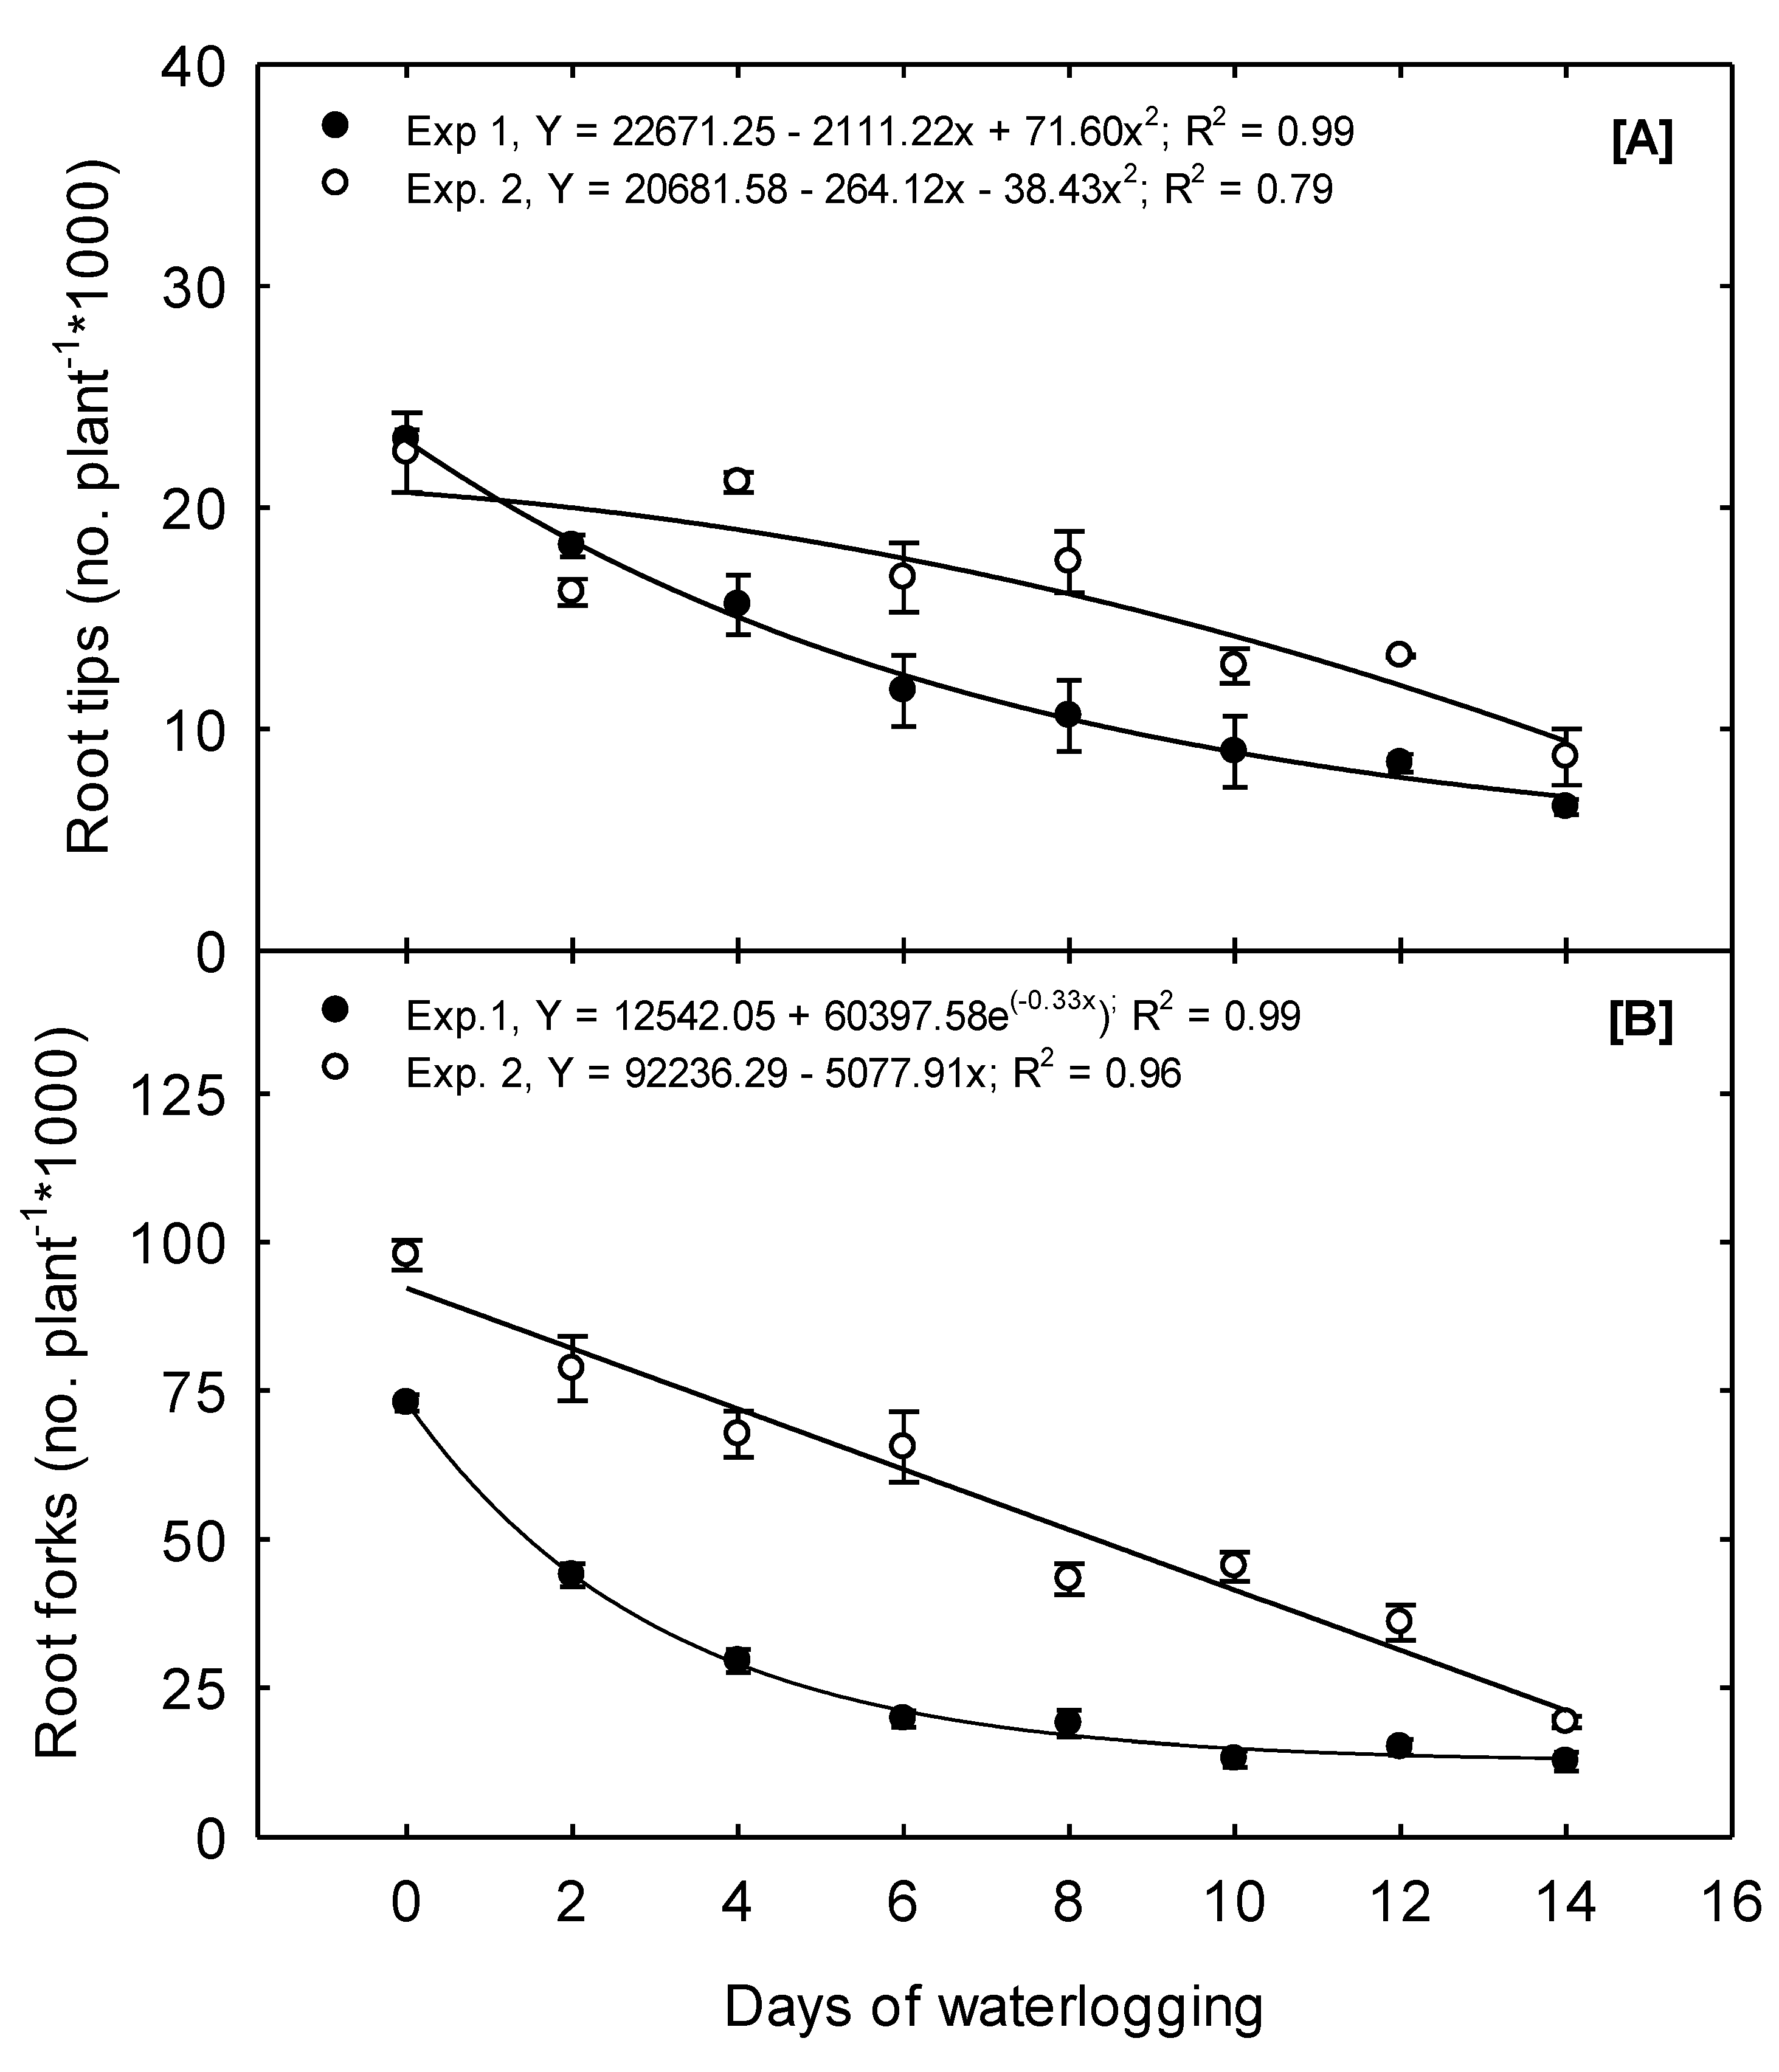
In Exp. 1, 23,073 RT plant
−1 were produced under the 0 days treatment. In contrast, 18,280, 10,604, and 6479 RT plant
−1 were produced because of the 2, 8, and 14 days treatment, a decline of 20.8, 54, and 71.9% compared to the plant’s potential under the 0 days treatment—a concave quadratic trend best exemplified this declining trend (
Figure 4A). In Exp. 2, RT plant
−1 declined convex quadratically from a mean of 22,490 under the 0 days treatment to a mean of 8748 under the 14 days treatment. The impact of waterlogging on corn root tip numbers is not well documented. Still, declining trends like our observations of root tips have been reported in other crops such as wheat due to waterlogging [
32].
Root forks are a good indicator of root branching and the complexity of the plant’s root system architecture. Root branching provides a means to increase the expanse of the soil that is reached and explored; additionally, branching can exponentially increase the number of root tips and the active absorptive surface area compared to root elongation alone [
31]. In Exp. 1, an exponential decay function best described the relationship between waterlogging duration and RF (
Figure 4B). Just two days of waterlogging resulted in a 40% reduction in root forks, but the number of RF under the 10, 12, and 14 days treatments did not differ (
Table 2). Our observations align with previous reports of waterlogging significantly affecting a plant’s root system architecture [
29].
Although plants are immediately hindered as root conductivity and metabolism decline under waterlogging conditions, reduced root growth and development can impact the plant through the entire growing season by restricting the water and nutrient uptake capacity [
29]. In addition, Waterlogging often results in nitrogen (N) loss through excessive soil runoff and denitrification as soils become reduced under low oxygen environments [
10]. Thus, corn plants with a weak root system face exacerbated issues obtaining adequate nitrogen as plants begin recovering post waterlogging and available nutrients are depleted. Such deficiencies could ultimately lead to further yield loss.
3.3. Leaf Pigments
A plant’s chlorophyll and polyphenol content are good indicators of a plant’s leaf N status; thus, these parameters can be used to interpret a plant’s ability to uptake nutrients through its root system. Chlorophyll (CHL) is the primary pigment responsible for leaf greenness, and close relationships have been established between leaf greenness and nitrogen (N) status. However, CHL estimation is not a perfect measure of N status, as leaf greenness can be affected by deficiencies of other nutrients such as sulfur, magnesium, and iron [
33].
In Exp. 1, CHL declined linearly as the duration of waterlogging treatments was prolonged, decreasing from 39.57, observed under the 0 days treatment, to 25.87, under the 14 days treatment; at a rate of 2.85% day
−1, waterlogging treatments were extended (
Figure 5A). In Exp. 2, no significant relationship was found between the increasing duration of waterlogging and CHL; however, CHL was lower under the 12- and 14 days treatments.
Anthocyanins (ANTH) are a good indicator that a plant is under stress. They serve as antioxidants to clean up free radicals which are generated because of plant stress. In a review from [
34], anthocyanin production is suggested to be induced by environmental factors, including water stress. This production may be a protective mechanism for the plant to resist the harmful effects of such stress. In Exp. 1, ANTH did not differ within treatments ranging from 0 to 6 days (
Table 2). However, a quadratic function best described the overall relationship between ANTH and the increasing duration of waterlogging, with the most significant increases occurring at higher treatment levels (
Figure 5B). In Exp. 2, ANTH was only elevated due to the 12 and 14 days treatments. To our knowledge, no relationships between anthocyanin levels in corn and waterlogging have been established. However, previous research reports increased the levels of anthocyanins in some trees under waterlogged and flooded conditions resulting from the drought-like stress occurring due to a depressed root function [
34].
The nitrogen balance index (NBI) estimates N status as a ratio of chlorophyll to polyphenolics. Research has shown that this ratio improves the indices’ relationship to crop N status compared to chlorophyll estimation alone [
33]. For Exp 1, the NBI declined as treatments were prolonged from 0 to 6 days but ceased to decline significantly for treatments greater than 6 days (
Table 2). Overall, the relationship between waterlogging duration and NBI best fits a quadratic function (
Figure 5C). In Exp 2, NBI was only significantly lower under the 12 and 14 days treatments. In both studies, plants were treated with Hoagland’s nutrient solution, which always provided a readily available N source in the soil solution. Thus, declining leaf N could indicate an overall depressed root conductance. For a deficiency to become observable, the N uptake must be reduced to a greater relative extent than plant growth and demand.
3.4. Shoot Morphology
Vigorous shoot growth and leaf development during the early vegetative stages of corn are crucial to establishing a crop’s photosynthetic capacity and competitiveness against pests and weeds. These are both critical foundations of yield potential and stress tolerance throughout the growing season.
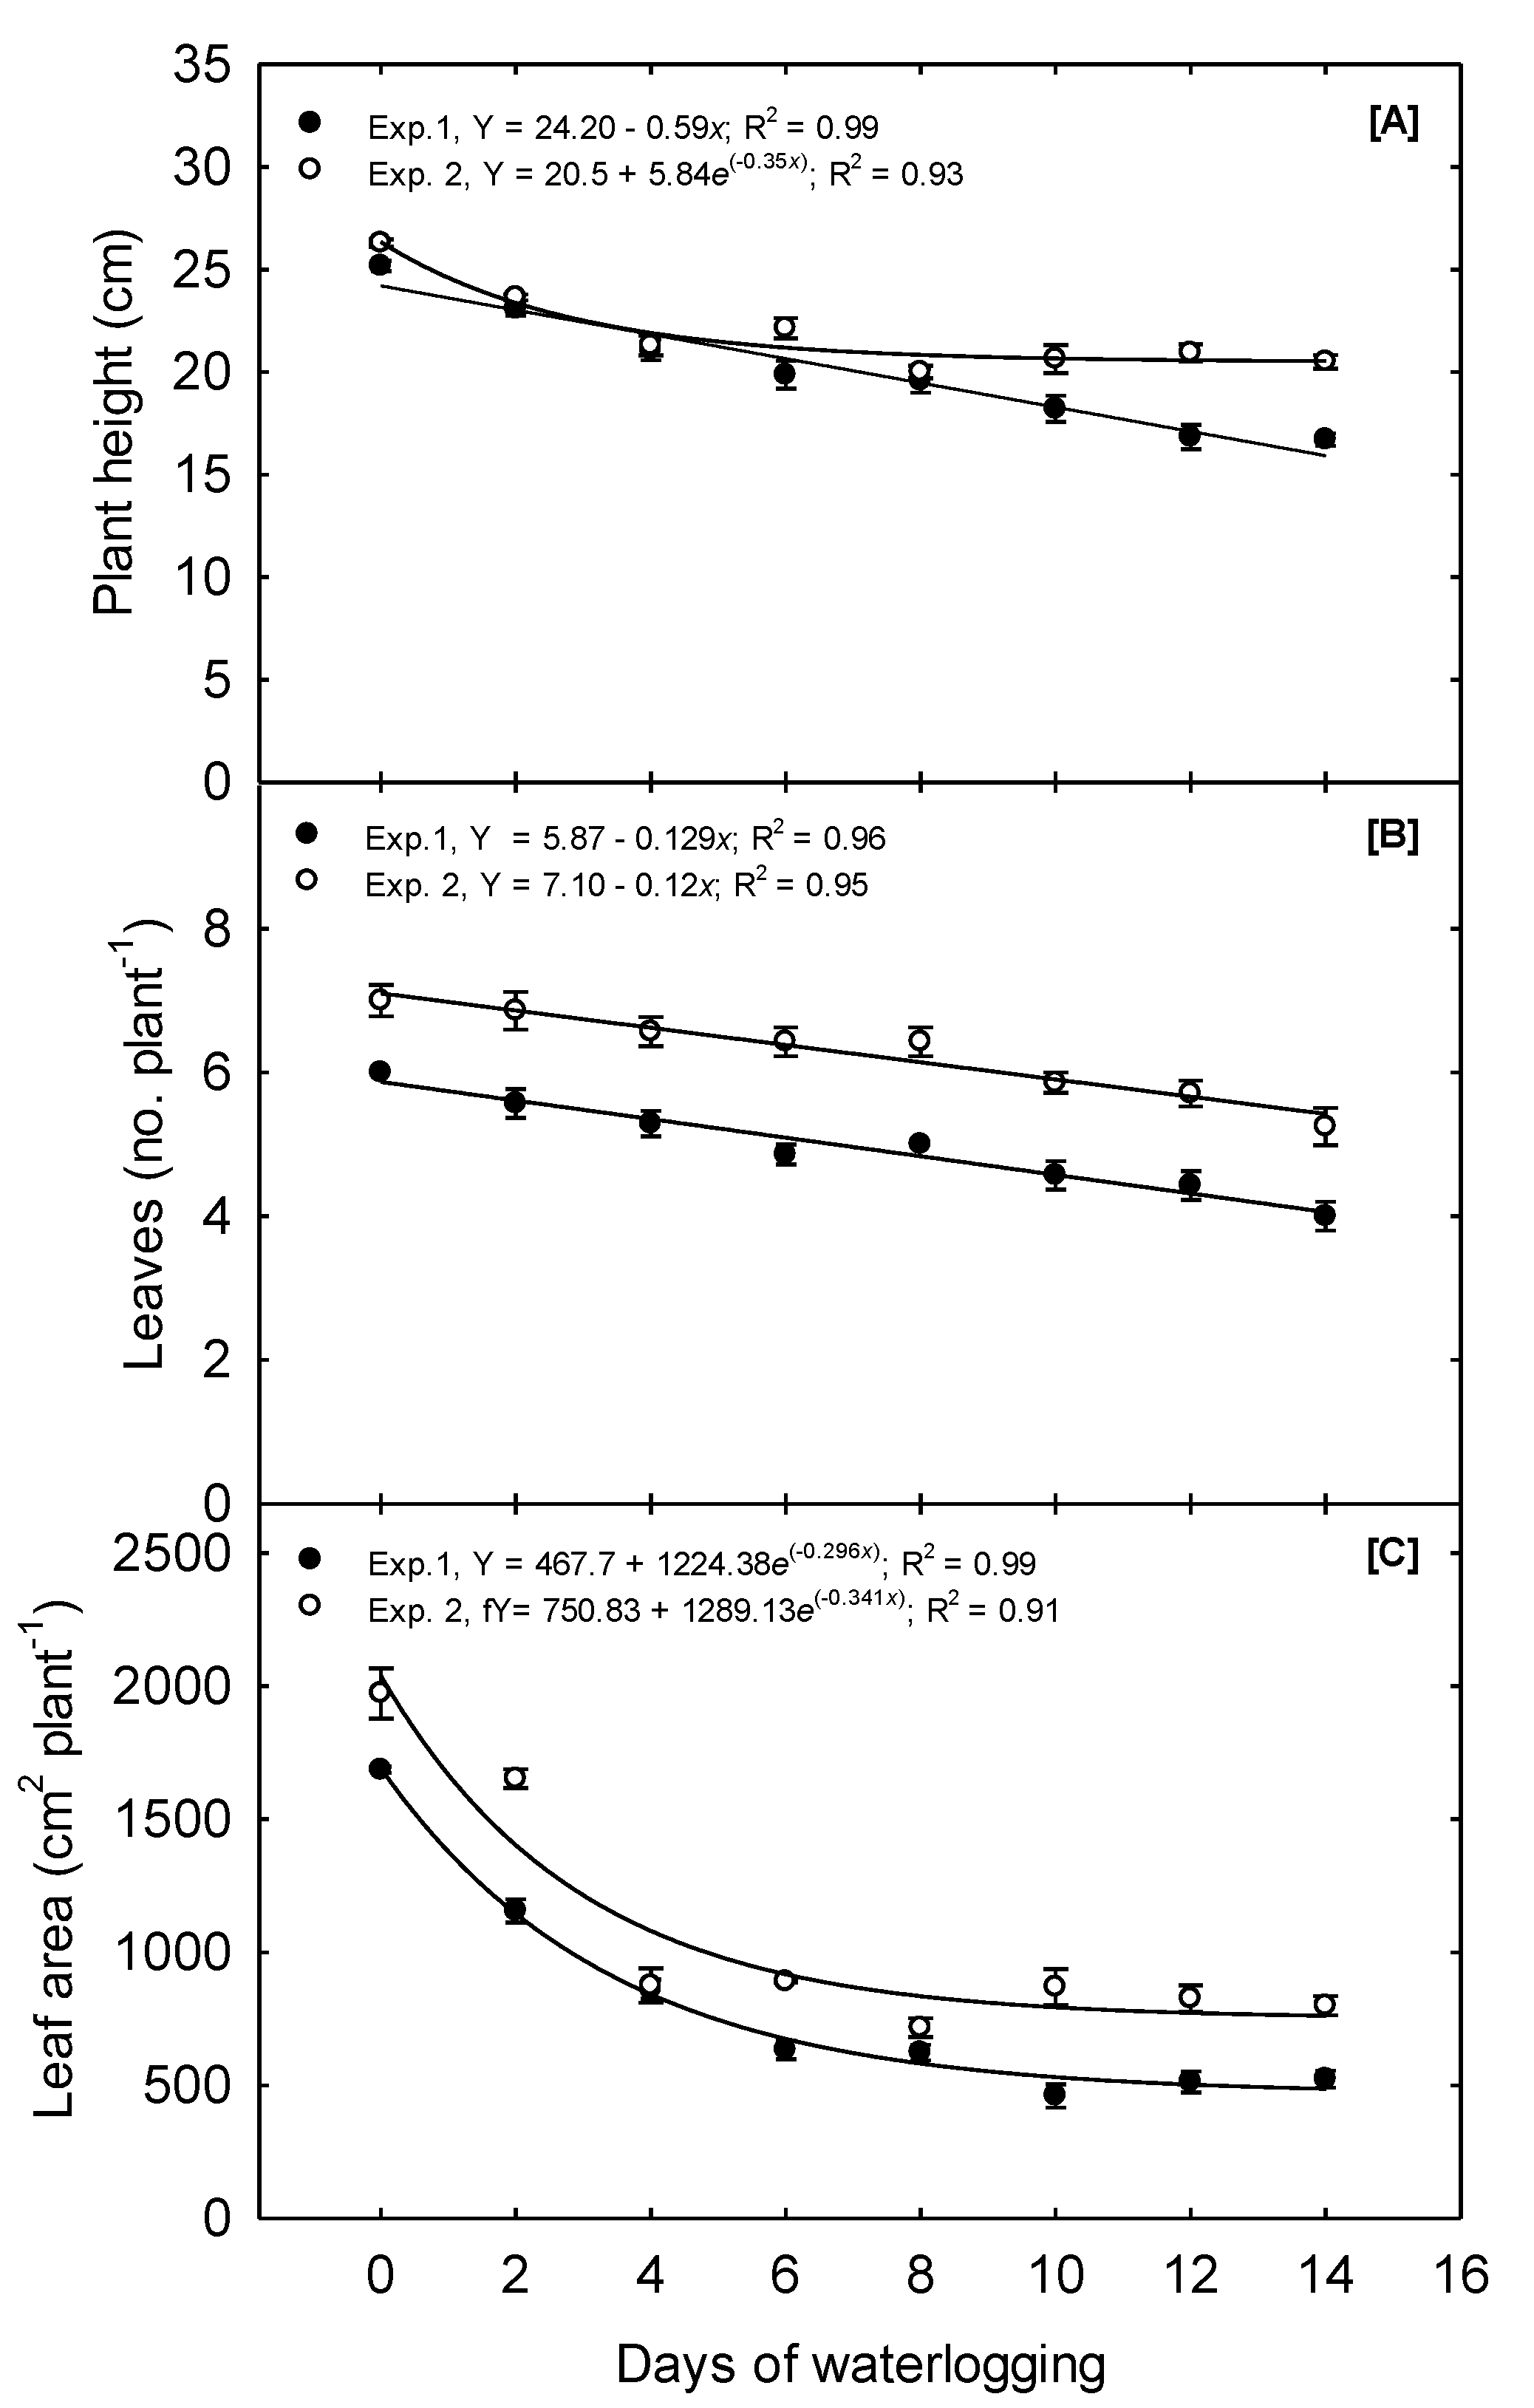
In Exp. 1, plant height (PH) was reduced 4% day
−1 of waterlogging as the duration increased from 0 to 4 days. Overall, plant height declined linearly from 25.17, observed at the 0 days treatment, to 16.71, observed under the 14d treatment, a total decline of 33.5% (
Figure 6A). In Exp. 2, plant height declined 4.75% day
−1 of waterlogging as the duration increased from 0 to 4 days; however, plant height under the 8, 10, 12, and 14 days treatments did not differ (
Table 2). An exponential decay functions best described the relationship between waterlogging and PH. The mean plant height in this experiment was 26.29 when 0 days of waterlogging occurred and 20.5 when 14 days of waterlogging happened. Bragina et al. [
35] reported that plant height declined 7, 11, and 23% when corn was flooded for 1, 2, and 3 days, respectively, at the V2 stage. Other studies have also reported a reduced plant height due to waterlogging in the field [
3,
6].
In Exp. 1, the leaf area per plant (LA) declined quadratically due to waterlogging increasing from 0 to 6 days; LA continued to decrease as treatments were prolonged past 6 days but at a much lower magnitude. A 31.5% decline in leaf area was observed due to just 2 days of waterlogging. The final leaf area was 1685.96 and 522.76 plant−1 for the 0 and 14 days treatments, respectively, a decline of 68.9%. Overall, exponential decay functions best describe the relationship between waterlogging and LA. In Exp. 2, the 2 days treatment reduced the leaf area by 16.3%, and the 4 days treatment reduced it by 55.5%. As the treatments were prolonged beyond 4 days, the final leaf area did not significantly decline further. The final leaf area was 1973.65 and 799.21 plant−1 for the 0 and 14 days treatment, respectively, constituting a total decline of 59.5%. Similar to Exp. 1, an exponential decay function best described the relationship between waterlogging and LA.
The number of leaves per plant (LN) was significantly affected by the increasing duration of waterlogging. The LN in Exp. 1 declined linearly from a mean of 6 leaves plant
−1 to 4 leaves per plant as waterlogging treatments increased from 0 to 14 days, respectively. Exp. 2 displayed a similar linear trend, with LN declining from 7 to 5 under the 0 and 14 days treatment, respectively (
Figure 6B). In this study, LN was measured as the number of leaves with a developed leaf collar. This measurement differs from the leaf initiation rate, a characteristic primarily controlled by temperature. Thus, waterlogging decreased the number of leaves with a developed collar, but we cannot determine how waterlogging affects the leaf initiation rate. To our knowledge, no previous reports outline the impacts of waterlogging on the leaf development or initiation rate.
3.5. Biomass Accumulation and Partitioning
A plant’s dry weight accumulation offers insight into its ability to convert sunlight into biomass. Additionally, we can determine how a plant prioritizes partitioning resources to different plant parts by measuring the dry weight accumulation of leaves, stems, and roots individually. The effects of increasing the duration of waterlogging on dry weight production and allocation followed a similar pattern during both experiments. Although leaf, stem, and root dry weight were all individually reduced by the treatments in both experiments, the root to shoot ratio and ratio of dry weight allocation to each part did not change due to the treatments. As waterlogging treatments increased in duration, the decline in the total plant dry weight was proportional to the decline observed for each individual component. However, contrary to our results, other studies have reported a decrease in the root to shoot ratio under 6d of waterlogging [
18].
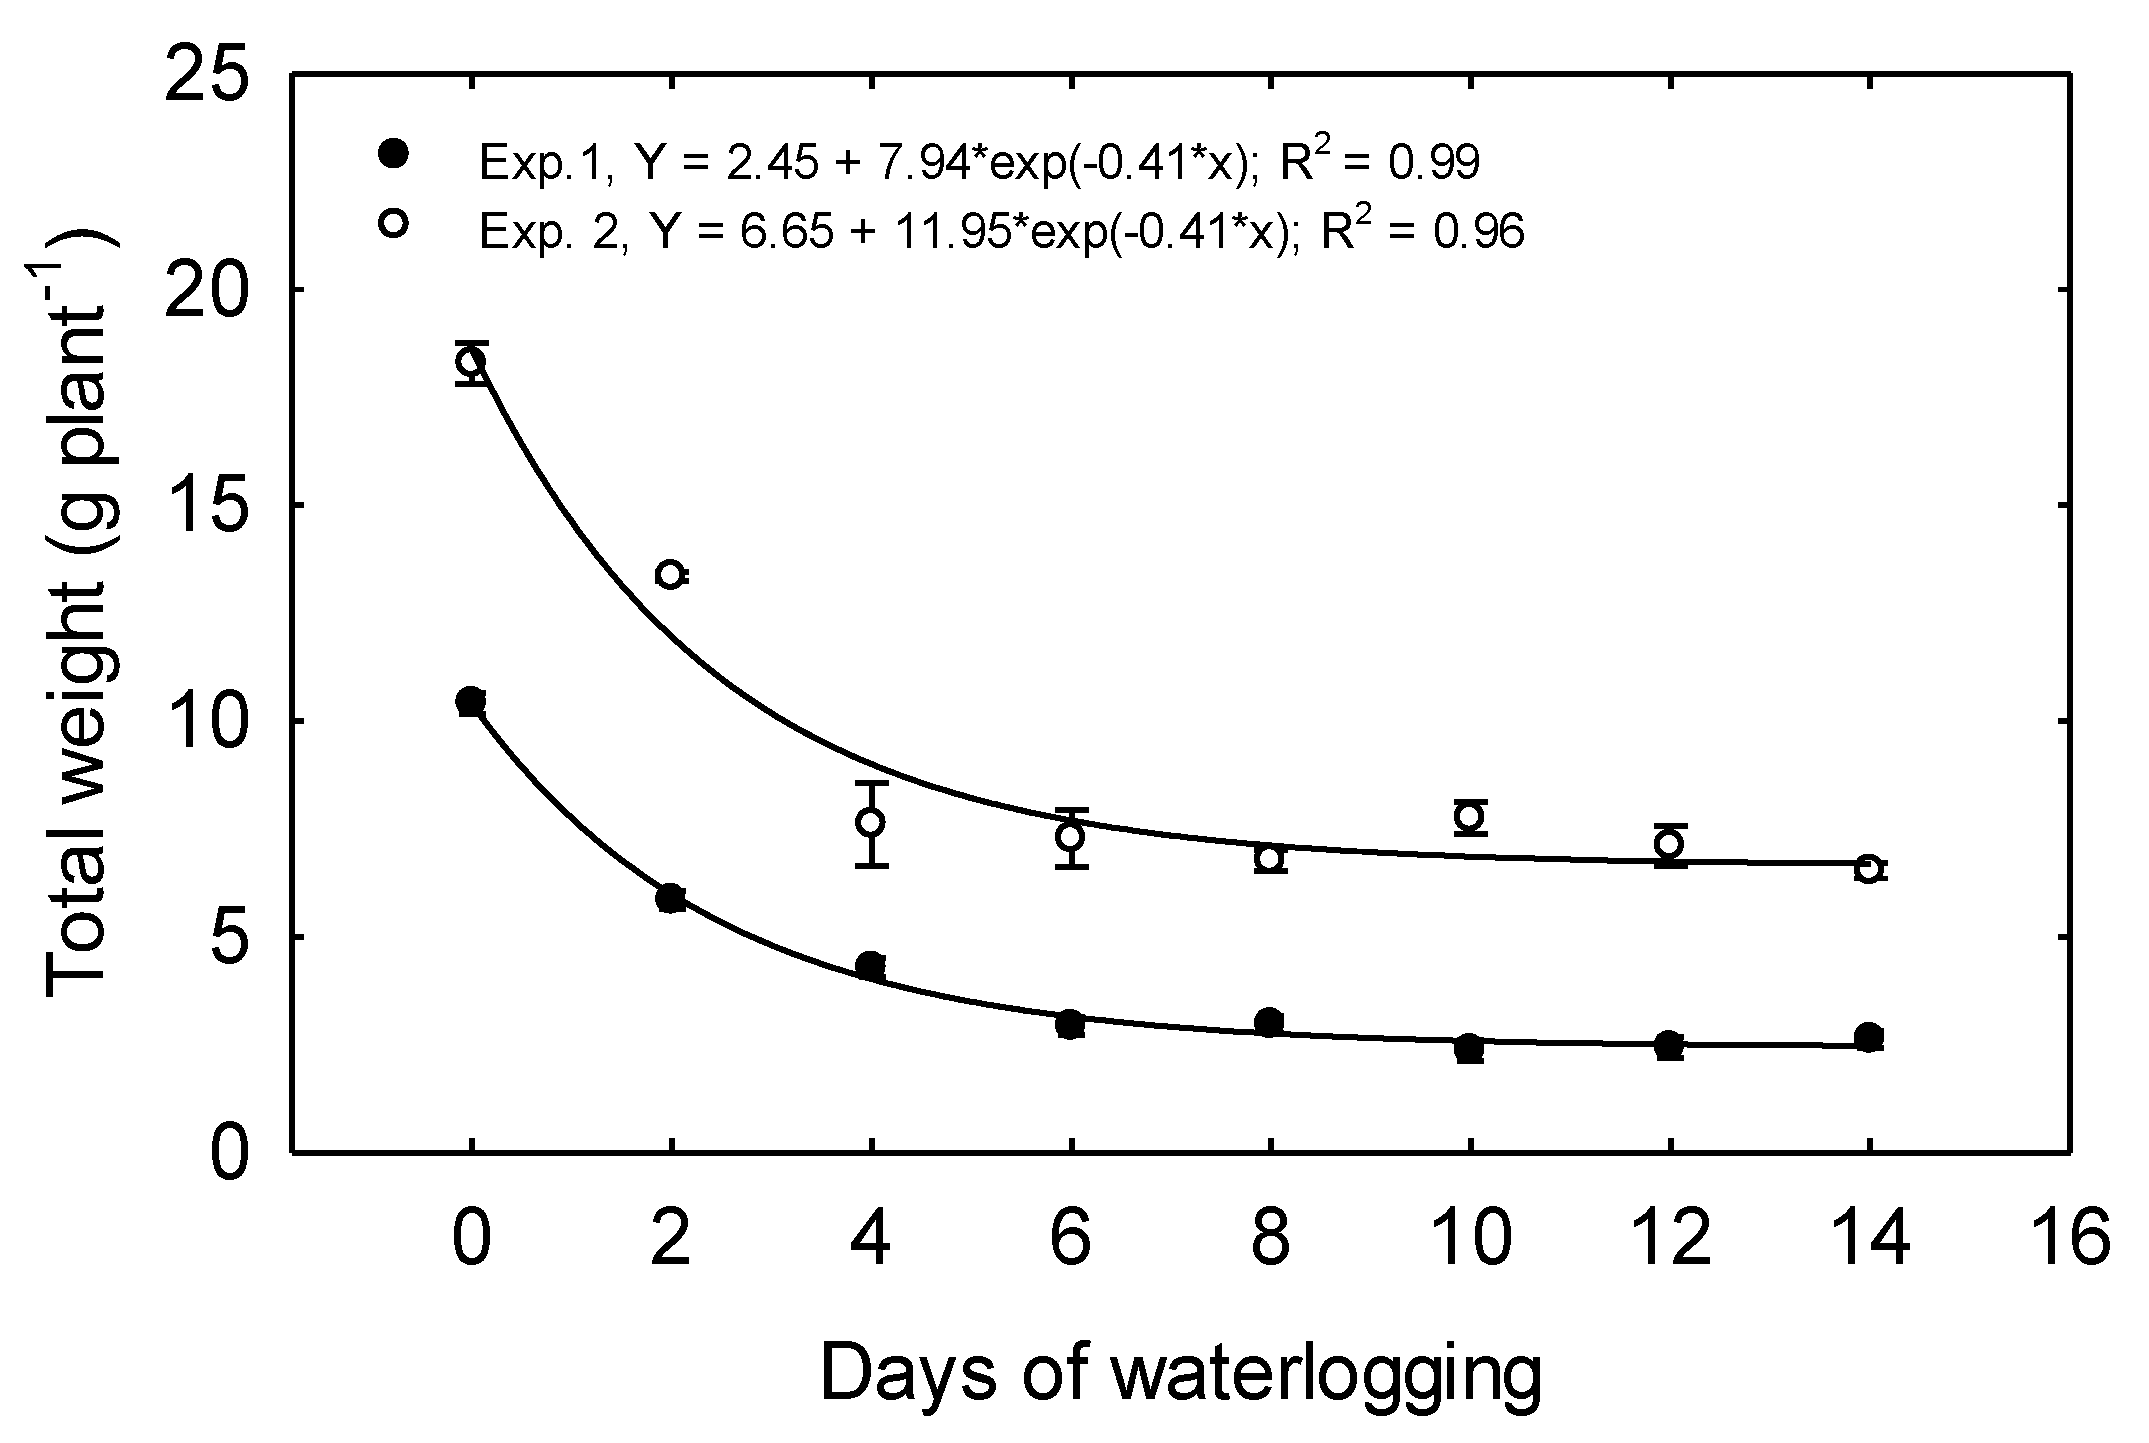
In Exp. 1, the total dry weight per plant (TDW) declined from 10.41 g plant
−1 produced for 0 days treatment to 2.93 g plant
−1 under 6 days treatment, a decline of 72% (
Figure 7), and TDW was reduced by 43.8% due to just two days of waterlogging. Increasing the duration of waterlogging beyond 6 days did not incite further declines in biomass (
Table 2).
In Exp. 2, TDW plant
−1 declined as the treatment duration was prolonged from 0 to 4 days (
Figure 7), and TDW plant
−1 was reduced 27% due to just two days of waterlogging. No differences were observed in TDW under the 4 to14 days treatments.
In both experiments, exponential decay functions best described the relationship between TDW and waterlogging duration. Other studies have also shown a decrease in plant biomass due to waterlogging stress. When corn was grown in pots and flooded for 14 and 21 days, the biomass accumulation was reduced by more than 50% [
6]. Lizaso and Ritchie [
36] also reported a decreased biomass when corn was grown in pots and waterlogged for 6 days. Lizaso et al. [
37] reported reduced biomass due to 4 and 8 days of waterlogging due to a reduced leaf area expansion and photosynthesis. In their experiment, doubling the duration of waterlogging from 4 to 8 days only decreased biomass by an additional 10%, suggesting a leveling-off response like that observed in this study. In contrast to our results, Wang et al. [
38] found no differences in shoot biomass when corn seedlings were waterlogged for six days at the V2 growth stage.
Previous studies indicate that decreases in dry weight accumulation are likely due to multiple reactions from plants under stress, including reduced carbohydrate production and increased carbohydrate consumption. First, as root hydraulic conductivity declines, an increase in stomatal resistance quickly follows, limiting the uptake of water and nutrients. An internal water deficit can arise, which negatively affects photosynthesis at the leaf level. Further declines in photosynthesis can ensue as the leaf area is reduced, leaf senescence increases, and leaf chlorophyll declines. Second, as hypoxia is induced, plants transition their metabolism from aerobic respiration to fermentative metabolic routes. These are less efficient means of energy production. Glycolysis can increase as a compensatory reaction to fill this energy void, further depleting the carbohydrate reserves.
3.6. Water Stress Response Index (WSRI)
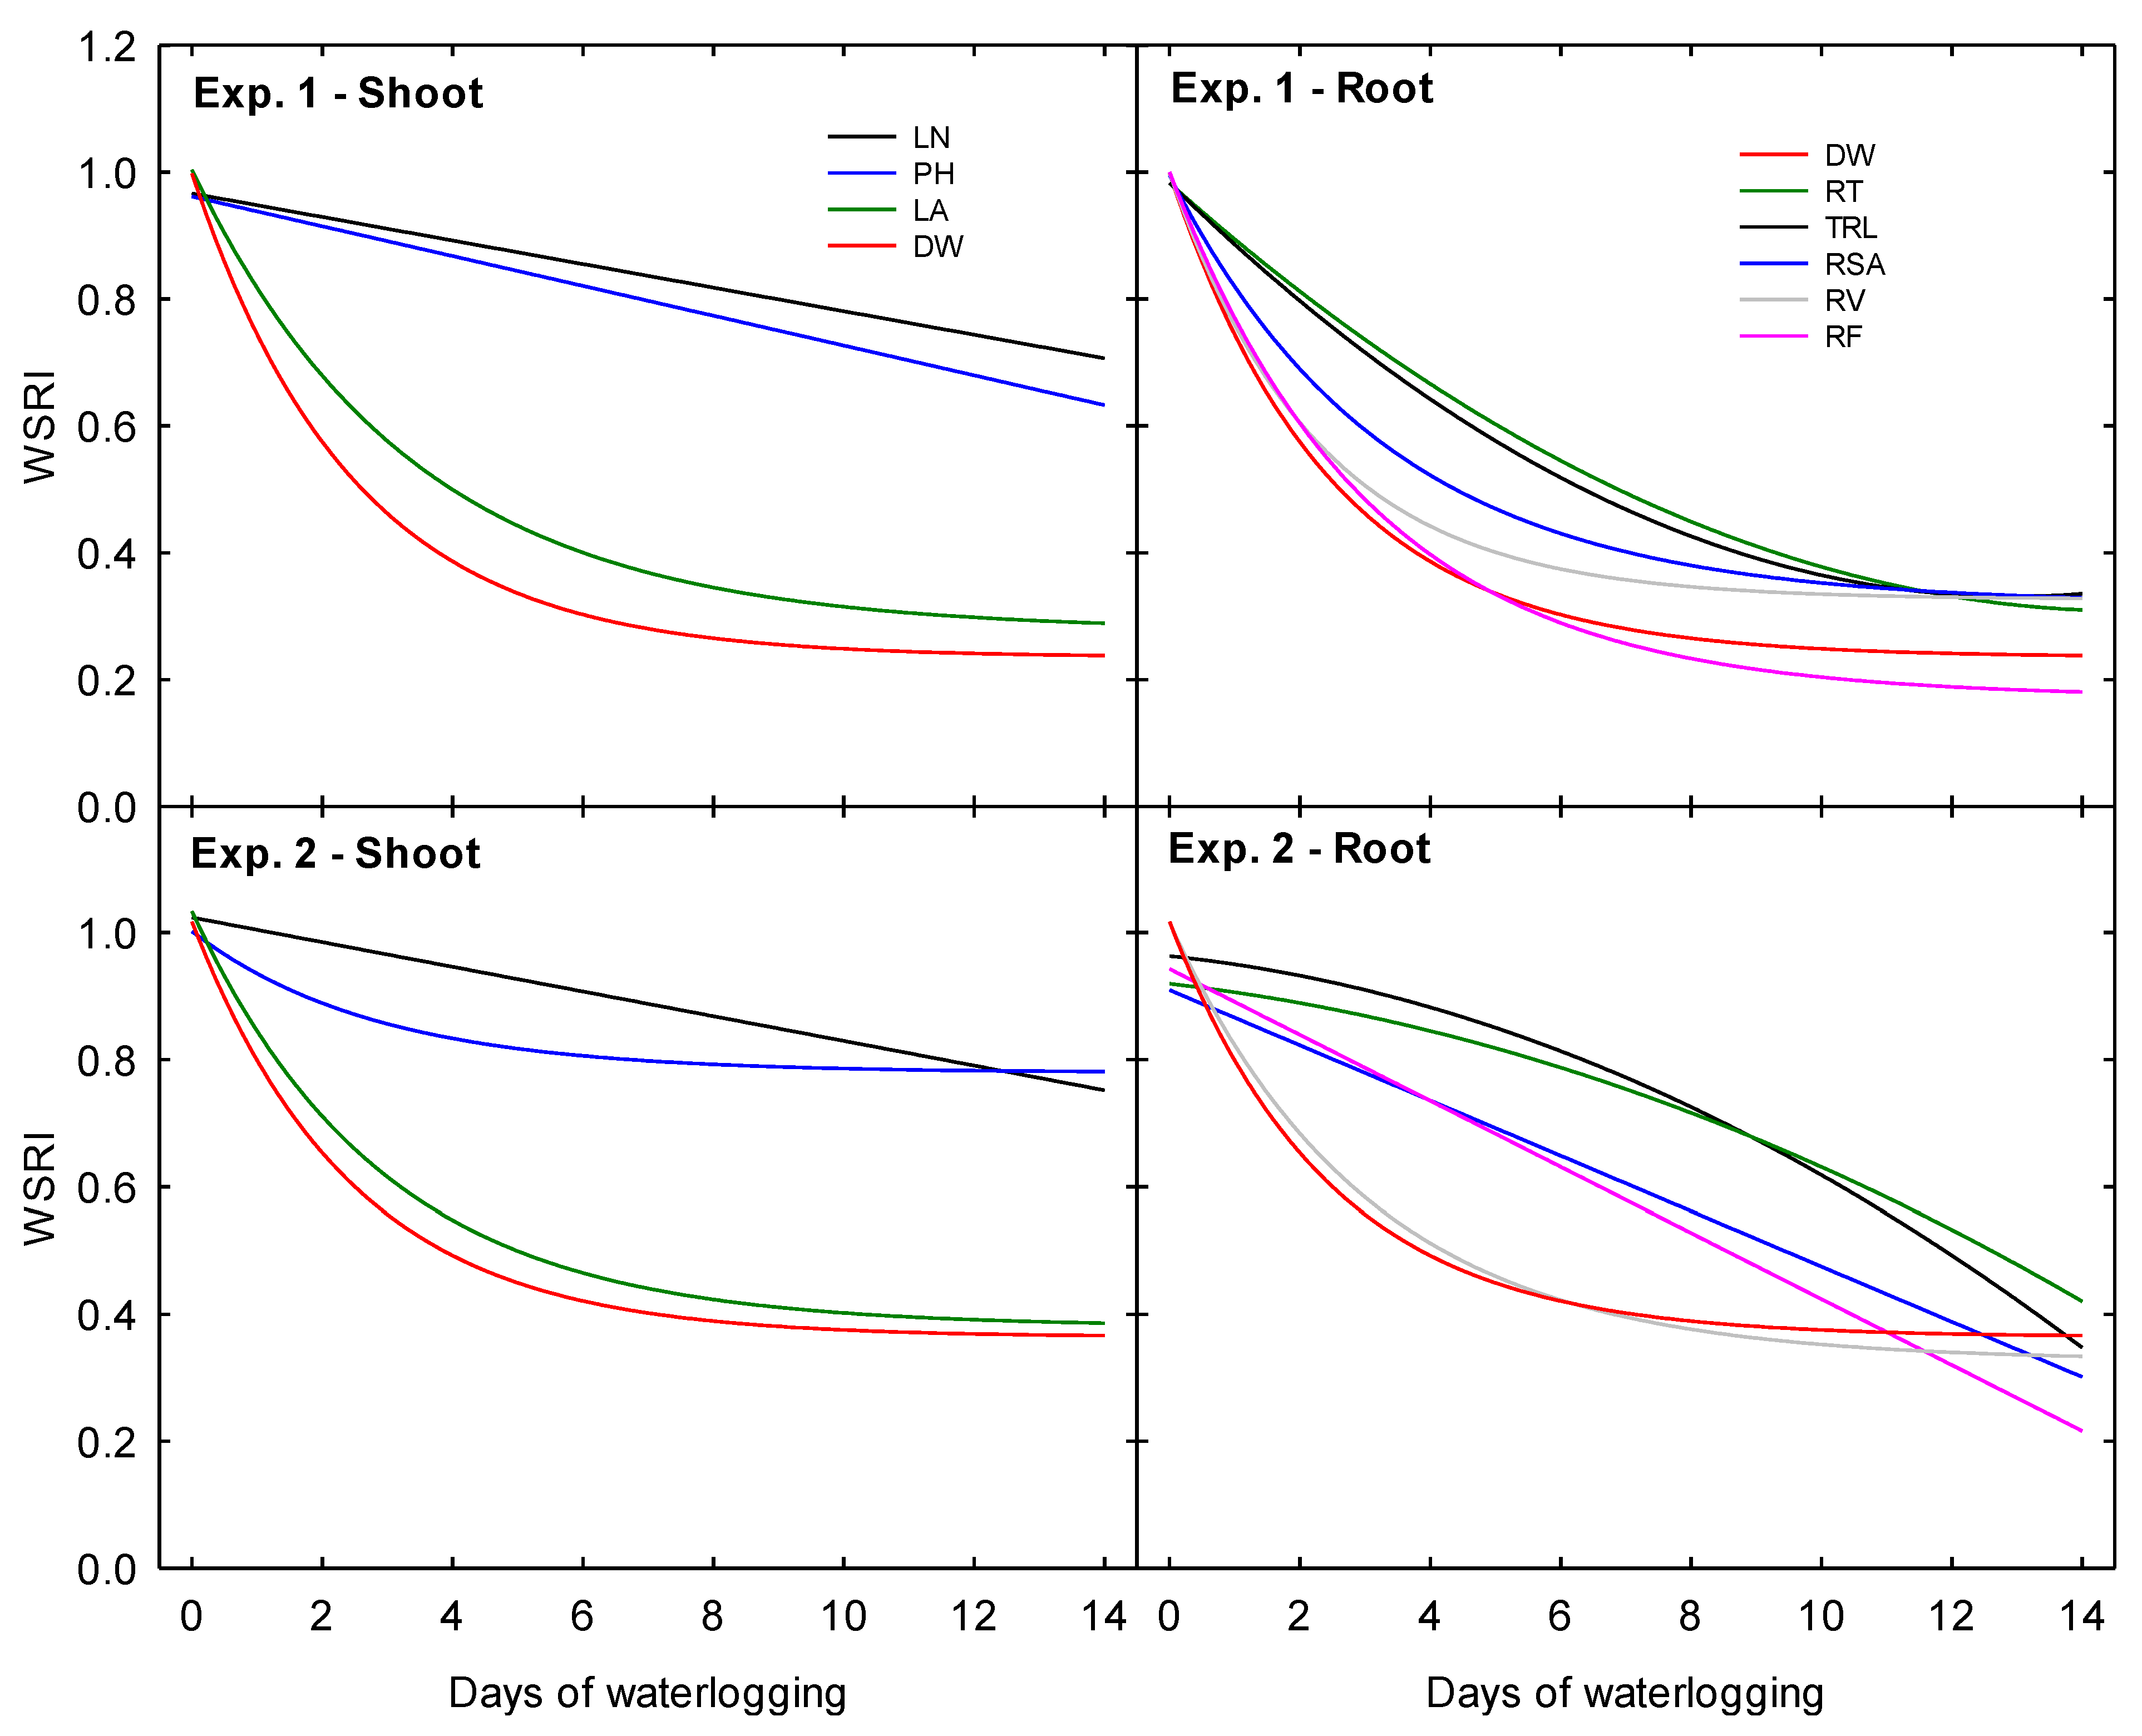
Waterlogging stress response indices were created for each measured parameter to illustrate the impact of waterlogging duration as a fraction of a plant’s potential under the 0 days treatment by normalizing the data as the relative response of each parameter to each treatment level as a fraction of the plant’s potential under the 0 days treatment.
In Exp. 1, LN and PH displayed the smallest relative decline. They were the only two morphological parameters in this experiment to hold a negative linear relationship with the increasing duration of waterlogging (
Figure 8). Above the soil surface, TDW accumulation was the most inhibited parameter. An exponential decay functions best described the relationship between DW accumulation and treatment duration at the end of the experimental period. The sharpest relative declines occurred due to increasing the waterlogging time from 0 to 6 days. The relative decrease of LA, although not as severe, was closely correlated (R
2 = 0.99) to that of DW. Below the soil surface, RV also declined in correlation with DW (R
2 = 0.99). Like the relative response of LA, the decline was ultimately not as severe as it was for DW. Moreover, RSA declined in close correlation with DW (R
2 = 0.99) and RV (R
2 = 0.97); however, the relative rate of decline of RSA was less severe than that of RV. Ultimately, these two morphological traits declined to similar relative fractions under the 14 days treatment. The relative decrease in RF was also identical to that of DW. However, RF displayed the most significant relative decline under the 14 days treatment among all measured parameters. RT and TRL were closely correlated and showed the least relative reduction among all root parameters. Both RT and TRL declined following similar quadratic trends as the duration of waterlogging increased, with the most significant decline occurring as waterlogging increased from 0 to 6 days.
In Exp. 2, LN displayed the least relative decline as waterlogging treatments increased in duration (
Figure 8). The response of PH followed closely behind, and the relative decline of these two parameters converged at the 12 days treatment. Above the soil surface, DW and LA were closely correlated (R
2 = 0.99) and declined following similar exponential decay trends. Below the soil surface, DW and RV were also closely correlated (R
2 = 0.99) and exhibited similar exponential decay trends. The relative response of RT and TRL were closely related (R
2 = 0.99) and followed similar quadratic trends, with relative decline worsening as waterlogging treatments increased in duration. Finally, RSA and RF both declined following similar linear trends. Under the 14 days treatment, RF displayed the most significant relative decline among all parameters in this second experiment.


