Article

Cannabinoid Receptor 1 Regulates Zebrafish Renal Multiciliated Cell Development via cAMP Signaling

by
Thanh Khoa Nguyen
*,
Sophia Baker
,
Julienne Angtuaco
,
Liana Arceri
,
Samuel Kaczor
,
Bram Fitzsimonds
,
Matthew R. Hawkins
and
Rebecca A. Wingert
*
Department of Biological Sciences, Center for Stem Cells and Regenerative Medicine, Center for Zebrafish Research, University of Notre Dame, Notre Dame, IN 46556, USA
*
Authors to whom correspondence should be addressed.
J. Dev. Biol. 2025, 13(2), 20; https://doi.org/10.3390/jdb13020020
Submission received: 6 March 2025 / Revised: 30 May 2025 / Accepted: 10 June 2025 / Published: 17 June 2025
(This article belongs to the Special Issue Feature Papers from Journal of Developmental Biology Reviewers)

Abstract

Endocannabinoid signaling plays a significant role in neurogenesis and nervous system physiology, but its roles in the development of other tissues are just beginning to be appreciated. Previous reports have shown the presence of the key endocannabinoid receptor Cannabinoid receptor 1 (CB1 or Cnr1) in multiciliated (MCC) tissues and its upregulation in kidney diseases, yet the relationship between Cnr1 and renal MCC development is unknown. Here, we report that Cnr1 is essential for cilia development across tissues and regulates renal MCCs via cyclic AMP (cAMP) signaling during zebrafish embryogenesis. Using a combination of genetic and pharmacological studies, we found that the loss of function, agonism and antagonism of cnr1 all lead to reduced mature renal MCC populations. cnr1 deficiency also led to reduced cilia development across tissues, including the pronephros, ear, Kupffer’s vesicle (KV), and nasal placode. Interestingly, treatment with the cAMP activator Forskolin (FSK) restored renal MCC defects in agonist-treated embryos, suggesting that cnr1 mediates cAMP signaling in renal MCC development. Meanwhile, treatment with the cAMP inhibitor SQ-22536 alone or with cnr1 deficiency led to reduced MCC populations, suggesting that cnr1 also mediates renal MCC development independently of cAMP signaling. Our findings indicate that cnr1 has a critical role in controlling renal MCC development both via cAMP signaling and an independent pathway, further revealing implications for ciliopathies and renal diseases.

1. Introduction

The endocannabinoid signaling pathway is critical for the healthy development and function of many physiological systems. The pathway includes the two main receptors, CB1 and CB2, which are both G protein-coupled receptors (GPCR), sharing about 48% amino acid sequence identity, as well as their numerous endogenous ligands, called “endocannabinoids” [1,2]. Despite the similarities in sequence, the CB1 and CB2 receptors are expressed in widely different tissues. The CB1 receptor, also known as Cnr1 or CB1R, is highly expressed in the nervous system, including the hippocampus, cerebellum, basal ganglia, neocortex and brain stem [3]. Additionally, the CB1 receptor is expressed in the ovary, kidney, gastrointestinal (GI) tract, liver, muscle, adipose tissue and also vasculature [4,5,6,7,8,9,10,11,12]. On the other hand, the CB2 receptor is expressed predominantly in tissues involved in immune regulation including the thymus, spleen, GI tract and bone marrow [7,8].
Emerging research has suggested a significant role of the CB1 receptor in kidney development and disease. The CB1 receptor is expressed in adult kidney populations that include the glomeruli, afferent and efferent arterioles, proximal tubule, distal tubule and collecting duct in mammals [13,14,15,16]. The presence of the CB1 receptor has also been found across experimental models, including human kidney, human cell culture, murine and zebrafish [13,14,15,17,18,19,20]. To date, the CB1 receptor has also been implicated in a number of kidney diseases. For example, the expression level of the CB1 receptor was highly upregulated in the glomeruli in diabetic nephropathy, a leading cause of chronic kidney diseases worldwide [1]. CB1 expression was also highly upregulated in other kidney conditions, including renal fibrosis, acute interstitial nephritis and IgA nephropathy [17]. However, we currently still have limited knowledge about the developmental genetics and signaling pathways through which the CB1 receptor governs kidney formation, especially how the CB1 receptor regulates renal cell composition. In addition, the majority of the studies on CB1 in kidney diseases to date have been performed using murine models.
Meanwhile, other experimental paradigms, such as zebrafish, offer many advantages to study kidney ontogeny and disease. The many benefits of using zebrafish to study renal biology include high fecundity, embryonic transparency, high genetic conservation with humans, robust regeneration and rapid external development [21]. The zebrafish embryonic kidney, or pronephros, is also structurally conserved compared to the human kidney, yet contains only two nephrons compared to about almost a million nephrons in humans [22,23]. Specifically, each zebrafish nephron consists of a blood filter that is followed by a segmented tubule that modifies the filtrate with unique functional regions, including the proximal convoluted tubule (PCT), proximal straight tubule (PST) and distal early (DE) and distal late (DL) segments, which have corresponding physiological roles in mammals [22]. Additionally, a healthy zebrafish embryonic kidney has MCCs, which, in humans, have only been found in fetal and kidney-diseased conditions [24,25,26,27,28]. Interestingly, the CB1 receptor is expressed in MCCs in several tissues, including the MCCs of the cat oviduct or the rat brain ependymocytes [29,30]. Previous studies have reported expression of the CB1 receptor in tissues rich in MCCs in zebrafish, such as the brain and kidney [1,18]. However, we still do not know the role of Cnr1 in the MCCs of the kidney, as well as other ciliated tissues such as ear or nasal placode.
Here, we identified an essential role of CB1, also known as Cnr1 in zebrafish, in renal MCC development via genetic deficiency and pharmacological approaches. Both cnr1 genetic loss of function, as well as agonism or antagonism of cnr1 using pharmacological treatments, resulted in pericardial edema between 48 and 72 h post fertilization (hpf) along with delayed PCT coiling, indicating dysfunctional renal clearance due to MCC defects. Indeed, cnr1 deficiency resulted in a decreased number of both mature and progenitor renal MCCs populations. Meanwhile, treatment with either cnr1 agonists or antagonists resulted in a decreased number of only mature renal MCCs. We further discovered disrupted cilia development in the pronephros, KV, nasal placode and ear due to cnr1 deficiency. Interestingly, renal MCC deficiency in agonist-treated embryos was rescued with the co-treatment of FSK, an adenylyl cyclase activator that promotes cAMP signaling. Additionally, treatment with SQ-22536, an adenylyl cyclase inhibitor, both alone and in tandem with cnr1 deficiency, led to a reduction in renal MCC populations. Taken together, our study highlights that cnr1 is essential for cilia development across zebrafish tissues and elucidates that cnr1 regulates renal MCC development both independently and through cAMP signaling pathways.

2. Materials and Methods

2.1. Ethics Statement and Zebrafish Husbandry

The zebrafish in our studies were maintained by the Center for Zebrafish Research at the University of Notre Dame. Our experiments were approved under protocol numbers 19-06-5412 and 22-07-7335 by the University of Notre Dame Institutional Animal Care and Use Committee (IACUC).

2.2. Animal Models

Our work used the Tübingen strain zebrafish for the experiments. We raised and staged zebrafish following previously described methods [31]. For all experiments, we incubated embryos in E3 medium at 28 °C until the desired stage, treated them with 0.02% tricaine and then fixed them using either Dent’s solution (80% methanol, 20% DMSO) or 4% paraformaldehyde/1× PBS (PFA) [32]. We performed WISH experiments in biological triplicate, each of which has a sample size greater than 10 embryos. A minimum of 3 samples were quantified per experimental group for cilia data analysis.

2.3. Whole Mount in Situ Hybridization (WISH)

We performed WISH following previously published methods [32,33,34]. Linearized plasmids were transcribed in vitro with T7, T3 or SP6 enzymes to create antisense RNA probes either digoxigenin-labeled (odf3b, cetn4, pax2a, jag2b, myl7, slc20a1a, trpm7, slc12a1, slc12a3) or fluorescein-labeled (odf3b) via in vitro transcription using IMAGE clone templates as previously described [35,36,37].

2.4. Morpholino Knockdown

Morpholino oligonucleotides (MOs) were obtained from Gene Tools, LLC, Philomath, USA and suspended in DNase/RNase free water to create 4 mM stock solutions, which were stored at −20 °C. Embryos were injected at the one-cell stage with 3 nanoliters (nl) of diluted MO. The cnr1 MO sequence is 5′-CTAGAGGAAACCTGTCGGAGGAAAT-3′, which has been previously validated in zebrafish [38,39].

2.5. Immunofluorescence (IF)

Whole-mount IF experiments were performed as previously described [40,41,42,43]. For cilia, anti-tubulin acetylated diluted 1:400 (Sigma) was used. For basal bodies, anti-γ-tubulin diluted 1:400 (Sigma, St. Louis, MO, USA) was used. For apical membrane, anti-aPKC diluted 1:500 (Santa Cruz Biotechnology, Santa Cruz, CA, USA) was used (Table S1).

2.6. Drug Treatments

Drug treatments were performed as previously described [44]. Chemicals were dissolved in DMSO to make a 5 mM or 10 mM stock solution, aliquoted and stored at −80 °C. Then, a 1 mM working solution dissolved in DMSO was made from a stock solution. The specific treatment solutions of each chemical used in this study were diluted to their desired concentration in E3. Drug treatments were performed on 6-well plates for embryos beginning at the shield stage (6 hpf) until the desired timepoints for study. For embryos studied over multi-day periods, drug solutions were refreshed at the beginning of each day. For WISH analysis, at the desired timepoints, the drug solution was removed, and embryos were washed two times with E3, then euthanized with 0.02% tricaine and fixed in 4% PFA for study. The dosage of each chemical used was chosen based on maximum penetration and minimal morphological defects. To ensure that the effects of agonists and antagonists on MCC development were only due to their effects, WT control embryos for each experiment were incubated with a similar volume of treatment solution including only DMSO. Treatments were performed in biological triplicate, with a minimum of 10 embryos per replicate.

2.7. PCT Phenotype Scoring

To score PCT coiling defects, we picked representative images of WT samples stained with the PCT marker slc20a1a at each timepoint of interest. We scored this level of coiling at each timepoint as “normal”. If PCT coiling level was not as developed compared to “normal”, samples would be scored as “delayed”.

2.8. Image Acquisition

We took live images and images of WISH samples using a Nikon Eclipse Ni with a DS-Fi2 camera. We measured WISH segment length with the Nikon Elements software polyline tool. IF images were acquired using a Leica Stellaris 8 DIVE confocal microscope. For WISH pictures, images were taken at 4× and 10×. For IF images, images were taken at 63×.

2.9. Quantification and Statistical Analysis

We used ImageJ/Fiji for all of our cilia measurements at a 63× magnification. The multi-point tool was used for counting. The segment line tool was used to measure cilia lengths in both proximal and distal segments. A minimum of 6 cilia length measurements were performed per sample for a minimum of 3 samples per experimental group. The plot profile function was used to measure fluorescent intensity. The average and standard deviation were calculated from measurements and unpaired t-tests, or one-way ANOVA were performed to compare measurements between experimental groups using GraphPad Prism 10 software. For binary classification data, we utilized Fisher’s exact test with Holm’s method for correcting for multiplicity (when necessary) [45]. All binary classification analysis was performed in R (v4.4.0) and significance for the adjusted p-value was set to p < 0.05.

3. Results

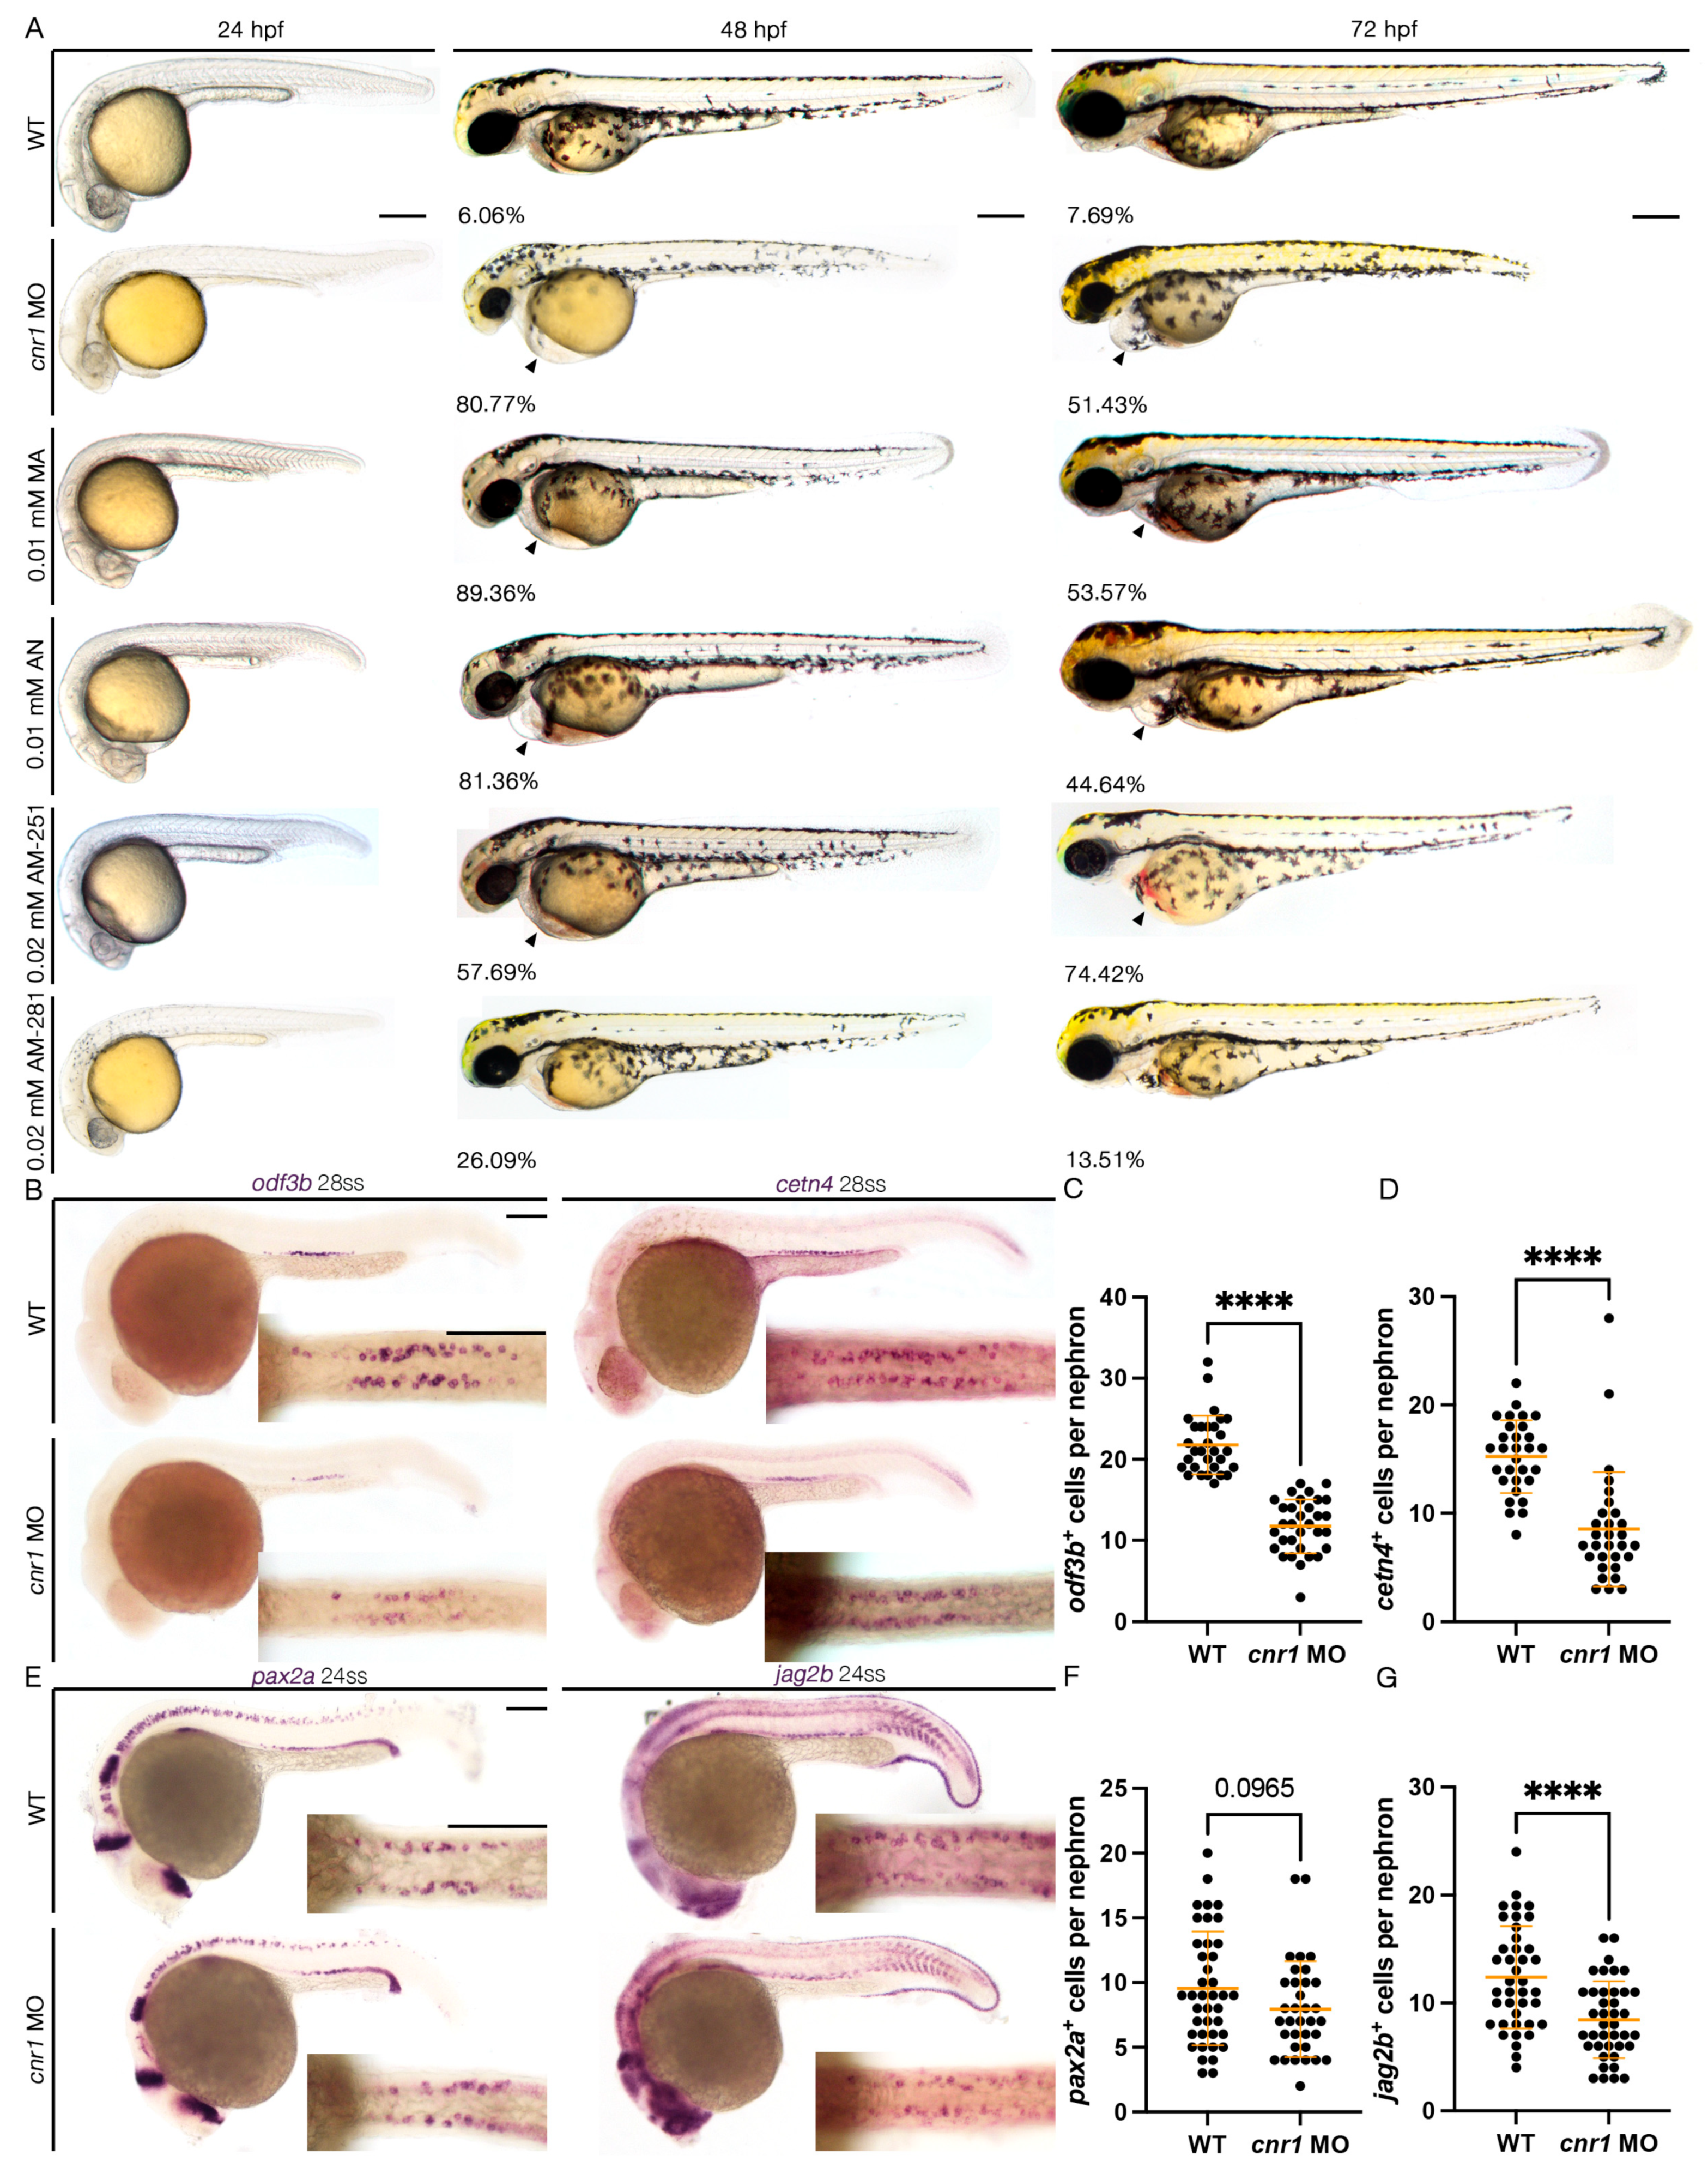
3.1. Loss of cnr1 Leads to Phenotypes Consistent with Renal MCC Defects

To study the role of Cnr1 in zebrafish renal development, we utilized a combination of both genetic and pharmacological methods to target the Cnr1 receptor. First, to generate a genetically deficient model of Cnr1, we utilized a MO that effectively blocks the translation of the Cnr1 protein by blocking the translation of the cnr1 mRNA, the effect of which has been previously reported in disrupting neuronal development in zebrafish [38,39]. To assess the effect of the cnr1 MO on body morphology, we microinjected the cnr1 MO at the single-cell stage and performed live brightfield imaging between 24 and 72 hpf. We observed that cnr1 morphants developed progressive pericardial edema between 48 and 72 hpf, which often indicates dysfunctional renal clearance due to cilia defects (Figure 1A). Furthermore, since renal MCCs assist with fluid flow, which plays an important role in PCT morphogenesis and cell migration [22], we assessed PCT coiling using the segment marker slc20a1a between 48 and 72 hpf. Interestingly, we observed an increase in the number of embryos with delayed PCT coiling in cnr1 morphants compared to WT embryos at both timepoints (Figure S1A–C).
To study the effect of the cnr1 MO in renal MCC development, we performed WISH using markers odf3b and cetn4 to assess mature MCC populations at the 28-somite stage (ss). We found that cnr1 morphants exhibited a decrease in the number of both odf3b+ and cetn4+ cells per nephron compared to WT embryos (Figure 1B–D). We also assessed MCC progenitor populations using the two MCC progenitor markers, pax2a and jag2b, at 24 ss. We observed a significant decrease in the number of jag2b+ cells per nephron and a slight decrease in the number of pax2a+ cells per nephron in cnr1 morphants compared to WT embryos (Figure 1E–G). Our results thus demonstrate that cnr1 plays a significant role in zebrafish renal MCC development and function.

3.2. Cnr1 Agonism Leads to Phenotypes Consistent with Renal MCC Defects

To further explore the effects of cnr1 function, we next employed a pharmacological approach to both activate and block Cnr1. To activate Cnr1, we used two drugs, Anandamide (AN) and Methanandamide (MA). AN, also known as AEA or ANA, is the first identified endocannabinoid, while MA is a synthetic analog of AN that has a higher affinity for Cnr1 [5,46]. Using concentrations of 0.01 mM MA and 0.01 mM AN, we performed drug treatments beginning at the shield stage, or 6 hpf, until the desired timepoints for analysis. We observed that treatment with either 0.01 mM MA or 0.01 mM AN led to development of pericardial edema from 48 to 72 hpf, indicative of dysfunctional clearance due to cilia defects (Figure 1A). Interestingly, when we assessed PCT coiling using the PCT marker slc20a1a between 48 and 72 hpf, we observed almost normal coiling with both 0.01 mM MA and 0.01 mM AN treatment at 48 hpf but significantly delayed at 72 hpf compared to WT embryos (Figure S1A–C).
To assess the effect of Cnr1 agonism on renal MCC development, we performed WISH using mature MCC markers, odf3b and cetn4 at 28 ss. We observed that both treatment with 0.01 mM MA and 0.01 mM AN led to a decreased number of both odf3b+ and cetn4+ cells per nephron compared to WT embryos (Figure 2A–C). We also assessed MCC progenitor populations using the two MCC progenitor markers, pax2a and jag2b, at 24 ss. We only observed a slight decrease in the number of pax2a+ cells per nephron with the 0.01 mM AN treatment, but no significant difference between the number of pax2a+ cells per nephron between 0.01 mM MA and WTs. Similarly, we observed non-significant differences in the number of jag2b+ cells per nephron between the 0.01 mM MA and 0.01 mM AN treatments and WTs (Figure 2D–F). These results indicate that Cnr1 agonism leads to a reduction in mature MCCs but not the normal development of progenitor MCC populations.

3.3. Cnr1 Antagonism Leads to Phenotypes Consistent with Renal MCC Defects

Next, to block activity of Cnr1, we examined the effects of two drugs, AM-251 and AM-281, both of which are widely used Cnr1 antagonists [47]. Using the concentrations of 0.02 mM AM-251 and 0.02 mM AM-281, we performed drug treatment at the shield stage until the desired timepoints for analysis. Interestingly, we observed that treatment with 0.02 mM AM-251, but not 0.02 mM AM-281, led to the development of pericardial edema from 48 to 72 hpf, indicative of dysfunctional clearance due to cilia defects (Figure 1A). When we assessed PCT coiling using the PCT marker slc20a1a between 48 and 72 hpf, we observed almost normal coiling at 48 hpf and significantly delayed coiling at 72 hpf compared to WTs with 0.02 mM AM-251 treatment, but normal coiling at both stages with 0.02 mM AM-281 treatment (Figure S1A–C).
Next, to assess the effect of Cnr1 antagonism in renal MCC development, we performed WISH using mature MCC markers, odf3b and cetn4, at 28 ss. We observed that treatment with 0.02 mM AM-251 resulted in a decrease in the number of both odf3b+ and cetn4+ cells per nephron compared to WT embryos (Figure 3A–C). On the other hand, treatment with 0.02 mM AM-281 led to no significant differences between the number of odf3b+ and cetn4+ cells per nephron compared to WT embryos (Figure 3A–C). We also assessed MCC progenitor populations using the two MCC progenitor markers, pax2a and jag2b, at 24 ss. We did not observe any significant differences between the number of both pax2a+ and jag2b+ cells per nephron between WT, 0.02 mM AM-251 and 0.02 mM AM-281 treatment (Figure 3D–F). We concluded that treatment with cnr1 antagonism, in this case only AM-251, leads to a reduction in the number of mature MCCs, but not the number of progenitor MCCs.

3.4. Assessing Renal Segmental Differences with cnr1 Deficiency, Cnr1 Agonism and Antagonism

As mentioned, zebrafish kidney segments include the PCT, PST and DE and DL segments [22]. MCCs are distributed in a salt and pepper pattern throughout the proximal and distal tubule and most highly concentrated in the PCT, PST and DE segments [22,48]. Each nephron segment expresses a distinctive set of genes [35]. As we observed a reduction in the number of mature MCCs due to cnr1 deficiency, Cnr1 agonism and Cnr1 antagonism, we next investigated what happens to each of the pronephric segments. We thus performed WISH at 28 ss to survey each of the four segments, PCT labeled by slc20a1a, PST labeled by trpm7, DE labeled by slc12a1 and DL labeled by slc12a3, between WT and each experimental condition. With the cnr1 MO, we observed an increase in the domain length of slc20a1a, a slight increase in the domain length of slc12a1 and a decrease in the domain length of trpm7 and slc12a3 compared to WTs (Figure S1D–H). Our results suggest that in addition to the regulation of renal MCC populations, cnr1 may also play a role in regulating both proximal and distal renal cell fates.
With Cnr1 agonism, treatment with 0.01 mM MA led to a reduction in the DE segment labeled by slc12a1 compared to WTs, but no significant difference in the domain length of slc20a1a, trpm7 or slc12a3 compared to WTs (Figure S2A–E). On the other hand, treatment with 0.01 mM AN led to a reduction in the PST segment labeled by trpm7 compared to WTs, but no significant difference in the domain length of slc20a1a, slc12a1 and slc12a3 (Figure S2A,F–I). We conclude that other than the effect of MA on the DE segment, Cnr1 agonism has little effect on kidney segmentation.
With Cnr1 antagonism, treatment with 0.02 mM AM-251 led to a slight increase in the PCT segment labeled by slc20a1a compared to WTs, but no significant difference in the domain length of trpm7, slc12a1 or slc12a3 compared to WTs (Figure S3A–E). Treatment with 0.02 mM AM-281 did not result in any significant difference in any of the kidney segments compared to WTs (Figure S3A,F–I). We conclude that Cnr1 antagonism has little effect on kidney segmentation.

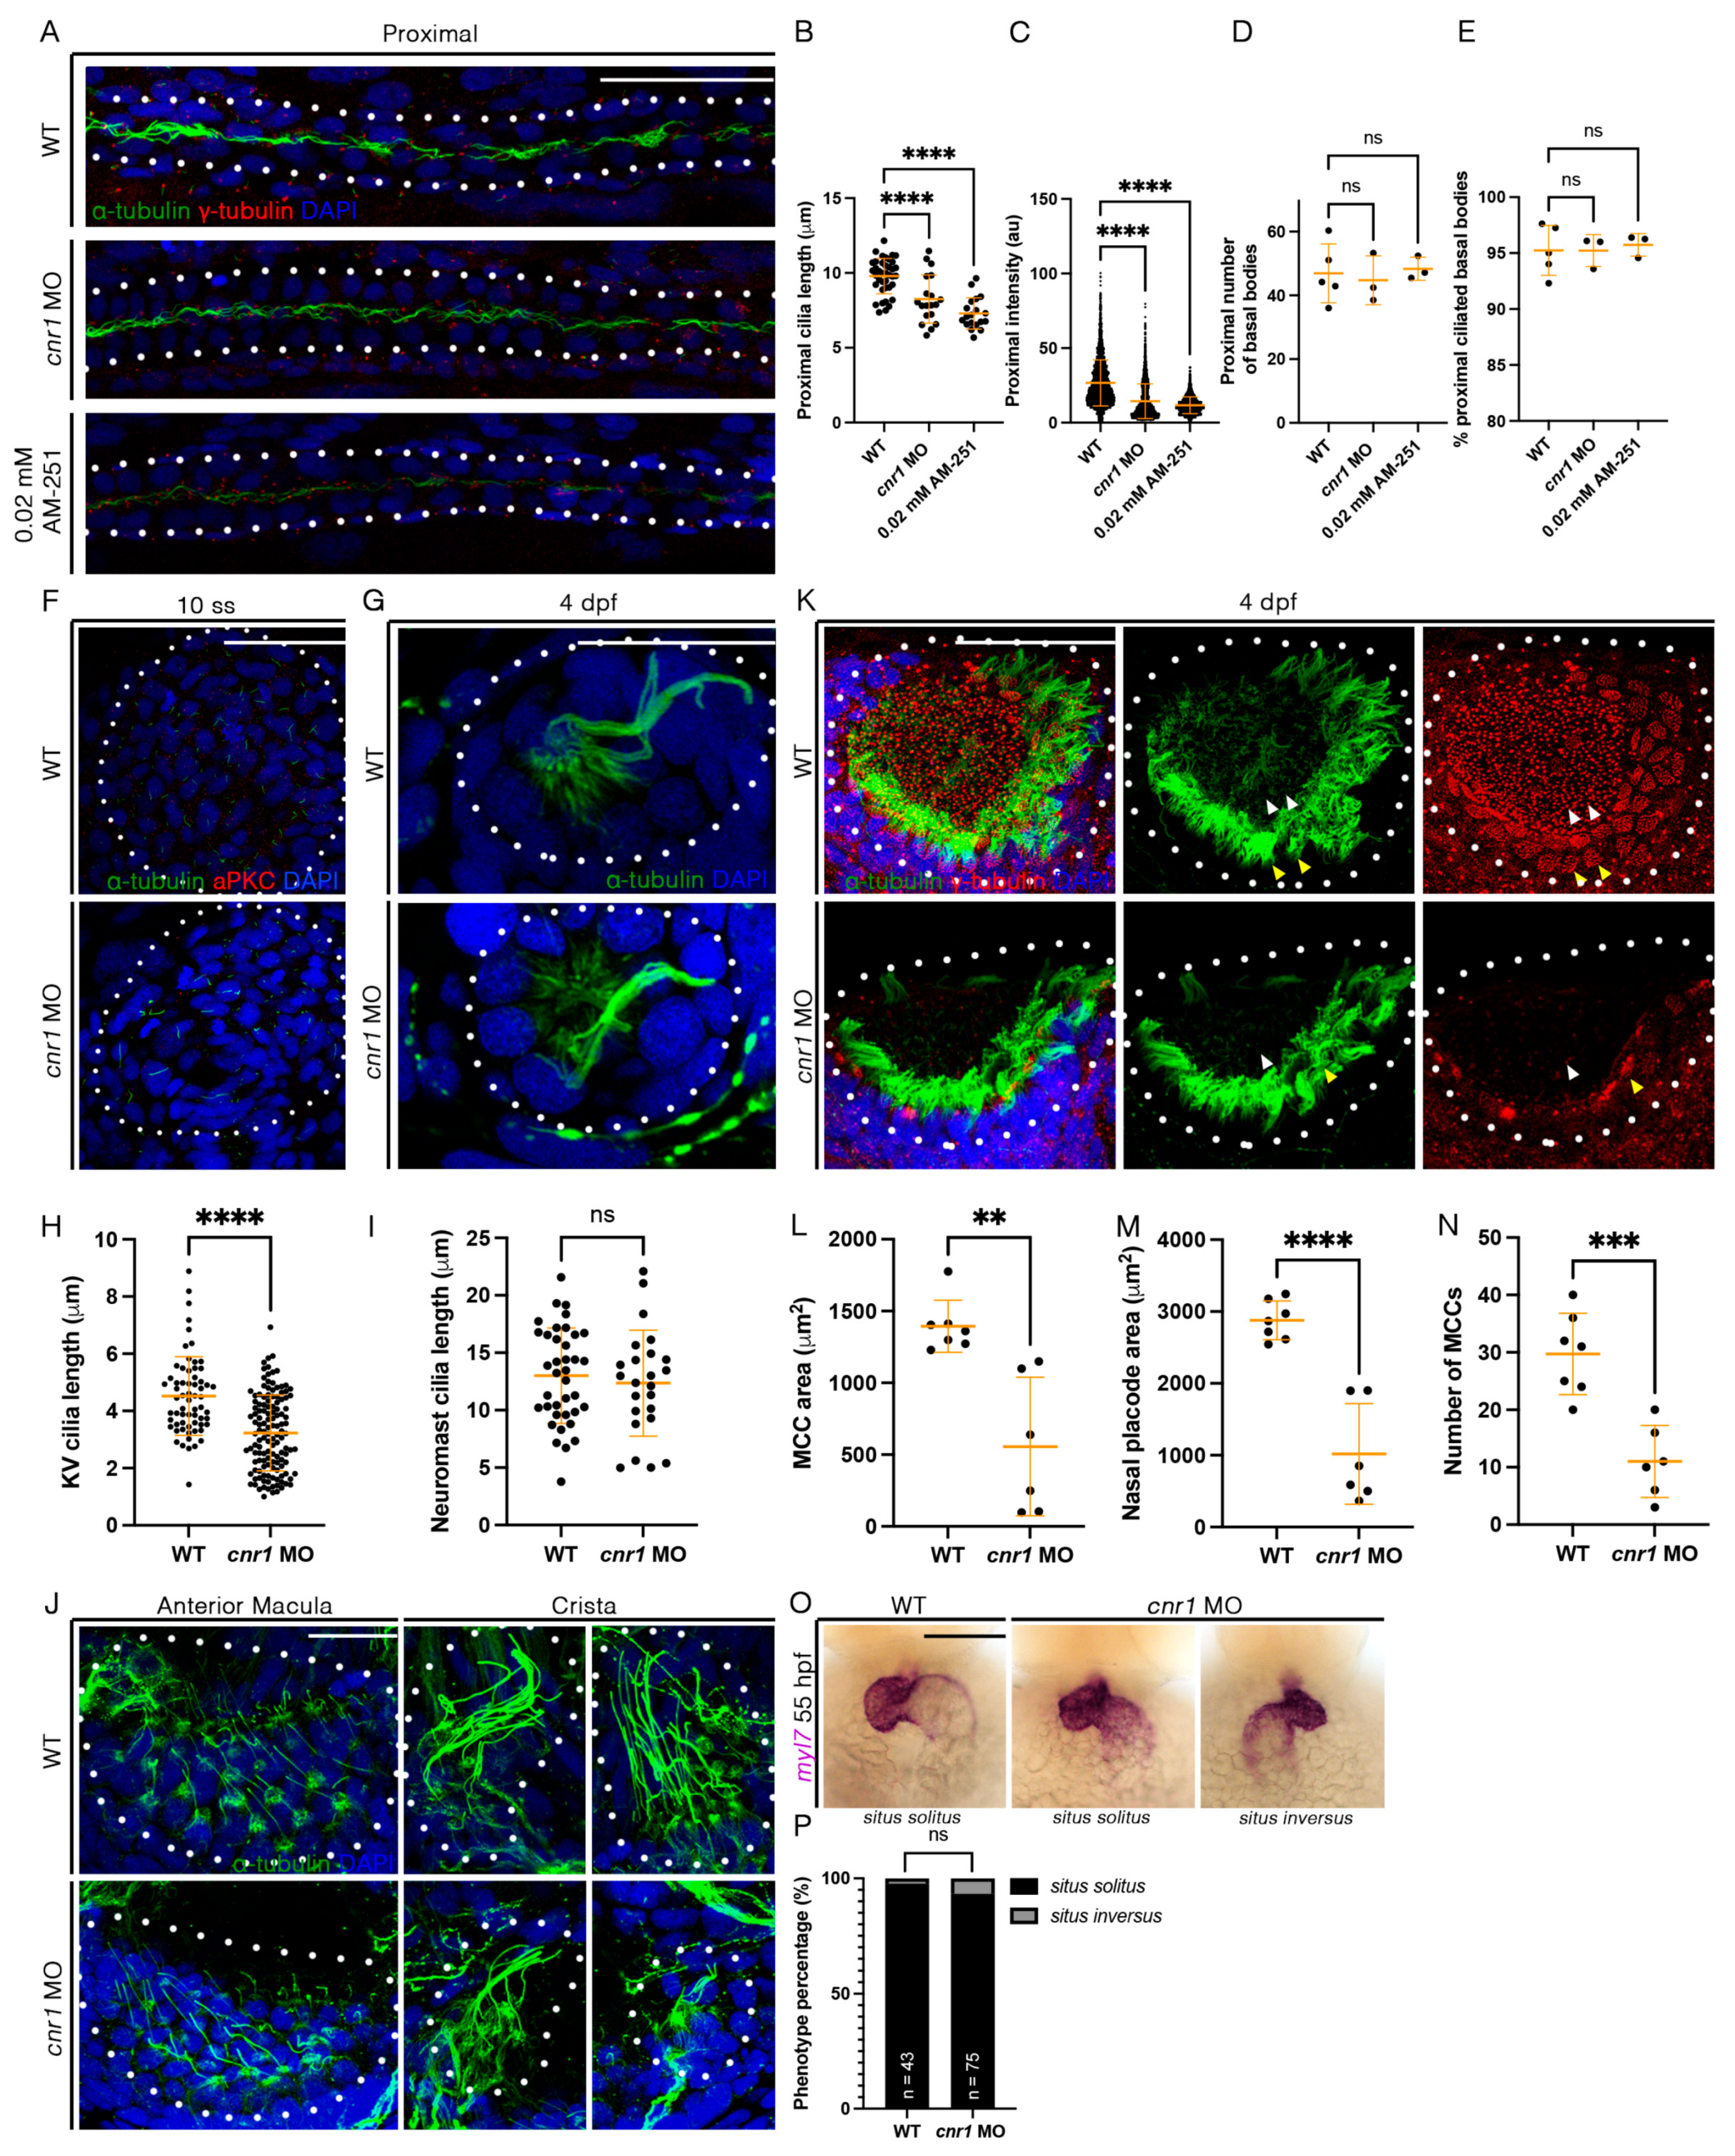
3.5. cnr1 Deficiency Leads to Reduced Cilia Development Across Zebrafish Tissues

Previous studies have indicated that cnr1 is expressed in ciliated tissues, most notably in the MCCs of the cat oviduct as well the brain ependymal cells in rats [29,30]. Given our observed phenotype with a reduction in mature MCCs in embryos treated with 0.02 mM AM-251 and both mature and progenitor MCC states in the pronephros of cnr1 morphants, we next investigated whether the reduction in cilia development occurs across ciliated tissues. First, we performed whole-mount IF to detect α-tubulin, which labels cilia, and γ-tubulin to label basal bodies in the pronephros. Compared to WTs, cnr1 morphants and embryos treated with 0.02 mM AM-251 exhibited a significant reduction in cilia length, as well as intensity of the α-tubulin signal in the proximal pronephros occupied by MCCs (Figure 4A–C) and the distal pronephros, which is mostly occupied with monociliated cells (Figure S4A–C). Interestingly, there were no significant differences in the number of basal bodies and the percentage of ciliated basal bodies in both the proximal and distal segment (Figure 4A,D,E and Figure S4A,D,E). Previous studies have also indicated no significant differences in cilia length and percentage of ciliated basal bodies between WTs and control MOs [41].
Next, we used whole-mount IF to examine cilia development in the KV, an important embryonic organ that serves important roles in L/R patterning. We observed a significant decrease in KV cilia length in cnr1 morphants compared to WTs at 10 ss (Figure 4F,H). We also investigated cilia in the neuromast, a sensory hair cell organ of the lateral line system. Interestingly, there were no significant differences in cilia length between WT and cnr1 morphants at 4 dpf (Figure 4G,I). Additionally, we surveyed cilia and basal bodies in the nasal placode. The zebrafish nasal placode cilia development includes a lateral rim rich in MCCs and an inner core rich in monociliated cells [21]. MCCs have been detected in the nasal placode as early as 18 hpf and frequently from 48 hpf and beyond [49,50,51,52,53].
As we observed a significant decrease in renal MCCs, we hypothesized that the nasal MCCs are also affected. Indeed, we observed a reduction in the area of nasal MCC coverage and the nasal placode area, as well as a reduction in the number of nasal MCCs in cnr1 morphants compared to WTs at 4 dpf (Figure 4K–N). Furthermore, we observed defects in the ear cilia development in cnr1 morphants, including stunted cilia growth in the anterior macula and crista compared to WTs at 4 dpf (Figure 4J). Finally, given our observation that KV cilia are reduced in length in cnr1 morphants, we questioned whether the reduction in KV cilia could be associated with overt morphological defects due to L/R patterning, such as cardiac looping. To investigate this, we performed WISH with WT and cnr1 morphants at 55 hpf using myl7, a cardiac marker. We observed a higher but non-significant percentage of cnr1 morphants with randomized heart looping displaying the situs inversus phenotype than WTs (Figure 4O,P). Taken together, our studies indicate that cnr1 is essential for ciliated cell development across zebrafish embryonic tissues.

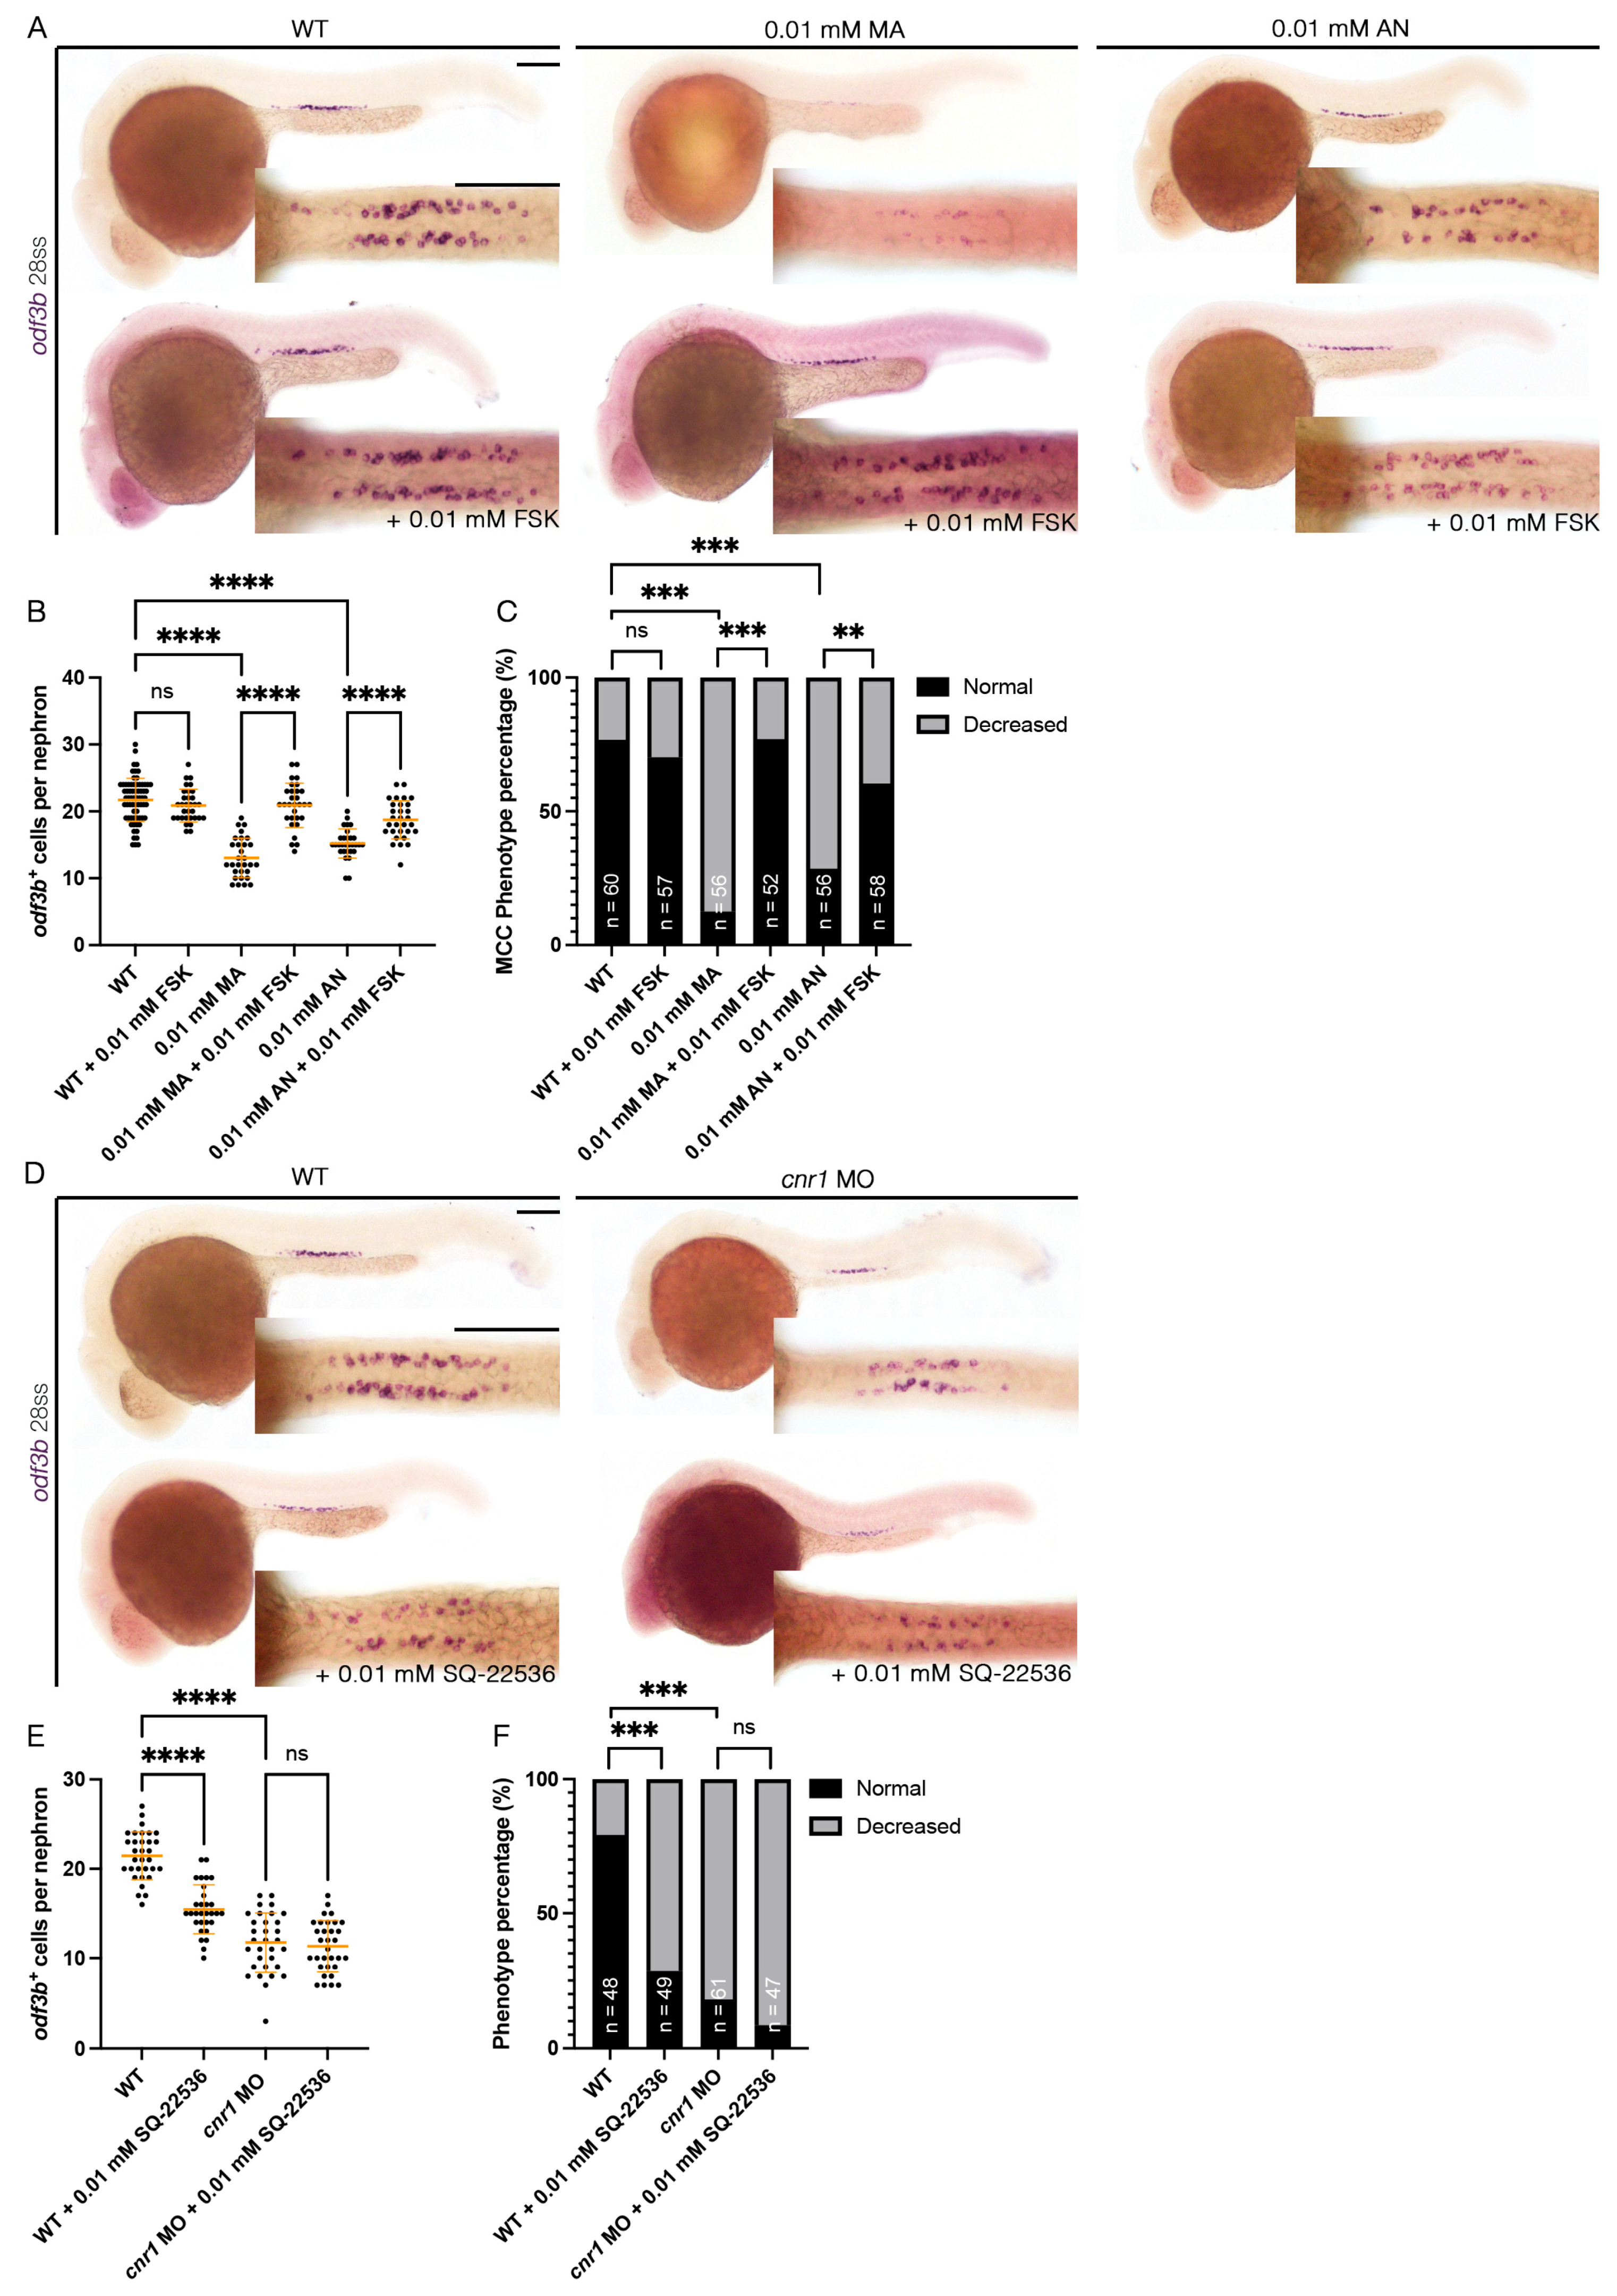
3.6. Forskolin Rescues Renal MCC Reduction in Cnr1 Agonist-Treated Embryos

Cnr1 has been known as a GPCR that inhibits the activity of adenylyl cyclase and thus, eventually, the production of cAMP [1]. Interestingly, previous studies have shown that cAMP is essential for ciliogenesis. For example, ep4 is one of the GPCRs that increases the level of cAMP, and ep4 morphants exhibited ciliogenesis defects such as hydrocephalus, laterality defects and reduction in KV cilia length. Interestingly, the addition of FSK, an adenylyl cyclase activator, partially rescued KV cilia defects and laterality defects [54]. Given our observation that overactivation of cnr1 with agonists led to a decrease in renal MCC development, we hypothesized that cnr1 activation led to the reduction in cAMP signaling that governs renal MCC development. To investigate this possibility, we performed a rescue experiment by co-treatment of Cnr1 agonists and FSK. To generate agonist-treated embryos, we performed drug treatment with either 0.01 mM MA or 0.01 mM AN at the shield stage until 28 ss. To generate rescued embryos, we performed drug treatment with either a combination of 0.01 mM MA and 0.01 mM FSK or a combination of 0.01 mM AN and 0.01 mM FSK at the shield stage until 28 ss. Using the MCC marker odf3b, we observed, as expected, a decrease in the number of odf3b+ cells per nephron with the 0.01 mM MA and 0.01 mM AN treatment group, as well as an increase in ratio of embryos with a decreased MCC phenotype compared to WTs (Figure 5A–C). Interestingly, co-treatment with either a combination of 0.01 mM MA and 0.01 mM FSK or 0.01 mM AN and 0.01 mM FSK rescued the number of odf3b+ cells per nephron, as well as the ratio of embryos with a decreased MCC phenotype, back to WT levels (Figure 5A–C). Treatment of 0.01 mM FSK alone neither led to an increase in the number of odf3b+ cells per nephron nor an increase in embryos with the normal MCC phenotype compared to WTs (Figure 5A–C). Our results indicate that cnr1 likely governs renal MCC development through cAMP signaling.

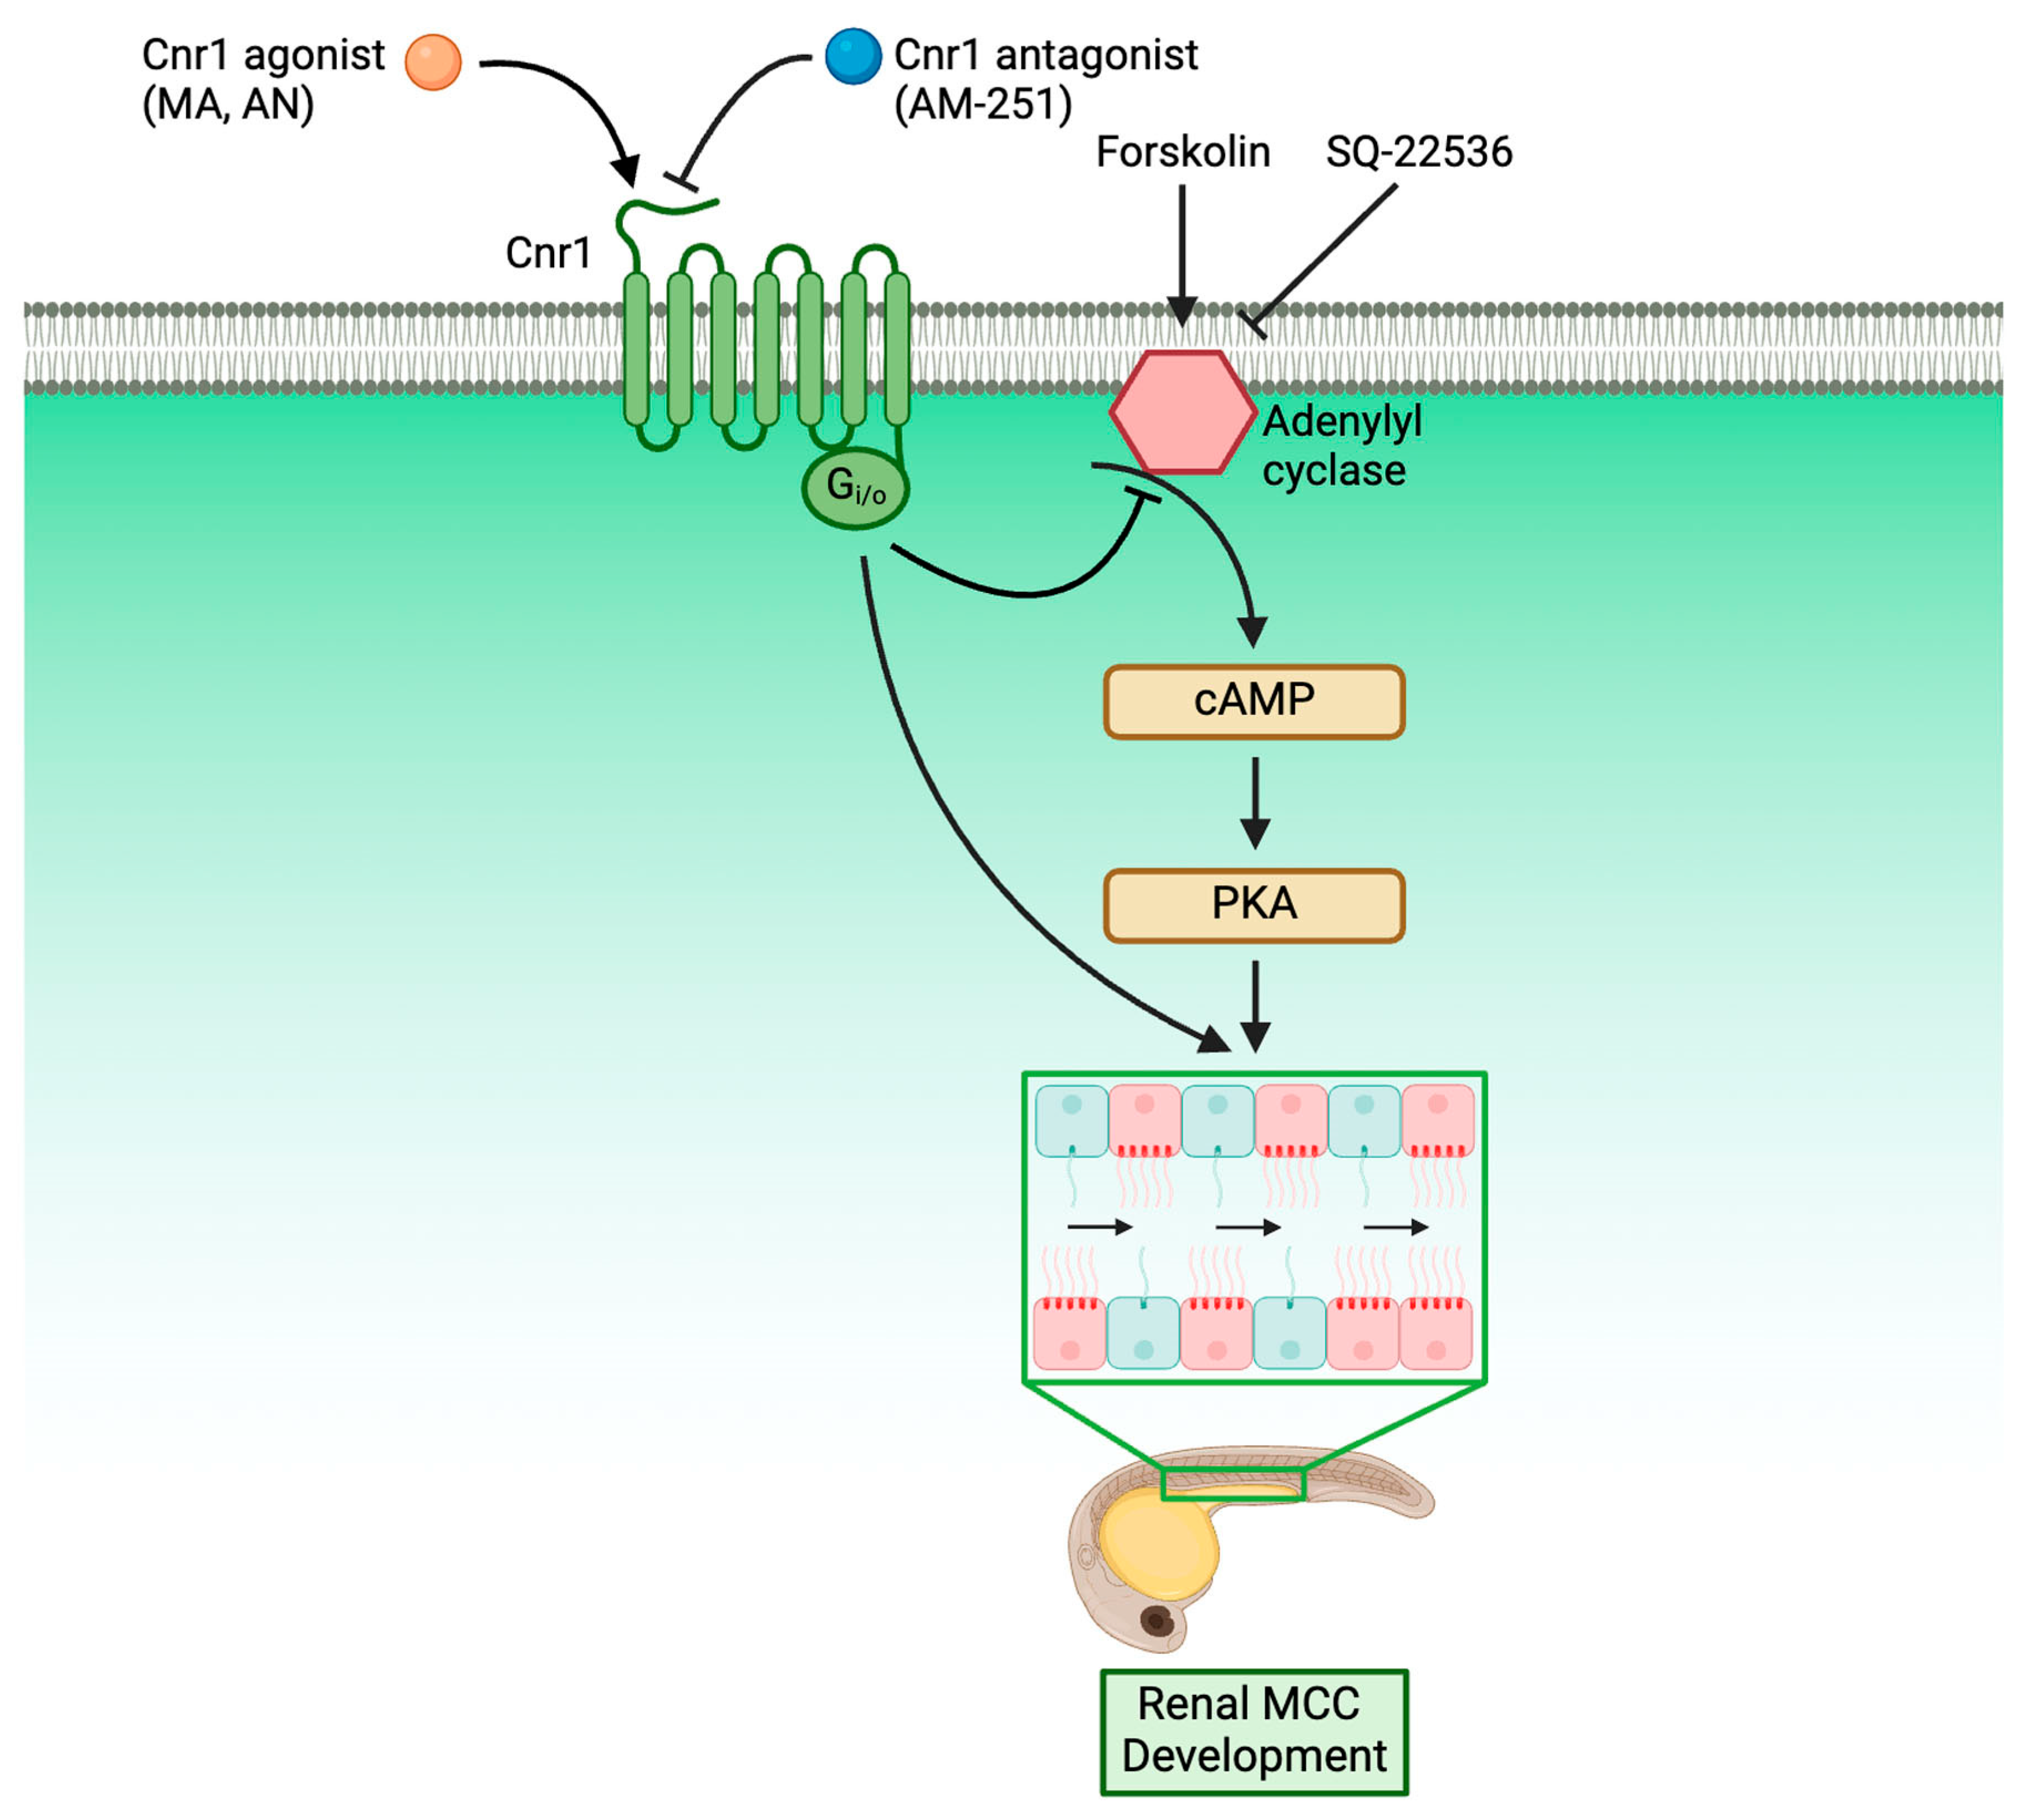
3.7. cnr1 Likely Governs Renal MCC Development via Additional Pathways

In addition to our observation that cnr1 agonism leads to a reduction in renal MCCs in the pronephros, we also observed a reduction in renal MCCs in our cnr1 morphants, which are deficient in Cnr1 protein (Figure 1B–G). As we found that cnr1 governs renal MCC development through cAMP signaling, cnr1 might also influence renal MCC development through other pathways independent of cAMP signaling. On the other hand, the reduction in renal MCCs in our morphants could also be due to increased cAMP levels by reduced blockage of adenylyl cyclase thanks to the deficiency of Cnr1. To investigate this, we utilized an adenylyl cyclase inhibitor previously used in zebrafish, SQ-22536, in tandem with the cnr1 MO [55]. We generated cnr1 morphants by injecting the cnr1 MO at the single-cell stage and performed drug treatment with 0.01 mM SQ-22536 at the shield stage until 28 ss. Using the MCC marker odf3b, we observed a reduction in renal MCC numbers in cnr1 morphants and cnr1 morphants treated with 0.01 mM SQ-22536 (Figure 5D,E). Interestingly, WT embryos treated with 0.01 mM SQ-22536 also exhibited a slight reduction in MCC numbers, in line with our observation that a reduced cAMP level leads to reduced MCC development (Figure 5D,E). cnr1 morphants, cnr1 morphants treated with 0.01 mM SQ-22536 and WT treated with 0.01 mM SQ-22536 all exhibited an increase in embryos with a decreased MCC phenotype compared to WTs (Figure 5F). There was no significant difference in the number of odf3b+ cells per nephron between cnr1 morphants and cnr1 morphants treated with 0.01 mM SQ-22536, suggesting that the effects of the cnr1 MO and SQ-22536 on renal MCCs are likely redundant (Figure 5E). Taken together, our results suggest that cnr1 likely also governs renal MCC development through distinct pathways apart from cAMP signaling.

4. Discussion

An understanding of the molecular genetics underlying cilia development is critical for our understanding of ciliopathies, as cilia are present across many tissues and are responsible for many critical diseases. Within the kidney, knowledge of renal cilia development is even more critical, as renal cilia defects are linked to many renal ciliopathies. However, the majority of research performed in renal ciliopathies has focused on genes and pathways regarding primary cilia [56,57,58]. Meanwhile, renal MCCs, while occurring in many renal disease conditions, have only been historically reported in patient biopsies without much understanding of the molecular genetics underlying their development [24,25,26,27]. In recent years, however, more and more studies have characterized MCC origin and revealed the complex genes and pathways underlying renal MCC development [28,41,42,43,59]. Our work here has further enriched the knowledge of the molecular pathways governing renal MCC development by identifying Cnr1 as a critical regulator for renal MCC development through the use of genetically deficient models and pharmacological approaches. Furthermore, we discovered that Cnr1 is essential for other ciliated tissues, including nasal placode, ear, KV and L/R patterning and neuromasts. We also showed, for the first time, that Cnr1 regulates renal MCC development through the cAMP signaling pathway, as well as independently (Figure 6).
The links between CB1 and kidney diseases, as well as its therapeutic potential for kidney diseases, have been recorded in the literature [1,20,60,61,62]. The majority of studies on the link between CB1 and kidney diseases have been on the over-expression of CB1 in renal conditions and how treatment with CB1 antagonists can reverse these defects. For example, CB1 expression was found to be highly upregulated in the glomeruli in diabetic nephropathy, as well as in renal fibrosis, acute interstitial nephritis and IgA nephropathy [17,62]. Similarly, the CB1 receptor was upregulated in patients with diabetic nephropathy, obesity-related glomerulopathy and focal segmental glomerulosclerosis [63]. In both diabetic mice and rats, the CB1 receptor was overexpressed in the kidney, including the proximal cells, glomeruli and podocytes [64,65,66]. Interestingly, the hybrid CB1 and iNOS antagonist MRI-1867 helped reverse obesity-induced CKD by improving the metabolic profile, kidney morphology and function, inflammation and fibrosis [63]. CB1 blockage by AM-251 ameliorated albuminuria- and diabetes-induced downregulation of podocyte markers [65]. AM-251 also attenuated apoptosis in a model of diabetic nephropathy induced by hyperlipidemia [67]. Similarly, CB1 antagonist SR141716 (also known as Rimonabant) improved insulin resistance and decreased albumin excretion and proinflammatory cytokines in diabetic kidneys [64]. SR141716 also alleviated increased proteinuria, creatinine clearance, renal hypertrophy and injury [68,69]. Pharmacological inhibition with AM-281 and SR141716 and genetic deletion of CB1 also alleviated renal dysfunction, oxidative stress, cell death and inflammatory response in the cisplatin-induced model of nephropathy [70].
In the present report, we provide new research on the use of CB1/Cnr1 antagonists and genetic deficiency in zebrafish kidneys. While our work also provided evidence that upregulation of cnr1 using Cnr1 agonists lead to phenotypes associated with renal defects, such as pericardial edema, delayed PCT coiling and reduced renal MCC populations, we also surprisingly found that Cnr1 blockage using the antagonist AM-251 and genetic deficiency of cnr1 also led to similar renal defects. We theorize that the reduction in renal MCCs observed in both agonist and morpholino/antagonist treatments could be due to divergent reasons. We have shown that reduced renal MCCs induced by Cnr1 agonists were successfully rescued by treatment with FSK, indicating cAMP signaling to be responsible for the phenotypes seen in agonist-treated embryos (Figure 5A–C). On the other hand, we found that treatment with SQ-22536 alone or with a cnr1 MO led to reduction in renal MCC populations (Figure 5D–F). These results indicated that the phenotypes seen in morphant- or antagonist-treated embryos are likely due to independent pathways. Furthermore, the genetic deficiency of cnr1 also led to reduced cilia development across tissues. Our work thus calls for more diverse research on the use of CB1/Cnr1 antagonists and genetic deficiency as treatment, as we have revealed potential kidney defects in the zebrafish model through the use of both approaches.
Previous research has also shown cAMP signaling to be important for cilia development. In primary cilia, many components of cAMP signaling are present [71,72,73,74,75]. Additionally, many genetic factors are localized to the primary cilia, the loss of which causes disturbances in cAMP signaling, leading to ciliopathies and various metabolic defects [76,77,78]. In the kidney, regulation of cAMP is important in autosomal dominant polycystic kidney disease (ADPKD) and water balance disorders. Many genes that encode components of cAMP signaling pathways have been found to be expressed in many kidney tubule segments [79,80].
Previously, it has been shown that the loss of ep4, a GPCR that increases the level of cAMP, led to ciliogenesis defects like hydrocephalus, laterality defects and KV cilia reduction. However, the addition of FSK helped alleviate ciliopathies and restored KV cilia length [54]. On the other hand, overactivation of cAMP with FSK also caused renal cyst development [81]. It was also shown that the addition of cAMP and PKA activator led to an increase in primary cilia length [82]. While the majority of studies on cAMP signaling and cilia have been on primary cilia, our study revealed that cAMP signaling is essential for renal MCC development. Furthermore, we revealed that the reduction in the renal MCC population due to cnr1 agonism could be rescued by FSK treatment, thus elucidating that Cnr1 regulates renal MCC development via cAMP signaling. Our research thus suggests the direction of using the cAMP signaling pathway to treat renal ciliopathies in kidney diseases, many of which exhibit excessive CB1 expression [17,62].
Future studies are necessary to further elucidate the role of CB1/Cnr1 in renal MCC development, particularly the relationship between Cnr1 and prostaglandin signaling in renal MCC development. The prostaglandin molecule PGE2 has been known to be upstream of the GPCR EP4 and cAMP signaling in regulating ciliogenesis [54]. Interestingly, a recent mouse knockout study with CNR1−/− mouse showed an upregulation of PGC-1α, Cox1 and several markers of the prostaglandin signaling pathway [83]. Meanwhile, our lab has uncovered the relationship between many genetic factors and prostaglandin signaling in renal MCC development, thus indicating potentials for further studying the relationship between Cnr1 and prostaglandin signaling in renal MCC development [41,42,43,59]. Additionally, there is evidence on the activity of CB2 in several kidney conditions [84,85,86,87,88,89,90,91,92,93]. Previous studies also indicated that CB2 is expressed in hair cells and regulates cannabinol in ear hair cell development [94,95]. Therefore, it is possible that there might be a relationship between CB1 and CB2 and renal MCC development. Furthermore, there are many growing genetic factors that have been known to play an essential role in renal MCC development, with which CB1 could possibly interact [21].
Overall, our work has further elucidated the role of Cnr1 as a critical factor in renal MCC development and cilia development across organs. We showed that Cnr1 regulates renal MCC development through cAMP signaling, as well as independently. Overall, these findings have greater implications for the understanding of tissue ciliogenesis, renal ciliopathies and overall renal diseases at large.

5. Conclusions

Renal ciliopathy research is a vital area of ongoing study, and the important work of many investigators has delineated genes that play important fundamental roles in cilia development. However, the breadth and depth of studies on genes controlling renal primary cilia [58] has been much larger and more intricate than genes controlling renal MCCs [21,87]. Furthermore, while many signaling pathways have been implicated in kidney diseases, including endocannabinoid signaling and the Cnr1 receptor, there has been comparatively less knowledge concerning their relationship with renal cilia development. Through our study, we elucidated new insights into the roles of the Cnr1 receptor in renal cilia development, highlighting, for the first time, that Cnr1 regulates renal MCC development via cAMP signaling, as well as independently. We also highlighted the previously unknown role of Cnr1 in cilia development across zebrafish tissues. Our work thus further elevated our understanding of the role of Cnr1 in renal cilia, especially MCC development, further elucidating the connection between Cnr1 and the endocannabinoid signaling pathway as a whole to kidney diseases. Furthermore, our discovery that Cnr1 regulates renal MCC via cAMP signaling reveals the potential for future studies to explore and discover therapeutic treatments for renal ciliopathies.

Supplementary Materials

The following supporting information can be downloaded at: https://www.mdpi.com/article/10.3390/jdb13020020/s1, Figure S1: Characterization of PCT coiling between treatments and the effect of cnr1 deficiency on renal segments; Figure S2: Effect of cnr1 agonism on renal segments; Figure S3: Effect of cnr1 antagonism on renal segments; Figure S4: Loss of cnr1 leads to reduced cilia in distal pronephros; Table S1: Reagents and resources used in this study.

Author Contributions

Conceptualization: T.K.N., S.B., L.A. and R.A.W.; methodology: T.K.N., S.B. and L.A.; investigation: T.K.N., S.B., J.A., L.A., S.K. and B.F.; formal analyses: T.K.N., S.B., L.A., S.K., B.F. and M.R.H.; resources: R.A.W.; writing: T.K.N. and R.A.W.; visualization: T.K.N.; supervision and funding: T.K.N. and R.A.W.; writing—review and editing: T.K.N. and R.A.W. All authors have read and agreed to the published version of the manuscript.

Funding

This work was supported by a 2024–2025 University of Notre Dame Berry Family Foundation Graduate Fellowship to T.K.N.; University of Notre Dame Graduate School Teaching Fellowships to T.K.N., S.B. and L.A.; University of Notre Dame Graduate School Arthur J. Schmitt Leadership Fellowship to M.R.H.; 2022 and 2023 University of Notre Dame College of Science Summer Undergraduate Research Fellowships to S.B.; 2024 University of Notre Dame Center for Stem Cells and Regenerative Medicine Undergraduate Summer Fellowship to S.K.; and funds to R.A.W. from the Gallagher Family in support of stem cell research.

Institutional Review Board Statement

The animal study protocol was approved by the University of Notre Dame Institutional Animal Care and Use Committee (IACUC), under protocol numbers 19-06-5412, approved 12 October 2021, and 22-07-7335, approved 21 December 2023.

Informed Consent Statement

Not applicable.

Data Availability Statement

All data are provided in the paper or in the Supplementary Files.

Acknowledgments

We thank the staff of the Department of Biological Sciences for support and the Center for Zebrafish Research at the University of Notre Dame for exceptional care of our zebrafish system. We thank the Notre Dame Integrated Imaging Facility for providing access to incredible microscopes that allowed us to take several images from this article, especially Sara Cole for her incredible expertise and guidance. We are grateful to the members of the Wingert Lab for critical feedback on this work and their continual inspiration. T.K.N. would like to thank R.A.W. for her incredible mentorship. R.A.W. would like to thank R.T.M.W. for his boundless support.

Conflicts of Interest

The authors declare no conflicts of interest.

References

  1. Arceri, L.; Nguyen, T.K.; Gibson, S.; Baker, S.; Wingert, R.A. Cannabinoid Signaling in Kidney Disease. Cells 2023, 12, 1419. [Google Scholar] [CrossRef] [PubMed]
  2. Howlett, A.C.; Barth, F.; Bonner, T.I.; Cabral, G.; Casellas, P.; Devane, W.A.; Felder, C.C.; Herkenham, M.; Mackie, K.; Martin, B.R.; et al. International Union of Pharmacology. XXVII. Classification of Cannabinoid Receptors. Pharmacol. Rev. 2002, 54, 161–202. [Google Scholar] [CrossRef]
  3. Kendall, D.A.; Yudowski, G.A. Cannabinoid Receptors in the Central Nervous System: Their Signaling and Roles in Disease. Front. Cell Neurosci. 2016, 10, 294. [Google Scholar] [CrossRef]
  4. Allam, S.; Paris, E.; Lazcano, I.; Bitterman, P.; Basu, S.; O’Donnell, J.; Barua, A. Detection of Cannabinoid Receptor Expression by Endometriotic Lesions in Women with Endometriosis as an Alternative to Opioid-Based Pain Medication. J. Immunol. Res. 2022, 2022, 4323259. [Google Scholar] [CrossRef] [PubMed]
  5. Dao, M.; François, H. Cannabinoid Receptor 1 Inhibition in Chronic Kidney Disease: A New Therapeutic Toolbox. Front. Endocrinol. 2021, 12, 720734. [Google Scholar] [CrossRef] [PubMed]
  6. Hasenoehrl, C.; Taschler, U.; Storr, M.; Schicho, R. The Gastrointestinal Tract—A Central Organ of Cannabinoid Signaling in Health and Disease. Neurogastroenterol. Motil. 2016, 28, 1765–1780. [Google Scholar] [CrossRef]
  7. Haspula, D.; Clark, M.A. Cannabinoid Receptors: An Update on Cell Signaling, Pathophysiological Roles and Therapeutic Opportunities in Neurological, Cardiovascular, and Inflammatory Diseases. Int. J. Mol. Sci. 2020, 21, 7693. [Google Scholar] [CrossRef]
  8. Osei-Hyiaman, D.; DePetrillo, M.; Pacher, P.; Liu, J.; Radaeva, S.; Bátkai, S.; Harvey-White, J.; Mackie, K.; Offertáler, L.; Wang, L.; et al. Endocannabinoid Activation at Hepatic CB1 Receptors Stimulates Fatty Acid Synthesis and Contributes to Diet-Induced Obesity. J. Clin. Investig. 2005, 115, 1298–1305. [Google Scholar] [CrossRef]
  9. Dalle, S.; Koppo, K. Cannabinoid Receptor 1 Expression Is Higher in Muscle of Old vs. Young Males, and Increases upon Resistance Exercise in Older Adults. Sci. Rep. 2021, 11, 18349. [Google Scholar] [CrossRef]
  10. Zottola, A.C.P.; Severi, I.; Cannich, A.; Ciofi, P.; Cota, D.; Marsicano, G.; Giordano, A.; Bellocchio, L. Expression of Functional Cannabinoid Type-1 (CB1) Receptor in Mitochondria of White Adipocytes. Cells 2022, 11, 2582. [Google Scholar] [CrossRef]
  11. Liu, J.; Gao, B.; Mirshahi, F.; Sanyal, A.J.; Khanolkar, A.D.; Makriyannis, A.; Kunos, G. Functional CB1 Cannabinoid Receptors in Human Vascular Endothelial Cells. Biochem. J. 2000, 346, 835–840. [Google Scholar] [CrossRef] [PubMed]
  12. Puhl, S.-L. Cannabinoid-Sensitive Receptors in Cardiac Physiology and Ischaemia. Biochim. Biophys. Acta (BBA)—Mol. Cell Res. 2020, 1867, 118462. [Google Scholar] [CrossRef] [PubMed]
  13. Drori, A.; Permyakova, A.; Hadar, R.; Udi, S.; Nemirovski, A.; Tam, J. Cannabinoid-1 Receptor Regulates Mitochondrial Dynamics and Function in Renal Proximal Tubular Cells. Diabetes Obes. Metab. 2019, 21, 146–159. [Google Scholar] [CrossRef]
  14. Larrinaga, G.; Varona, A.; Pérez, I.; Sanz, B.; Ugalde, A.; Cándenas, M.L.; Pinto, F.M.; Gil, J.; López, J.I. Expression of Cannabinoid Receptors in Human Kidney. Histol. Histopathol. 2010, 25, 1133–1138. [Google Scholar] [CrossRef] [PubMed]
  15. Koura, Y.; Ichihara, A.; Tada, Y.; Kaneshiro, Y.; Okada, H.; Temm, C.J.; Hayashi, M.; Saruta, T. Anandamide Decreases Glomerular Filtration Rate through Predominant Vasodilation of Efferent Arterioles in Rat Kidneys. J. Am. Soc. Nephrol. 2004, 15, 1488. [Google Scholar] [CrossRef]
  16. Lin, C.-L.; Hsu, Y.-C.; Lee, P.-H.; Lei, C.-C.; Wang, J.-Y.; Huang, Y.-T.; Wang, S.-Y.; Wang, F.-S. Cannabinoid Receptor 1 Disturbance of PPARγ2 Augments Hyperglycemia Induction of Mesangial Inflammation and Fibrosis in Renal Glomeruli. J. Mol. Med. 2014, 92, 779–792. [Google Scholar] [CrossRef]
  17. Lecru, L.; Desterke, C.; Grassin-Delyle, S.; Chatziantoniou, C.; Vandermeersch, S.; Devocelle, A.; Vernochet, A.; Ivanovski, N.; Ledent, C.; Ferlicot, S.; et al. Cannabinoid Receptor 1 Is a Major Mediator of Renal Fibrosis. Kidney Int. 2015, 88, 72–84. [Google Scholar] [CrossRef]
  18. Oltrabella, F.; Melgoza, A.; Nguyen, B.; Guo, S. Role of the Endocannabinoid System in Vertebrates: Emphasis on the Zebrafish Model. Dev. Growth Differ. 2017, 59, 194–210. [Google Scholar] [CrossRef]
  19. Liu, L.Y.; Alexa, K.; Cortes, M.; Schatzman-Bone, S.; Kim, A.J.; Mukhopadhyay, B.; Cinar, R.; Kunos, G.; North, T.E.; Goessling, W. Cannabinoid Receptor Signaling Regulates Liver Development and Metabolism. Development 2016, 143, 609–622. [Google Scholar] [CrossRef]
  20. Tam, J. The Emerging Role of the Endocannabinoid System in the Pathogenesis and Treatment of Kidney Diseases. J. Basic Clin. Physiol. Pharmacol. 2016, 27, 267–276. [Google Scholar] [CrossRef]
  21. Nguyen, T.K.; Baker, S.; Rodriguez, J.-M.; Arceri, L.; Wingert, R.A. Using Zebrafish to Study Multiciliated Cell Development and Disease States. Cells 2024, 13, 1749. [Google Scholar] [CrossRef] [PubMed]
  22. Nguyen, T.K.; Petrikas, M.; Chambers, B.E.; Wingert, R.A. Principles of Zebrafish Nephron Segment Development. J. Dev. Biol. 2023, 11, 14. [Google Scholar] [CrossRef]
  23. Bertram, J.F.; Douglas-Denton, R.N.; Diouf, B.; Hughson, M.D.; Hoy, W.E. Human Nephron Number: Implications for Health and Disease. Pediatr. Nephrol. 2011, 26, 1529–1533. [Google Scholar] [CrossRef] [PubMed]
  24. Duffy, J.L.; Suzuki, Y. Ciliated Human Renal Proximal Tubular Cells. Observations in Three Cases of Hypercalcemia. Am. J. Pathol. 1968, 53, 609. [Google Scholar]
  25. Larsen, T.E.; Ghadially, F.N. Cilia in Lupus Nephritis. J. Pathol. 1974, 114, 69–73. [Google Scholar] [CrossRef] [PubMed]
  26. Katz, S.M.; Morgan, J.J. Cilia in the Human Kidney. Ultrastruct. Pathol. 1984, 6, 285–294. [Google Scholar] [CrossRef]
  27. Lungarella, G.; de Santi, M.M.; Tosi, P. Ultrastructural Study of the Ciliated Cells from Renal Tubular Epithelium in Acute Progressive Glomerulonephritis. Ultrastruct. Pathol. 1984, 6, 1–7. [Google Scholar] [CrossRef]
  28. Eymael, J.; Willemsen, B.; Xu, J.; Mooren, F.; Steenbergen, E.; Wetzels, J.F.; Dijkman, H.; Jansen, J.; Van der Vlag, J.; Smeets, B. Motile Cilia on Kidney Proximal Tubular Epithelial Cells Are Associated With Tubular Injury and Interstitial Fibrosis. Front. Cell Dev. Biol. 2022, 10, 765887. [Google Scholar] [CrossRef]
  29. Arévalo-Martín, Á.; García-Ovejero, D.; Rubio-Araiz, A.; Gómez, O.; Molina-Holgado, F.; Molina-Holgado, E. Cannabinoids Modulate Olig2 and Polysialylated Neural Cell Adhesion Molecule Expression in the Subventricular Zone of Post-Natal Rats through Cannabinoid Receptor 1 and Cannabinoid Receptor 2. Eur. J. Neurosci. 2007, 26, 1548–1559. [Google Scholar] [CrossRef]
  30. Pirone, A.; Lenzi, C.; Briganti, A.; Abbate, F.; Levanti, M.; Abramo, F.; Miragliotta, V. Spatial Distribution of Cannabinoid Receptor 1 and Fatty Acid Amide Hydrolase in the Cat Ovary and Oviduct. Acta Histochem. 2017, 119, 417–422. [Google Scholar] [CrossRef]
  31. Kimmel, C.B.; Ballard, W.W.; Kimmel, S.R.; Ullmann, B.; Schilling, T.F. Stages of Embryonic Development of the Zebrafish. Dev. Dyn. 1995, 203, 253–310. [Google Scholar] [CrossRef] [PubMed]
  32. Galloway, J.L.; Wingert, R.A.; Thisse, C.; Thisse, B.; Zon, L.I. Combinatorial Regulation of Novel Erythroid Gene Expression in Zebrafish. Exp. Hematol. 2008, 36, 424–432. [Google Scholar] [CrossRef] [PubMed]
  33. Lengerke, C.; Wingert, R.; Beeretz, M.; Grauer, M.; Schmidt, A.G.; Konantz, M.; Daley, G.Q.; Davidson, A.J. Interactions between Cdx Genes and Retinoic Acid Modulate Early Cardiogenesis. Dev. Biol. 2011, 354, 134–142. [Google Scholar] [CrossRef] [PubMed]
  34. Cheng, C.N.; Li, Y.; Marra, A.N.; Verdun, V.; Wingert, R.A. Flat Mount Preparation for Observation and Analysis of Zebrafish Embryo Specimens Stained by Whole Mount In Situ Hybridization. J. Vis. Exp. JoVE 2014, e51604. [Google Scholar] [CrossRef]
  35. Wingert, R.A.; Selleck, R.; Yu, J.; Song, H.-D.; Chen, Z.; Song, A.; Zhou, Y.; Thisse, B.; Thisse, C.; McMahon, A.P.; et al. The Cdx Genes and Retinoic Acid Control the Positioning and Segmentation of the Zebrafish Pronephros. PLoS Genet. 2007, 3, 1922–1938. [Google Scholar] [CrossRef]
  36. O’Brien, L.L.; Grimaldi, M.; Kostun, Z.; Wingert, R.A.; Selleck, R.; Davidson, A.J. Wt1a, Foxc1a, and the Notch Mediator Rbpj Physically Interact and Regulate the Formation of Podocytes in Zebrafish. Dev. Biol. 2011, 358, 318–330. [Google Scholar] [CrossRef]
  37. Gerlach, G.F.; Wingert, R.A. Zebrafish Pronephros Tubulogenesis and Epithelial Identity Maintenance Are Reliant on the Polarity Proteins Prkc Iota and Zeta. Dev. Biol. 2014, 396, 183–200. [Google Scholar] [CrossRef]
  38. Watson, S.; Chambers, D.; Hobbs, C.; Doherty, P.; Graham, A. The Endocannabinoid Receptor, CB1, Is Required for Normal Axonal Growth and Fasciculation. Mol. Cell. Neurosci. 2008, 38, 89–97. [Google Scholar] [CrossRef]
  39. Zuccarini, G.; D’Atri, I.; Cottone, E.; Mackie, K.; Shainer, I.; Gothilf, Y.; Provero, P.; Bovolin, P.; Merlo, G.R. Interference with the Cannabinoid Receptor CB1R Results in Miswiring of GnRH3 and AgRP1 Axons in Zebrafish Embryos. Int. J. Mol. Sci. 2020, 21, 168. [Google Scholar] [CrossRef]
  40. Zhou, F.; Rayamajhi, D.; Ravi, V.; Narasimhan, V.; Chong, Y.L.; Lu, H.; Venkatesh, B.; Roy, S. Conservation as Well as Divergence in Mcidas Function Underlies the Differentiation of Multiciliated Cells in Vertebrates. Dev. Biol. 2020, 465, 168–177. [Google Scholar] [CrossRef]
  41. Chambers, J.M.; Addiego, A.; Flores-Mireles, A.L.; Wingert, R.A. Ppargc1a Controls Ciliated Cell Development by Regulating Prostaglandin Biosynthesis. Cell Rep. 2020, 33, 108370. [Google Scholar] [CrossRef] [PubMed]
  42. Wesselman, H.M.; Flores-Mireles, A.L.; Bauer, A.; Pei, L.; Wingert, R.A. Esrrγa Regulates Nephron and Ciliary Development by Controlling Prostaglandin Synthesis. Development 2023, 150, dev201411. [Google Scholar] [CrossRef]
  43. Nguyen, T.K.; Rodriguez, J.-M.; Wesselman, H.M.; Wingert, R.A. Emx2 Is an Essential Regulator of Ciliated Cell Development across Embryonic Tissues. iScience 2024, 27, 111271. [Google Scholar] [CrossRef]
  44. Poureetezadi, S.J.; Cheng, C.N.; Chambers, J.M.; Drummond, B.E.; Wingert, R.A. Prostaglandin Signaling Regulates Nephron Segment Patterning of Renal Progenitors during Zebrafish Kidney Development. eLife 2016, 5, e17551. [Google Scholar] [CrossRef] [PubMed]
  45. Holm, S. A Simple Sequentially Rejective Multiple Test Procedure. Scand. J. Stat. 1979, 6, 65–70. [Google Scholar]
  46. Abadji, V.; Lin, S.; Taha, G.; Griffin, G.; Stevenson, L.A.; Pertwee, R.G.; Makriyannis, A. (R)-Methanandamide: A Chiral Novel Anandamide Possessing Higher Potency and Metabolic Stability. J. Med. Chem. 1994, 37, 1889–1893. [Google Scholar] [CrossRef] [PubMed]
  47. Seely, K.A.; Brents, L.K.; Franks, L.N.; Rajasekaran, M.; Zimmerman, S.M.; Fantegrossi, W.E.; Prather, P.L. AM-251 and Rimonabant Act as Direct Antagonists at Mu-Opioid Receptors: Implications for Opioid/Cannabinoid Interaction Studies. Neuropharmacology 2012, 63, 905–915. [Google Scholar] [CrossRef]
  48. Wesselman, H.M.; Nguyen, T.K.; Chambers, J.M.; Drummond, B.E.; Wingert, R.A. Advances in Understanding the Genetic Mechanisms of Zebrafish Renal Multiciliated Cell Development. J. Dev. Biol. 2023, 11, 1. [Google Scholar] [CrossRef]
  49. Wang, L.; Fu, C.; Fan, H.; Du, T.; Dong, M.; Chen, Y.; Jin, Y.; Zhou, Y.; Deng, M.; Gu, A.; et al. miR-34b Regulates Multiciliogenesis during Organ Formation in Zebrafish. Development 2013, 140, 2755–2764. [Google Scholar] [CrossRef]
  50. Zhou, F.; Narasimhan, V.; Shboul, M.; Chong, Y.L.; Reversade, B.; Roy, S. Gmnc Is a Master Regulator of the Multiciliated Cell Differentiation Program. Curr. Biol. 2015, 25, 3267–3273. [Google Scholar] [CrossRef]
  51. Pathak, N.; Obara, T.; Mangos, S.; Liu, Y.; Drummond, I.A. The Zebrafish Fleer Gene Encodes an Essential Regulator of Cilia Tubulin Polyglutamylation. MBoC 2007, 18, 4353–4364. [Google Scholar] [CrossRef] [PubMed]
  52. Delaval, B.; Covassin, L.; Lawson, N.D.; Doxsey, S. Centrin Depletion Causes Cyst Formation and Other Ciliopathy-Related Phenotypes in Zebrafish. Cell Cycle 2011, 10, 3964–3972. [Google Scholar] [CrossRef] [PubMed]
  53. Chong, Y.L.; Zhang, Y.; Zhou, F.; Roy, S. Distinct Requirements of E2f4 versus E2f5 Activity for Multiciliated Cell Development in the Zebrafish Embryo. Dev. Biol. 2018, 443, 165–172. [Google Scholar] [CrossRef]
  54. Jin, D.; Ni, T.T.; Sun, J.; Wan, H.; Amack, J.D.; Yu, G.; Fleming, J.; Chiang, C.; Li, W.; Papierniak, A.; et al. Prostaglandin Signaling Regulates Ciliogenesis by Modulating Intraflagellar Transport. Nat. Cell Biol. 2014, 16, 841–851. [Google Scholar] [CrossRef]
  55. Ramos, B.C.R.; Moraes, M.N.C.M.; Poletini, M.O.; Lima, L.H.R.G.; Castrucci, A.M.L. From Blue Light to Clock Genes in Zebrafish ZEM-2S Cells. PLoS ONE 2014, 9, e106252. [Google Scholar] [CrossRef]
  56. Dell, K.M. The Role of Cilia in the Pathogenesis of Cystic Kidney Disease. Curr. Opin. Pediatr. 2015, 27, 212–218. [Google Scholar] [CrossRef]
  57. Ma, M. Cilia and Polycystic Kidney Disease. Semin. Cell Dev. Biol. 2021, 110, 139–148. [Google Scholar] [CrossRef] [PubMed]
  58. McConnachie, D.J.; Stow, J.L.; Mallett, A.J. Ciliopathies and the Kidney: A Review. Am. J. Kidney Dis. 2021, 77, 410–419. [Google Scholar] [CrossRef]
  59. Marra, A.N.; Adeeb, B.D.; Chambers, B.E.; Drummond, B.E.; Ulrich, M.; Addiego, A.; Springer, M.; Poureetezadi, S.J.; Chambers, J.M.; Ronshaugen, M.; et al. Prostaglandin Signaling Regulates Renal Multiciliated Cell Specification and Maturation. Proc. Natl. Acad. Sci. USA 2019, 116, 8409–8418. [Google Scholar] [CrossRef]
  60. Park, F.; Potukuchi, P.K.; Moradi, H.; Kovesdy, C.P. Cannabinoids and the Kidney: Effects in Health and Disease. Am. J. Physiol. -Ren. Physiol. 2017, 313, F1124–F1132. [Google Scholar] [CrossRef]
  61. Chua, J.T.; Argueta, D.A.; DiPatrizio, N.V.; Kovesdy, C.P.; Vaziri, N.D.; Kalantar-Zadeh, K.; Moradi, H. Endocannabinoid System and the Kidneys: From Renal Physiology to Injury and Disease. Cannabis Cannabinoid Res. 2019, 4, 10–20. [Google Scholar] [CrossRef] [PubMed]
  62. Jourdan, T.; Szanda, G.; Rosenberg, A.Z.; Tam, J.; Earley, B.J.; Godlewski, G.; Cinar, R.; Liu, Z.; Liu, J.; Ju, C.; et al. Overactive Cannabinoid 1 Receptor in Podocytes Drives Type 2 Diabetic Nephropathy. Proc. Natl. Acad. Sci. USA 2014, 111, E5420–E5428. [Google Scholar] [CrossRef]
  63. Udi, S.; Hinden, L.; Ahmad, M.; Drori, A.; Iyer, M.R.; Cinar, R.; Herman-Edelstein, M.; Tam, J. Dual Inhibition of Cannabinoid CB1 Receptor and Inducible NOS Attenuates Obesity-Induced Chronic Kidney Disease. Br. J. Pharmacol. 2020, 177, 110–127. [Google Scholar] [CrossRef] [PubMed]
  64. Nam, D.H.; Lee, M.H.; Kim, J.E.; Song, H.K.; Kang, Y.S.; Lee, J.E.; Kim, H.W.; Cha, J.J.; Hyun, Y.Y.; Kim, S.H.; et al. Blockade of Cannabinoid Receptor 1 Improves Insulin Resistance, Lipid Metabolism, and Diabetic Nephropathy in Db/Db Mice. Endocrinology 2012, 153, 1387–1396. [Google Scholar] [CrossRef]
  65. Barutta, F.; Corbelli, A.; Mastrocola, R.; Gambino, R.; Di Marzo, V.; Pinach, S.; Rastaldi, M.P.; Perin, P.C.; Gruden, G. Cannabinoid Receptor 1 Blockade Ameliorates Albuminuria in Experimental Diabetic Nephropathy. Diabetes 2010, 59, 1046–1054. [Google Scholar] [CrossRef]
  66. Jenkin, K.A.; McAinch, A.J.; Zhang, Y.; Kelly, D.J.; Hryciw, D.H. Elevated Cannabinoid Receptor 1 and G Protein-Coupled Receptor 55 Expression in Proximal Tubule Cells and Whole Kidney Exposed to Diabetic Conditions. Clin. Exp. Pharmacol. Physiol. 2015, 42, 256–262. [Google Scholar] [CrossRef] [PubMed]
  67. Lim, J.c.; Lim, S.k.; Han, H.j.; Park, S.h. Cannabinoid Receptor 1 Mediates Palmitic Acid-Induced Apoptosis via Endoplasmic Reticulum Stress in Human Renal Proximal Tubular Cells. J. Cell. Physiol. 2010, 225, 654–663. [Google Scholar] [CrossRef]
  68. Janiak, P.; Poirier, B.; Bidouard, J.-P.; Cadrouvele, C.; Pierre, F.; Gouraud, L.; Barbosa, I.; Dedio, J.; Maffrand, J.-P.; Le Fur, G.; et al. Blockade of Cannabinoid CB1 Receptors Improves Renal Function, Metabolic Profile, and Increased Survival of Obese Zucker Rats. Kidney Int. 2007, 72, 1345–1357. [Google Scholar] [CrossRef] [PubMed]
  69. Zhao, L.; Liu, T.; Dou, Z.; Wang, M.; Hu, Z.; Wang, B. CB1 Receptor Antagonist Rimonabant Protects against Chronic Intermittent Hypoxia-Induced Renal Injury in Rats. BMC Nephrol. 2021, 22, 153. [Google Scholar] [CrossRef]
  70. Mukhopadhyay, P.; Pan, H.; Rajesh, M.; Bátkai, S.; Patel, V.; Harvey-White, J.; Mukhopadhyay, B.; Haskó, G.; Gao, B.; Mackie, K.; et al. CB1 Cannabinoid Receptors Promote Oxidative/Nitrosative Stress, Inflammation and Cell Death in a Murine Nephropathy Model. Br. J. Pharmacol. 2010, 160, 657–668. [Google Scholar] [CrossRef]
  71. Mick, D.U.; Rodrigues, R.B.; Leib, R.D.; Adams, C.M.; Chien, A.S.; Gygi, S.P.; Nachury, M.V. Proteomics of Primary Cilia by Proximity Labeling. Dev. Cell 2015, 35, 497–512. [Google Scholar] [CrossRef] [PubMed]
  72. Bachmann, V.A.; Mayrhofer, J.E.; Ilouz, R.; Tschaikner, P.; Raffeiner, P.; Röck, R.; Courcelles, M.; Apelt, F.; Lu, T.-W.; Baillie, G.S.; et al. Gpr161 Anchoring of PKA Consolidates GPCR and cAMP Signaling. Proc. Natl. Acad. Sci. USA 2016, 113, 7786–7791. [Google Scholar] [CrossRef] [PubMed]
  73. Hilgendorf, K.I.; Johnson, C.T.; Jackson, P.K. The Primary Cilium as a Cellular Receiver: Organizing Ciliary GPCR Signaling. Curr. Opin. Cell Biol. 2016, 39, 84–92. [Google Scholar] [CrossRef]
  74. Wachten, D.; Mick, D.U. Signal Transduction in Primary Cilia—Analyzing and Manipulating GPCR and Second Messenger Signaling. Pharmacol. Ther. 2021, 224, 107836. [Google Scholar] [CrossRef]
  75. Mykytyn, K.; Askwith, C. G-Protein-Coupled Receptor Signaling in Cilia. Cold Spring Harb. Perspect. Biol. 2017, 9, a028183. [Google Scholar] [CrossRef]
  76. Somatilaka, B.N.; Hwang, S.-H.; Palicharla, V.R.; White, K.A.; Badgandi, H.; Shelton, J.M.; Mukhopadhyay, S. Ankmy2 Prevents Smoothened-Independent Hyperactivation of the Hedgehog Pathway via Cilia-Regulated Adenylyl Cyclase Signaling. Dev. Cell 2020, 54, 710–726.e8. [Google Scholar] [CrossRef]
  77. Siljee, J.E.; Wang, Y.; Bernard, A.A.; Ersoy, B.A.; Zhang, S.; Marley, A.; Von Zastrow, M.; Reiter, J.F.; Vaisse, C. Subcellular Localization of MC4R with ADCY3 at Neuronal Primary Cilia Underlies a Common Pathway for Genetic Predisposition to Obesity. Nat. Genet. 2018, 50, 180–185. [Google Scholar] [CrossRef] [PubMed]
  78. Wang, Y.; Bernard, A.; Comblain, F.; Yue, X.; Paillart, C.; Zhang, S.; Reiter, J.F.; Vaisse, C. Melanocortin 4 Receptor Signals at the Neuronal Primary Cilium to Control Food Intake and Body Weight. J. Clin. Investig. 2021, 131, e142064. [Google Scholar] [CrossRef]
  79. Mehta, Y.R.; Lewis, S.A.; Leo, K.T.; Chen, L.; Park, E.; Raghuram, V.; Chou, C.-L.; Yang, C.-R.; Kikuchi, H.; Khundmiri, S.; et al. “ADPKD-Omics”: Determinants of Cyclic AMP Levels in Renal Epithelial Cells. Kidney Int. 2022, 101, 47–62. [Google Scholar] [CrossRef]
  80. Paolocci, E.; Zaccolo, M. Compartmentalised cAMP Signalling in the Primary Cilium. Front. Physiol. 2023, 14, 1187134. [Google Scholar] [CrossRef]
  81. Hansen, J.N.; Kaiser, F.; Leyendecker, P.; Stüven, B.; Krause, J.; Derakhshandeh, F.; Irfan, J.; Sroka, T.J.; Preval, K.M.; Desai, P.B.; et al. A cAMP Signalosome in Primary Cilia Drives Gene Expression and Kidney Cyst Formation. EMBO Rep. 2022, 23, e54315. [Google Scholar] [CrossRef] [PubMed]
  82. Abdul-Majeed, S.; Moloney, B.C.; Nauli, S.M. Mechanisms Regulating Cilia Growth and Cilia Function in Endothelial Cells. Cell. Mol. Life Sci. 2012, 69, 165–173. [Google Scholar] [CrossRef]
  83. Pei, S.-J.; Zhu, H.-Y.; Guo, J.-H.; Zhang, X.; Deng, Z.-J. Knockout of CNR1 Prevents Metabolic Stress-Induced Cardiac Injury through Improving Insulin Resistance (IR) Injury and Endoplasmic Reticulum (ER) Stress by Promoting AMPK-Alpha Activation. Biochem. Biophys. Res. Commun. 2018, 503, 744–751. [Google Scholar] [CrossRef] [PubMed]
  84. Boals, A.G.; Collier, D.M.; Romero, J.R.; Hillard, C.J.; Park, F. Lack of Cannabinoid Type 2 Promoter Activity in Normal or Injured Kidneys Using a Cnr2-GFP Reporter Mouse. Cannabis Cannabinoid Res. 2024, 10, 400–408. [Google Scholar] [CrossRef]
  85. Zhou, S.; Wu, Q.; Lin, X.; Ling, X.; Miao, J.; Liu, X.; Hu, C.; Zhang, Y.; Jia, N.; Hou, F.F.; et al. Cannabinoid Receptor Type 2 Promotes Kidney Fibrosis through Orchestrating β-Catenin Signaling. Kidney Int. 2021, 99, 364–381. [Google Scholar] [CrossRef]
  86. Zhou, S.; Ling, X.; Liang, Y.; Feng, Q.; Xie, C.; Li, J.; Chen, Q.; Miao, J.; Zhang, M.; Li, Z.; et al. Cannabinoid Receptor 2 Plays a Key Role in Renal Fibrosis through Inhibiting Lipid Metabolism in Renal Tubular Cells. Metabolism 2024, 159, 155978. [Google Scholar] [CrossRef]
  87. Rezende, B.; Alencar, A.K.N.; de Bem, G.F.; Fontes-Dantas, F.L.; Montes, G.C. Endocannabinoid System: Chemical Characteristics and Biological Activity. Pharmaceuticals 2023, 16, 148. [Google Scholar] [CrossRef] [PubMed]
  88. Imperatore, R.; D’Angelo, L.; Safari, O.; Motlagh, H.A.; Piscitelli, F.; de Girolamo, P.; Cristino, L.; Varricchio, E.; di Marzo, V.; Paolucci, M. Overlapping Distribution of Orexin and Endocannabinoid Receptors and Their Functional Interaction in the Brain of Adult Zebrafish. Front. Neuroanat. 2018, 12, 62. [Google Scholar] [CrossRef]
  89. Zhou, S.; Ling, X.; Meng, P.; Liang, Y.; Shen, K.; Wu, Q.; Zhang, Y.; Chen, Q.; Chen, S.; Liu, Y.; et al. Cannabinoid Receptor 2 Plays a Central Role in Renal Tubular Mitochondrial Dysfunction and Kidney Ageing. J. Cell. Mol. Med. 2021, 25, 8957–8972. [Google Scholar] [CrossRef]
  90. Mukhopadhyay, P.; Rajesh, M.; Pan, H.; Patel, V.; Mukhopadhyay, B.; Bátkai, S.; Gao, B.; Haskó, G.; Pacher, P. Cannabinoid-2 Receptor Limits Inflammation, Oxidative/Nitrosative Stress, and Cell Death in Nephropathy. Free Radic. Biol. Med. 2010, 48, 457–467. [Google Scholar] [CrossRef]
  91. Swanson, M.L.; Regner, K.R.; Moore, B.M.; Park, F. Cannabinoid Type 2 Receptor Activation Reduces the Progression of Kidney Fibrosis Using a Mouse Model of Unilateral Ureteral Obstruction. Cannabis Cannabinoid Res. 2022, 7, 790–803. [Google Scholar] [CrossRef] [PubMed]
  92. Rokicki, M.; Żurowski, J.; Sawicki, S.; Ocłoń, E.; Szmatoła, T.; Jasielczuk, I.; Mizera-Szpilka, K.; Semik-Gurgul, E.; Gurgul, A. Impact of Long-Term Cannabidiol (CBD) Treatment on Mouse Kidney Transcriptome. Genes. 2024, 15, 1640. [Google Scholar] [CrossRef] [PubMed]
  93. Tang, M.; Cao, X.; Zhang, K.; Li, Y.; Zheng, Q.; Li, G.; He, Q.; Li, S.; Xu, G.; Zhang, K. Celastrol Alleviates Renal Fibrosis by Upregulating Cannabinoid Receptor 2 Expression. Cell Death Dis. 2018, 9, 601. [Google Scholar] [CrossRef] [PubMed]
  94. Amin, M.R.; Ahmed, K.T.; Ali, D.W. Cannabinoid Receptor 2 (Cb2r) Mediates Cannabinol (CBN) Induced Developmental Defects in Zebrafish. Sci. Rep. 2022, 12, 20251. [Google Scholar] [CrossRef]
  95. Colón-Cruz, L.; Rodriguez-Morales, R.; Santana-Cruz, A.; Cantres-Velez, J.; Torrado-Tapias, A.; Lin, S.-J.; Yudowski, G.; Kensler, R.; Marie, B.; Burgess, S.M.; et al. Cnr2 Is Important for Ribbon Synapse Maturation and Function in Hair Cells and Photoreceptors. Front. Mol. Neurosci. 2021, 14, 624265. [Google Scholar] [CrossRef]
Figure 1. Loss of cnr1 leads to reduction in both mature and progenitor MCC populations: (A) live imaging between different treatment groups between 24 and 72 hpf with the percentage of embryos with edema between 48–72 hpf (arrows indicate pericardial edema); scale bar = 200 μm; (B) 28 ss WT, cnr1 MO stained via WISH using the mature MCC marker odf3b and cetn4; scale bar = 50 μm; (C,D) number of odf3b+ and cetn4+ cells per nephron at 28 ss; (E) 24 ss WT, cnr1 MO stained via WISH using the progenitor MCC marker pax2a and jag2b; scale bar = 50 μm; (F,G) number of pax2a+ and jag2b+ cells per nephron at 24 ss. Data presented on graphs are represented as mean ± SD; **** p < 0.0001 (t-test).
Jdb 13 00020 g001
Figure 2. cnr1 agonism leads to reduction in mature MCC population: (A) 28 ss WT, 0.01 mM MA and 0.01 mM AN-treated embryos stained via WISH using the mature MCC marker odf3b and cetn4; scale bar = 50 μm; (B,C) number of odf3b+ and cetn4+ cells per nephron at 28 ss; (D) 24 ss WT, 0.01 mM MA and 0.01 mM AN-treated embryos stained via WISH using the progenitor MCC marker pax2a and jag2b; scale bar = 50 μm; (E,F) number of pax2a+ and jag2b+ cells per nephron at 24 ss. Data presented on graphs are represented as mean ± SD; * p < 0.05 and **** p < 0.0001 (ANOVA).
Jdb 13 00020 g002
Figure 3. cnr1 antagonism leads to reduction in mature MCC population: (A) 28 ss WT, 0.02 mM AM-251 and 0.02 mM AM-281-treated embryos stained via WISH using the mature MCC marker odf3b and cetn4; scale bar = 50 μm; (B,C) number of odf3b+ and cetn4+ cells per nephron at 28 ss; (D) 24 ss WT, 0.02 mM AM-251 and 0.02 mM AM-281-treated embryos stained via WISH using the progenitor MCC marker pax2a and jag2b; scale bar = 50 μm; (E,F) number of pax2a+ and jag2b+ cells per nephron at 24 ss. Data presented on graphs are represented as mean ± SD;** p < 0.01 (ANOVA).
Jdb 13 00020 g003
Figure 4. Loss of cnr1 leads to cilia defects across embryonic tissues: (A) 28 hpf whole-mount IF for acetylated α-tubulin (cilia, green), γ-tubulin (basal bodies, red) and DAPI (nucleus, blue) in the proximal segment of WT, cnr1 MO and embryos treated with 0.02 mM AM-251; scale bar = 50 μm; (B) proximal cilia length at 28 hpf; (C) fluorescence intensity plot of α-tubulin intensity within the proximal segment at 28 hpf; (D) number of basal bodies in the proximal segment at 28 hpf; (E) percentage of ciliated basal bodies/total basal bodies in the proximal segment at 28 hpf; (F) 10 ss whole-mount IF for acetylated α-tubulin (cilia, green), anti-PKC (membrane boundary, red) and DAPI (nucleus, blue) in the KV of WT and cnr1 MO embryos; scale bar = 50 μm; (G) 4 dpf whole-mount IF for acetylated α-tubulin (cilia, green) and DAPI (nucleus, blue) in the neuromast of WT and cnr1 MO embryos; scale bar = 25 μm; (H) KV cilia length at 10 ss; (I) neuromast cilia length at 4 dpf; (J) 4 dpf whole-mount IF for acetylated α-tubulin (cilia, green) and DAPI (nucleus, blue) in the anterior macula and crista of WT and cnr1 MO embryos; scale bar = 25 μm; (K) 4 dpf whole-mount IF for acetylated α-tubulin (cilia, green), γ-tubulin (basal bodies, red) and DAPI (nucleus, blue) in the nasal placode of WT and cnr1 MO embryos; scale bar = 25 μm; (L,M) nasal MCC area and nasal placode area at 4 dpf; (N) number of nasal MCCs at 4 dpf; (O) 55 hpf WT and cnr1 MO embryos stained via WISH using heart marker myl7; scale bar = 50 μm; (P) phenotype percentage of heart looping phenotypes at 55 hpf. Data presented on graphs are represented as mean ± SD; ** p < 0.01 *** p < 0.001 and **** p < 0.0001 (t-test (H,I,LN), ANOVA (BE) and Fisher’s exact test (P)).
Jdb 13 00020 g004
Figure 5. cnr1 regulates renal MCC development via cAMP signaling and independently: (A,D) 28 ss embryos between experimental groups stained via WISH using the mature MCC marker odf3b; scale bar = 50 μm; (B,E) number of odf3b+ cells per nephron at 28 ss; (C,F) phenotype percentage of MCC phenotypes at 28 ss. Data presented on graphs are represented as mean ± SD; ** p < 0.01 *** p < 0.001 and **** p < 0.0001 (ANOVA (Figure 4B,E) and Fisher’s exact test with Holm’s correction (Figure 4C,F)).
Jdb 13 00020 g005
Figure 6. Roadmap delineating the relationship between Cnr1 and players in renal MCC development.
Jdb 13 00020 g006
Disclaimer/Publisher’s Note: The statements, opinions and data contained in all publications are solely those of the individual author(s) and contributor(s) and not of MDPI and/or the editor(s). MDPI and/or the editor(s) disclaim responsibility for any injury to people or property resulting from any ideas, methods, instructions or products referred to in the content.

