Understanding Completeness and Diversity Patterns of OSM-Based Land-Use and Land-Cover Dataset in China


Abstract
1. Introduction
- (1)
- The intrinsic quality assessment of an OSM-based LULC dataset is carried out. By contrast, most past studies have used an LULC reference dataset for quality assessment. Our analytical method can be applied to other regions, especially those for which a free LULC reference dataset is unavailable.
- (2)
- Both the completeness and the diversity patterns of an entire country (China) were mapped and analyzed, and the results indicate that the diversity measure may be used as a supplement for an intrinsic quality assessment.
2. Study Area and Data
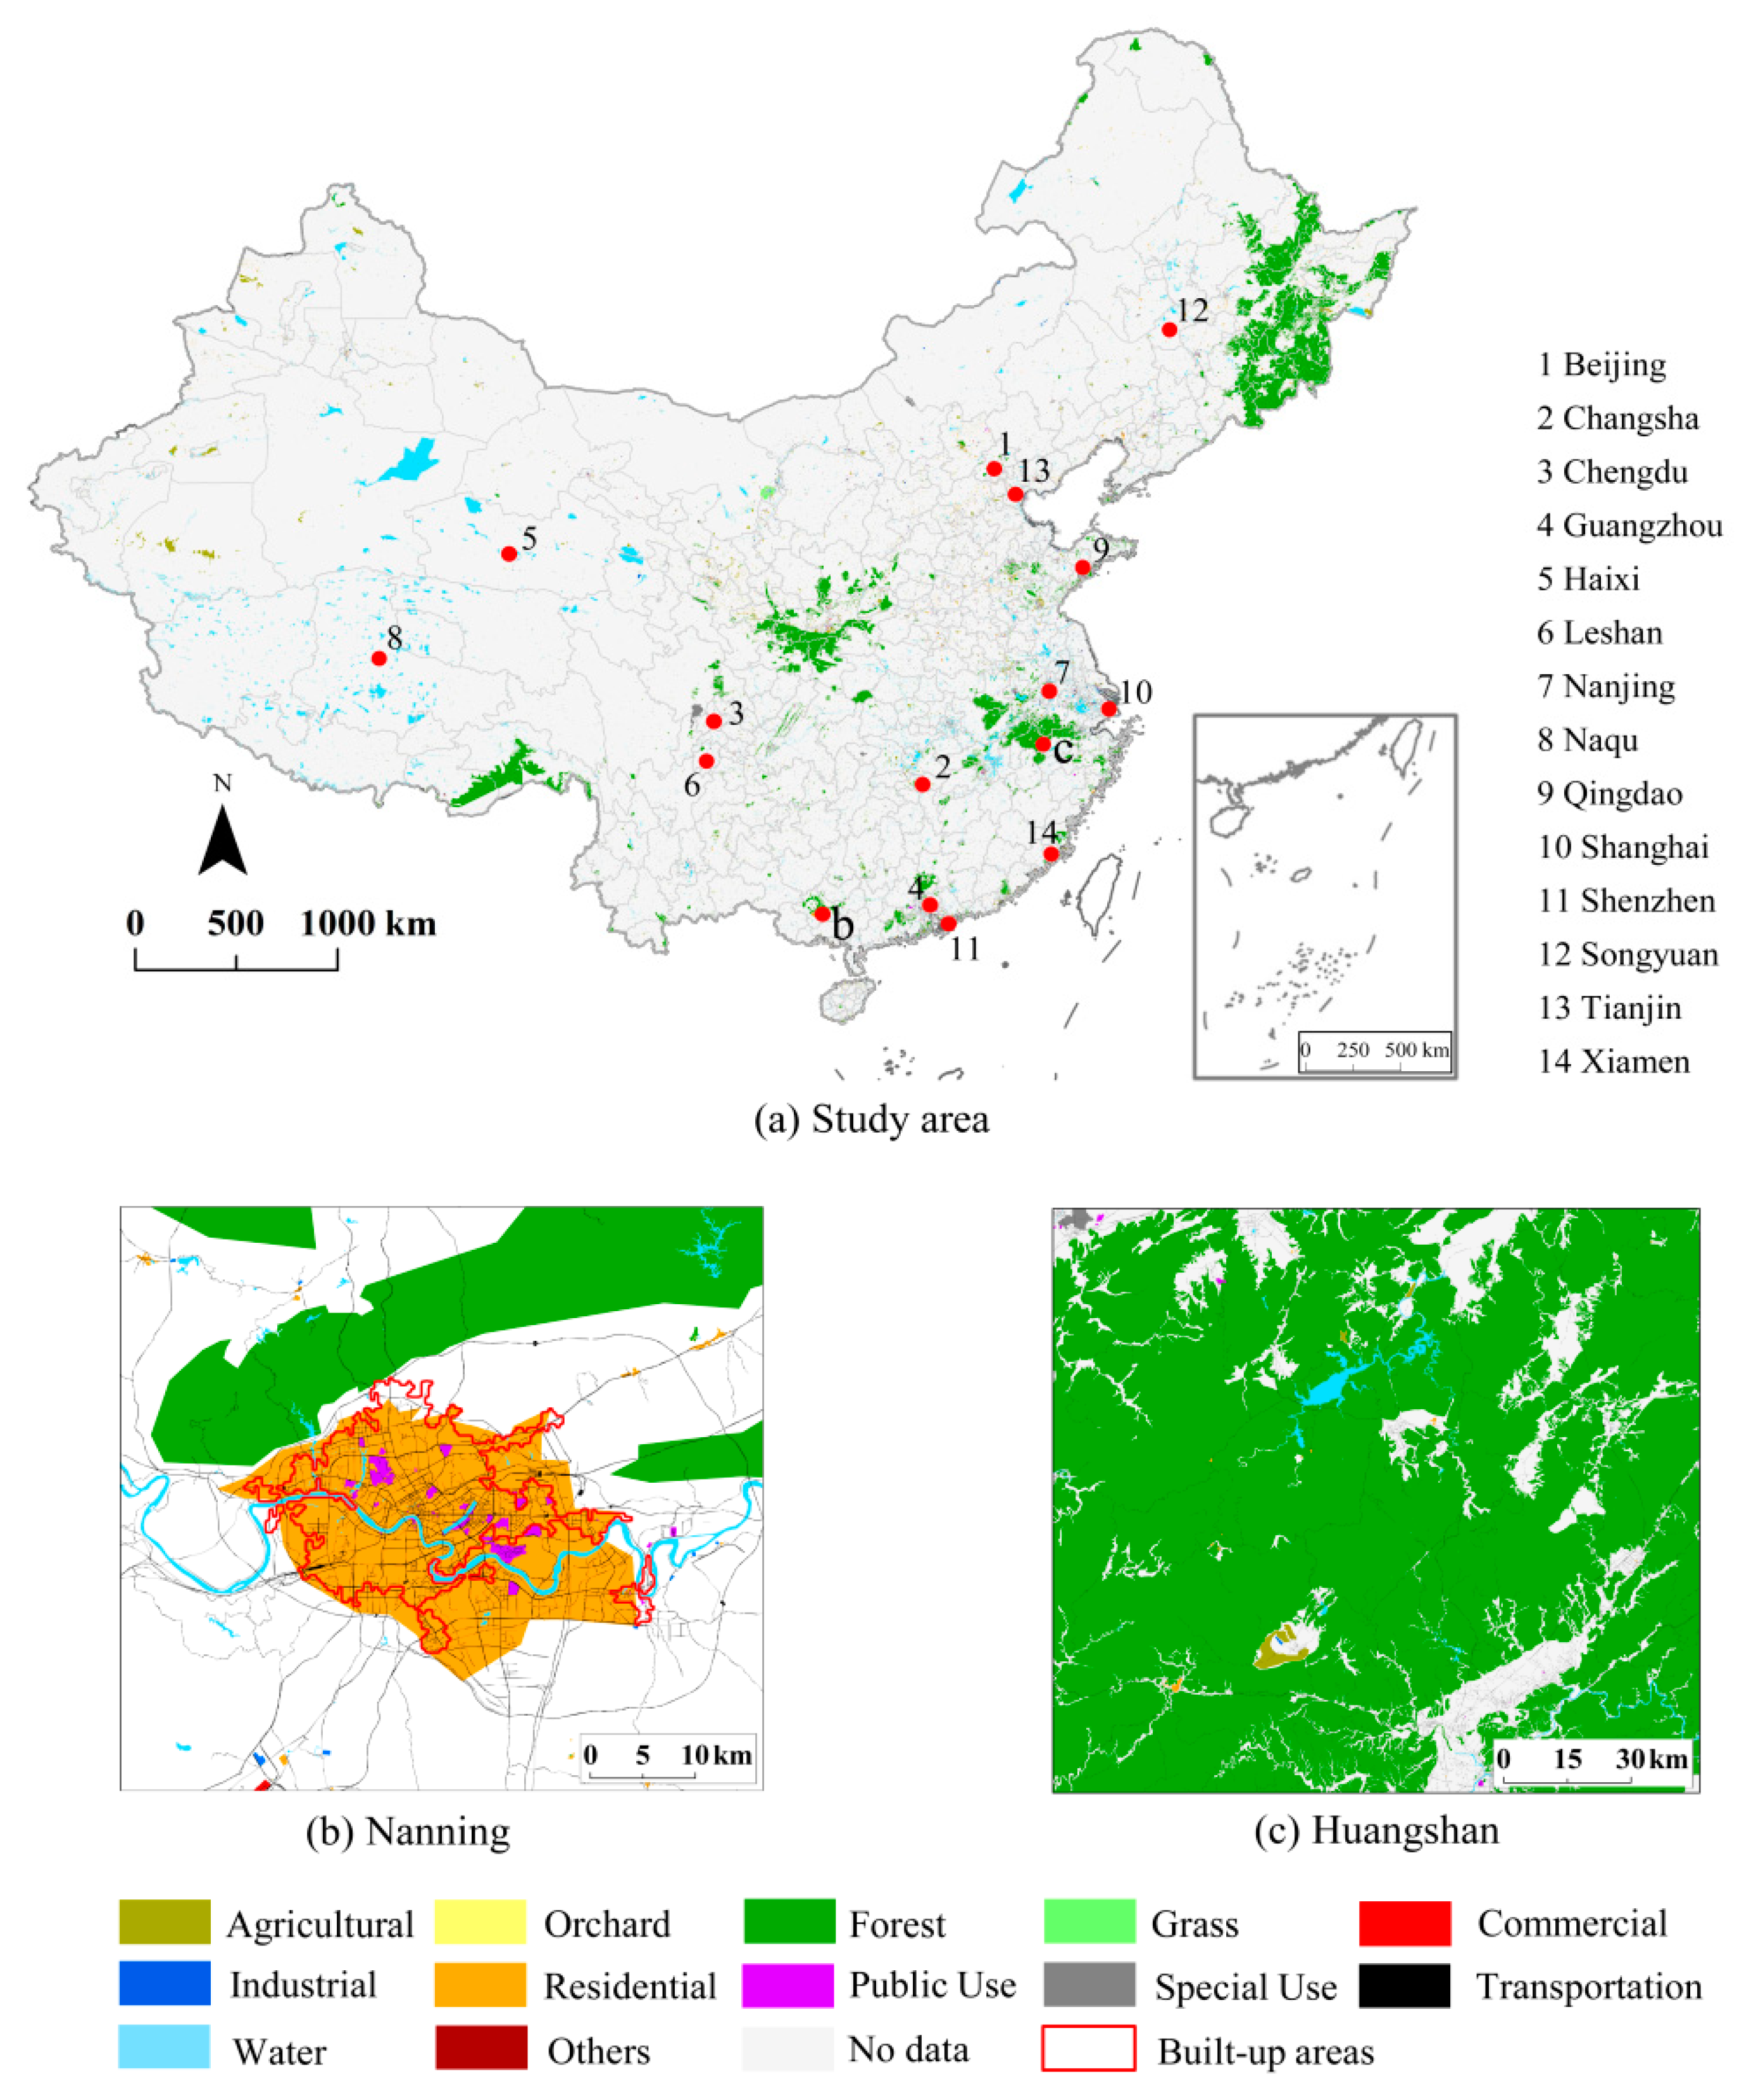
2.1. Study Area
2.2. Data
3. Methods
3.1. Production and Validation of OSM-Based LULC Dataset
3.1.1. Production
- Step 1: Convert line features into polygon features. According to Zhou et al. [17], it is feasible to convert a line feature into a polygon feature through buffering, i.e., to create a buffer region around the line feature, after which, the buffer region can be viewed as a polygon feature. The challenge here is to determine appropriate buffer radii for different OSM types because OSM line objects may be tagged with different attribute values (e.g., highways = primary, highways = secondary, and highways = residential). Such an appropriate radius was determined by Zhou et al. [17] through comparison with a corresponding reference LULC dataset (GMESUA). However, such a reference dataset was not available for our study area, and thus different buffer radii (ranging from 4.5–10 m) for different OSM types were manually determined by referring to the Technical Standard of Highway Engineering of China and the corresponding images on Google Earth (Table 1). The buffer radius was generally positively correlated with the importance of an OSM road type.
- Step 2: Classify OSM objects into corresponding reference classes. Owing to a lack of the LULC reference product, we manually classified all OSM objects (according to their tags) into 12 LULC classes: Agriculture, orchard, forest, grass, commercial, industrial, residential, public use, special use, transportation, water, and other lands (Table 2). All these LULC classes were obtained from the first level of the National Land Use Classification Standards of China.
- Step 3: Merge multiple LULC classes (or layers) into a single layer. This is a necessary step because some polygon objects in OSM may overlap but correspond to different LULC classes; it may therefore be difficult to determine a unique LULC class for the same geographical region. The solution is to make different (12) LULC classes overlap according to their average area, from small to large [17]. To be specific, the feature or class with the smallest average area was placed on the top and that with the largest average area was placed at the bottom. After this process, all LULC classes (or layers) were further merged into a single layer.
3.1.2. Validation
3.2. Mapping and Analysis of Completeness and Diversity Patterns
3.2.1. Completeness and Diversity Measures
3.2.2. Mapping and Analysis
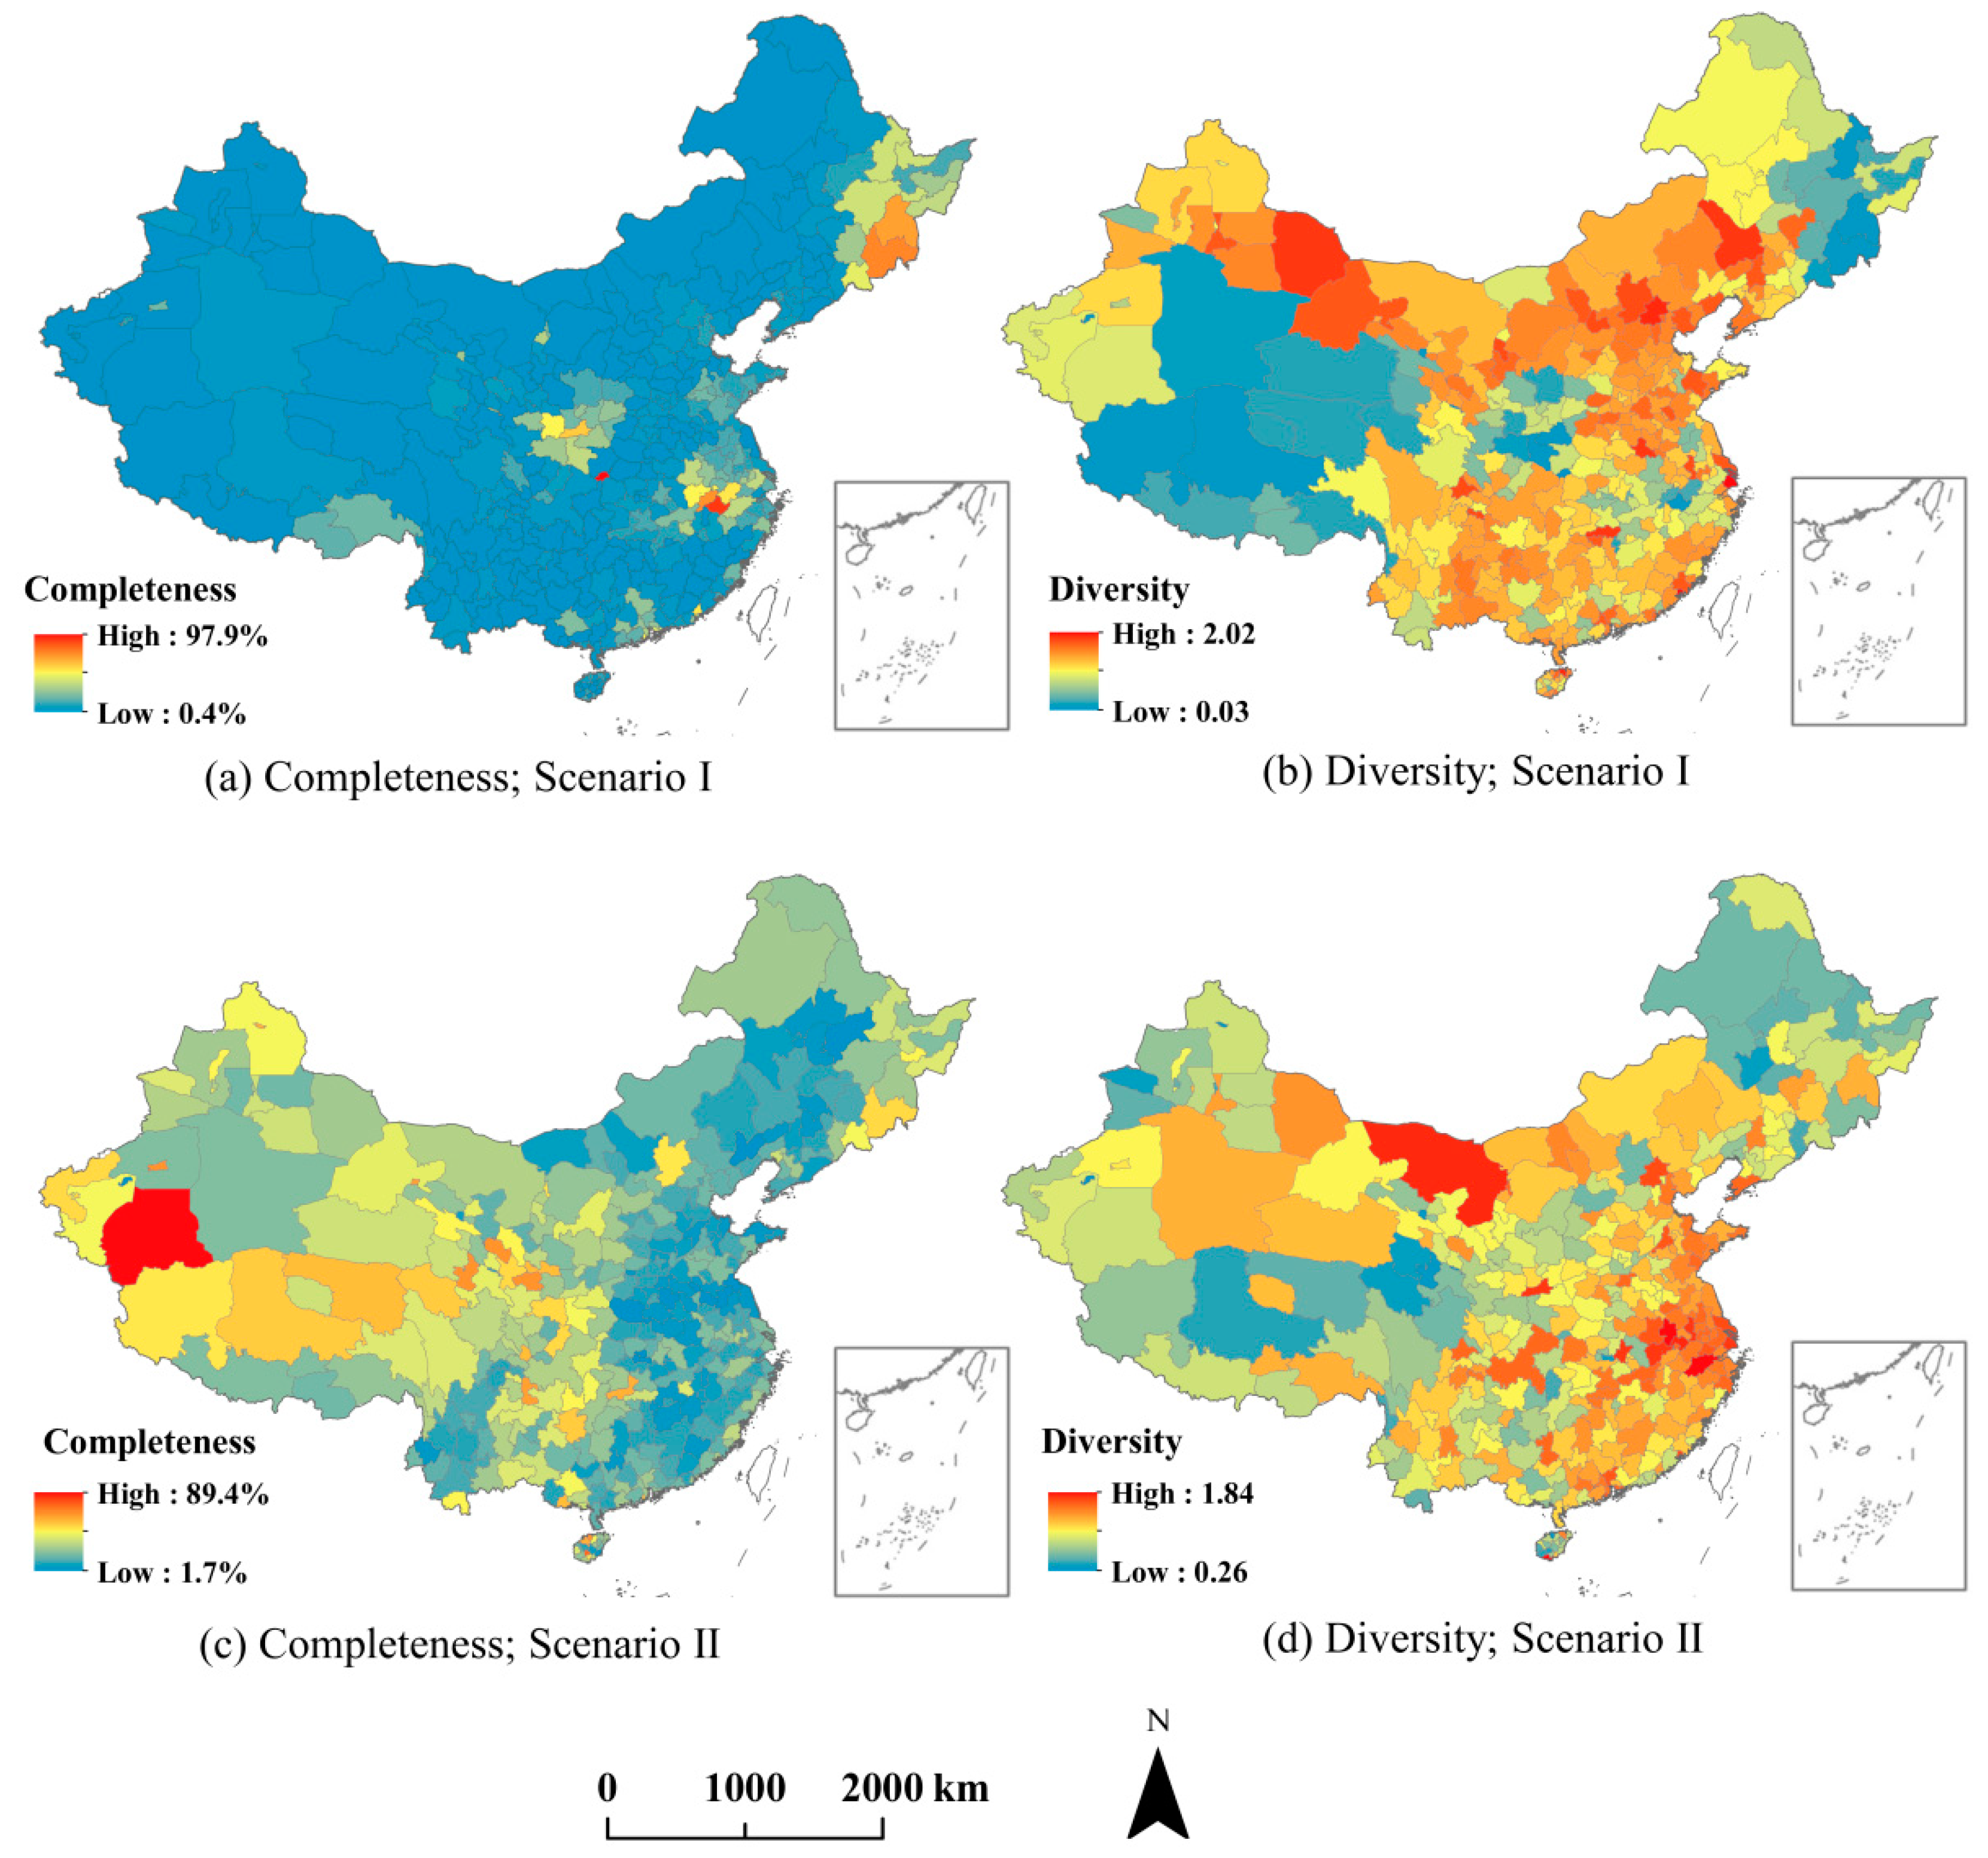
- Both the completeness and the diversity patterns were visually analyzed. A number of questions were considered. For instance, which areas had relatively high or low completeness and diversity values? Was there any difference between the completeness and the diversity patterns, in terms of scenarios I and II? was there any correlation between the completeness and the diversity patterns of the same scenario?
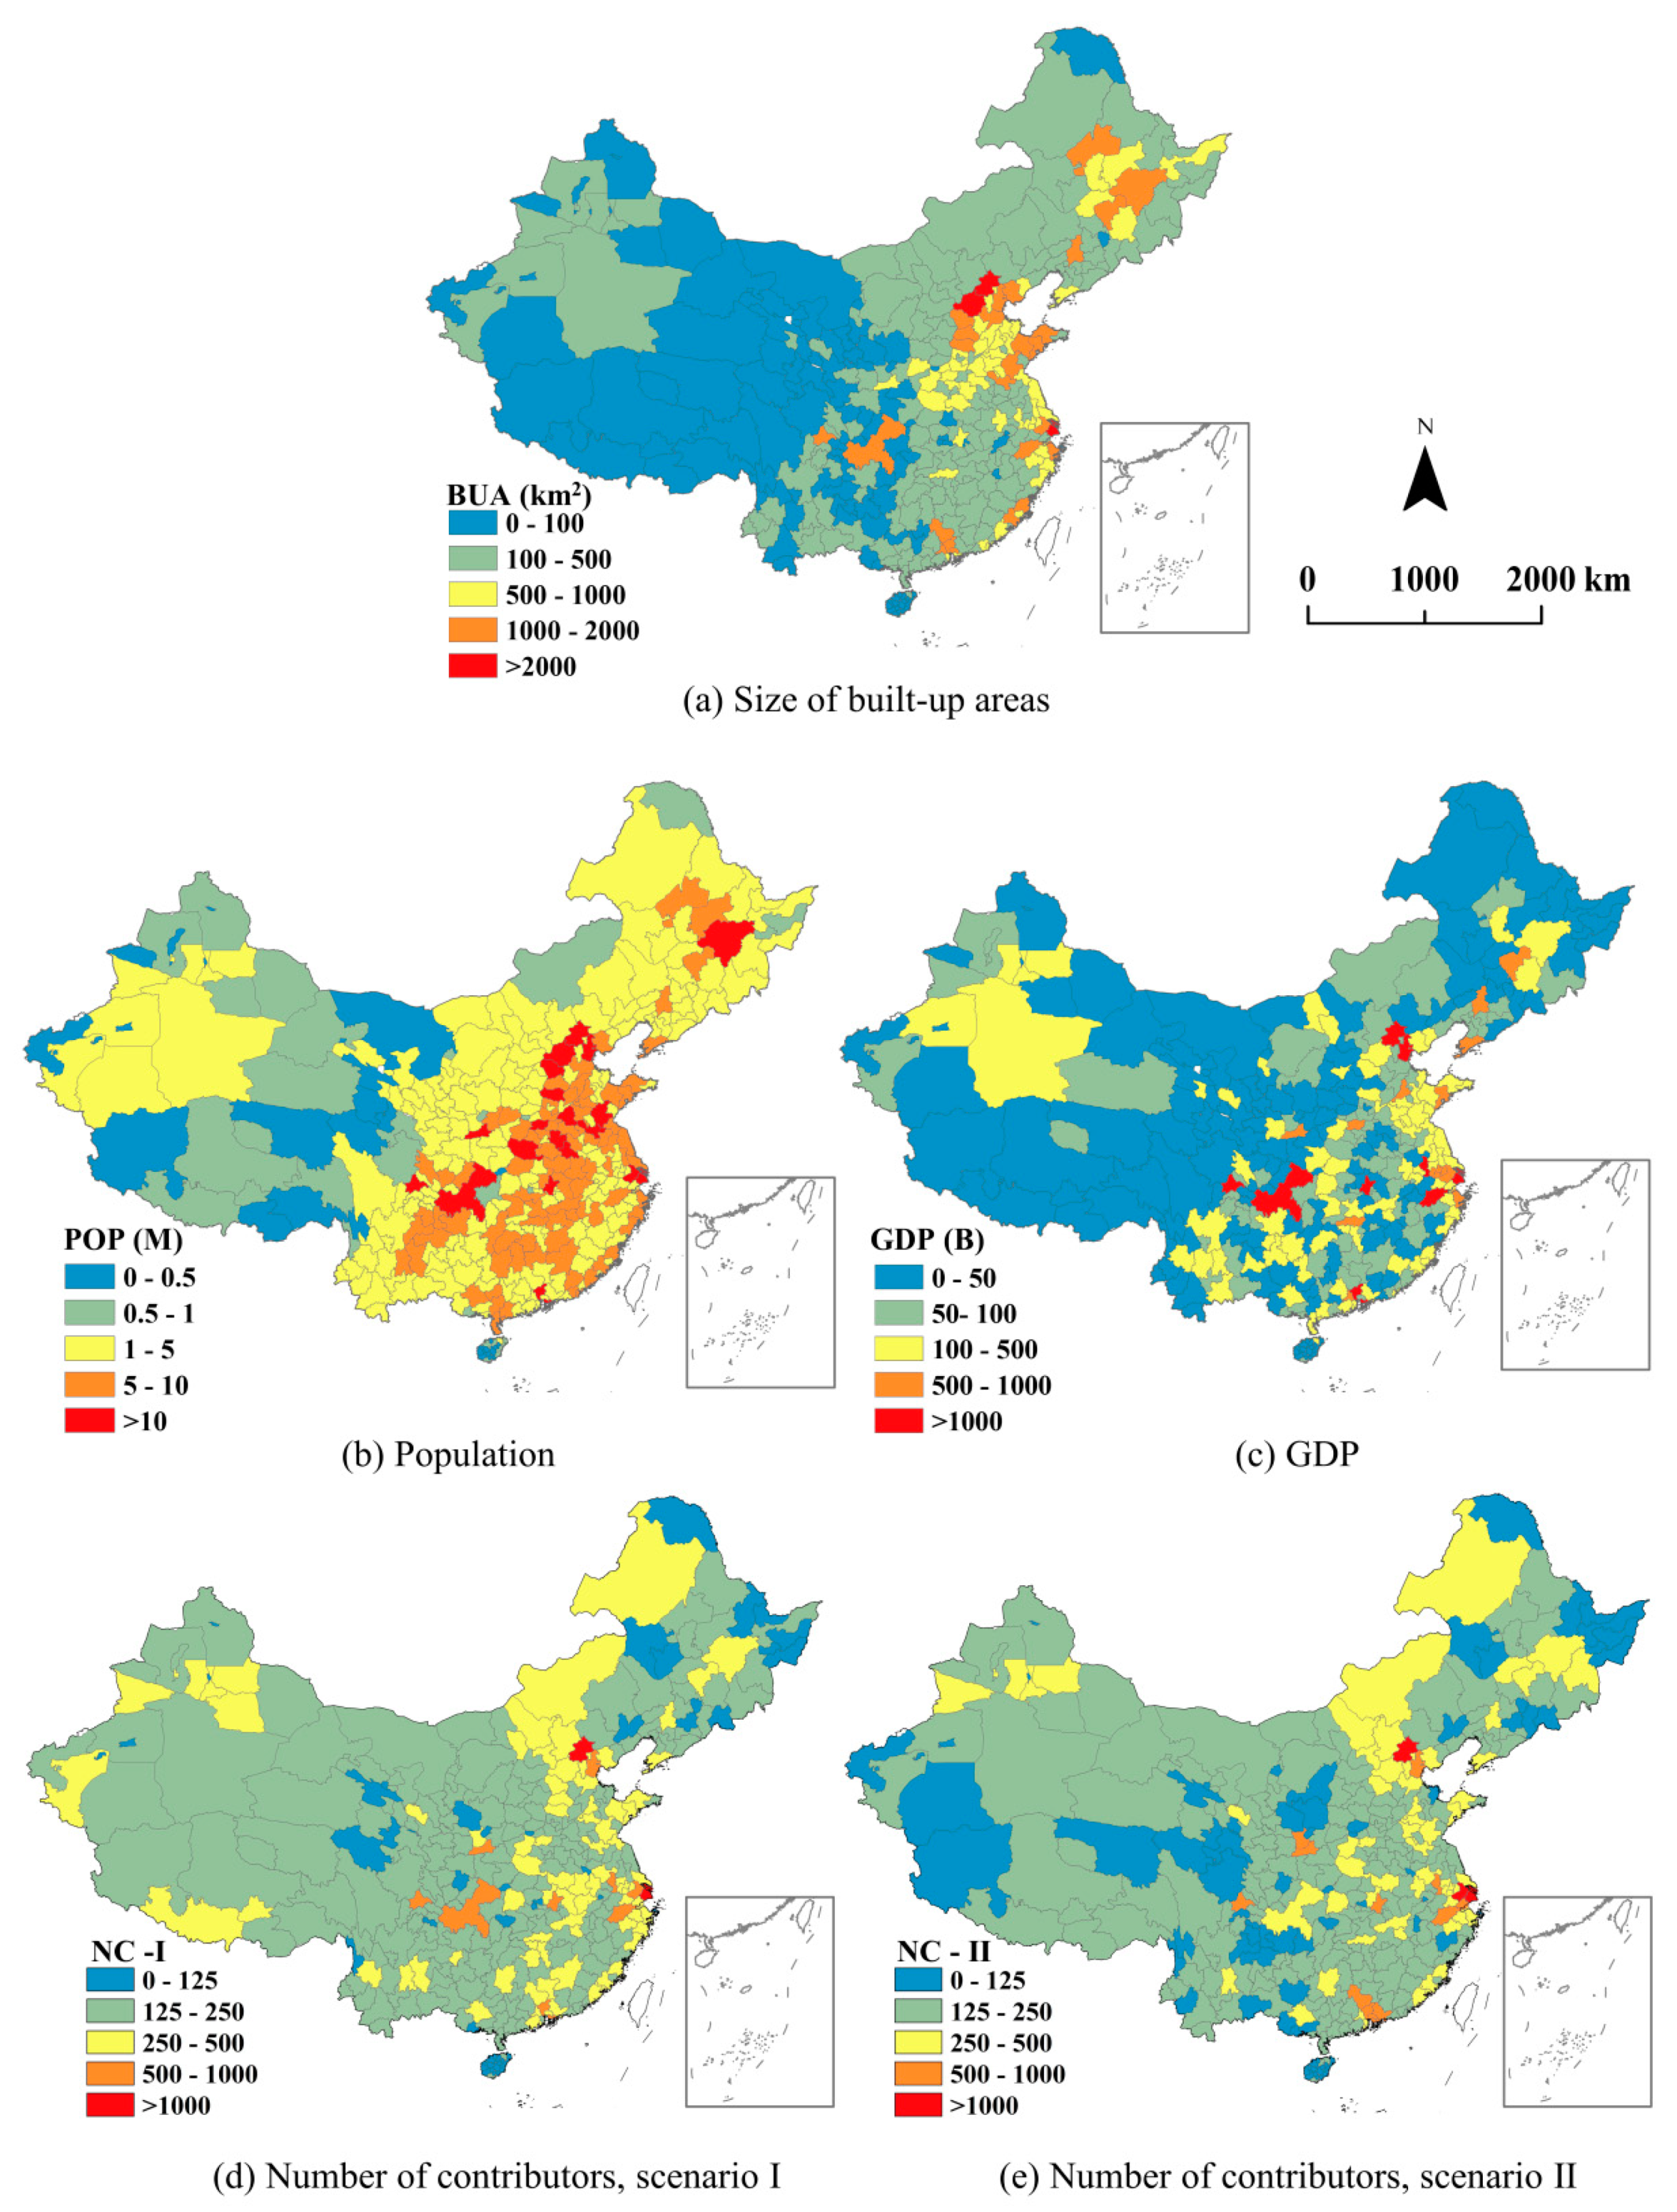
- For quantitative assessment, a number of factors were employed to identify factors that could have influenced the completeness and diversity patterns. Three socioeconomic factors [the size of the built-up areas, their population, and gross domestic product (GDP)] were first considered. The corresponding data in 2019 were acquired from the National Bureau of Statistics of China (http://www.stats.gov.cn). These factors were chosen because studies have shown that the completeness of OSM data tends to be high in municipalities with high population density [27]. Completeness has also been positively correlated with the GDP [25]. Thus, it is useful to investigate whether these factors could still be positively correlated with the completeness and diversity patterns of the OSM-based LULC dataset of China. Moreover, the number of contributors (who had edited the OSM data) was calculated based on an analysis of OSM history data (https://planet.openstreetmap.org/planet/full-history/, accessed in January 2019). This number was calculated in terms of each prefecture-level division (for scenario I) and the built-up areas of each prefecture-level division (for scenario II) to determine whether the number of contributors had a positive correlation with the completeness and/or diversity patterns.
4. Results and Analysis
4.1. Production and Validation of the OSM-Based LULC Dataset
4.2. Mapping and Analysis of Completeness and Diversity Patterns
5. Combined Completeness and Diversity Patterns
- Group I (High completeness and high diversity): The completeness was higher than a certain threshold (), as was the diversity ().
- Group II (High completeness and low diversity): The completeness was higher than , but the diversity was lower than .
- Group III (Low completeness and high diversity): The completeness was lower than , but the diversity was higher than ;
- Group IV (Low completeness and low diversity): The completeness was lower than , and the diversity was lower than .
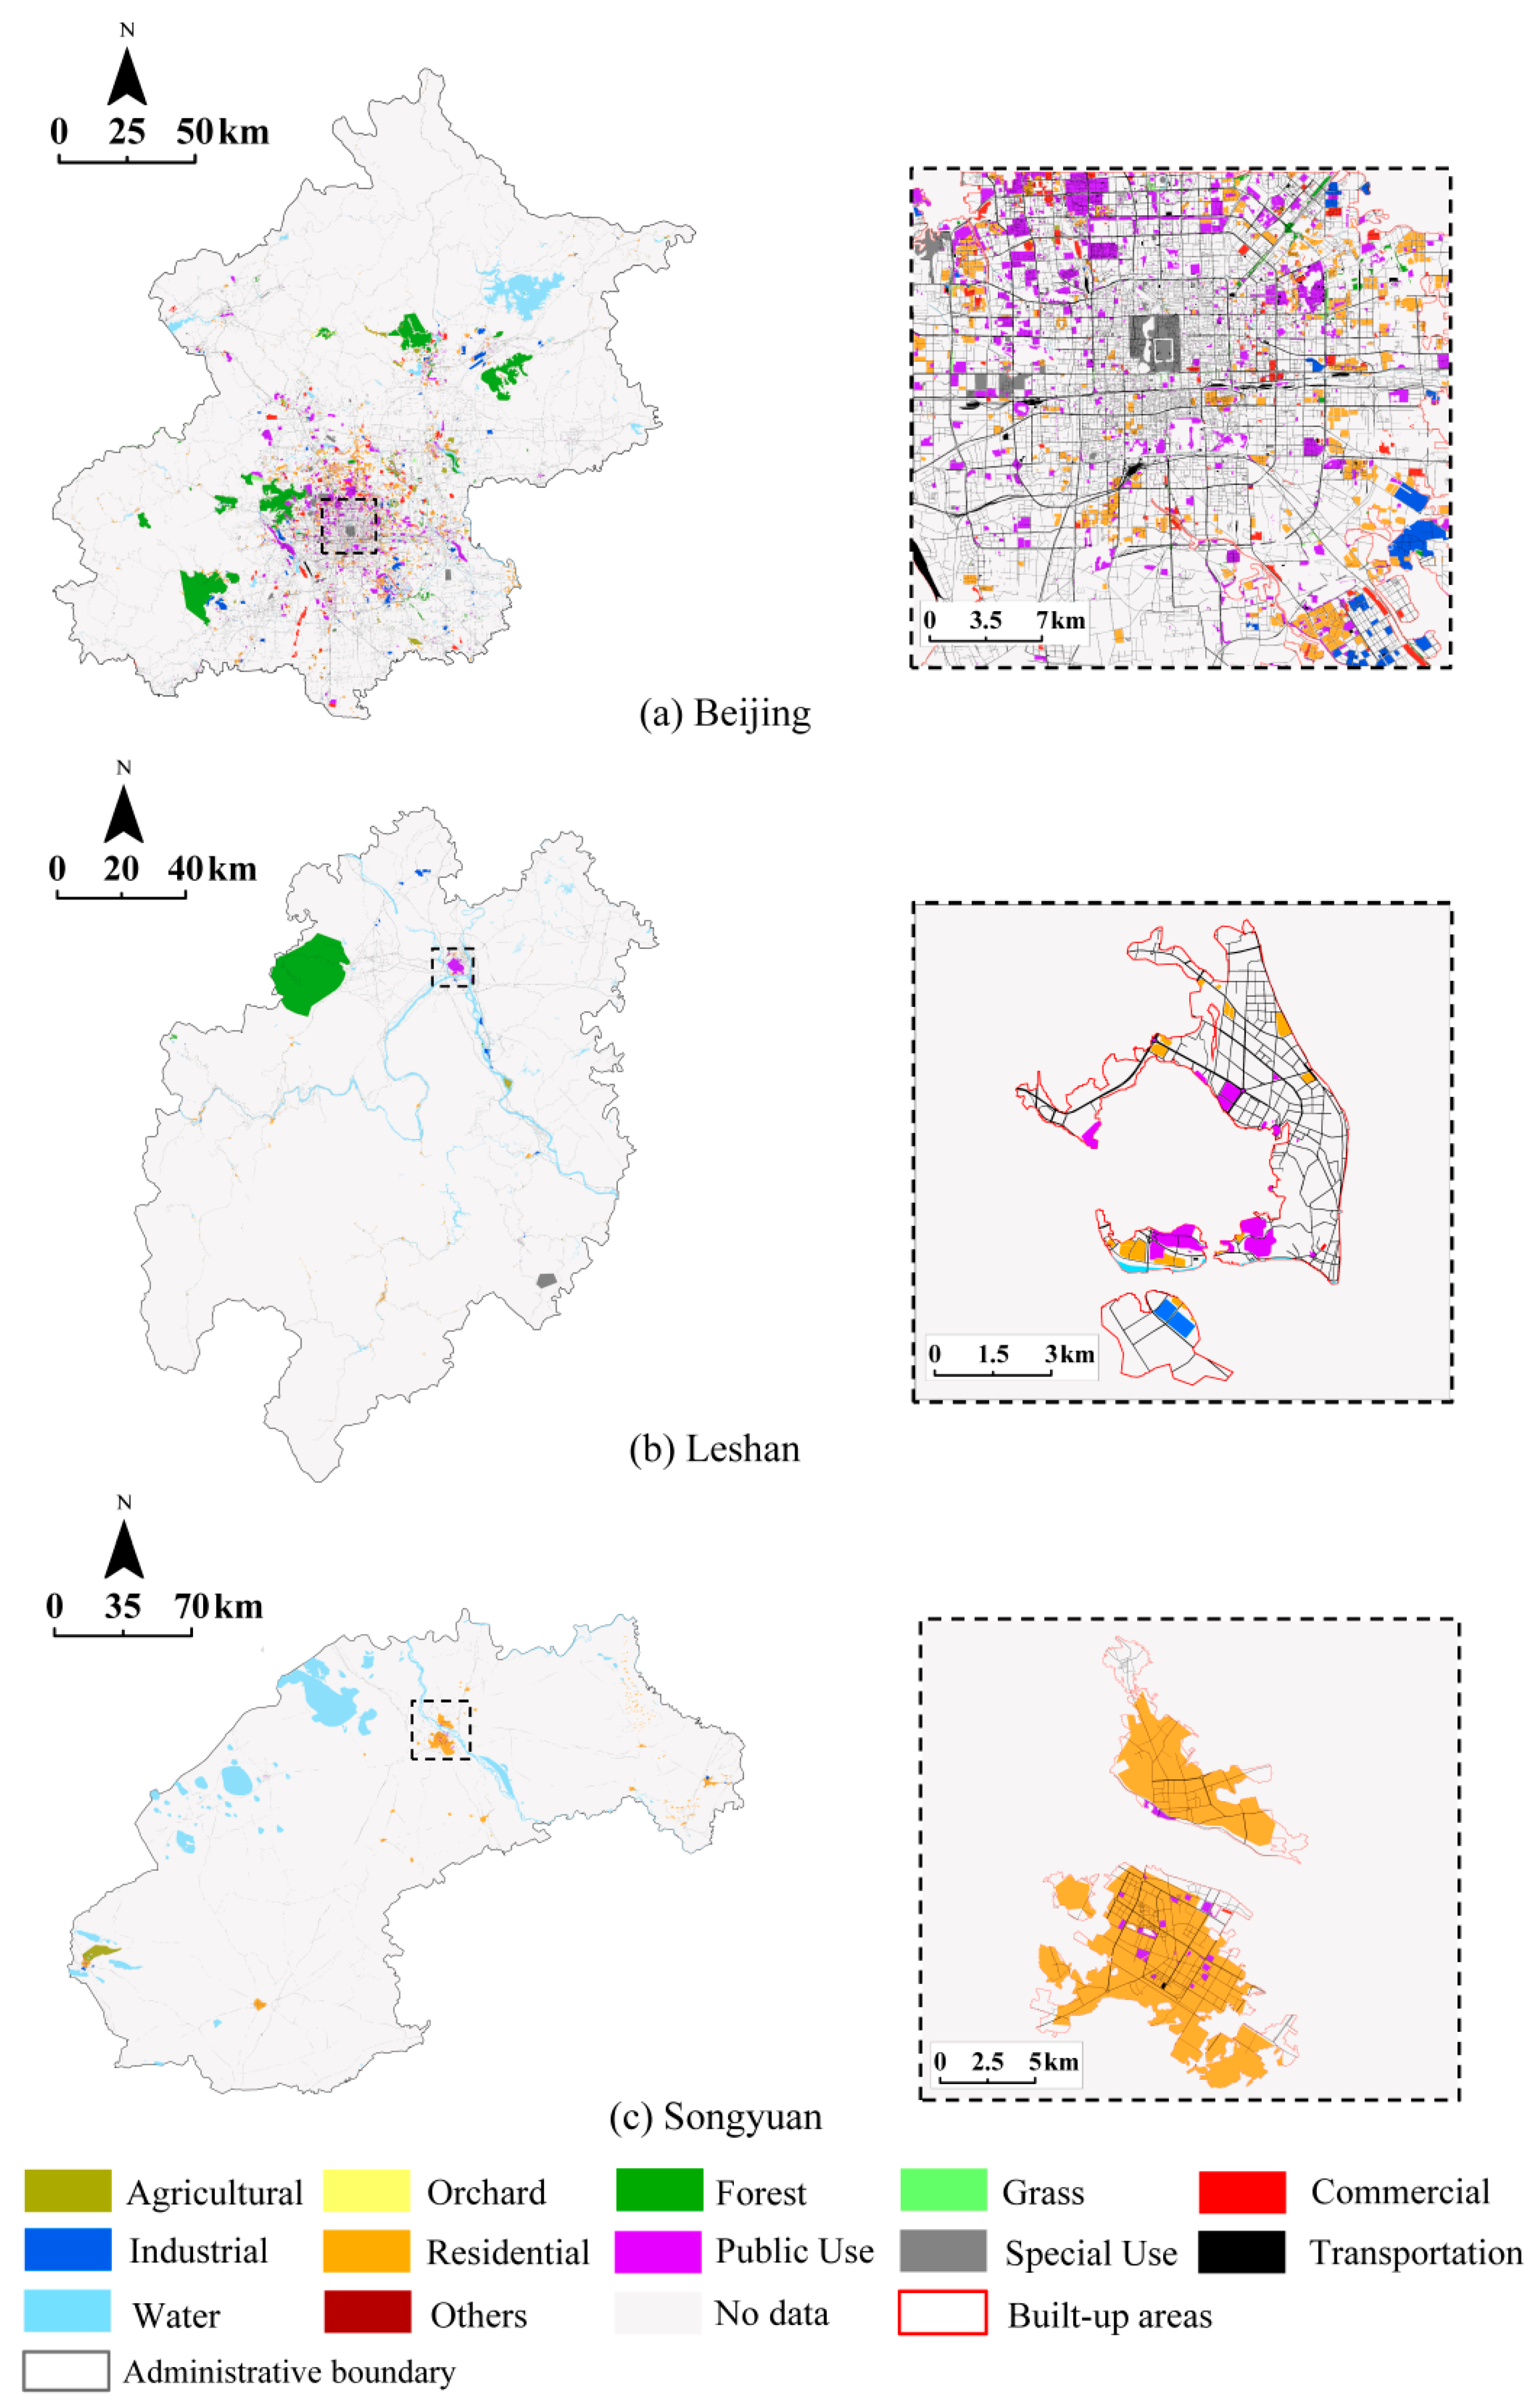
- Group I: For both scenarios I and II, most prefecture-level divisions were municipalities, e.g., Beijing (Figure 6a), Shanghai, and Tianjin, capital cities, e.g., Guangzhou, Nanjing, Chengdu, and Changsha, and the relatively developed cities (Shenzhen, Qingdao and Xiamen), and regions on the east coast. These divisions probably received more attention from the volunteers, and thus both their completeness and diversity values were relatively high.
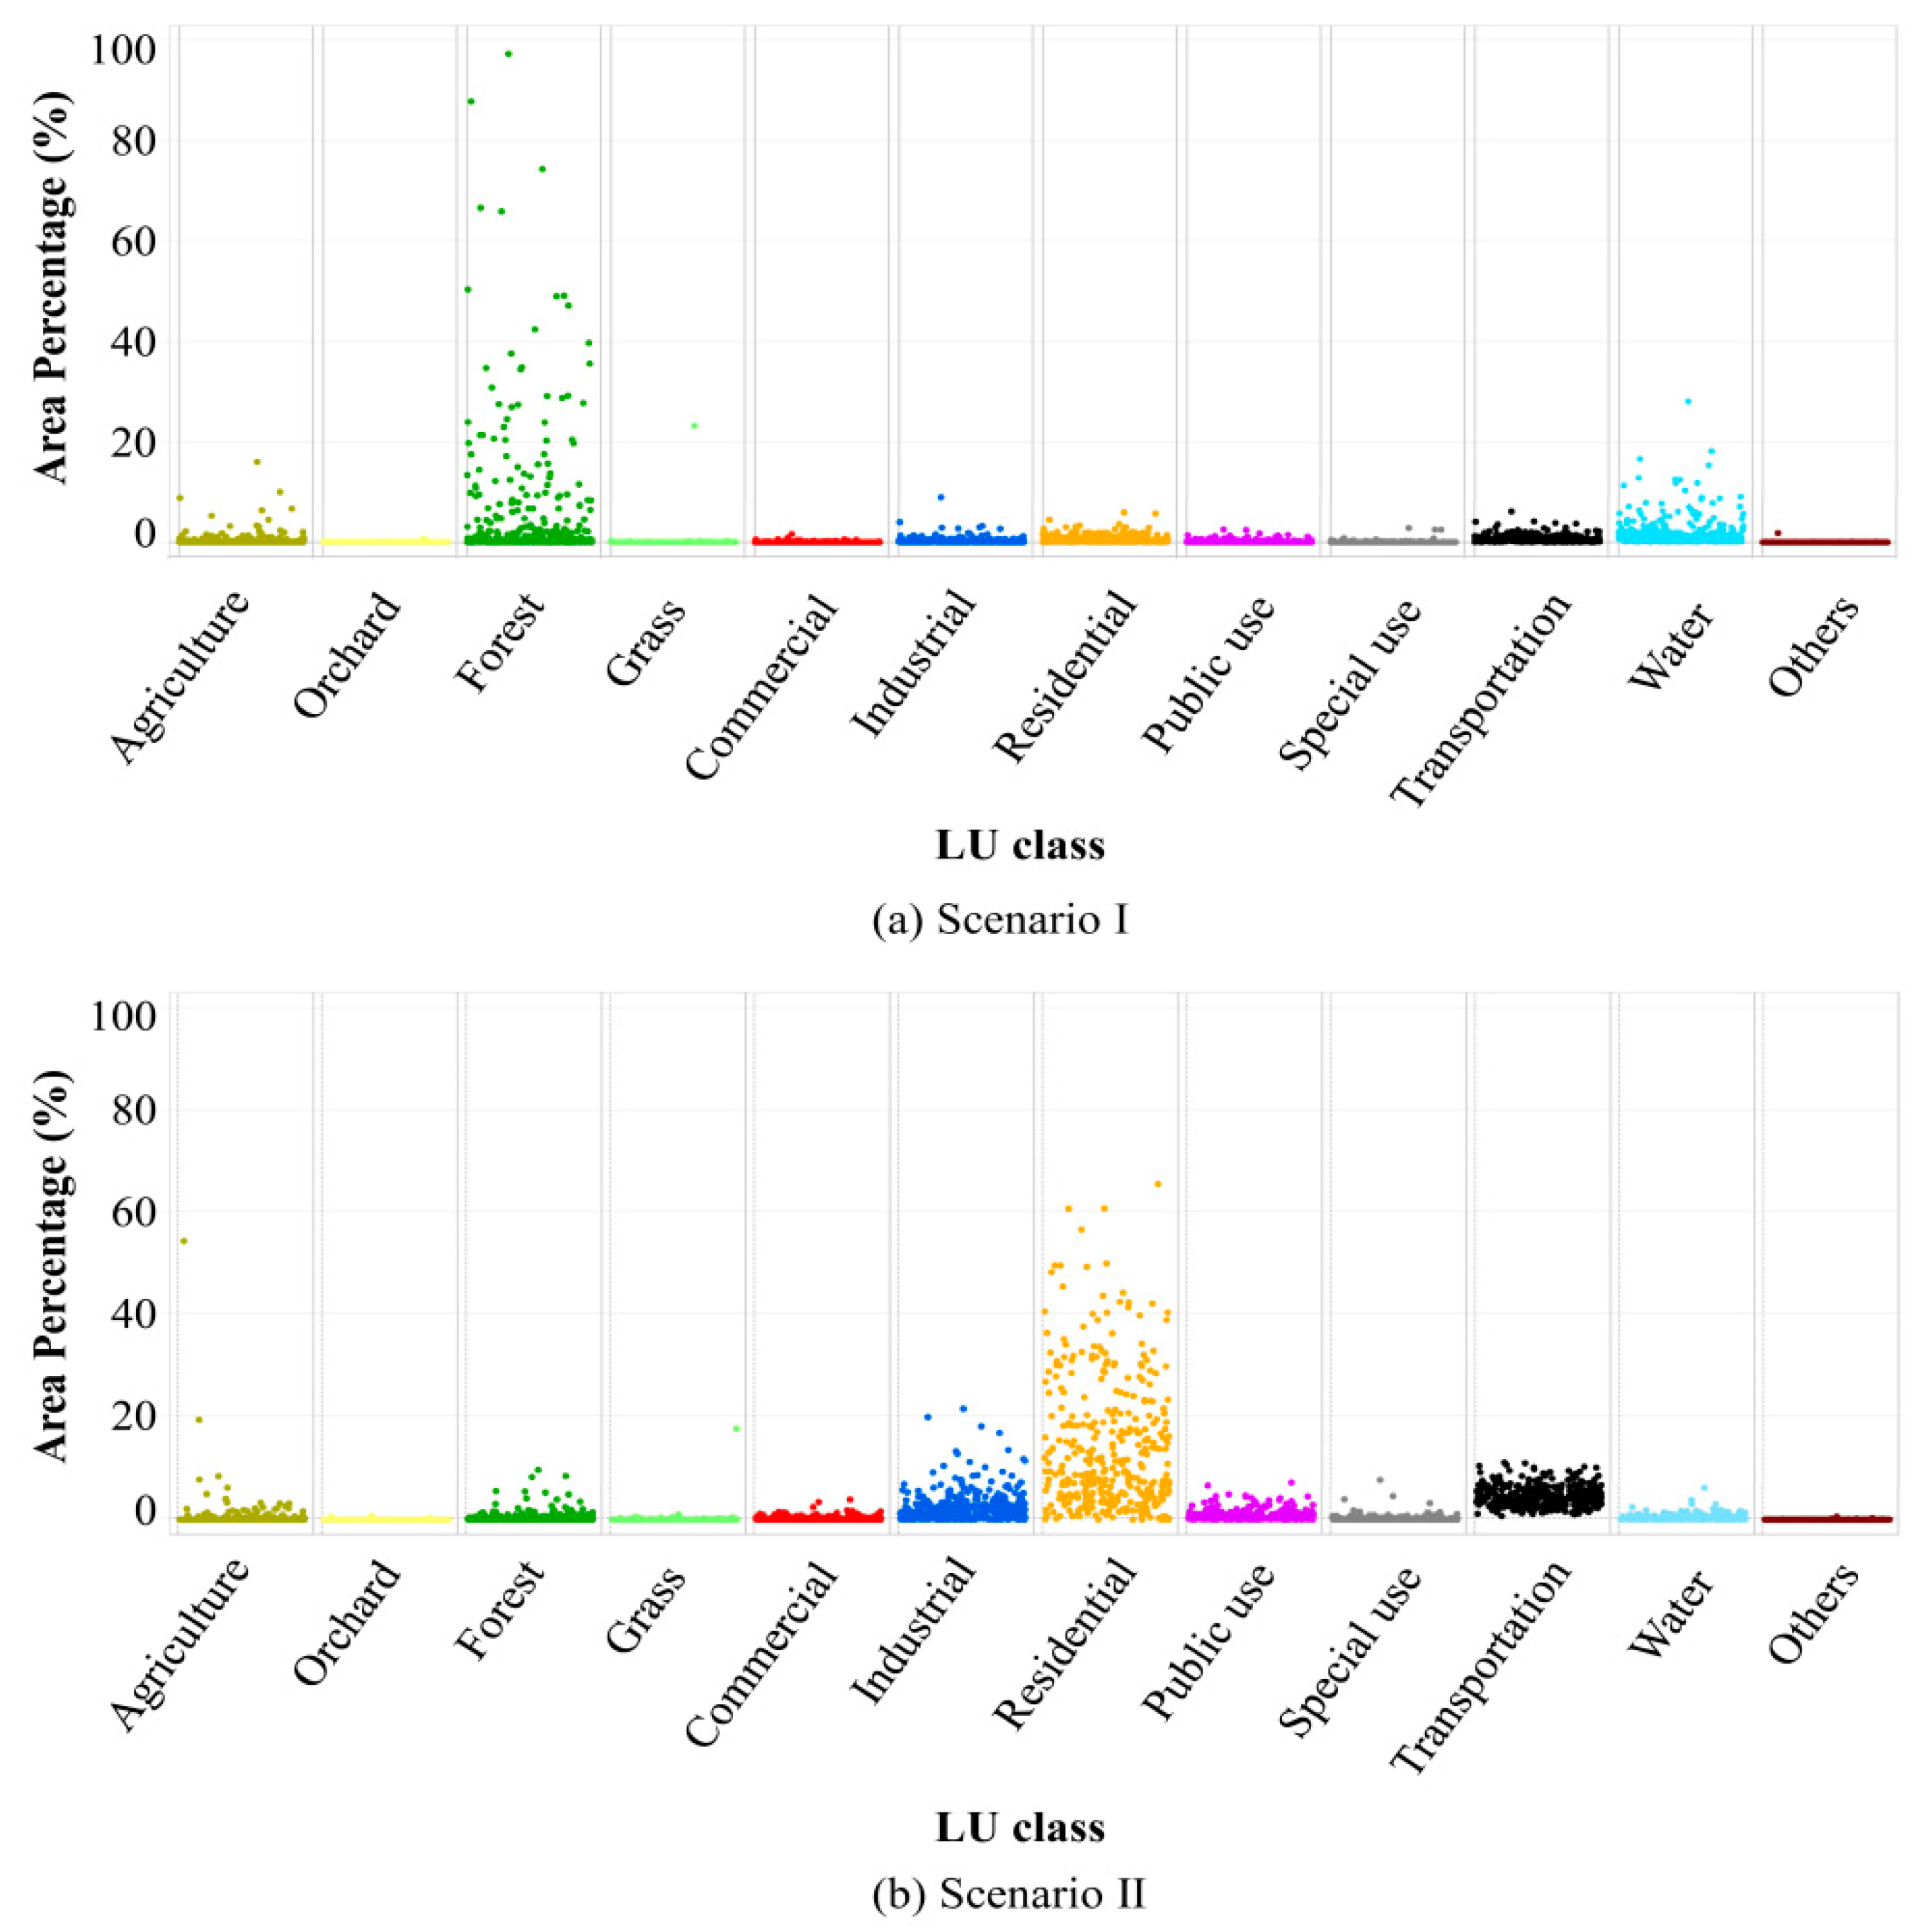
- Group II: The prefecture-level divisions of this group varied across scenario. In scenario I, most divisions were located in the east, center, and northeast of China owing to a large area percentage of forest. In scenario II, they were located in the southwest, northwest, and northeast of China owing to a large area percentage of residential land. This was nearly consistent with what is shown in Figure 2a,c.
- Groups III and IV: The prefecture-level divisions of these groups had low completeness values for several reasons: Some divisions (e.g., Haixi and Naqu) were characterized by a large land area, and thus the volunteers would have needed more time and effort to map these divisions well. In addition, some divisions (e.g., Leshan (Figure 6b) and Songyuan (Figure 6c)) were less well known, especially compared with those in Group I, and thus would probably have received less attention by volunteers. Furthermore, most divisions showed a relatively high diversity value, which indicates that in most cases was no dominant LULC class. However, some divisions (e.g., Figure 6c) featured a relatively large area percentage of water (79.3% for the left graph in Figure 6c) or residential lands (85.6% for the right graph in Figure 6c), which resulted in a low diversity value.
6. Discussion
6.1. Quality Measures
6.2. Applications
6.3. Limitations
7. Conclusions
- (1)
- The OA of the OSM-based LULC dataset of China was as high as 82.2%, which illustrates that the generated LULC dataset for the country was effective, and is comparable to those for European study areas in past work.
- (2)
- Both the completeness and the diversity patterns varied with prefecture-level division. Moreover, the completeness patterns were significantly different from the corresponding diversity patterns. In particular at the scale of built-up areas, divisions with high completeness values might not have been mapped well owing to a low diversity value.
- (3)
- The correlations between diversity patterns and each of the three socioeconomic factors, and the number of contributors were not only higher than those considering for completeness patterns, but also significantly positive. Thus, the diversity pattern is a better reflection of socioeconomic factors and the spatial pattern of contributors.
- (4)
- Both the completeness and the diversity patterns can be combined into different groups (high completeness and high diversity, high completeness and low diversity, low completeness and high diversity, and low completeness and low diversity). The combined patterns benefit both OSM users and volunteers in that they provide a better understanding of OSM-based LULC datasets.
Author Contributions
Funding
Acknowledgments
Conflicts of Interest
References
- Jones, D.A.; Hansen, A.J.; Bly, K.; Doherty, K.; Verschuyl, J.P.; Paugh, J.I.; Carle, R.; Story, S.J. Monitoring land use and cover around parks: A conceptual approach. Remote Sens. Environ. 2009, 113, 1346–1356. [Google Scholar] [CrossRef]
- Liang, J.; Zhong, M.; Zeng, G.; Chen, G.; Hua, S.; Li, X.; Yuan, Y.; Wu, H.; Gao, X. Risk management for optimal land use planning integrating ecosystem services values: A case study in Changsha, Middle China. Sci. Total Environ. 2017, 579, 1675–1682. [Google Scholar] [CrossRef] [PubMed]
- Mosadeghi, R.; Warnken, J.; Tomlinson, R.; Mirfendersesk, H. Comparison of fuzzy-AHP and AHP in a spatial multi-criteria decision making model for urban land-use planning. Comput. Environ. Urban Syst. 2015, 49, 54–65. [Google Scholar] [CrossRef]
- Reisi, M.; Aye, L.; Rajabifard, A.; Ngo, T. Land-use planning: Implications for transport sustainability. Land Use Policy 2016, 50, 252–261. [Google Scholar] [CrossRef]
- Hegazy, I.R.; Kaloop, M.R. Monitoring urban growth and land use change detection with GIS and remote sensing techniques in Daqahlia governorate Egypt. Int. J. Sustain. Built Environ. 2015, 44, 117–124. [Google Scholar] [CrossRef]
- Rimal, B.; Zhang, L.; Keshtkar, H.; Hacck, B.N.; Rijal, S.; Zhang, P. Land use/land cover dynamics and modeling of urban land expansion by the integration of cellular automata and Markov chain. Int. J. Geo-Inf. 2018, 77, 154. [Google Scholar] [CrossRef]
- Zeng, C.; Liu, Y.; Stein, A.L.; Jiao, L. Characterization and spatial modeling of urban sprawl in the Wuhan metropolitan area, China. Int. J. Appl. Earth Obs. Geoinf. 2015, 34, 10–24. [Google Scholar] [CrossRef]
- Chen, J.; Chen, J.; Liao, A.; Cao, X.; Chen, L.; Chen, X.; He, C.; Han, G.; Peng, S.; Lu, M.; et al. Global land cover mapping at 30 m resolution: A POK-based operational approach. ISPRS J. Photogramm. Remote Sens. 2015, 103, 7–27. [Google Scholar] [CrossRef]
- Grekousis, G.; Mountrakis, G.; Kavouras, M. An overview of 21 global and 43 regional land-cover mapping products. Int. J. Remote Sens. 2015, 36, 5309–5335. [Google Scholar] [CrossRef]
- Fritz, S.; See, L.; Perger, C.; McCallum, I.; Schill, C.; Schepaschenko, D.; Duerauer, M.; Karner, M.; Dresel, C.; Laso-Bayas, J.C.; et al. A global dataset of crowdsourced land cover and land use reference data. Sci. Data 2017, 4, 170075. [Google Scholar] [CrossRef]
- Hu, Y.; Han, Y. Identification of urban functional areas based on POI data: A case study of the Guangzhou Economic and Technological Development Zone. Sustainability 2019, 11, 1385. [Google Scholar] [CrossRef]
- Kang, J.; Körner, M.; Wang, Y.; Taubenböck, H.; Zhu, X.X. Building instance classification using street view images. ISPRS J. Photogramm. Remote Sens. 2018, 145, 44–59. [Google Scholar] [CrossRef]
- Pei, T.; Sobolevsky, S.; Ratti, C.; Shaw, S.; Li, T.; Zhou, C. A new insight into land use classification based on aggregated mobile phone data. Int. J. Geogr. Inf. Sci. 2014, 28, 1988–2007. [Google Scholar] [CrossRef]
- Goodchild, M. Citizens as sensors: The world of volunteered geography. GeoJournal 2007, 69, 211–221. [Google Scholar] [CrossRef]
- Arsanjani, J.J.; Helbich, M.; Bakillah, M.; Hagenauer, J. Toward mapping land-use patterns from volunteered geographic information. Int. J. Geogr. Inf. Sci. 2013, 27, 2264–2278. [Google Scholar] [CrossRef]
- Schultz, M.; Voss, J.; Auer, M.; Carter, S.; Zipf, A. Open land cover from OpenStreetMap and remote sensing. Int. J. Appl. Earth Obs. Geoinf. 2017, 63, 206–213. [Google Scholar] [CrossRef]
- Zhou, Q.; Jia, X.; Lin, H. An approach for establishing correspondence between OpenStreetMap and reference datasets for land use and land cover mapping. Trans. GIS 2019, 23, 1177–1464. [Google Scholar] [CrossRef]
- Shen, J.; Yang, S.; Zang, K.; Zhou, J.; Fan, H.; Mao, B. The opinion of crowd participatory for OpenStreetMap: A survey in China. Int. Arch. Photogramm. Remote Sens. Spat. Inf. Sci. 2018, 42, 1525–1531. [Google Scholar] [CrossRef]
- Arsanjani, J.J.; Vaz, E. An assessment of a collaborative mapping approach for exploring land use patterns for several European metropolises. Int. J. Appl. Earth Obs. Geoinf. 2015, 35, 329–337. [Google Scholar] [CrossRef]
- Viana, C.M.; Encalada, L.; Rocha, J. The value of OpenStreetMap historical contributions as a source of sampling data for multi-temporal land use/cover maps. Int. J. Geo-Inf. 2019, 8, 116. [Google Scholar] [CrossRef]
- Haklay, M. How good is volunteered geographical information? A comparative study of OpenStreetMap and Ordnance Survey datasets. Environ. Plan. B Plan. Des. 2010, 37, 682–703. [Google Scholar] [CrossRef]
- Girres, J.F.; Touya, G. Quality assessment of the French OpenStreetMap dataset. Trans. GIS 2010, 14, 435–459. [Google Scholar] [CrossRef]
- Zhang, Y.; Li, X.; Wang, A.; Bao, T.; Tian, S. Density and diversity of OpenStreetMap road networks in China. J. Urban Manag. 2015, 44, 135–146. [Google Scholar] [CrossRef]
- Zhou, Q. Exploring the relationship between density and completeness of urban building data in OpenStreetMap for quality estimation. Int. J. Geogr. Inf. Sci. 2018, 32, 257–281. [Google Scholar] [CrossRef]
- Tian, Y.; Zhou, Q.; Fu, X. An analysis of the evolution, completeness and spatial patterns of OpenStreetMap building data in China. ISPRS Int. J. Geo-Inf. 2019, 88, 35. [Google Scholar] [CrossRef]
- Estima, J.; Painho, M. Investigating the potential of OpenStreetMap for land use/land cover production: A case study for continental Portugal. In OpenStreetMap in GIScience, Lecture Notes in Geoinformation and Cartography; Jokar Arsanjani, J., Zipf, A., Mooney, P., Helbich, M., Eds.; Springer International Publishing: Cham, Switzerland, 2015. [Google Scholar]
- Dorn, H.; Törnros, T.; Zipf, A. Quality evaluation of VGI using authoritative data–A comparison with land use data in Southern Germany. ISPRS Int. J. Geo-Inf. 2015, 4, 1657–1671. [Google Scholar] [CrossRef]
- See, L.; Comber, A.; Salk, C.; Fritz, S.; Velde, M.; Perger, C.; Schill, C.; McCallum, I.; Kraxner, F.; Obsersteiner, M. Comparing the quality of crowdsourced data contributed by expert and non-experts. PLoS ONE 2013, 88, e69958. [Google Scholar] [CrossRef]
- Comber, A.; See, L.; Fritz, S.; Velde, M.; Perger, C.; Foody, G. Using control data to determine the reliability of volunteered geographic information about land cover. Int. J. Appl. Earth Obs. Geoinf. 2013, 23, 37–48. [Google Scholar] [CrossRef]
- Zhou, Q.; Tian, Y.J. The use of geometric indicators to estimate the quantitative completeness of street blocks in OpenStreetMap. Trans. GIS 2018, 22, 1550–1572. [Google Scholar] [CrossRef]
- Hristova, D.; Williams, M.; Musolesi, M.; Panzarasa, P.; Mascolo, C. Measuring urban social diversity using interconnected geo-social networks. In Proceedings of the 25th International Conference on World Wide Web, Montreal, QC, Canada, 11–15 April 2016. [Google Scholar]
- Vogiatzakis, L.N.; Manolaki, P. Investigating the diversity and variability of Eastern Mediterranean Landscapes. Land 2017, 66, 71. [Google Scholar] [CrossRef]
- Velazquez, J.; Gutierrez, J.; Hernando, A.; Garcia-Abril, A.; Martin, M.A.; Irastorza, P. Measuring mosaic diversity based on land use map in the region of Madrid, Spain. Land Use Policy 2018, 71, 329–334. [Google Scholar] [CrossRef]
- Nagendra, H. Opposite trends in response for the Shannon and Simpson indices of landscape diversity. Appl. Geogr. 2002, 22, 175–186. [Google Scholar] [CrossRef]
- Shannon, C.E.; Weaver, W. The Mathematical Theory of Communication; University of Illinois Press: Champaign, IL, USA, 1949. [Google Scholar]
- Neis, P.; Zielstra, D.; Zipf, A. Comparison of volunteered geographic information data contributions and community development for selected world regions. Future Internet 2013, 5, 282–300. [Google Scholar] [CrossRef]
- Fonte, C.C.; Martinho, N. Assessing the applicability of OpenStreetMap data to assist the validation of land use/land cover maps. Int. J. Geogr. Inf. Sci. 2017, 31, 2382–2400. [Google Scholar] [CrossRef]
- Johnson, B.A.; Lizuka, K. Integrating OpenStreetMap crowdsourced data and Landsat time-series imagery for rapid land use/land cover (LULC) mapping: Case study of the Laguna Bay area of the Philippines. Appl. Geogr. 2016, 67, 140–149. [Google Scholar] [CrossRef]
- Liu, X.; Long, Y. Automated identification and characterization of parcels with OpenStreetMap and points of interest. Environ. Plan. B Plan. Des. 2016, 43, 341–360. [Google Scholar] [CrossRef]
- Srivastava, S.; Lobry, S.; Tuia, D.; Vargas-Muñoz, J. Land-use characterisation using Google Street View pictures and OpenStreetMap. In Proceedings of the Association of Geographic Information Laboratories in Europe Conference (AGILE), Lund, Sweden, 12–15 June 2018. [Google Scholar]


| OSM Road Type | Buffer Radius (m) |
|---|---|
| trunk | 8 |
| motorway | 7.5 |
| primary | 10 |
| secondary | 7 |
| tertiary | 7 |
| residential1 | 6 |
| service | 5 |
| unclassified | 4.5 |
| No. | Typical OSM Tags | LULC Reference Classes |
|---|---|---|
| 1 | allotments; farm | agriculture |
| 2 | orchard; vineyard | orchard |
| 3 | forest; scrub | forest |
| 4 | grass; meadow | grass |
| 5 | ATM; bank; bar; cafe; cinema; commercial; computer shop; fast food; furniture shop; giftshop; hostel; mall; nightclub; restaurant; retail; supermarket; tower | commercial |
| 6 | industrial; quarry | industrial |
| 7 | residential2 | residential |
| 8 | artwork; college; hospital; library; museum; police; post office; school; sports center; stadium; toilet; university; zoo | public use |
| 9 | attraction; Christian; memorial; military; monument; Muslim; prison; shelter | special use |
| 10 | airport; bus station; parking; primary; rail; secondary; tertiary; trunk; unclassified | transportation |
| 11 | beach; dam; dock; reservoir; river; water; waterfall; wetland | water |
| 12 | cliff; heath | others |
| Agricultural | Orchard | Forest | Grass | Commercial | Industrial | Residential | Public Use | Special Use | Transportation | Water | Others | PA (%) | |
|---|---|---|---|---|---|---|---|---|---|---|---|---|---|
| Agricultural | 260 | 6 | 32 | 8 | 4 | 3 | 6 | 0 | 4 | 3 | 8 | 14 | 74.7 |
| Orchard | 1 | 81 | 1 | 0 | 1 | 0 | 1 | 0 | 1 | 0 | 0 | 5 | 89.0 |
| Forest | 8 | 1 | 921 | 5 | 4 | 5 | 4 | 12 | 58 | 0 | 5 | 10 | 89.2 |
| Grass | 4 | 0 | 17 | 57 | 3 | 0 | 1 | 2 | 1 | 0 | 2 | 3 | 63.3 |
| Commercial | 0 | 0 | 0 | 6 | 112 | 1 | 2 | 5 | 0 | 4 | 0 | 0 | 86.2 |
| Industrial | 5 | 2 | 4 | 1 | 2 | 166 | 11 | 1 | 0 | 0 | 0 | 2 | 85.6 |
| Residential | 5 | 2 | 4 | 7 | 6 | 1 | 275 | 3 | 1 | 14 | 2 | 1 | 85.7 |
| Public Use | 0 | 3 | 6 | 36 | 6 | 3 | 19 | 138 | 2 | 13 | 7 | 2 | 58.7 |
| Special Use | 0 | 1 | 0 | 4 | 1 | 0 | 1 | 0 | 86 | 0 | 0 | 0 | 92.5 |
| Transportation | 10 | 1 | 8 | 30 | 2 | 7 | 8 | 0 | 3 | 325 | 2 | 1 | 81.9 |
| Water | 2 | 1 | 3 | 4 | 0 | 0 | 1 | 6 | 1 | 0 | 364 | 3 | 94.5 |
| Others | 5 | 2 | 11 | 5 | 6 | 14 | 5 | 3 | 23 | 1 | 10 | 62 | 42.2 |
| UA (%) | 86.7 | 81.0 | 91.5 | 35.0 | 76.2 | 83.0 | 82.3 | 81.2 | 47.8 | 90.3 | 91.0 | 60.2 | OA (%) = 82.2 |
| Pattern | Size of Built-Up Areas (BUA) | Population (POP) | Gross Domestic Product (GDP) | Number of Contributors, Scenario I (NC-I) | Number of Contributors, Scenario II (NC-II) |
|---|---|---|---|---|---|
| Completeness-I (completeness; scenario I) | 0.115 * | −0.006 | 0.157 ** | 0.116 * | / |
| Diversity-I (diversity; scenario I) | 0.285 ** | 0.282 ** | 0.248 ** | 0.249 ** | / |
| Completeness-II (completeness; scenario II) | −0.262 ** | −0.245 ** | −0.029 | / | −0.113 * |
| Diversity-II (diversity; scenario II) | 0.367 ** | 0.375 ** | 0.412 ** | / | 0.429 ** |
| Number of contributors, scenario I | 0.681 ** | 0.659 ** | 0.855 ** | 1.000 ** | 1.000 ** |
| Number of contributors, scenario II | 0.722 ** | 0.645 ** | 0.799 ** | 1.000 ** | 1.000 ** |
© 2020 by the authors. Licensee MDPI, Basel, Switzerland. This article is an open access article distributed under the terms and conditions of the Creative Commons Attribution (CC BY) license (http://creativecommons.org/licenses/by/4.0/).
Share and Cite
Wang, S.; Zhou, Q.; Tian, Y. Understanding Completeness and Diversity Patterns of OSM-Based Land-Use and Land-Cover Dataset in China. ISPRS Int. J. Geo-Inf. 2020, 9, 531. https://doi.org/10.3390/ijgi9090531
Wang S, Zhou Q, Tian Y. Understanding Completeness and Diversity Patterns of OSM-Based Land-Use and Land-Cover Dataset in China. ISPRS International Journal of Geo-Information. 2020; 9(9):531. https://doi.org/10.3390/ijgi9090531
Chicago/Turabian StyleWang, ShuZhu, Qi Zhou, and YuanJian Tian. 2020. "Understanding Completeness and Diversity Patterns of OSM-Based Land-Use and Land-Cover Dataset in China" ISPRS International Journal of Geo-Information 9, no. 9: 531. https://doi.org/10.3390/ijgi9090531
APA StyleWang, S., Zhou, Q., & Tian, Y. (2020). Understanding Completeness and Diversity Patterns of OSM-Based Land-Use and Land-Cover Dataset in China. ISPRS International Journal of Geo-Information, 9(9), 531. https://doi.org/10.3390/ijgi9090531