1. Introduction
The borehole log is a kind of comprehensive geological diagram, which can be used for the description of the stratum name, stratum thickness, lithology characteristic, geological structure and contact relationship, groundwater sampling and testing, borehole structure and drilling situation of strata. The borehole log is a basis for analyzing engineering–geological conditions and drawing geological maps. As an important reference for visualization of underground exploration information, the borehole log plays an important role in the analysis and decision-making of various underground projects.
The three-dimensional model of urban geology, built based on borehole data and other survey data, can intuitively show the geometry, physical properties, and interrelationships of objects in the underground space, so it can be used as an integrated carrier of geological resources and environmental big data. Comprehensive analysis based on 3D geological model objects and their associated attributed information has great advantages in the monitoring of urban geological environment and the development and utilization of underground space.
Papery borehole data is the basis for constructing a three-dimensional urban geological model, and it is also the basic reference for constructing geological resources and environmental monitoring and pre-warning systems and formulating a comprehensive urban geological survey plan. In the past practice, manual data collection from paper documents was required to complete the extraction of borehole information. Due to the diversity of borehole sources and different standards for stratigraphic divisions, before borehole data can be used for 3D geological modeling, a standard stratum comparison table must be developed in advance according to the geological conditions in the local area. Even if the borehole data is standardized according to the table, and the boundary points of the stratum exposed by the borehole are interpolated, the resulting geological model often conflicts with geological knowledge and needs to be continuously revised in the later stage. This traditional 3D modeling method of urban geology based on papery borehole log has disadvantages such as high error rate and low efficiency.
To improve the utilization efficiency of papery borehole logs and make the results of 3D geological modeling more reasonable, this paper proposes a method for quickly and intelligently recognizing and processing papery borehole log information and optimizing the modeling process after repeated analysis and practice. On the one hand, this method can quickly extract information from the papery borehole log, and fill and replace the data with lower confidence rates in it to improve the efficiency. On the other hand, it can integrate geological knowledge into the modeling process, pinch-out and faults caused by data errors are reduced, and the rationality of the 3D geological model is improved. The feasibility and effectiveness of the method were verified by applying this method to the practical link of 3D modeling of urban geology in Xinyang.
In
Section 2, this paper describes the related research work of papery borehole data extraction and geological knowledge fusion modeling process. The construction flow of 3D urban geological model is introduced in
Section 3. In
Section 4, this paper introduces the process of automatically extracting information from a papery borehole log, standardizing it into a database, and processing it into geological spatial data that can be used directly. In
Section 5, this paper describes the integration of geological knowledge to optimize the 3D geological modeling process based on the existing geological maps, to obtain a reasonably usable 3D geological model. In
Section 6, this paper shows the experimental results in the 3D modeling of urban geology in Xinyang by using the method proposed in this paper. In
Section 7, conclusions and suggestions are put forward for future improvement.
2. Related Work
2.1. Status of Research on Information Extraction from a Papery Borehole Log
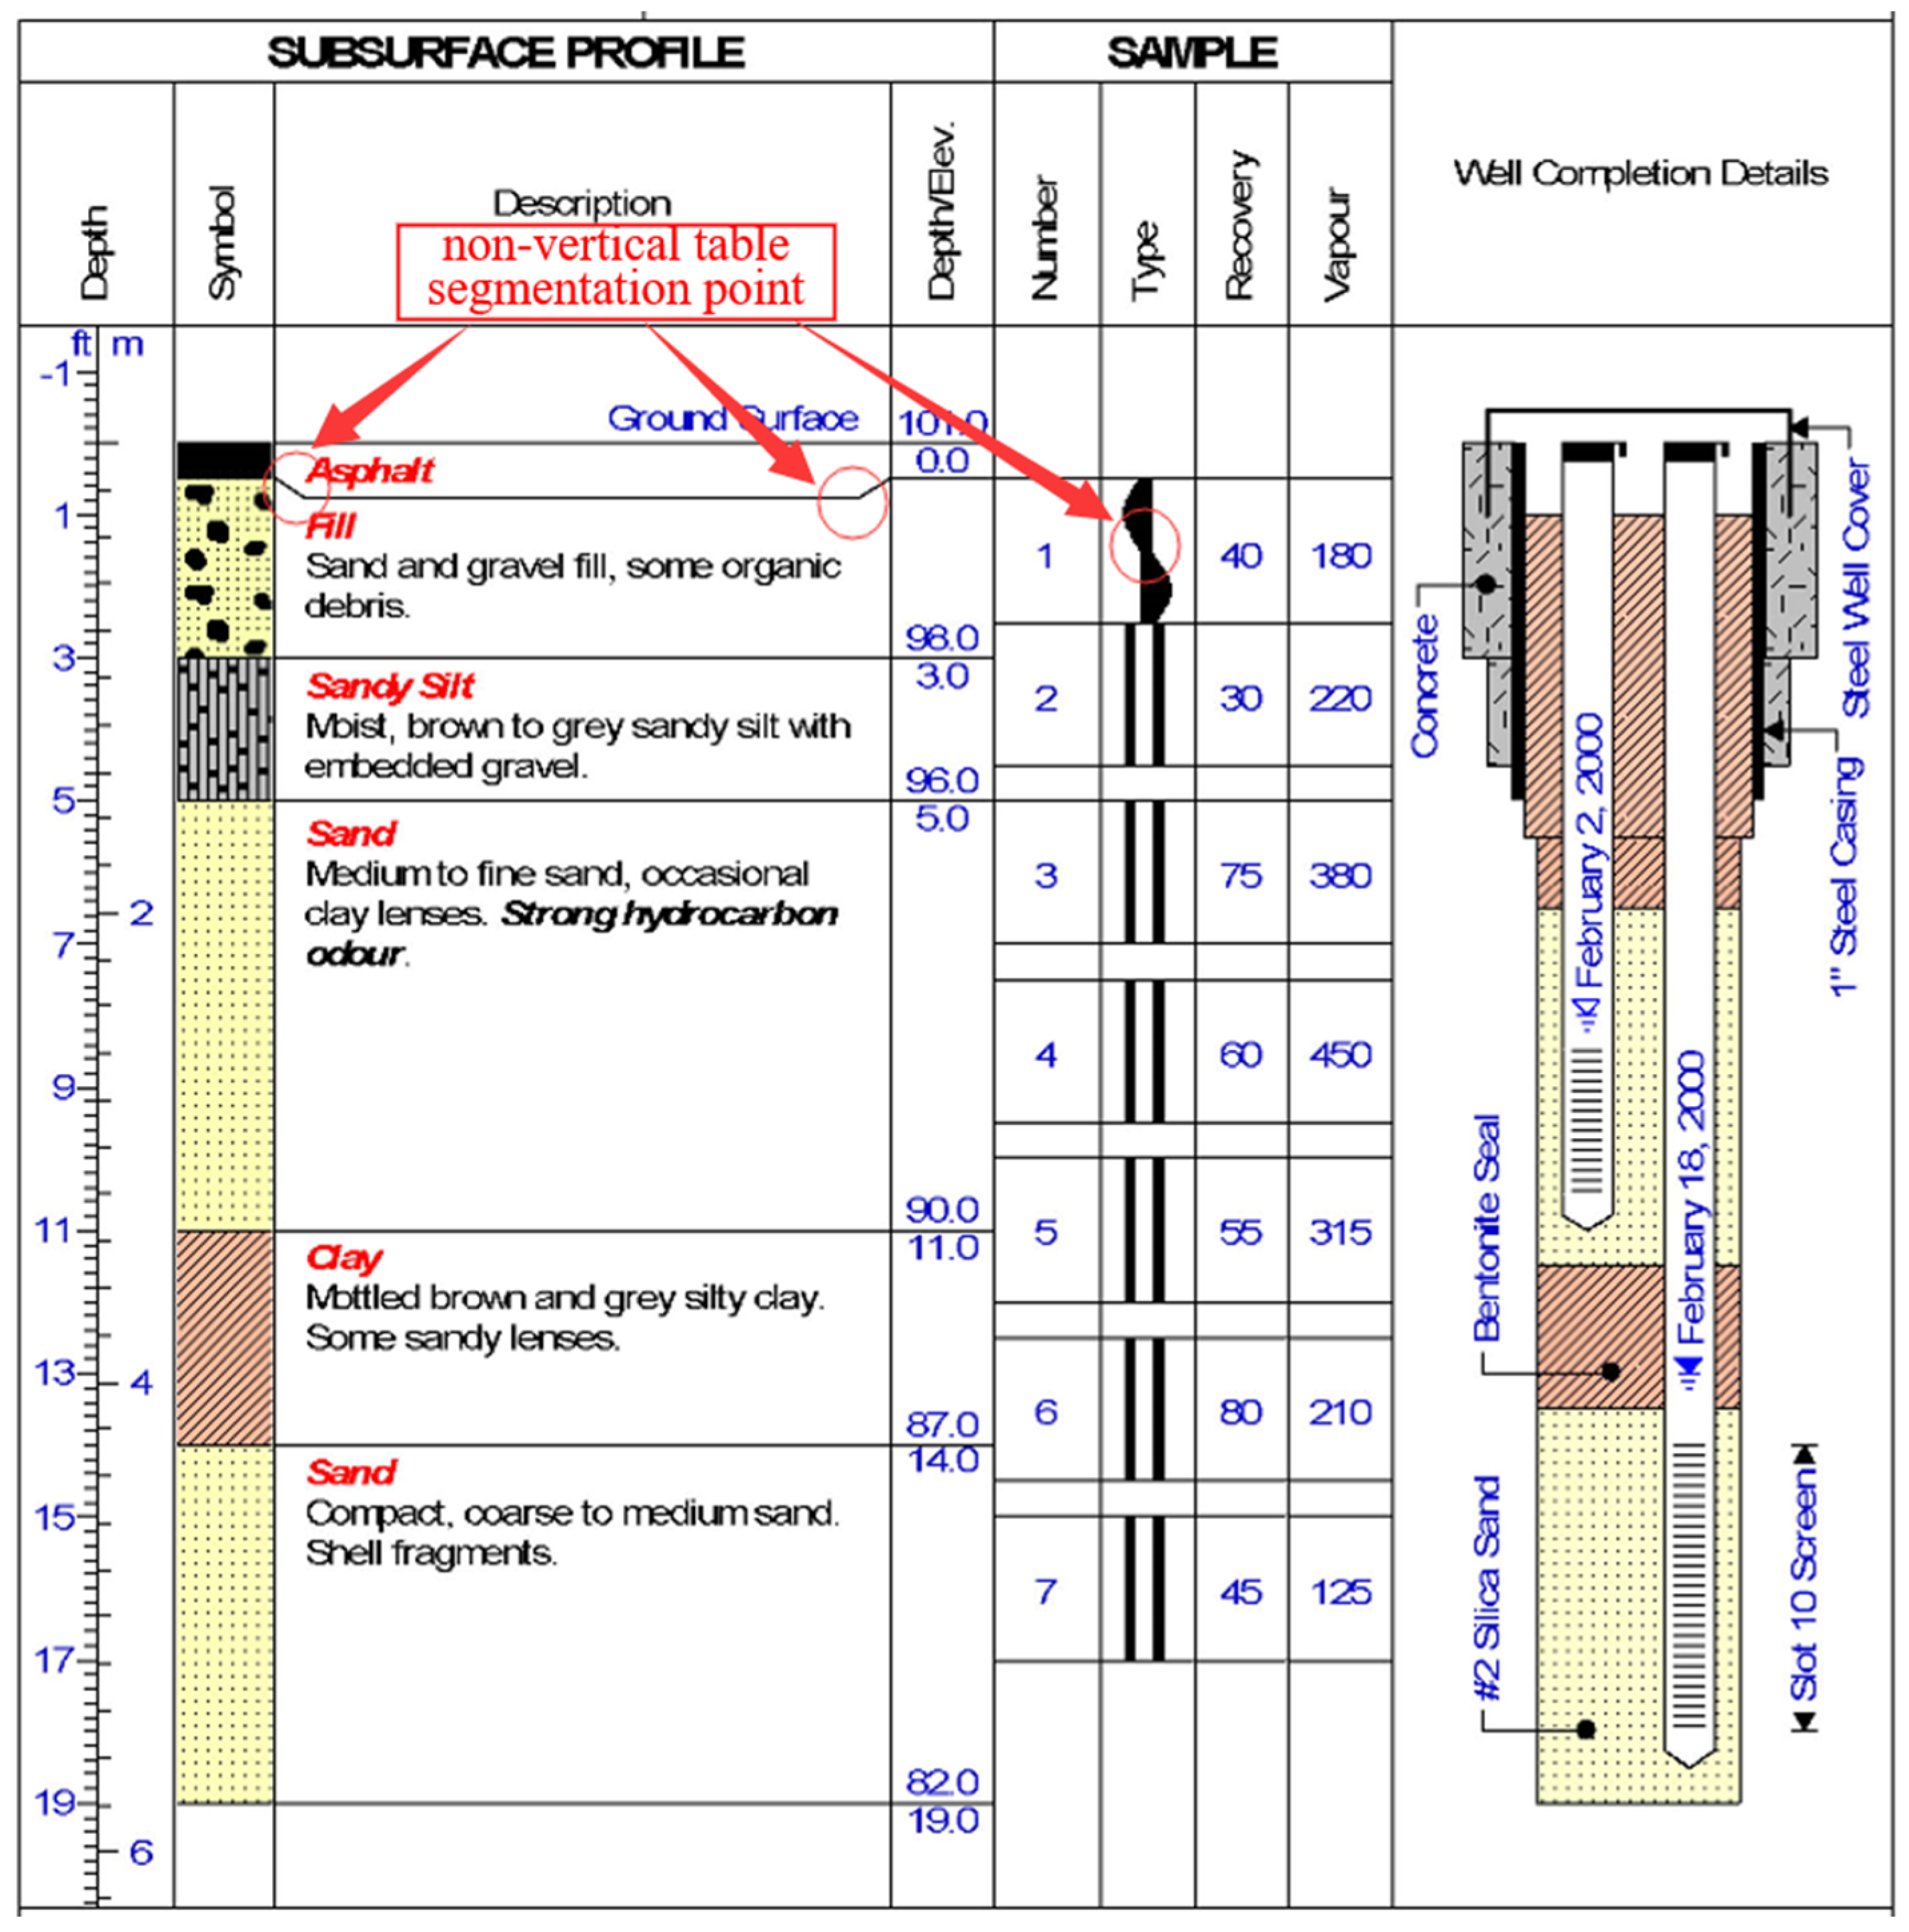
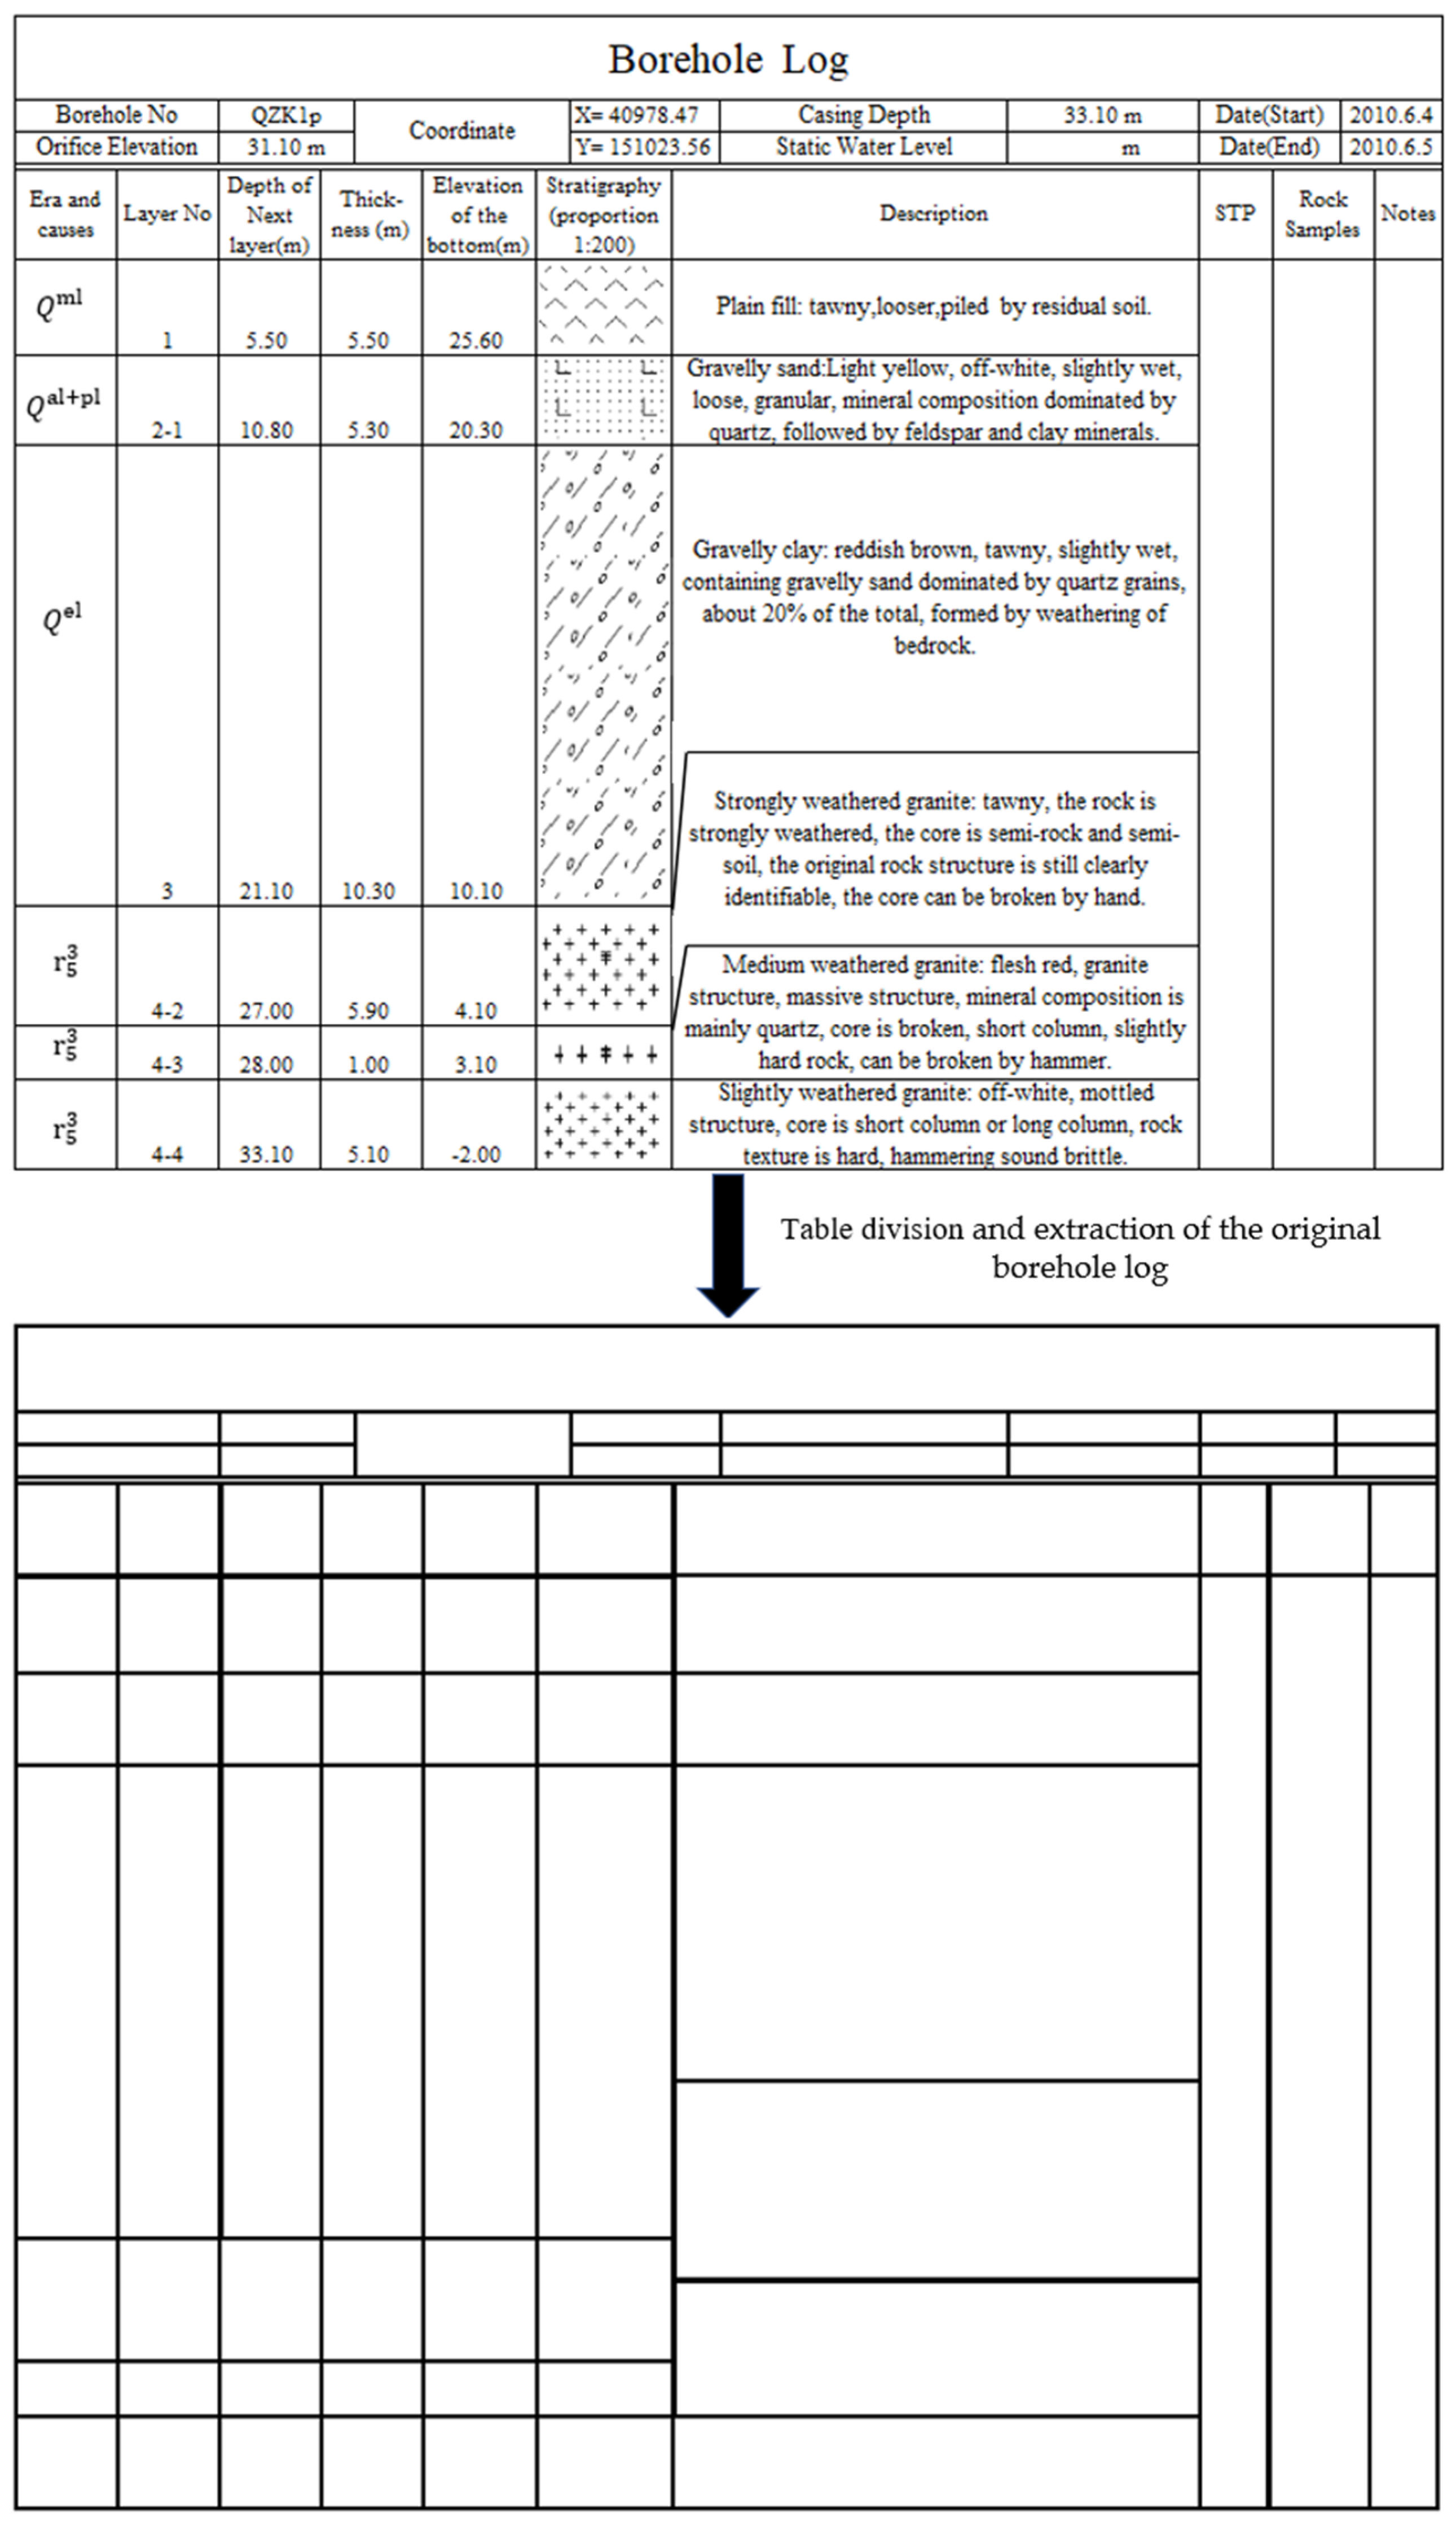
To construct an intelligent system for geological 3D modeling and reduce manual operations, this paper considers the papery borehole log as tabular data and converts the information extracted from the papery borehole log into tabular data. In this way, this paper has done some research on table recognition. On the issue of simple text recognition, there are better models in the industry at present, but even if it is converted into information recognition of tabular data, due to a large number of non-vertical table segmentation points in the borehole log as shown in
Figure 1, the table recognition model cannot be directly used for borehole log, and there is no direct research about information extraction from a papery borehole log.
The traditional method is to manually convert the papery borehole log. In 2006, Hua Weihua used a domestic geographic information software MapGIS as a platform to implement a generating and editing information management system of a single well log that can be applied to engineering geology and hydrogeology [
1]. In 2009, Zhang Shengwei designed the borehole database system based on Microsoft SQL Server 2000 and automatically generated the log through its own management of the geological database [
2].
Based on CAD engineering drawings, the method of automatically extracting component information [
3], proposed by Hu Min of Zhejiang University in 2000, can be used as a reference. Like geological drawings, there are also a lot of staggered forms where the table crossing lines are not in the same position in the engineering drawings. As shown in
Figure 2, the special cases of the table crossing lines can be determined manually, thereby improving the accuracy of the table recognition; Richard Zanibbi in 2004 summarized the table recognition methods before the 21st century and defined the table model as a complex of observed features and logical structures [
4]. Observation characteristics refer to the data storage method of paper or network, and the logical structure refers to the storage mode of tables. For example, traditional tables use perpendicular coordinates as the basic form. There are a lot of non-vertical line tables and legends in the borehole log. Therefore, the recognition model of the borehole log cannot directly refer to the table recognition models of other fields. With the semi-structured text proposed by Pan Xiaoyan of HIT in 2008 [
5] even manually adding the table features by the maximum entropy model, a sample of the logical structure characteristics of the table needs to be supplemented later in the table recognition model.
The table data extraction recently has been mainly based on deep learning, citing a large amount of historical data to train models and improve accuracy. Weintraub uses a PDF as a paradigm to process the table information in web pages and pictures. This paper, like the idea of Weintraub, also unifies the basic data into the same format, which facilitates the subsequent overall processing. Schreiber Sebastian scanned the original table image with image recognition in 2018 and detected the table line and located the cells so as to obtain a higher recognition rate of table content [
6].
2.2. Status of Research on Integration of Geological Knowledge into 3D Geological Modeling
Over the past few decades, researchers have developed many 3D geological software and tools that are widely used by industry. The geologists have used these tools to produce many geological maps over the decades, which can assist in geological modeling.
The quality of the 3D geological model depends on the accuracy of the data and is limited by the actual engineering project. The amount of data used for modeling is limited and the distribution is uneven. Even the geological models drawn automatically by interpolation algorithms cannot support them well. The construction of complex geological models has affected subsequent geological structure analysis. Therefore, in the actual production process, integration of geological knowledge is an essential link with the guidance of expert knowledge.
In the early stage, the integration of geological knowledge into 3D modeling is usually based on the opinions of experts and scholars, so as to evaluate and revise the collected data and modeling data of previous samples, focusing on the experience accumulation of researchers’ geological knowledge. In 2005, Michel Perrin introduced the Geological Evolution Scheme (GES) standard geological descriptors from the geological composition of various continuous time geological objects. An example illustrates how GES is used to derive shared structures and geological models that can be reused by geologists throughout the workflow. This knowledge-driven idea created the model of shared earth, which is widely adopted in today’s research work [
7].
Driven by geological knowledge, Mohamad Abd Manap mapped and modeled Malacian groundwater based on a GIS model with a multifactor weighted linear combination of lithology, elevation and geomorphology, where each parameter and the weighted score is based on expert opinion and investigation. Not only does this fast method reduce costs, but the model can also be quickly transferred to areas with similar geological features [
8]. In recent years, with the continuous development of machine learning, scholars have begun to use historical geographic data sets as training samples, combining geological knowledge and statistical knowledge, incorporating past geological knowledge and experience into the new training models. The model process flow has gradually become more intelligent. G. McKay introduced a data-driven random forest model and geological knowledge-driven mineral vision mapping method in the gold mine case study to better describe a comprehensive lake sediment address data set [
9]. Maysam Abedi refined and summarized the multi-criteria decision-making method, which was used in mineral mapping based on various types of geographic data sets in the past. The prospective map of porphyry copper deposits produced by this method is satisfactory and can also be applied for other similar geological conditions [
10]. Chen Qiyu proposed a three-dimensional stochastic modeling process based on multi-point geostatistics in 2018 to address the problem of uneven data distribution during exploration, and integrated multi-source and multi-type geological data. Therefore, 3D modeling software can quickly build low-dimensional geological models without relying on complete borehole data sets [
11].
The consensus of researchers is to minimize the manual operation and modification of data by experts and combine deep learning to convert past data into intelligent rules to generate three-dimensional geological models. Therefore, this paper relies on the papery borehole data set and uses it as the basic data source to try to recognize and organize the accumulated data in the past, integrate geological knowledge and experience, reduce manual intervention as much as possible, and complete the intelligent construction process of the urban geological 3D model.
3. Construction Flow of 3D Urban Geological Model
In this section, we generally introduce the intelligent modeling flow of the 3D geological model based on the papery borehole log. Two more detailed parts of this method will be described in
Section 4 and
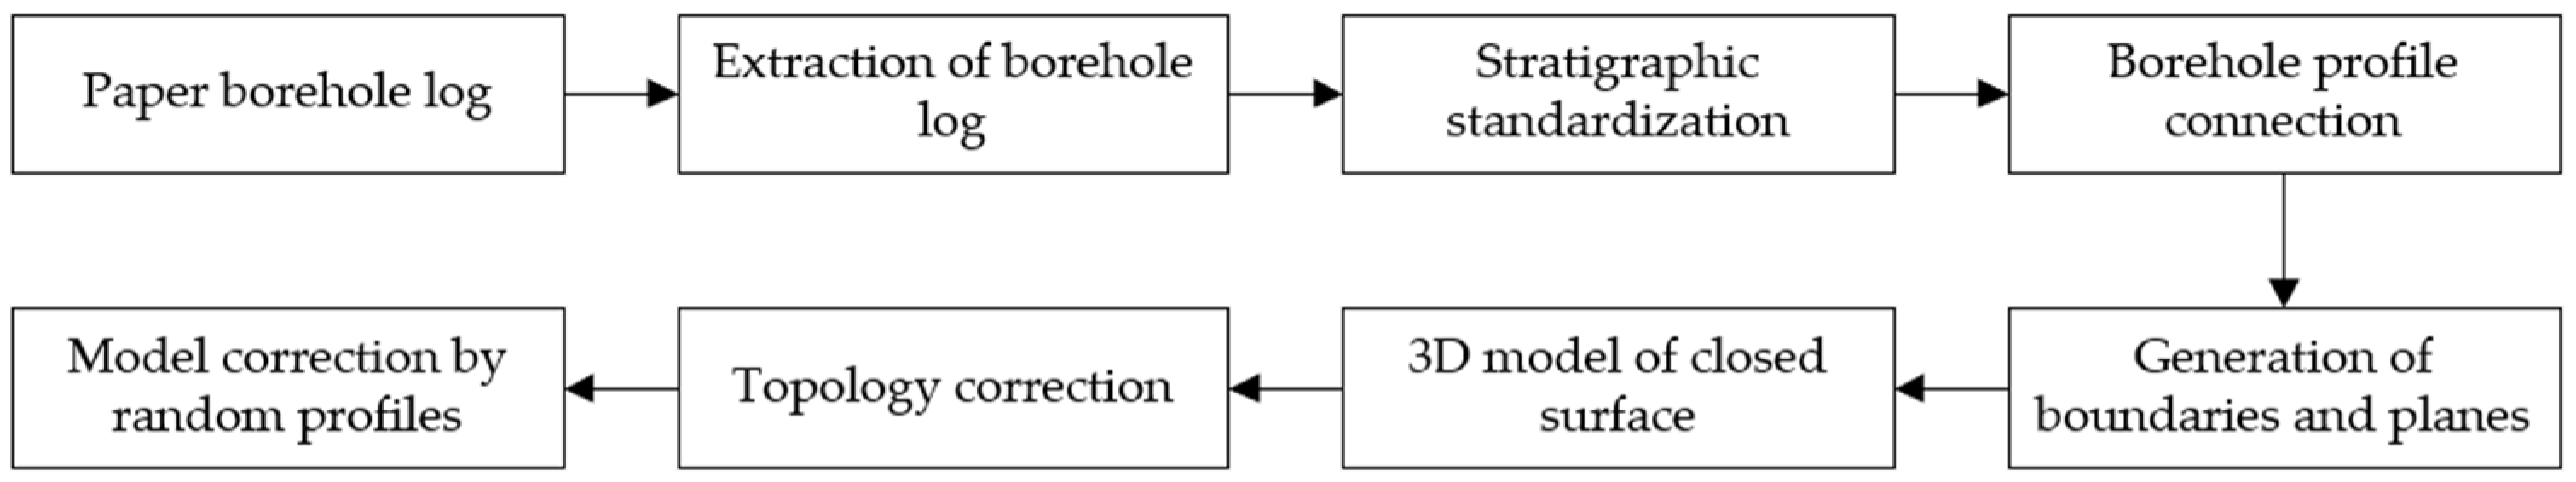
Section 5. The general method first uses toponymic matching to spatially locate the boreholes with missing coordinates, then uses machine learning to extract information from the papery borehole log, standardize and classify the stratigraphic name and number, and connect the borehole sections of the same stratum, using data from the boreholes’ stratigraphic delimitation points. After these lines are obtained, the stratigraphic boundaries are spatially interpolated to generate the subinterfaces of each stratum, and the geological subinterfaces are used to form a composite for the expression of the geological structural surface. Finally, a voxel model is generated based on the surface model for modeling and representation of the attribute information. The overall process can be represented in
Figure 3.
However, due to the uneven distribution of borehole data, the results of geometric interpolation modeling may not be consistent with geological common sense. In the process of obtaining geological model through geometric interpolation, to integrate geological knowledge into the 3D geological modeling to improve its accuracy, this paper continuously generates auxiliary profiles and improves them in accordance with the geological conditions or maps. This method can improve the accuracy of each model generated during the integration process, and geological analysis can be assisted quickly and effectively. In addition, after the model is closed, the topological correction is mainly to solve the topological relationship between geological bodies, especially special geological conditions such as zero stratum thickness.
4. Processing of Papery Borehole Data Based on Machine Learning
There are problems of low efficiency and poor accuracy in extracting information manually from borehole logs. To improve the efficiency and accuracy, this paper proposes a machine learning-based information extraction method for papery borehole logs based on the characteristics of paper.
4.1. Characteristics of Papery Borehole Logs
The accuracy of urban 3D geological modeling depends on the reliability of the modeling data. Based on the papery borehole log, the usability of the three-dimensional geological model mainly depends on the quality of data extraction. Compared with other kinds of data, the papery borehole log has its own characteristics, which lead to many difficulties [
12].
(1) Difficulty in extracting information. Papery borehole logs have high requirements for the temperature and humidity of the archive room, and most paper-based geological data have not been well protected during the preservation process, resulting in many of these drawings becoming brittle and yellow. There is also the phenomenon of flipping, which brings great difficulties to the use of papery borehole logs. Therefore, in the process of papery table recognition, this paper adds a preprocessing process to the image data [
13,
14].
(2) Missing coordinates. For the different survey units of urban geological data, the local coordinate systems used are also different, which makes the coordinate system of papery borehole data inconsistent. Some engineering surveys are only to meet the needs of a certain project, and the borehole coordinates are not specified. The information related to its location is only the name of the project, which makes it difficult to spatialize the borehole data. Therefore, there is a large amount of interpolation processing in the subsequent intelligent 3D modeling [
15].
(3) Different data standards. For the different accuracy of engineering surveys, the stratigraphic division standards of borehole logs are inconsistent, and the standards of different surveying units are also inconsistent. Only independent local geological models can be formed by local data within a limited range in practice. At the city scale, many sources of data cannot be converted, and a larger-scale urban geological information model cannot be built uniformly. Therefore, this paper focuses on the standardization of stratigraphic data, so that all types of data can be integrated and unified in advance for software to generate models.
(4) Low data quality. Limited to the survey level contemporarily, the errors of the borehole data are large, especially the reliability of the sampling data and the experimental data in the boreholes are low. Due to the lack of surveying methods, these borehole data related to urban spatial layout, resource development, environment protection, and disaster prevention, are insufficient, and the integration of data models and geological knowledge is required to handle unreasonable spatial data.
4.2. Processing of Borehole Data
With some difficulties of the above-mentioned papery borehole log, it can be known that using papery borehole log data to perform three-dimensional modeling of urban geology has two main difficulties: intelligent extraction of borehole information and standardization of stratum. Therefore, this paper proposes an automatic extraction method of borehole information based on table recognition for the extraction and standardization of borehole data, which makes the data processing flow more intelligent, reduces manual operations, and improves data accuracy. In addition, due to frequent human activity and natural evolution, the structure and location of the urban geological body have changed to some extent over time. The stratigraphic coordinates in some historical borehole log cannot accurately reflect the current geological situation. In particular, coordinates for strata are easily influenced by the compaction of unconsolidated sands layer, underground water extraction combined with elastic and isostatic crustal subsidence, and surficial changes in the cultural layer. Therefore, before being stored in the database, they need to be artificially corrected for time changes, geological common sense, and current conditions to improve the model’s accuracy.
4.2.1. Automatic Information Extraction of Borehole Logs
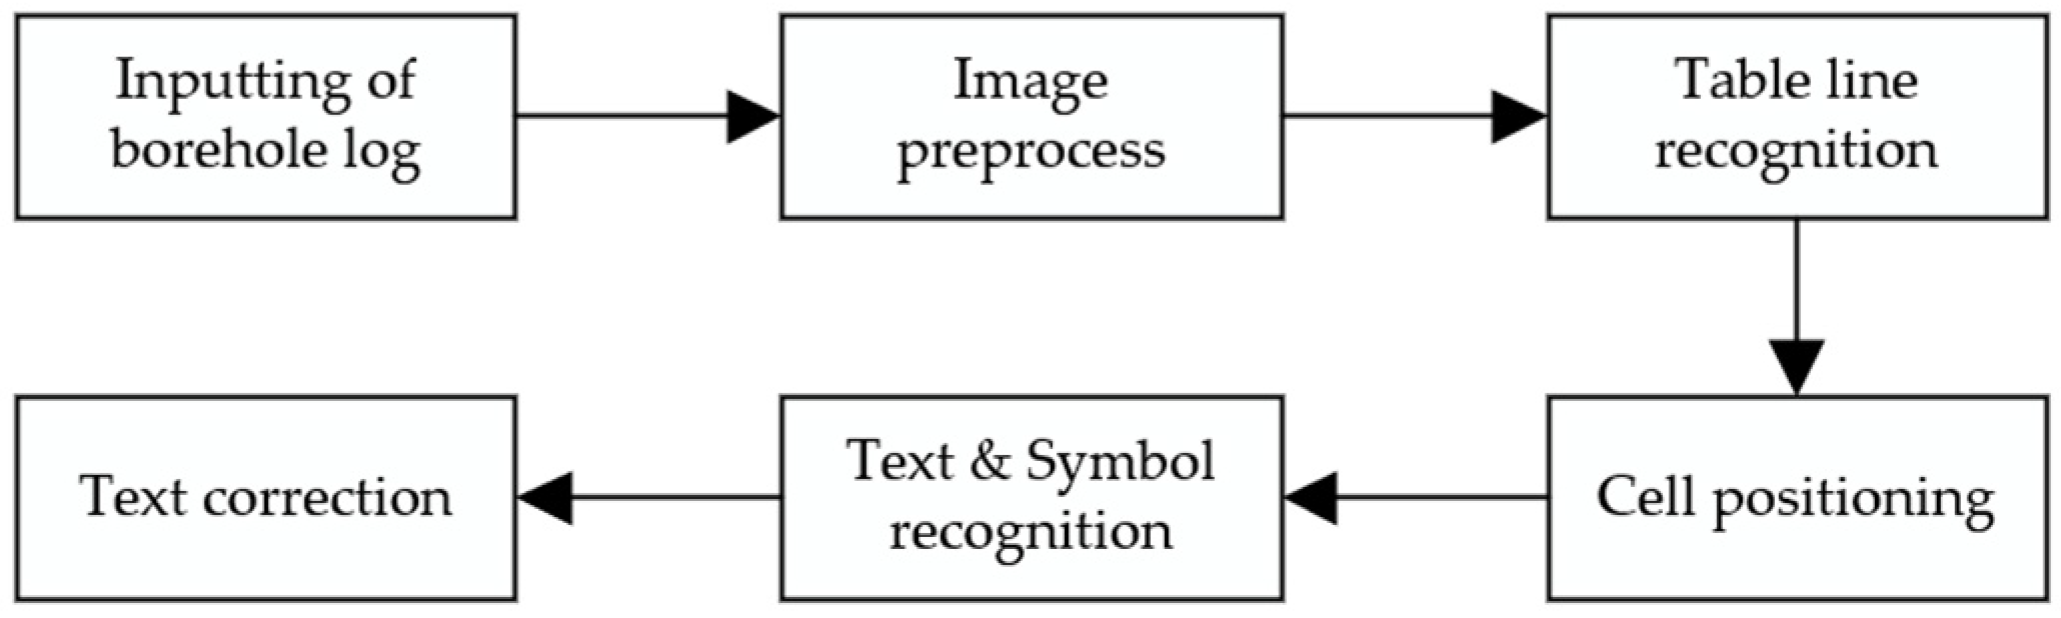
The currently available papery borehole data is mainly papery data, supplemented by digital files such as CAD. Therefore, this paper proposes a method that can extract borehole information from relevant images. The general process is shown in
Figure 4.
(1) Inputting of the borehole log. Papery documents are usually processed into image formats by taking pictures or scanning. Digital documents are stored as geological files in different software and different formats. In this paper, all files were exported to the unified image format for subsequent data processing.
(2) Image preprocessing. After the papery and digital documents are processed into a format that can be recognized by the program, the global mapping method is used to grayscale the image, which can improve the sharpness of the image outline and reduce the impact of irrelevant information on subsequent processing. Then, an appropriate threshold is selected to binarize the gray-scaled images, which can be converted into black and white images that will be stored as a data set. The binarization operation leaves the image with only black table lines and text and a white background, and the rest of the information is erased.
(3) Recognition of table line. The Hough transform [
16] is used to identify the straight lines in the table document. It is a reliable method for detecting straight lines in image processing, aiming to take advantage of the symmetry of points and lines to convert a curve in the original image space into a point in the parametric space through the expression of the curve, so the problem of detecting straight lines in the original image is converted into a problem of finding peaks in the parametric space. The segmented lines of the table are obtained by filtering the interference lines generated by the text according to the corresponding threshold.
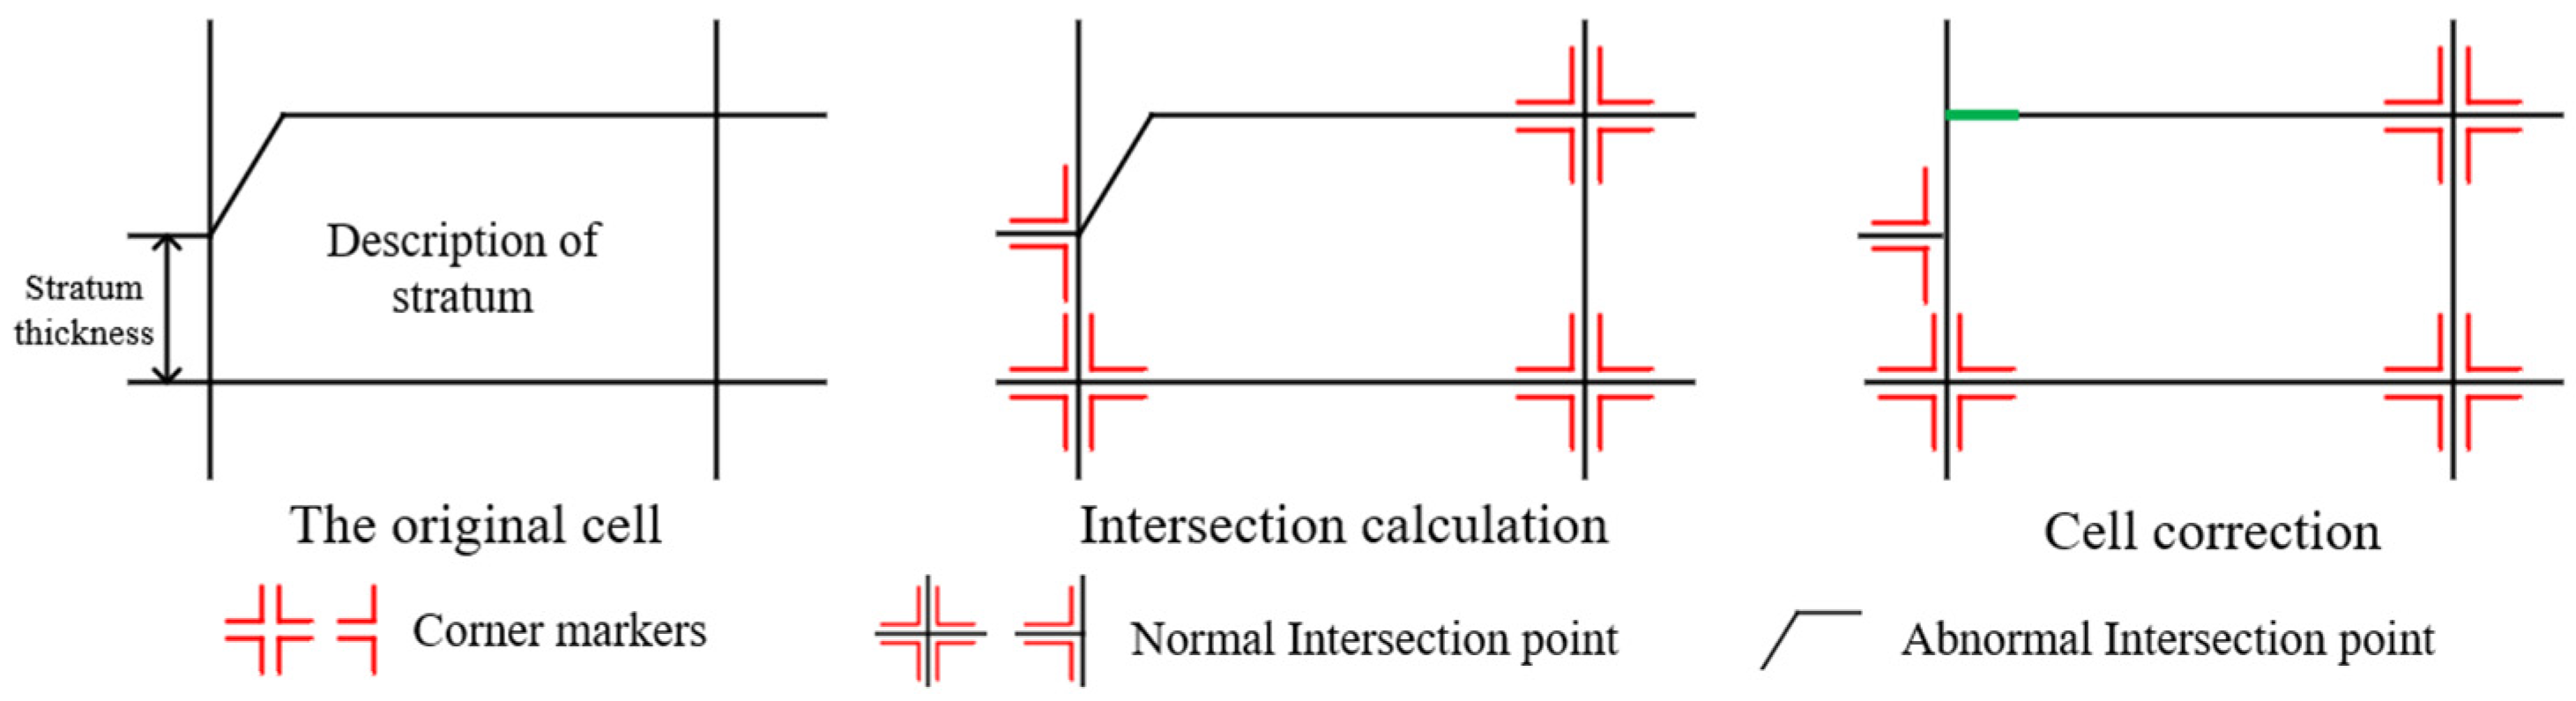
(4) Cell positioning. The intersection calculation based on the obtained table lines is performed to get the cell’s corner markers, which are formed by crossing horizontal and vertical lines. However, since the descriptive text of the stratum occupies a much larger width than the symbolic thickness of the stratum in the log, there are some abnormal intersections in the table, such as the intersection point of a slash and a straight line, which cannot be detected by intersection calculation. The corner markers are missing in cells, so it is impossible to get a full cell. As shown in
Figure 5, if a segmented line has only one intersection point, there is an abnormal point on the other side of it. Therefore, the line needs to be extended to the normal intersection point, such as the green line.
(5) Text and symbol recognition. Information extraction from borehole logs can be seen as a flow which is about identifying the log as a feature label, performing optical character recognition (OCR) [
17] on the image text, binding the text description information and the characteristics of the log. As the borehole log has a relatively fixed format, the text sections are treated as rectangles of different sizes and processed in a table-recognized manner during data extraction. Meanwhile, a corresponding table text recognition model can be built, according to different parameters such as the number of columns and header files.
(6) Text correction. Some words in the cell are unclear or complex, which will be recognized as different results. Therefore, the method of Top K is used to extract the top k words with the highest identification similarity. Their words are combined with the geological corpus to select an optimal word as the identification result.
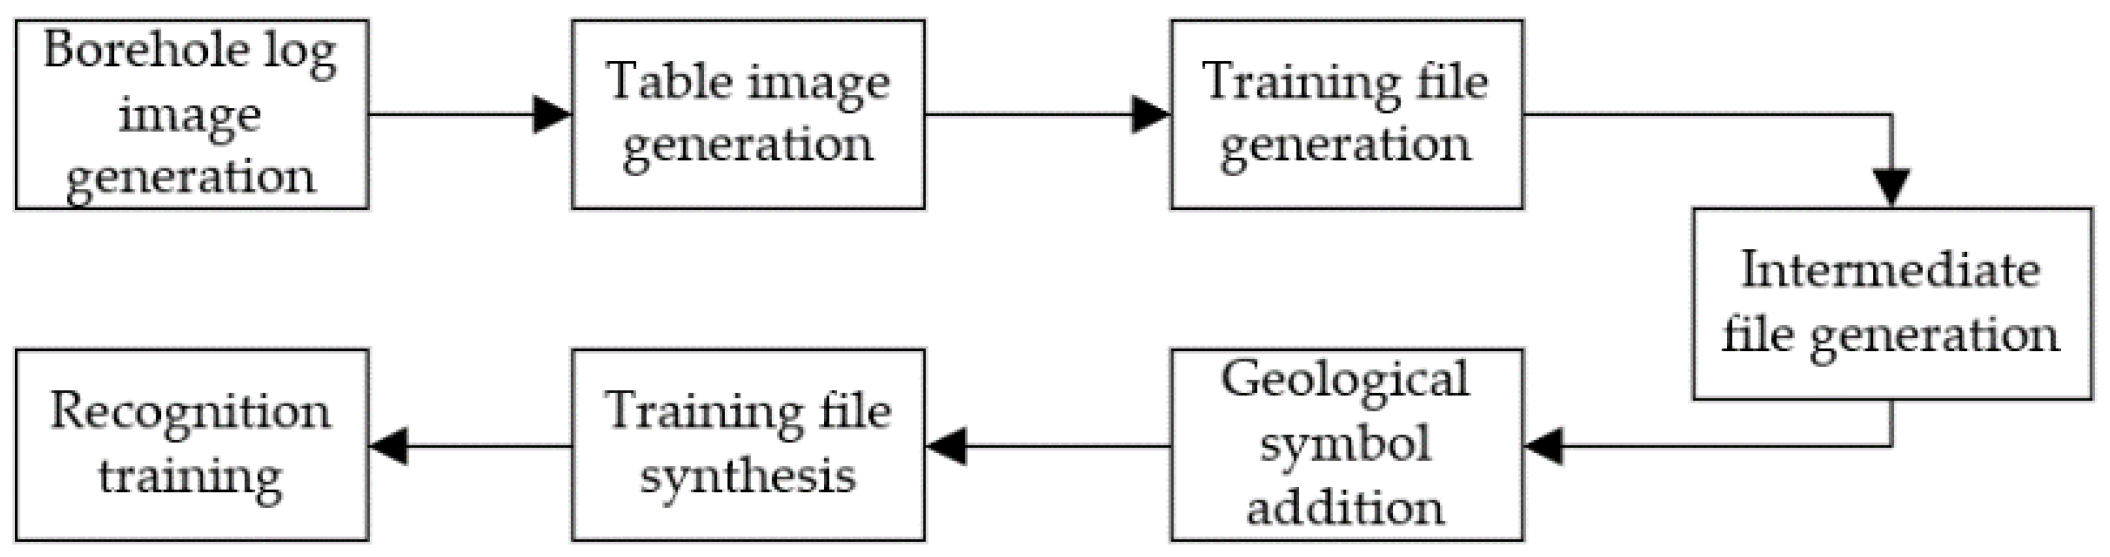
The training process of the information extraction model is as shown in
Figure 6. We first need to collect or generate thousands of borehole log images and table images. Then, the training file and intermediate file are prepared for the training model. To improve accuracy, the geological symbol is added to the training process. Finally, the information extraction model is trained with the processed data and files.
There are a number of open-source machine learning frameworks, such as
TensorFlow,
PyTorch,
Caffe,
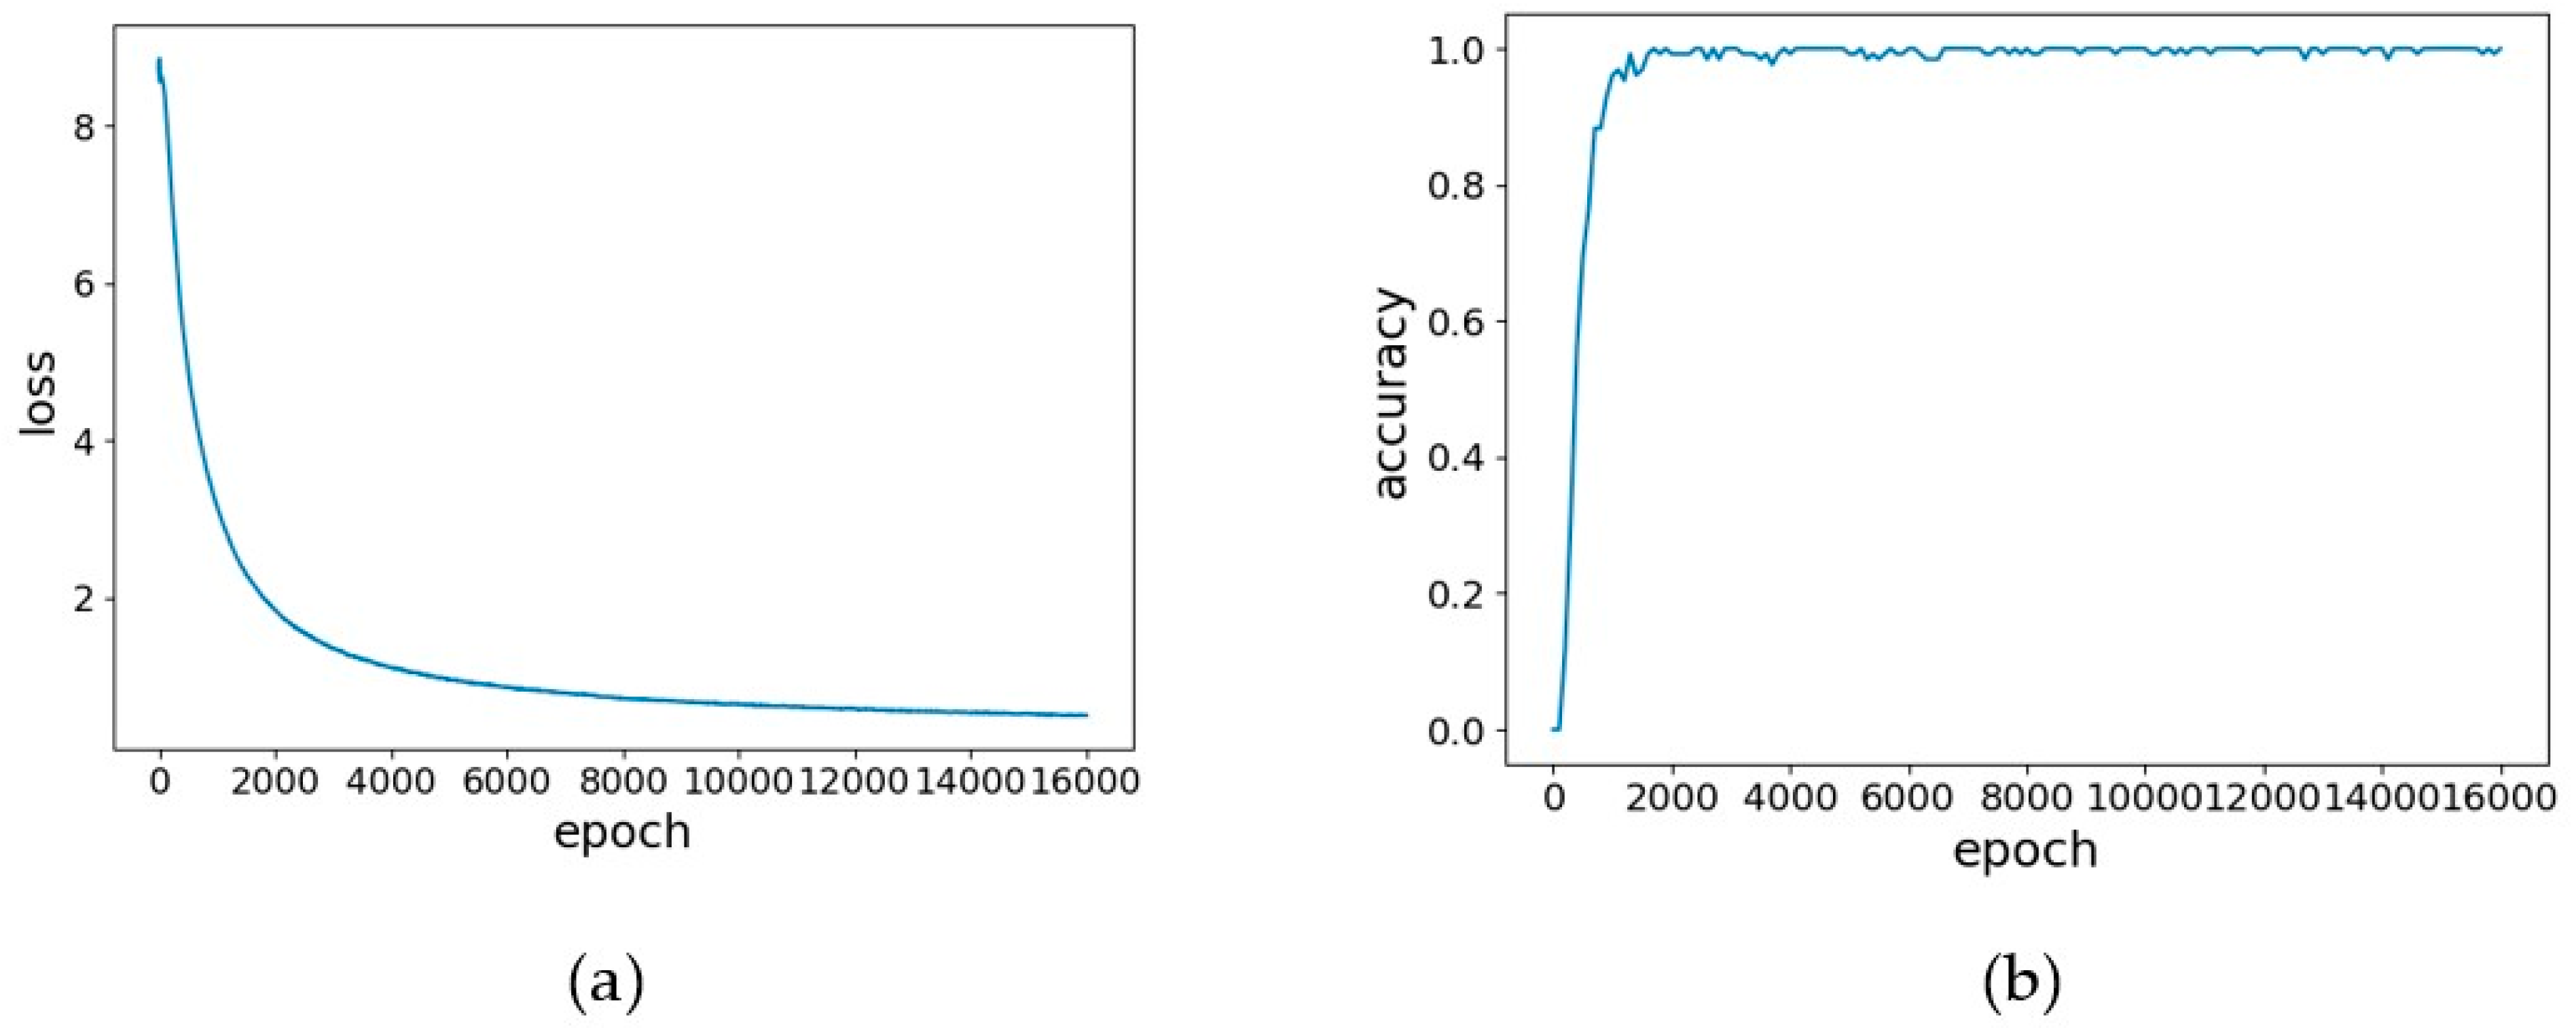
Theano, etc. To implement OCR, TensorFlow was used to train the model. A total of 16,000 training epochs were conducted on the training samples set by disrupting the order of the samples every epoch, and the accuracy of the model was tested based on the test set every 200 epochs. The final experimental results are shown in
Figure 7a,b, an epoch means that all training samples are trained once. With the increase of training epochs of the model, the loss value will decrease, and the recognition accuracy will increase to a relatively stable level (94.68%).
4.2.2. Stratigraphic Standardization
(1) Flow of stratigraphic standardization
There is a difficulty before the extracted data are stored in the database. Due to the numerous sources and irregularities of papery borehole data, there are many synonyms in the label and description of data. At the beginning, the words with similar semantics in the data should be processed and replaced with the synonyms recommended by the current standard. Meanwhile, for the different naming methods of different departments, the obtained borehole numbers are inconsistent. The boreholes need to be renumbered before storage. The process is as follows: (1) Get all strata in the borehole data and remove or merge the same semantic stratum. (2) Compare each stratum data with all stratum data, sort strata according to an algorithm, and make the overall sequence of strata conform to the objective law. (3) Process the sequence of strata, and renumber.
(2) Stratigraphic standardization based on machine learning
The standardization of strata is to unify the different names of the same stratum into the same name and classify the different strata. It is a great difficulty to classify the existing strata properly in an area. In the past, many scholars have classified the strata by machine learning. Zhao Lei used a support vector machine (SVM) to classify the stratum. This method can obtain the global optimal solution of data structure risk minimization even if the sample size is small, but the final training results are less accurate and cannot meet the needs of the automated process [
18]. The neural network for stratum classification is also a major trend. Currently, there is no mature network structure in this field. Traditional neural networks save incorrect training weights during the classification process and cannot obtain accurate results when the sample size is small. To classify strata, this paper proposes a flow that is about storing geological knowledge into the geological data corpus in advance, then the stratum classification is transformed into the text classification by machine learning.
The traditional processing mode of machine learning divides the collected sample data as a training set and tag data. However, there is no systematic standardized process as a guide on the tag data. This paper imports common geological nouns into the corpus as training samples in advance. By using the NLP method to re-classify the data in the borehole log, and then comparing it with the traditional machine learning method, so that more reliable results can be obtained.
At the current stage, the corpus in the field of geosciences has not yet been fully established. If a collection of scientific research, teaching materials, and standardized texts specifically for the field of geosciences can be gradually built, then it may generate a unified and optimized geoscience vocabulary based on mineral vocabulary [
19], which will not only improve the quality of machine learning label classification but also provide convenience for later research by other personnel.
After establishing a certain degree of geoscience corpus that can be used, BERT (bidirectional encoder representation from transformers), a new model built by Google, is used to combine text data in the field of geoscience and corpus, identify text labels in both directions, and fit geoscience data. Crossing the classification to the sentence level, even if the stratigraphic description of the borehole log is more complicated and verbose, the idea of multi-label text classification can still obtain better classification results [
20].
5. Integration of Geological Knowledge into the Modeling Process
The geological model is not to pursue a completely accurate response to the spatial data, but to reflect the actual geological conditions as much as possible on the basis of respecting the existing geological data. Therefore, a geological model that meets the requirements of the project should be established and is practically available. In other words, the 3D geological model is usually uncertain. From a mathematical point of view, random interpolation, stochastic simulation, and other techniques can be used to build a model with a high probability of correctness. However, in actual production, the data obtained by borehole sampling alone are not enough to support a reasonable 3D geological model. Due to the intricate geological conditions, people with practical geological knowledge can easily give a more reasonable explanation. If the 3D geological model is to be put into production and is accepted by the technicians who are engaged in geological exploration, it is more necessary to integrate geological knowledge. Therefore, this paper intends to use the auxiliary profile to integrate geological knowledge to 3D geological modeling, which makes the model more authentic.
After processing the borehole data, we imported it into the database to obtain the normative format, and then created profiles to assist in the stratum analysis. The created 3D geological model can clearly express borehole data, and the spatial relationship of the stratum can be obtained intuitively from it. However, in the engineering process, due to the complex geological conditions such as pinch-out and lens, it is still necessary to modify the stratum line of 2D profiles to assist in modeling. Therefore, this section mainly introduces the connection rules and processing methods of abnormal conditions.
In the case of pinch-out, if the stratum profile obtained by the interpolation algorithm is still problematic due to stratum break, the profile needs a professional to modify it manually. The traditional 2D profile is not intuitive enough. Based on the 3D geological model, an auxiliary profile is created, and geological knowledge can be integrated into it. The professional can intuitively edit and correct the auxiliary profile, and then synchronously feedback the corrected profile to the 3D model to reduce the workload.
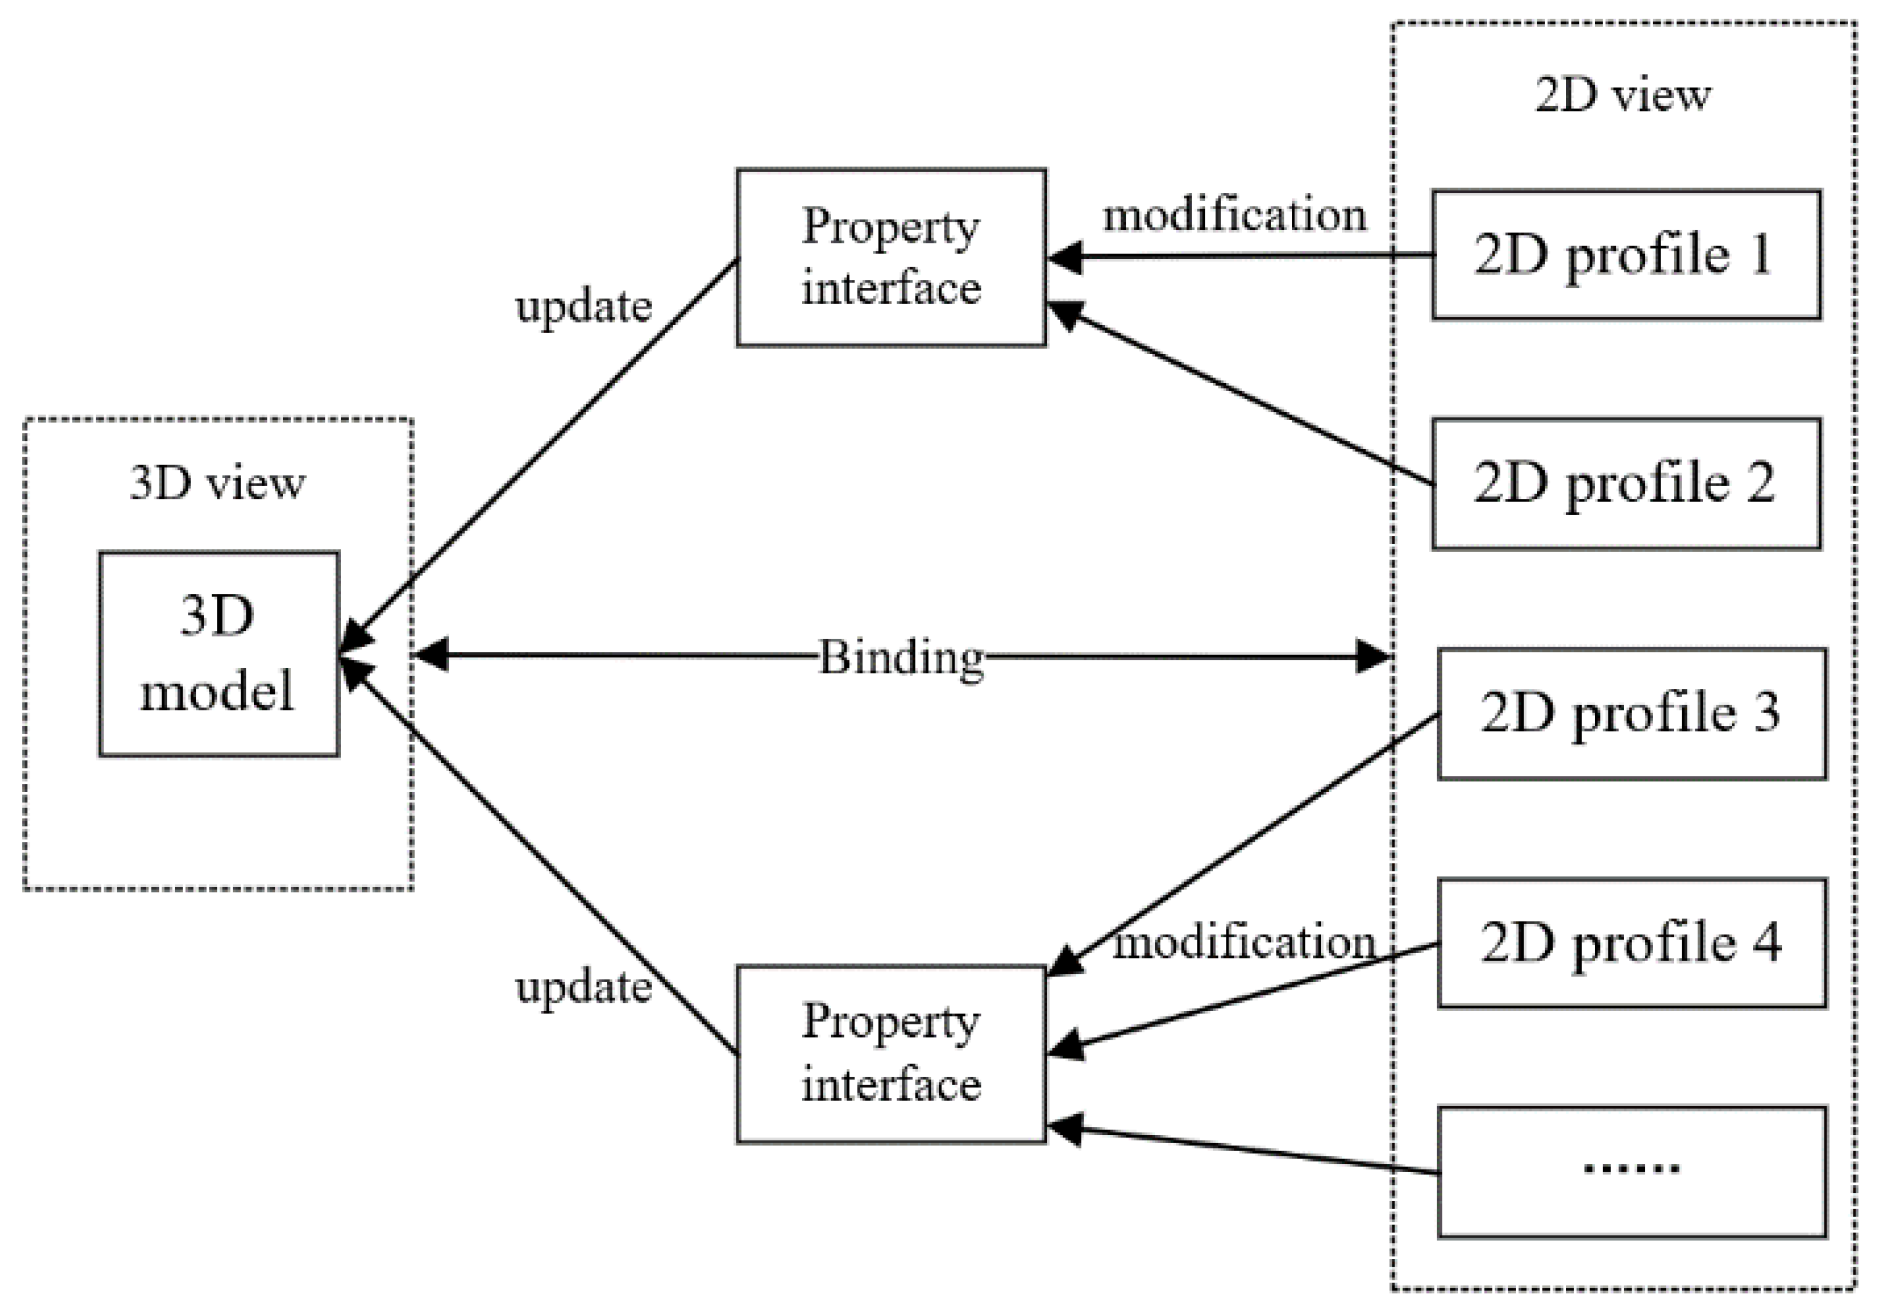
In actual 3D modeling work, researchers use 2D profiles only to analyze the internal structure of the 3D model and cannot synchronize the modifications of the 2D profiles to the 3D model. Therefore, this paper proposes a 3D model that is bound with the relevant 2D profiles and can be updated in real time. By this method as shown in
Figure 8, researchers can get profiles in any direction and check for problems. The final 3D model can be obtained and used in practice by iterative processing of anomalies. The combination can not only meet the use of traditional practitioners but also visually display the geological simulation and spatial form. Meanwhile, it can embed the property data of borehole into the model for an easy read.
5.1. Connection Rules
In the exploration profile, the complex geological conditions lead to the low accuracy of the automatically generated profile under a single parameter. To improve the situation of the profile, this paper determines the connection rules of strata through multiple parameters.
With the stratum, lithology, and borehole height from simplified semantics of the data in the database, we can obtain the primary and secondary features, attribute characteristics, and spatial distribution of different point clouds in the borehole data. Highlight repeating strata, missing strata, and anomalous points, which can be seen as a modeling basis for connection rules.
Generally, the actual number and order of stratum in the borehole data differ little from the normal stratum distribution situation in the overall range, so the stratigraphic sequence connection method is used to connect the strata. For the stratum with inconsistent stratigraphic order, it is judged as the pinch-out, lens, or faults by experience and existing geological maps. In the current intelligent processing flow, we focus more on the processing of pinch-out. Meanwhile, lens and faults are also processed as much as possible.
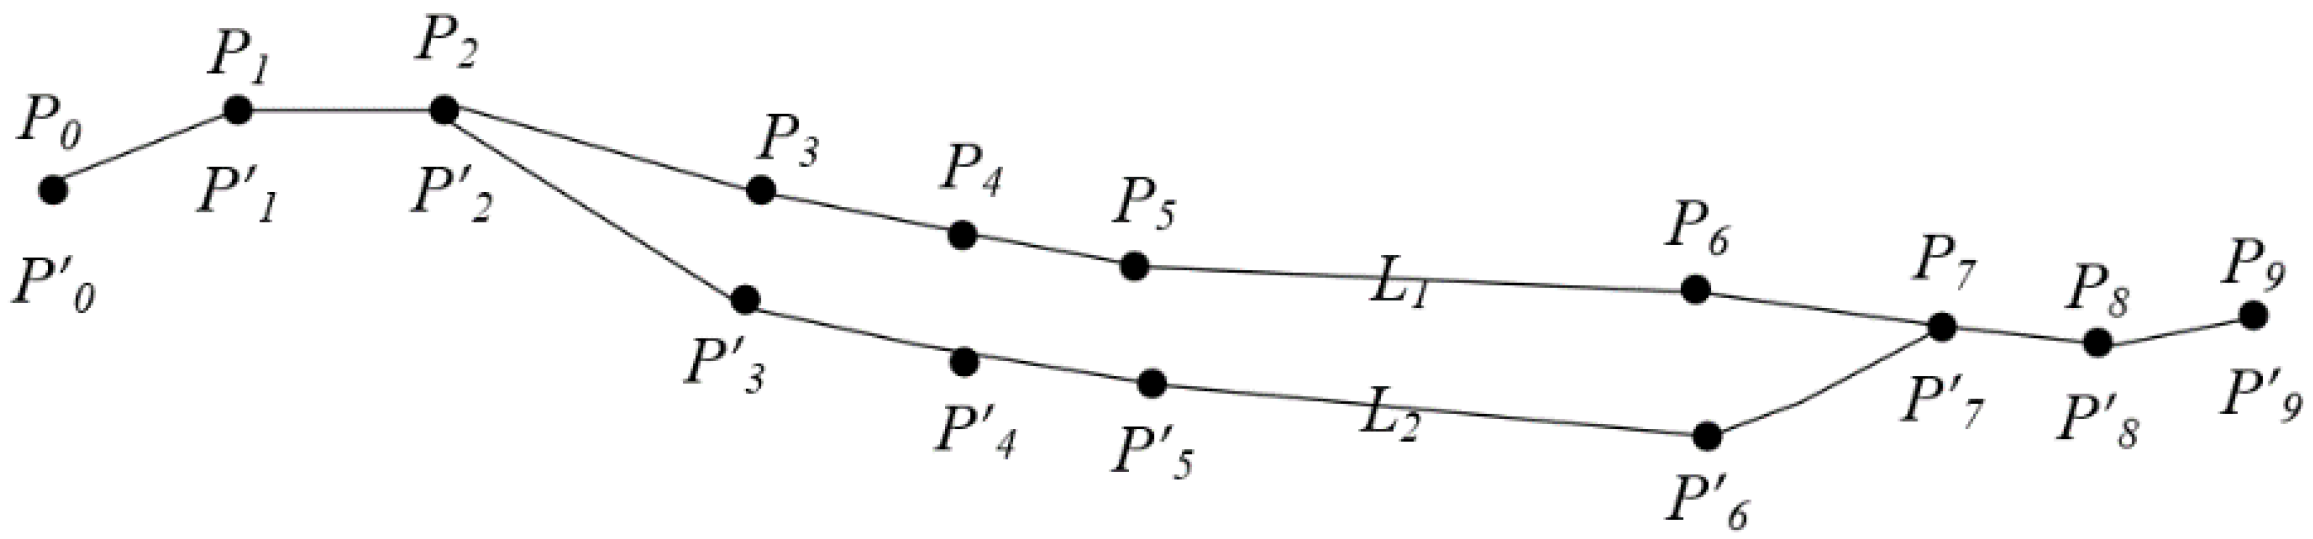
5.2. Processing of Pinch-Out
In the actual process, the thickness of the stratum varies, and there is a small part of the separate stratum at the local location, namely stratum pinch-out that is not conducive to determining the range of the corresponding stratum. The location of the pinch-out is often obtained by the researcher manually or by experience, but in the process of automation, it depends on the algorithm to achieve. In processing the pinch-out, the core rule is to determine whether the corresponding stratum of the anomalous borehole and adjacent borehole is a virtual stratum with a thickness of zero. If the strata at the anomalous local all are virtual strata, the local anomalous stratum is deleted.
Since it is not possible to generalize all geological conditions with borehole data, if there is only one anomalous borehole, it is considered that there is a corresponding stratum that can be generated by interpolating in the surrounding area. After processing the anomalous data, it can be combined according to the actual situation to realize the connection of the point cloud data in the geological profile.
For stratum pinch-out, according to the profile connection rule, calculate the length of the line connecting the intersecting strata, the length from the endpoint to the intersection point, the length of the profile line segment, and the length from the intersection point to the previous stratum in the stacking line graph. Virtual stratum point cloud data are generated by interpolation, they are connected and extended to non-current stratum termination.
Based on existing research results [
21], some regulations are made for determining the location of the pinch-out, as shown in Equation (1).
represents the thickness of stratum,
represents the distance between the current borehole and the adjacent borehole and
represents the distance between the stratum pinch-out control point and the current borehole. The position of the pinch-out control point is at
of the distance between the current borehole and adjacent borehole, where the thickness of the stratum is less than 2
. The position of the pinch-out control point is at
of the distance, where the thickness is between 2
and 5
. The position of the pinch-out control point is at
of the distance, where the thickness is between 5
and 8
. The position of the pinch-out control point is at
of the distance, where the thickness exceeds 8
.
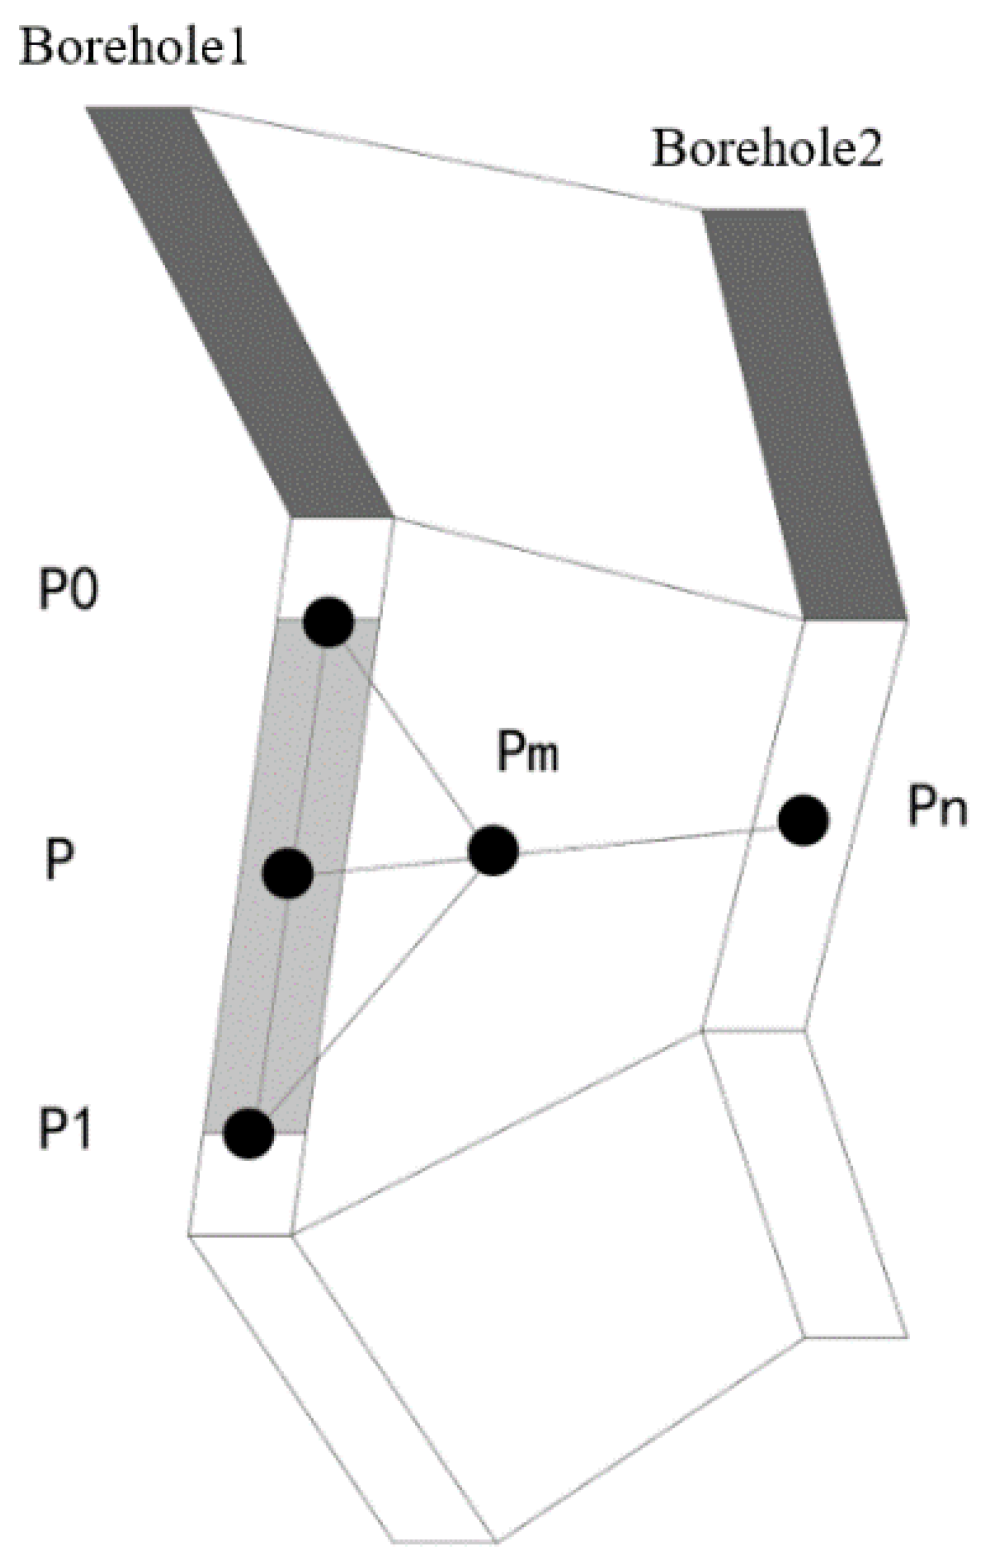
As shown in
Figure 9, it is assumed that borehole1 and borehole2 are two adjacent bores, each rectangle represents a different stratum.
is the separation point of each stratum. For example, if points
and
in the borehole1 have no corresponding stratum in the borehole2, there is a phenomenon of pinch-out. The point
is the midpoint of the points
and
, the point
is the midpoint of the adjacent stratum of the borehole2, and the pinch-out control point
is between the point
and the point
.
In the following formula,
is the spatial coordinate of the point
.
is the space coordinate of the point
, and
is the space coordinate of the point
. Finally, we can obtain the pinch-out control point
and corresponding data according to Equations (1) and (2).
Profiles can be generated automatically after calculation of most erroneous pinch-out, but a fraction of special point data for the corresponding profile cannot be obtained through the algorithm. Then they are transferred to a researcher with geological knowledge who will compare the profile data generated from the normal data with the 3D model to find the problems existing in the current data and model. The processing of pinch-out is a kind of interpolation logic under the mathematical model, but there are corresponding parameter weights in such a probability model. Although it can deal with most pinch-out phenomena, it may also cause overfitting or underfitting phenomenon. Only by effective use of indispensable manual behavior, modification of the special situation of the local profile, and reflection of it in the 3D model, it can really compensate for the loopholes in the interpolation algorithm that are deliberately ignored by people.
5.3. Processing of Lens
A variety of specific situations are encountered in the modeling process. Due to the uneven distribution of holes, it is sometimes difficult to distinguish between lens and pinch-out, and we will process lens like pinch-out. If an anomalous area is accurately judged to be lens based on the actual situation, we will process it according to the following rules. As shown in
Figure 10, when connecting the stratigraphic line of the lens, the top and bottom boundary lines need to be extended to the entire length of the stratigraphic line.
and
are the upper and lower boundaries, respectively.
overlap with
, representing the same points that cannot be omitted. Then, the upper and lower surfaces of the lens can be generated by interpolation, and the body of the lens can be obtained by surrounding surfaces. In addition, the entire form of the lens can be perfected by the later exclusion of zero thickness of the body.
5.4. Processing of Faults
The processing of faults requires the support of powerful algorithms and device performance, it is not perfect at present. We try to adopt the following method to deal with faults, which needs to be further improved in the future. The five-parameter data structure is used to define the fault, is the starting point coordinates of the fault, is the length of the fault, is the vertical break distance, is the angle of the fault, is the azimuth angle. Using the surface-fitting method for stratigraphic movement trends, unbroken stratigraphic data is first generated, and then the stratigraphic property is adjusted according to the fault plane and to generate stratigraphic data containing fault information.
6. Application
Taking the old geological data of Xinyang City as input data, we used the data processing flow of urban 3D geological modeling based on papery borehole data proposed in this paper. The final urban geological model was built in the 3D geological visualization software platform QuantyView, and good results have been achieved in the actual use of the project.
6.1. QuantyView
QuantyView is a 3D visualization geological information system platform with complete independent copyright developed by Wuhan Institute of Geographic Information, China University of Geosciences. QuantyView consists of QuantyView2D and QuantyView3D, which can be used in combination to process 3D geological models and 2D profile models simultaneously [
22,
23,
24,
25].
6.2. Introduction of Used Data
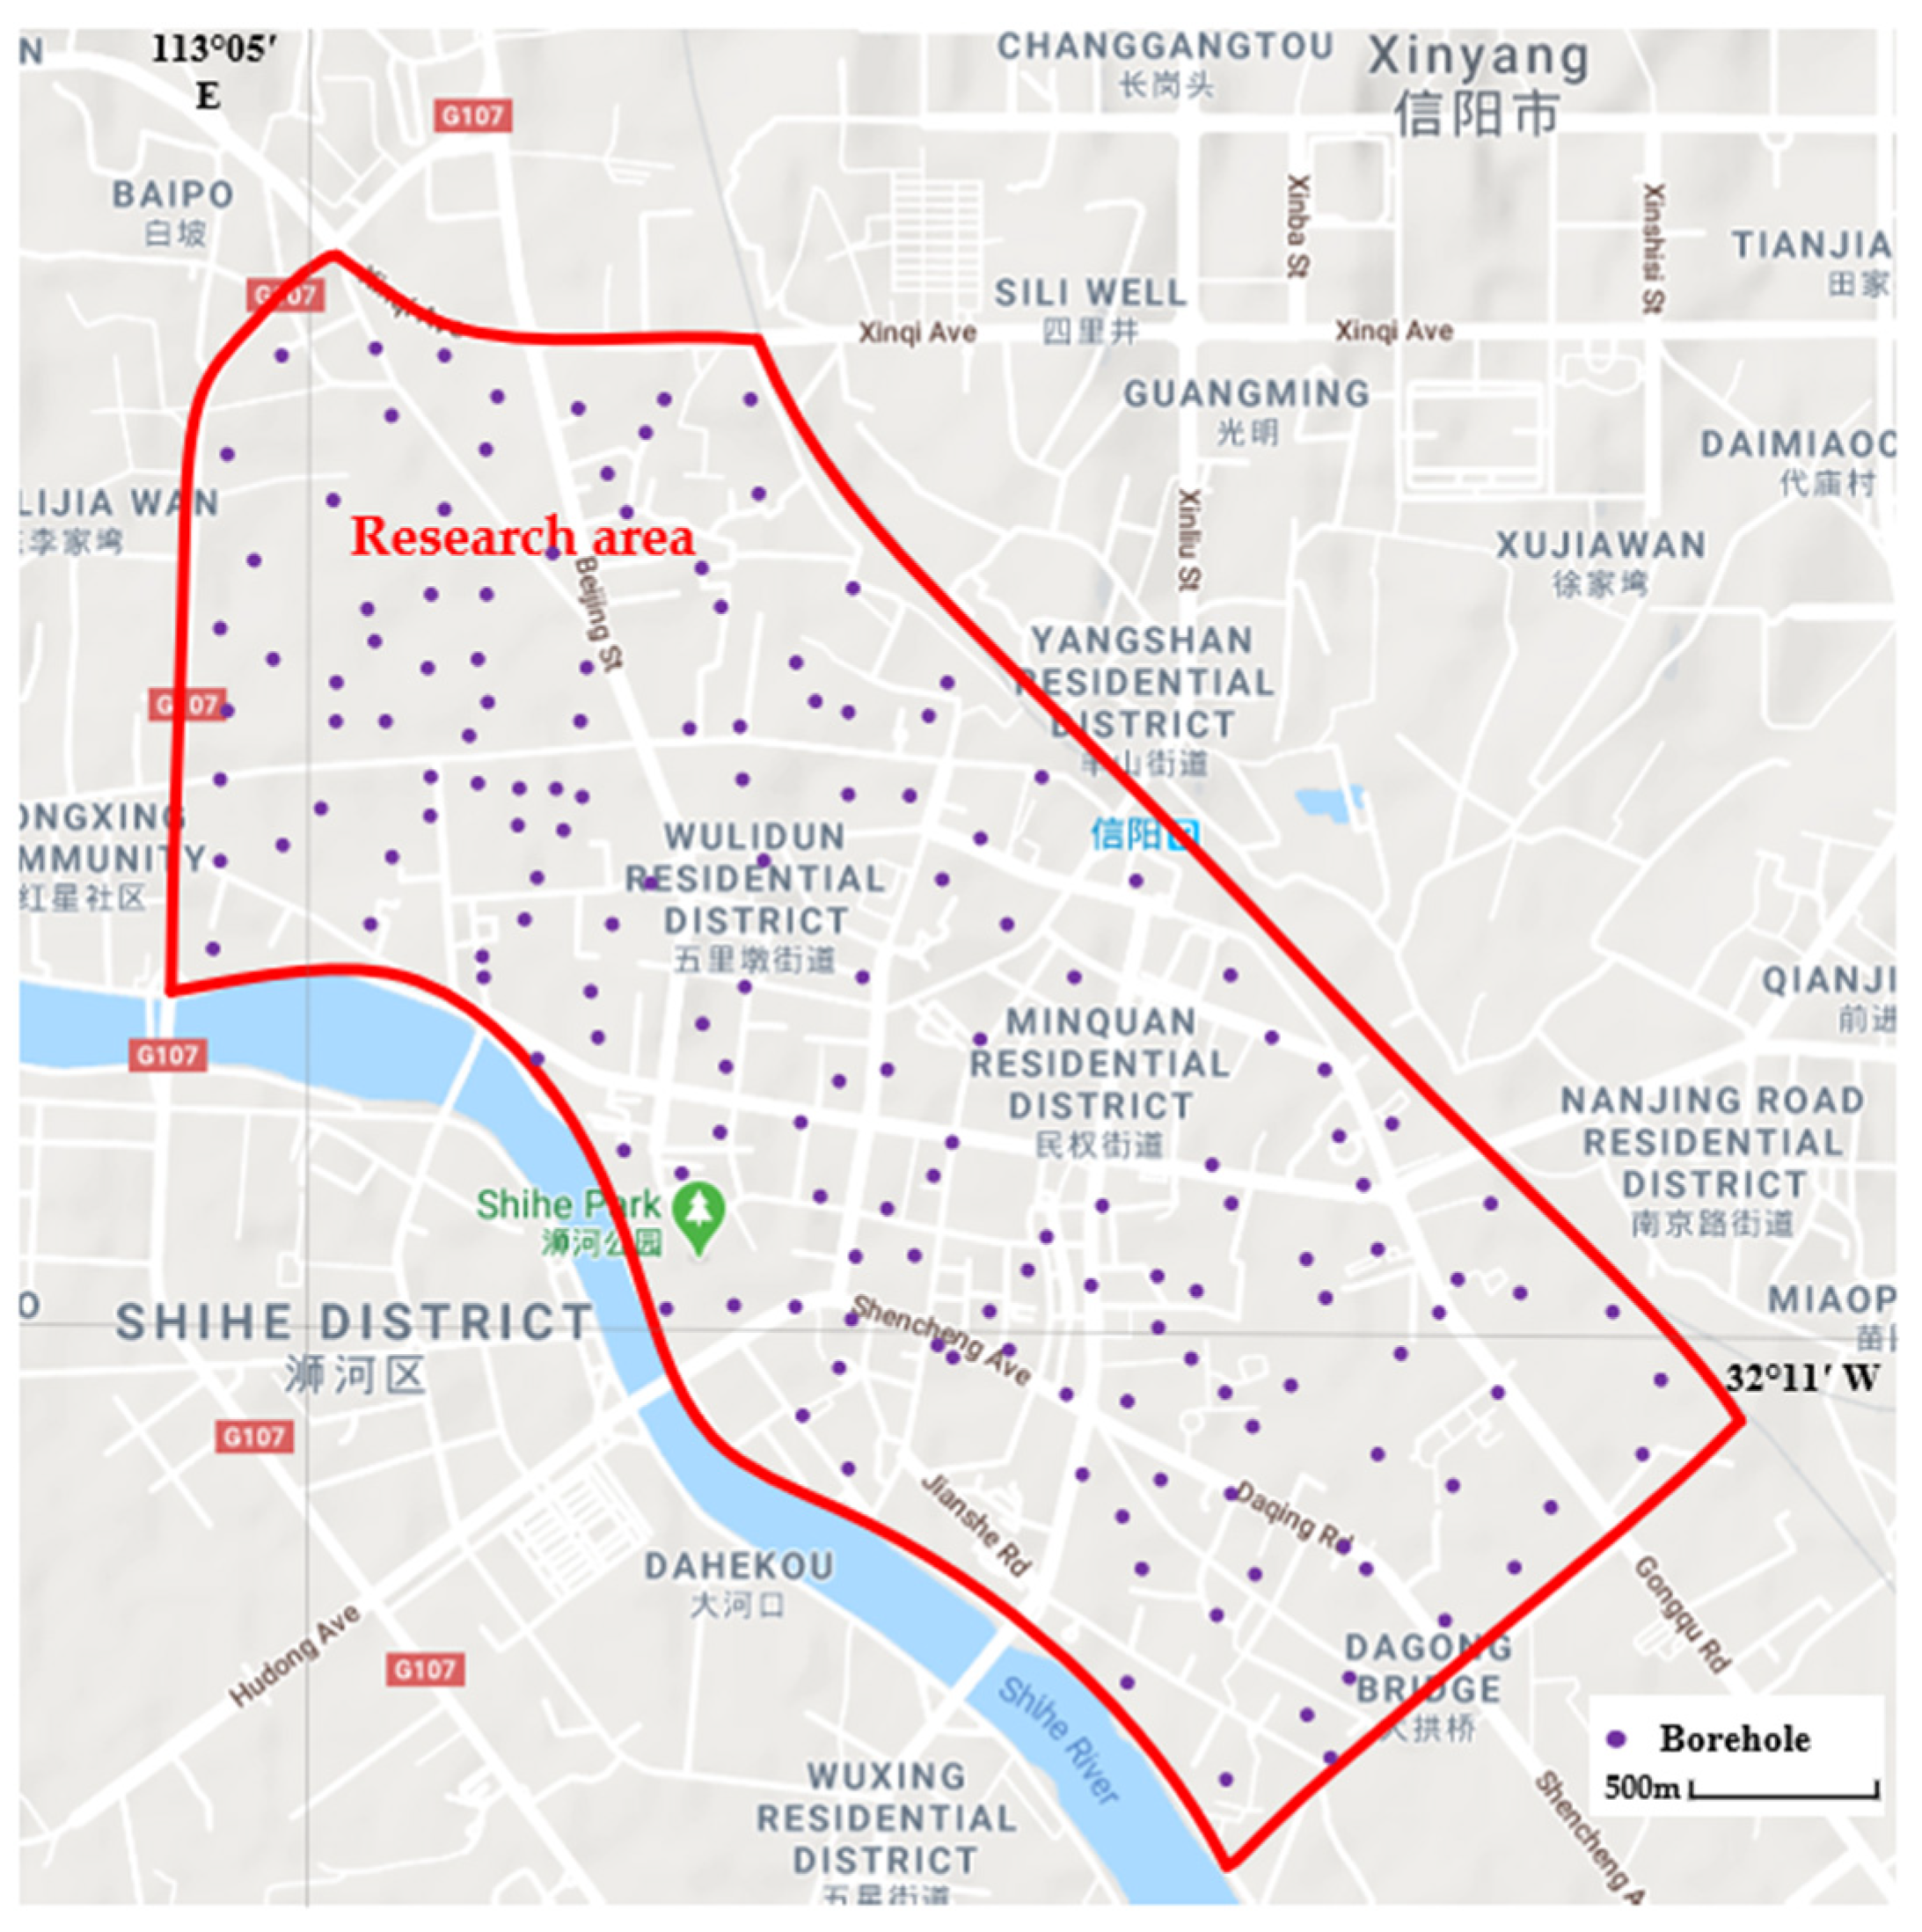
As shown in
Figure 11, the research area is located in the old town of Shihe District, Xinyang City, with administrative, cultural, educational, commercial, and residential integrations. It is a relatively prosperous area. The key research area starts from Jigongshan Street in the west, Xinqi Avenue in the north, Beijing-Guangzhou Railway and Dagongqiao Road in the north, east and south, and the south and west ends in the North shore of the Shihe River.
This paper conducted experimental investigations in this area by engineering geological survey data and geophysical survey data. Although the geological survey and scientific research of the Xinyang area started earlier, the basic investigation and survey work around urban construction was basically based on the work since the reform and opening. This stage of specialized geological work provides large amounts of geological data for urban planning and construction of Xinyang City. There are several military reserves in the Xinyang map, so the data are missing in certain areas.
In the existing data, there are copious data in different formats explored by different departments, and there are also problems that many paper documents need to be manually entered. Therefore, the standardization of urban geological data and the integration of multi-source data are the current data processing difficulties, which was also the original intention of this paper to propose a three-dimensional urban geological modeling process based on papery borehole logs.
6.3. Specific Implementation Process
6.3.1. Processing Flow of Papery Borehole Data
There are abounding papery borehole data in the project. For the borehole log collected by different departments, the identification processing under different templates was performed. After the log was grayed out, a Hough transform was used to identify the table network, the table corners were extracted, the divided cells were obtained and the content of the cell was identified, as shown in
Figure 12. When the trained model reached a certain degree of accuracy, the borehole data was standardized and stored into the database separately, according to the “DD2015-04 Urban Geological Survey Database Structure Specification”.
6.3.2. Modeling Flow
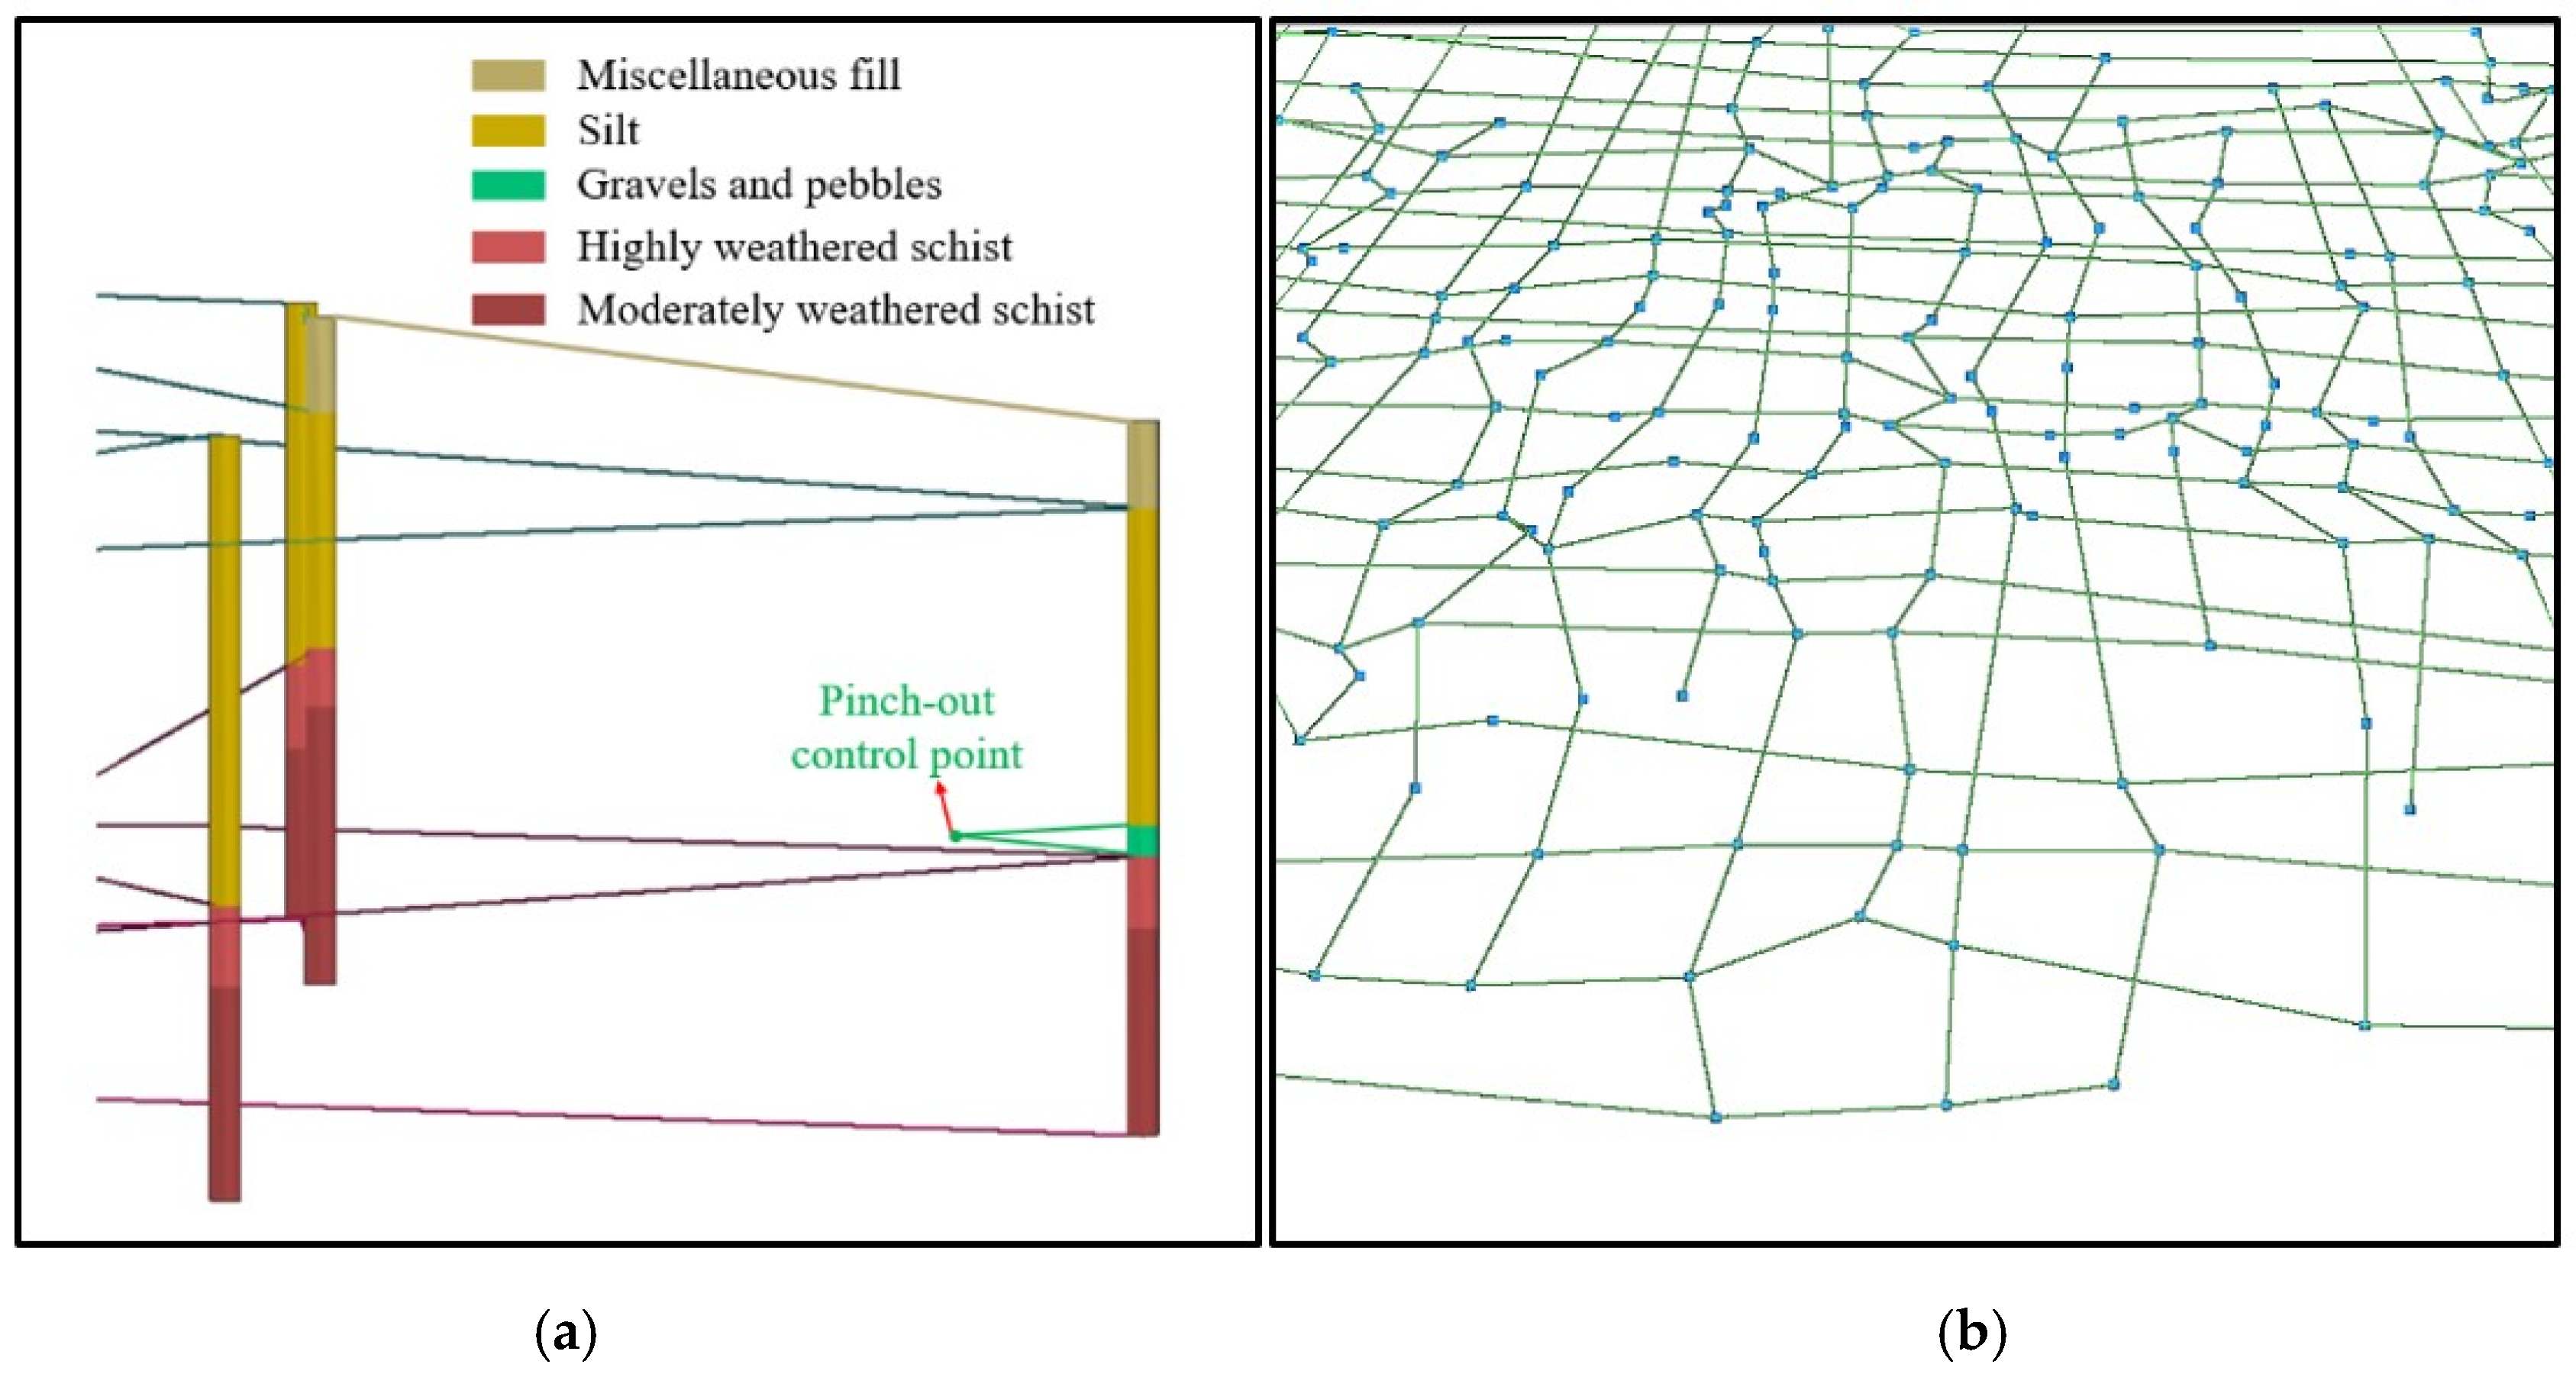
After the borehole data was loaded from the database, point cloud data at different locations in the same stratum could be obtained, which were connected into a line. As shown in
Figure 13a, there is green color (gravels and pebbles) in the right borehole, representing the pinch-out. The position of control point is at
as the thickness is less than 2
. As shown in
Figure 13b, the spatial connection of point cloud data in the same stratum can be interpolated to generate different strata.
The same strata in different boreholes were connected to form a regional complete stratum. The profiles of the model could be easily obtained at a given location. As shown in
Figure 14, catering to the research needs of different positions. The profiles of the corresponding positions were intercepted, intelligently processed, or manually modified according to the actual situation, and the three-dimensional model was iteratively updated. After confirming that there were no other problems, the required 3D geological body under the scope of the study was obtained by shearing.
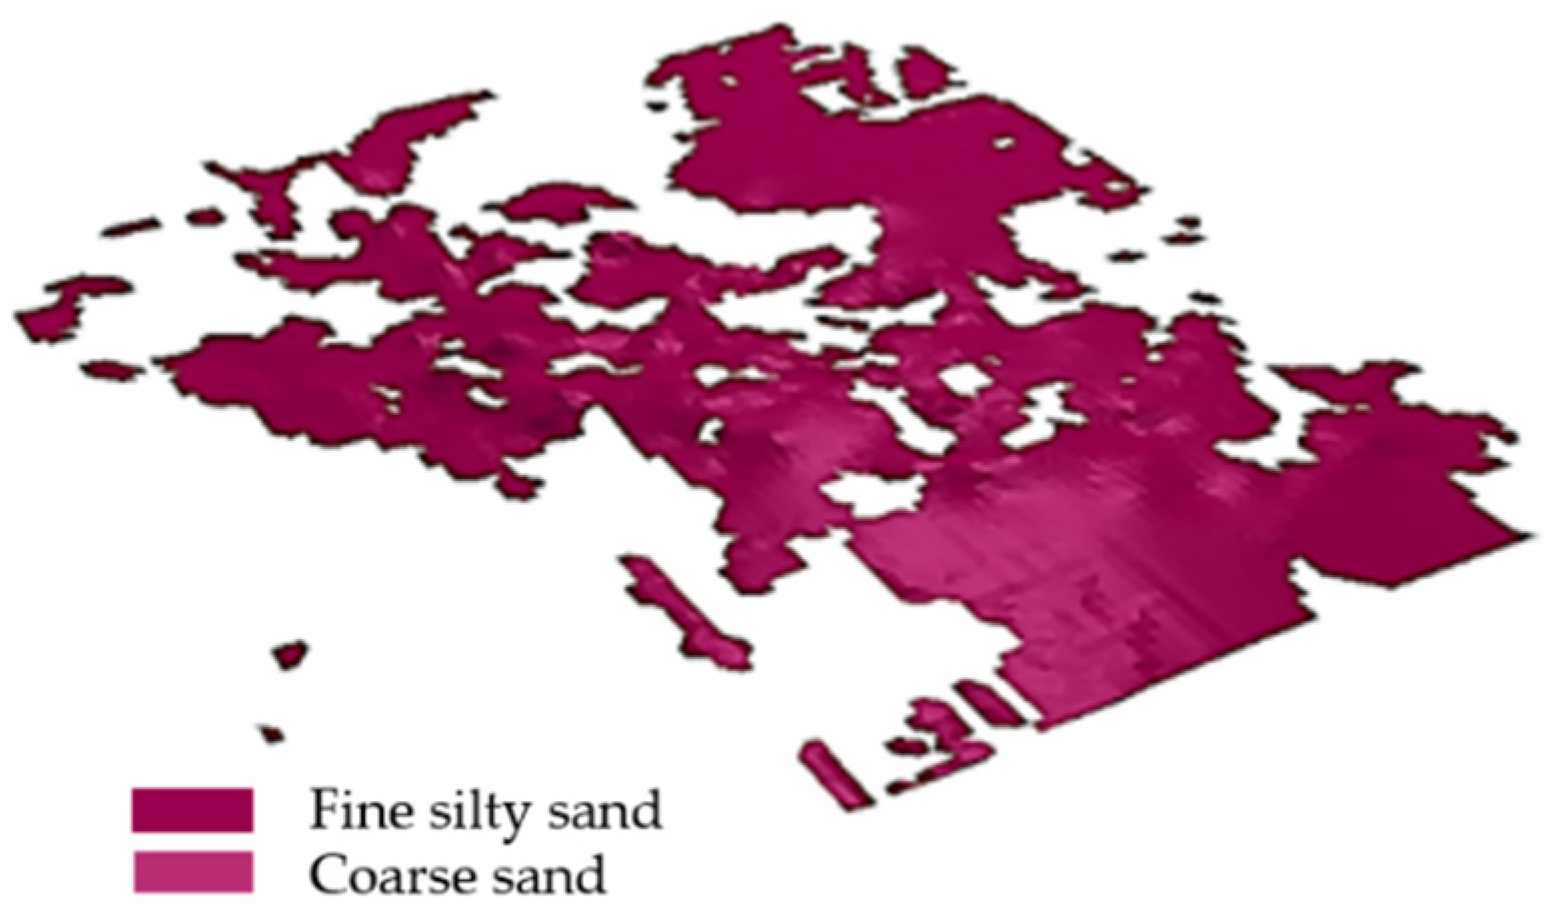
In adjacent strata, there was often a stratum with a thickness of zero at the pinch-out. This stratum existed in the form of a patch, which had no meaning for the expression and storage of the model and needs to be processed. The Boolean operation between the grids was performed by the topological relationship of adjacent strata, and the repeated patches between the grids were deleted to obtain a new 3D geological body, which could be used to better store and display models. As shown in
Figure 15, the phenomenon that the thickness of the overlapped stratum was 0 that occurred when the coarse sand stratum and the fine silt stratum overlapped. After the Boolean operation, a separate stratum could be obtained. The description of the stratum was clear, and the data amount was reduced.
Obtaining the administrative boundaries or specific range boundaries required for the geological body, the range of the generated geological body can be cut, and the sparse data outside the boundary can be omitted. In the actual process, the boundary line was extruded into a surface to obtain a vertical boundary surface of the Z-axis. Performing the Boolean operation on a geologic body that has been generated, a three-dimensional geological body of the desired range can be obtained.
A three-dimensional geological model was obtained from the borehole data, and then the new profiles could be drawn as needed. On the one hand, the space model and the cross-section of the profile was obtained, such as the stratum line, the intersection of the exploration line. On the other hand, using the symbol library resources required in the project, the pattern was filled at different strata in the profile to ensure the consistency of the 2D profiles and the 3D model, so that the drawn 2D profiles could be used in actual research work.
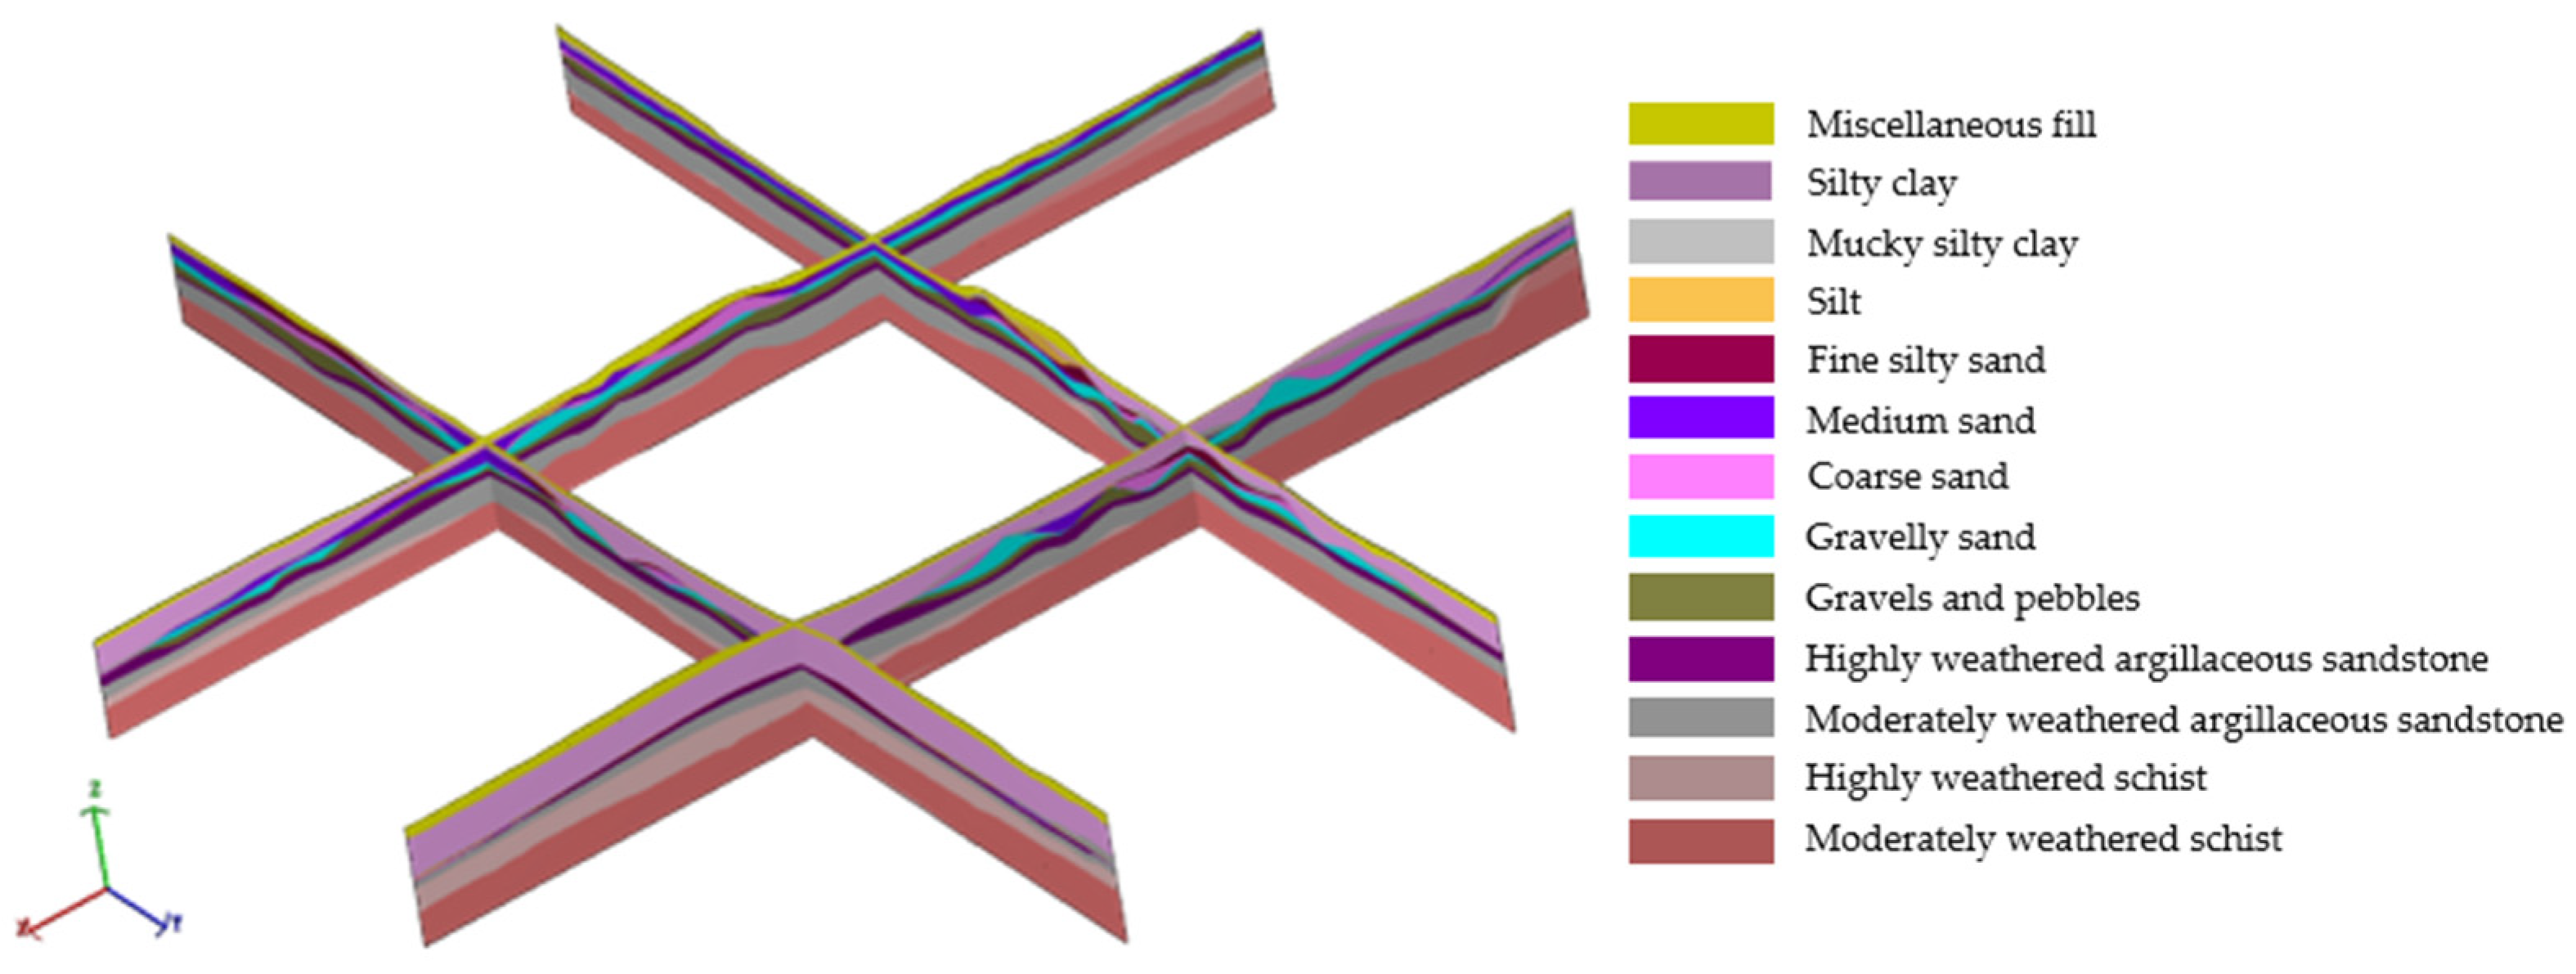
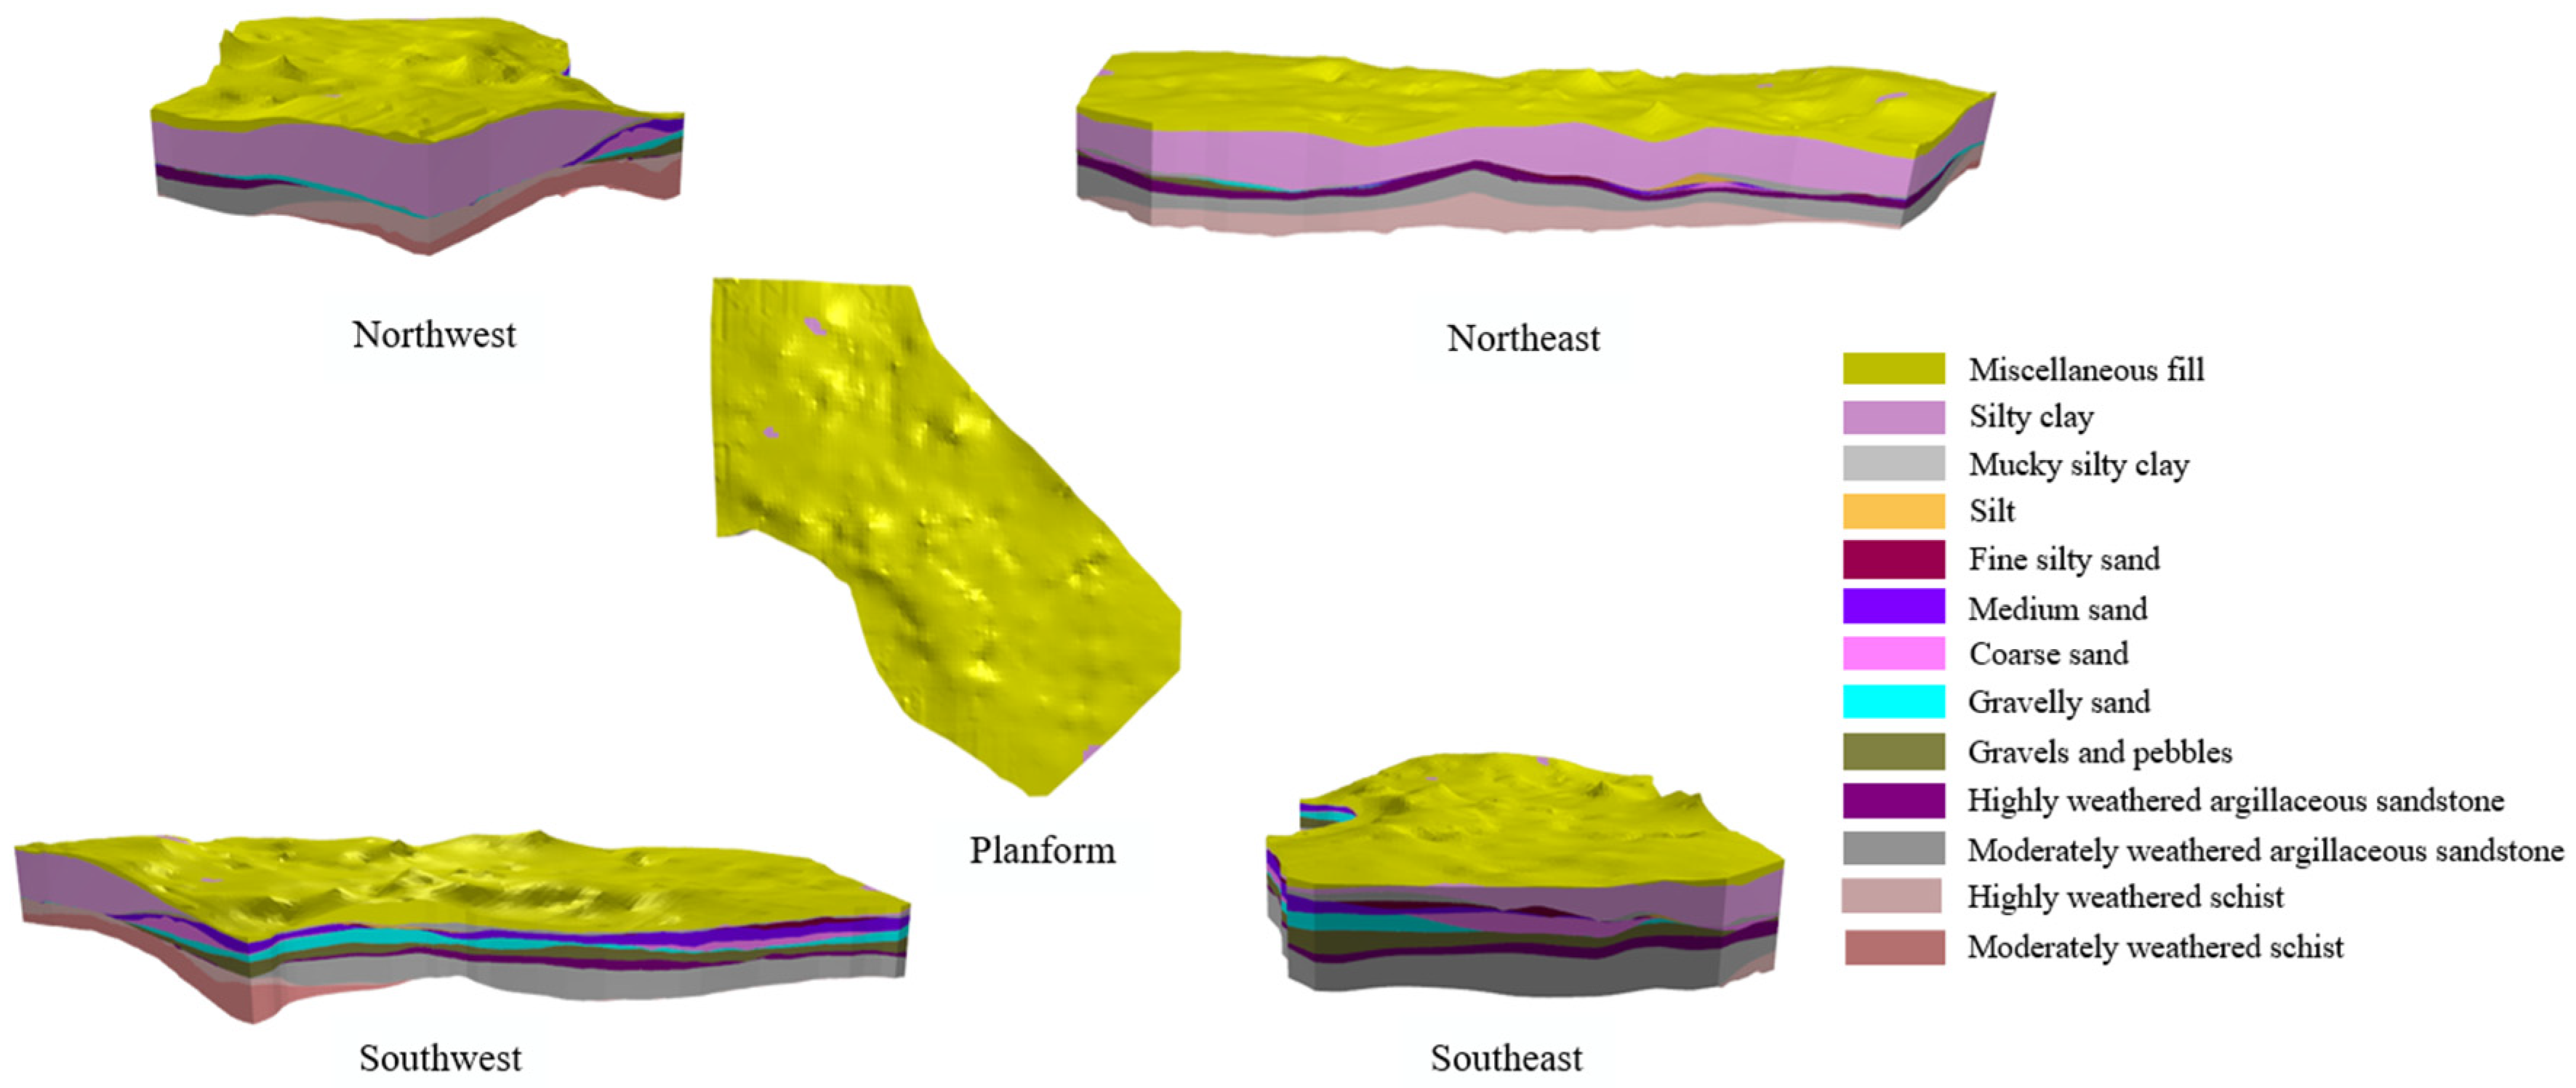
The processing method proposed by this paper for urban geological 3D modeling based on papery borehole data, with the adaptive acquisition of geological old data, parameterization of geological borehole log template, combined with recognition technology and 3D visual profile synchronization technology, can be applied to efficient 3D geological modeling of the city. The final model (double stretch in the
Z-axis) in
Figure 16 was generated.
7. Discussion and Conclusions
This paper mainly introduces intelligent preprocessing of papery borehole data, automatic extraction and standardization of borehole information, and a certain degree of editing and adjustment of the profiles. The whole process improves the shortcomings of data loss, data confusion and data distortion in the traditional geological model processing, makes the creation of the whole 3D geological model more intelligent and automatic, reduces the mistakes caused by manual processing, improves the efficiency and accuracy of the overall process, and facilitates the researchers to take corresponding measures to make scientific and rational decisions.
However, there are many details that need to be improved. On the one hand, in the process of semantic processing of data labels and integration of geological knowledge to assist in modeling, there are some problems such as low specific recognition rate of geological symbols, and the need for professionals to guide in complex strata. On the other hand, the research area selected in this paper is the main urban area of Xinyang City, which does not contain a large number of faults, landslides, karstification. Another more complex urban geological model needs to be built to further validate the method proposed by this paper. Therefore, we will continue to improve on these shortcomings in future work.

 ,
, 